Proceeding Paper

Environmental Justice and Green Spaces in Ibadan Metropolis, Nigeria: Implications on Sustainable Development in Urban Construction †

by
Abiodun Ayooluwa Areola
Department of Geography, University of Ibadan, Ibadan 200132, Nigeria
Presented at the ICSD 2021: 9th International Conference on Sustainable Development, Virtual, 20–21 September 2021.
Environ. Sci. Proc. 2022, 15(1), 57; https://doi.org/10.3390/environsciproc2022015057
Published: 24 May 2022
(This article belongs to the Proceedings of The 9th International Conference on Sustainable Development)

Abstract

:
Environmental justice (EJ) in urban construction is lacking, and it is a major concern towards achiving some of the sustainable development goals (SDGs). It is the fair treatment and meaningful involvement of all people regardless of race, sex, national origin, or income with respect to the development, implementation and enforcement of environmental laws and policies. This study employs the concept of EJ in explaining the fairness in the distribution of green spaces (GS) with regard to urban construction in Ibadan metropolis, Nigeria. The study revealed that GS distribution is more a function of the pattern of unplanned and uncontrolled physical developments than of a deliberate effort by the people or government to maintain the GS.

1. Introduction

Construction and real estate have been central to the debates on sustainable development. The improvement of the green space system can reduce the negative impact of urban construction on natural ecosystems, and improve the living standard of urban residents. Urban green areas therefore consist of open spaces, generally covered with natural or planted vegetation [1]. Urban green spaces (UGS) can be of many shapes, forms, functions, and purposes. They can vary from a simple playing field to a natural landscape or highly maintained environment to which the public are mostly granted open access, although some may be privately owned. The most famous UGS are the amenity green spaces, having a high quality of landscape design and maintenance. Urbanization has enormous impact on green spaces, and it is not surprising that studies of different aspects of urban green spaces are gaining momentum among urban researchers [2]. In Africa, the situation is worse. Studies in several African countries revealed that there is intense pressure on green spaces for different human activities especially urban construction resulting in persistent deterioration of these spaces [3]. At the moment, the rapid depletion of green spaces in Africa has resulted in green spaces occupying a very small proportion of the total land space of many urban areas. For example, several towns in the Republic of South Africa have less than 10 percent of their total lands occupied by green spaces [4].
Furthermore, studies have considered the role of social ecology of a city in explaining the processes that lead to greening or de-greening bearing in mind that human beings play a major role in shaping the natural environment. However, only a few studies have addressed the impact of green space distribution on human groups in relation to the concept of environmental justice (i.e., the fair distribution of environmental burdens and benefits) since green spaces are not supposed to be restricted to one part of a geographical space [5,6]. The pertinent question is who then are the disadvantaged population in terms of green space distribution in urban construction? These are among the issues that this research seeks to address.
The conceptual contribution of environmental justice in green spaces studies have been addressed by different authors and have been summarized in Table 1 below.
The aim of this study therefore is to investigate the major socioeconomic characteristics of the communities in Ibadan metropolis that explain the disparities in the spatial distribution of green spaces in the context of environmental justice and assess the implications on sustainable development in urban construction. The major research questions of the study are:
  • Who are the disadvantaged population?
  • What is the role of the government in ensuring environmental justice of green spaces?
  • How does the existing distribution affect sustainable development in urban construction?

2. Methods and Materials

2.1. Research Design and Sampling Technique

Ibadan metropolis is located in south-western Nigeria, 128 km inland northeast of Lagos and 530 km southwest of Abuja, the federal capital and lies between longitude 3°54′ East of the Greenwich meridian and 7°32′ North of the equator. This study involved measuring and mapping of green space distribution. A high-resolution satellite image (SPOT) of Ibadan for the year 2015 was purchased from glovis.com to extract and measure the green spaces. The distribution of the various human groups (socio economic characteristics) within the study area was also mapped. The community map of Ibadan metropolis (Figure 1) was used as base map and data and information were collected on the basis of the 104 communities or communal areas identified in the metropolis.

2.2. Indicators for Assessing Environmental Justice (EJ)

Indicators for assessing environmental justice were derived from data and information collected through the administration of structured questionnaire and Focus Group Discussion (FGD) based on the community map of Ibadan metropolis. Section A of the structured questionnaire addressed the ten individual variables. The individual variables were selected based on what is applicable and available in the Nigeria context. The ten indicators included gender, age, education, occupation, income, ethnicity, religion, housing type, housing structure; wall materials and roofing materials. Each indicator consists of more than two variables ×1, ×2, ×3…). On the other hand, section B and C of the structured questionnaire addressed the perceived component and were analysed using descriptive method of explanation (percentages). Copies of the questionnaire were distributed by adopting a stratified random sampling technique in which Ibadan metropolis was divided based on population density using four sample percentages (0.1%, 0.2%, 0.4% and 0.8%). The total projected population for 2015 was estimated at 1,783,367 and the total number of people to be surveyed was estimated at 3410 that were selected at regular intervals. Twenty—one groups emerged for the FGD by considering the proximity/distance of localities from one another. The target audience was the elders who had information about the oral history of their communities.

2.3. Analytical Tools for Assessing Environmental Justice

Three main methods of analysis were applied to achieve this goal, namely, (i) principal component analysis (PCA), component scores (the new given principal components/factors) were mapped to show the spatial variations of human dimenssion in the context of environmental justice of green spaces, and (ii) ordinary least square were used to identify the significant indicators; (iii) the geographically weighted regression analysis package of ArcGIS software was used to visually identify the socio-economic indicators of the environmental justice of green space. The input variables for the GWR therefore included “green space in sqm2 for 2015, and the socio- economic parameters”.

3. Results

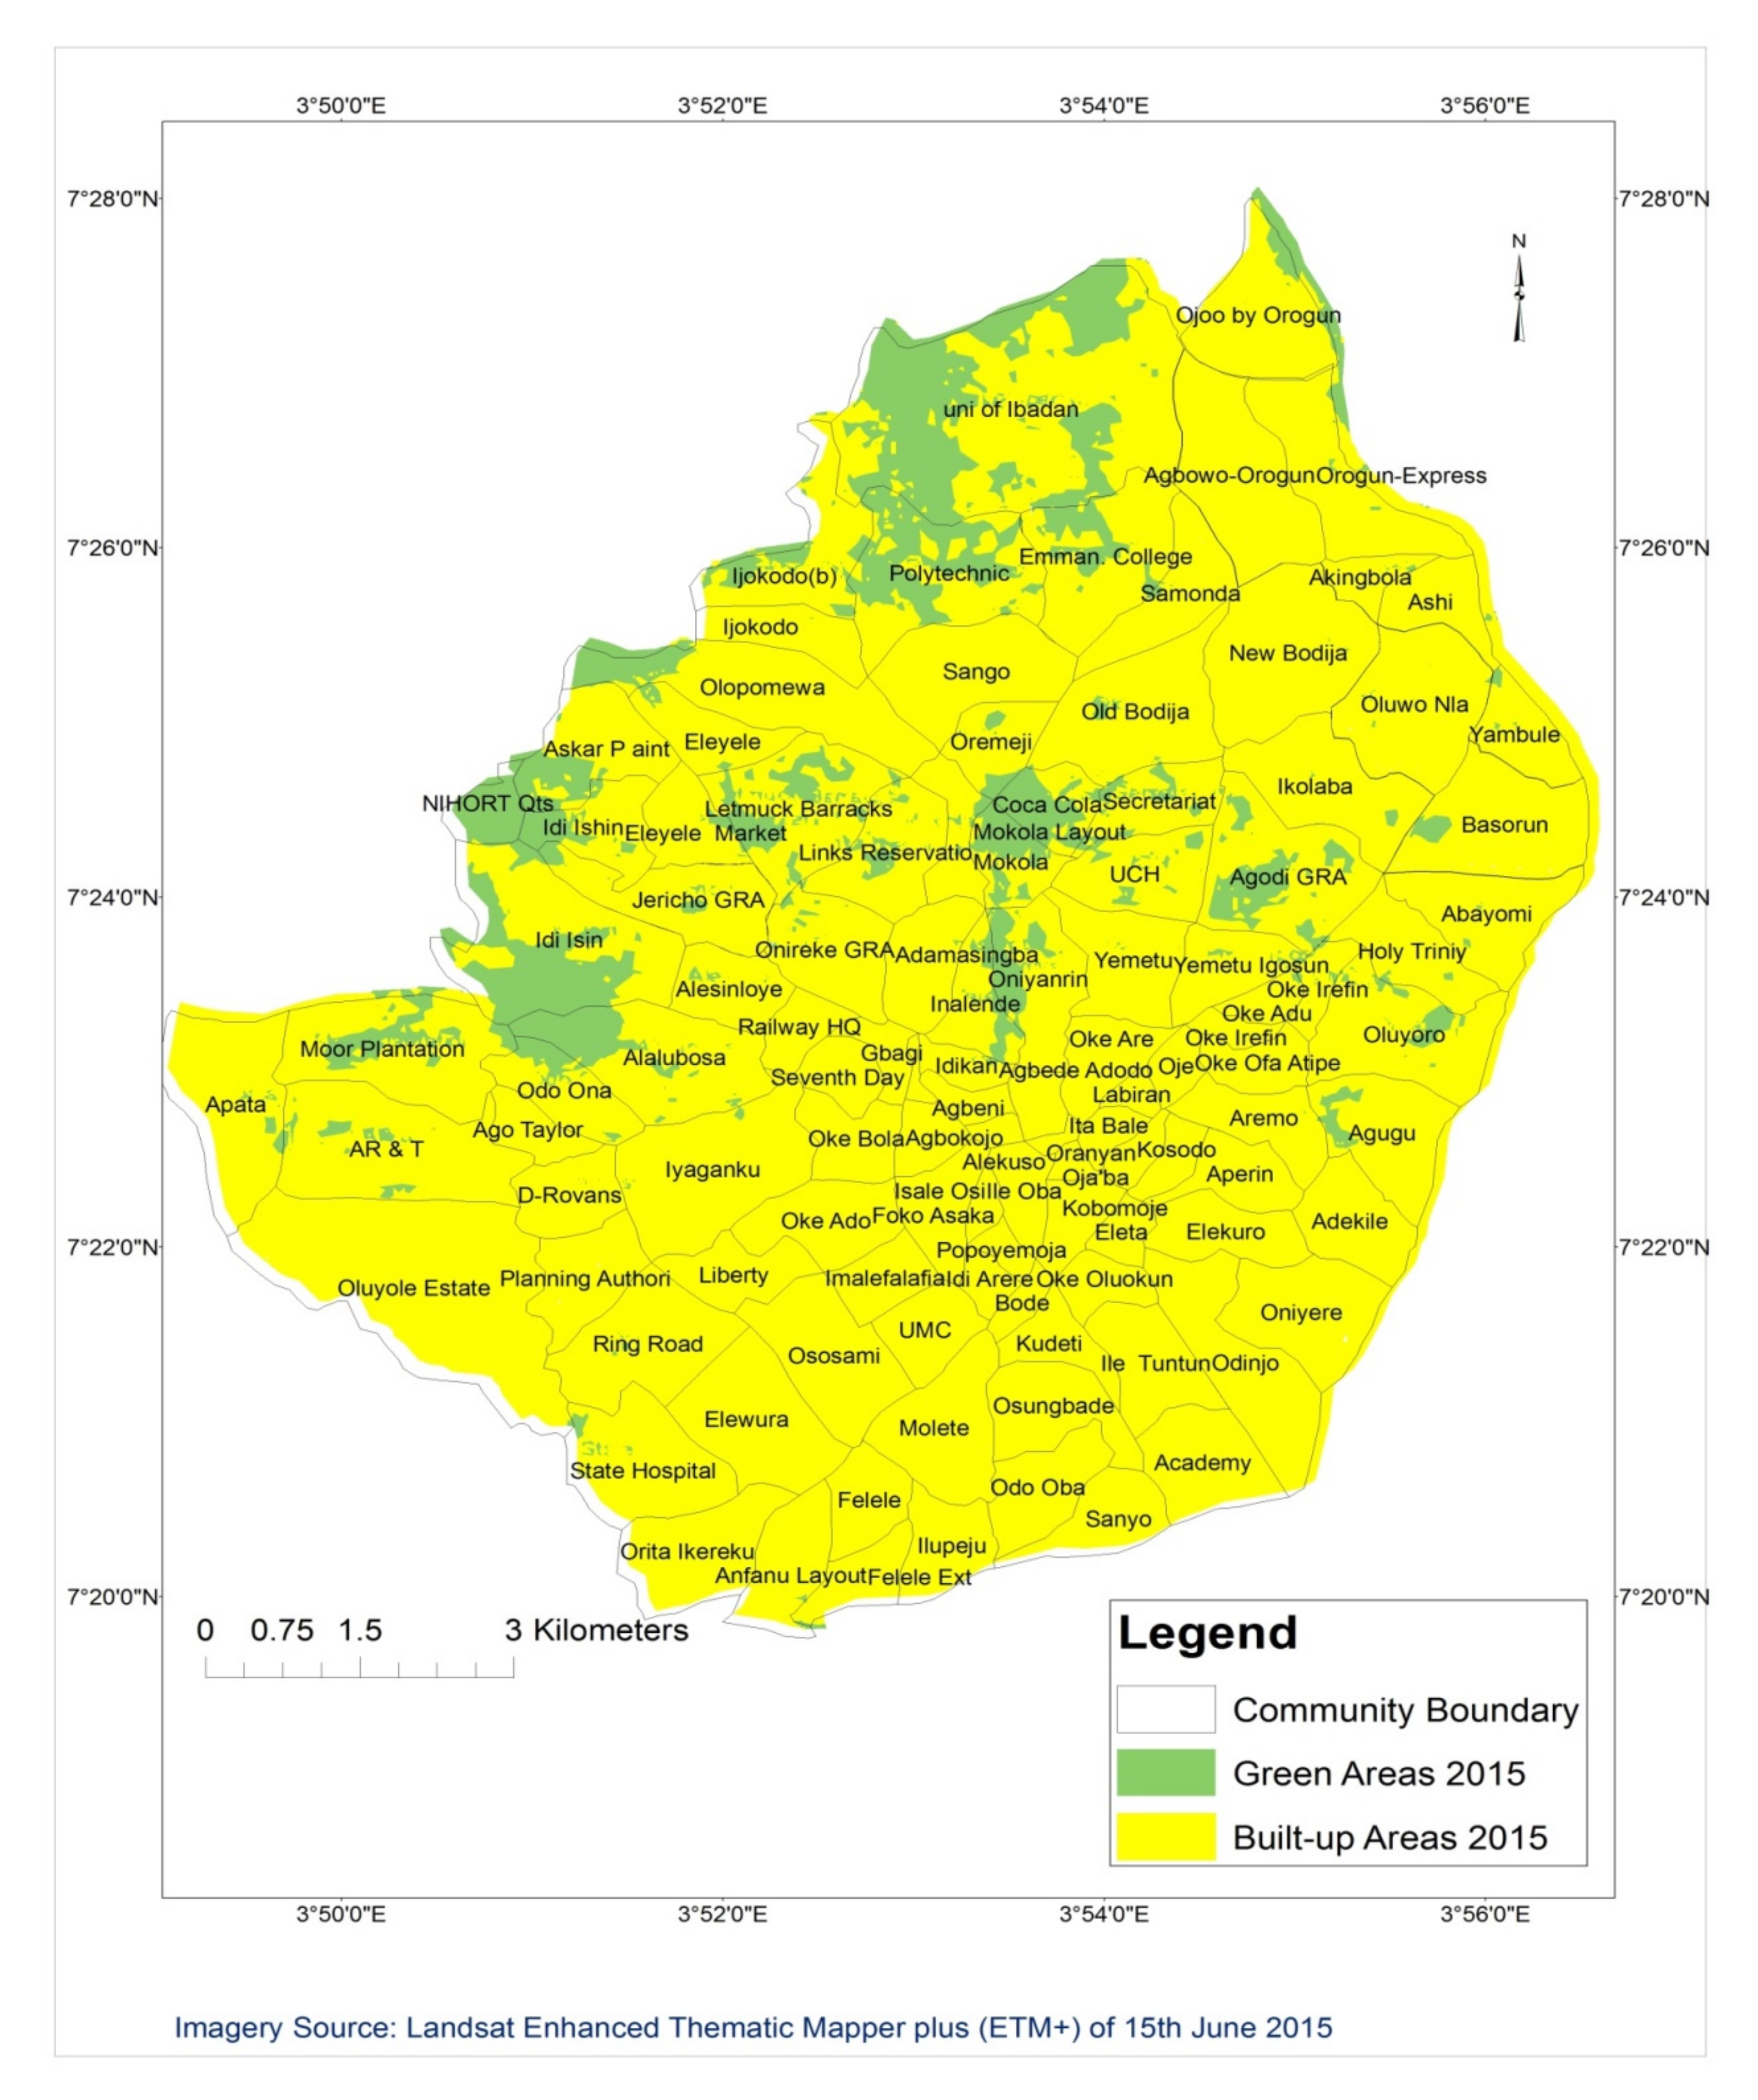
3.1. Pattern of Green Spaces in 2015 (Indicating the Extent of Disadvantaged Communities)

Figure 2 shows that green spaces remained sparsely distributed for 2015, whereas areas with large volumes of green spaces were still linked with government reserved areas (GRA). However, significantly, some new areas emerged with small pockets of green space that were not there before. From the FGD conducted in these communities, it is clear that the metropolis is now congested, and green spaces are found in fenced areas, in compounds and in the interior parts of the communities which are not suitable for construction. From the green space measurement carried out the majority of the communities now have green spaces within the range 10,000 m2 to 100,000 m2 (1–10 ha). In other words, small sized green spaces now predominate in the metropolis. However, some communities are more at disadvantaged than others as shown in Figure 2. The variation palette in Figure 2a–e shows that the dark colour communities represent areas that are most at disadvantaged compared to the relatively light colour communities. Interestingly, the main factor responsible was urbanization characterized by the construction of residential, commercial and industrial buildings, roads and other social infrastructures.

3.2. Environmental Justice Assessment

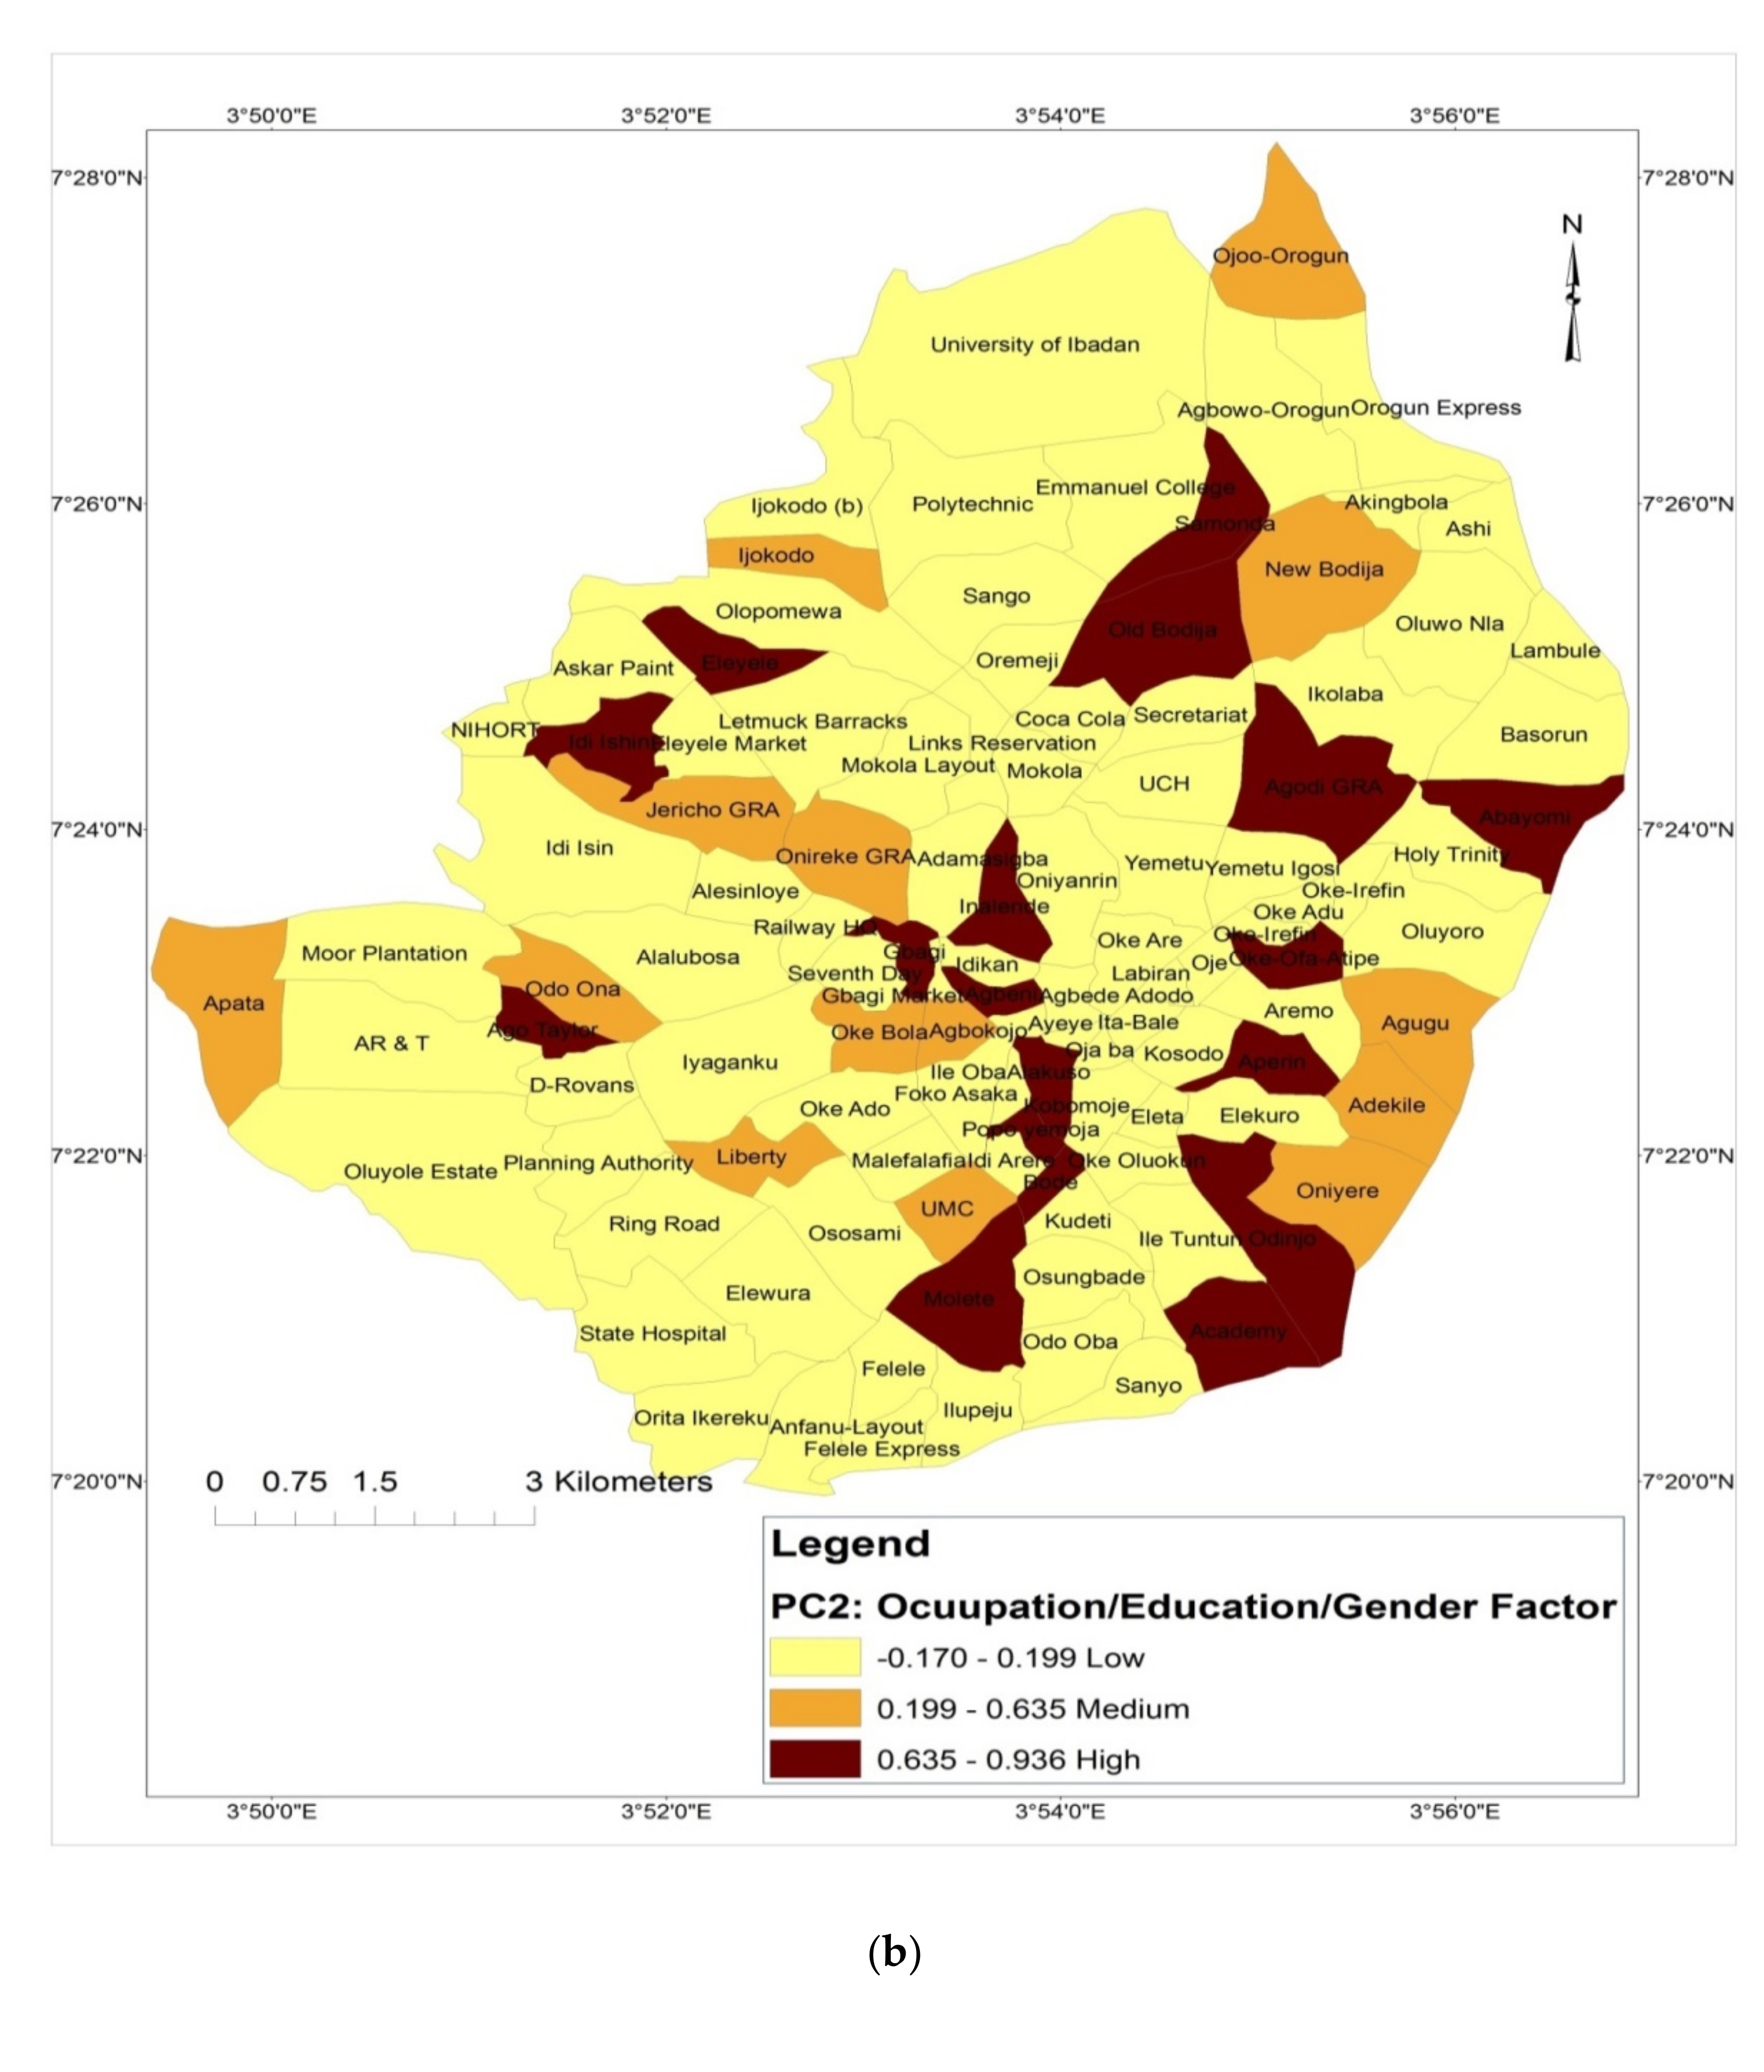
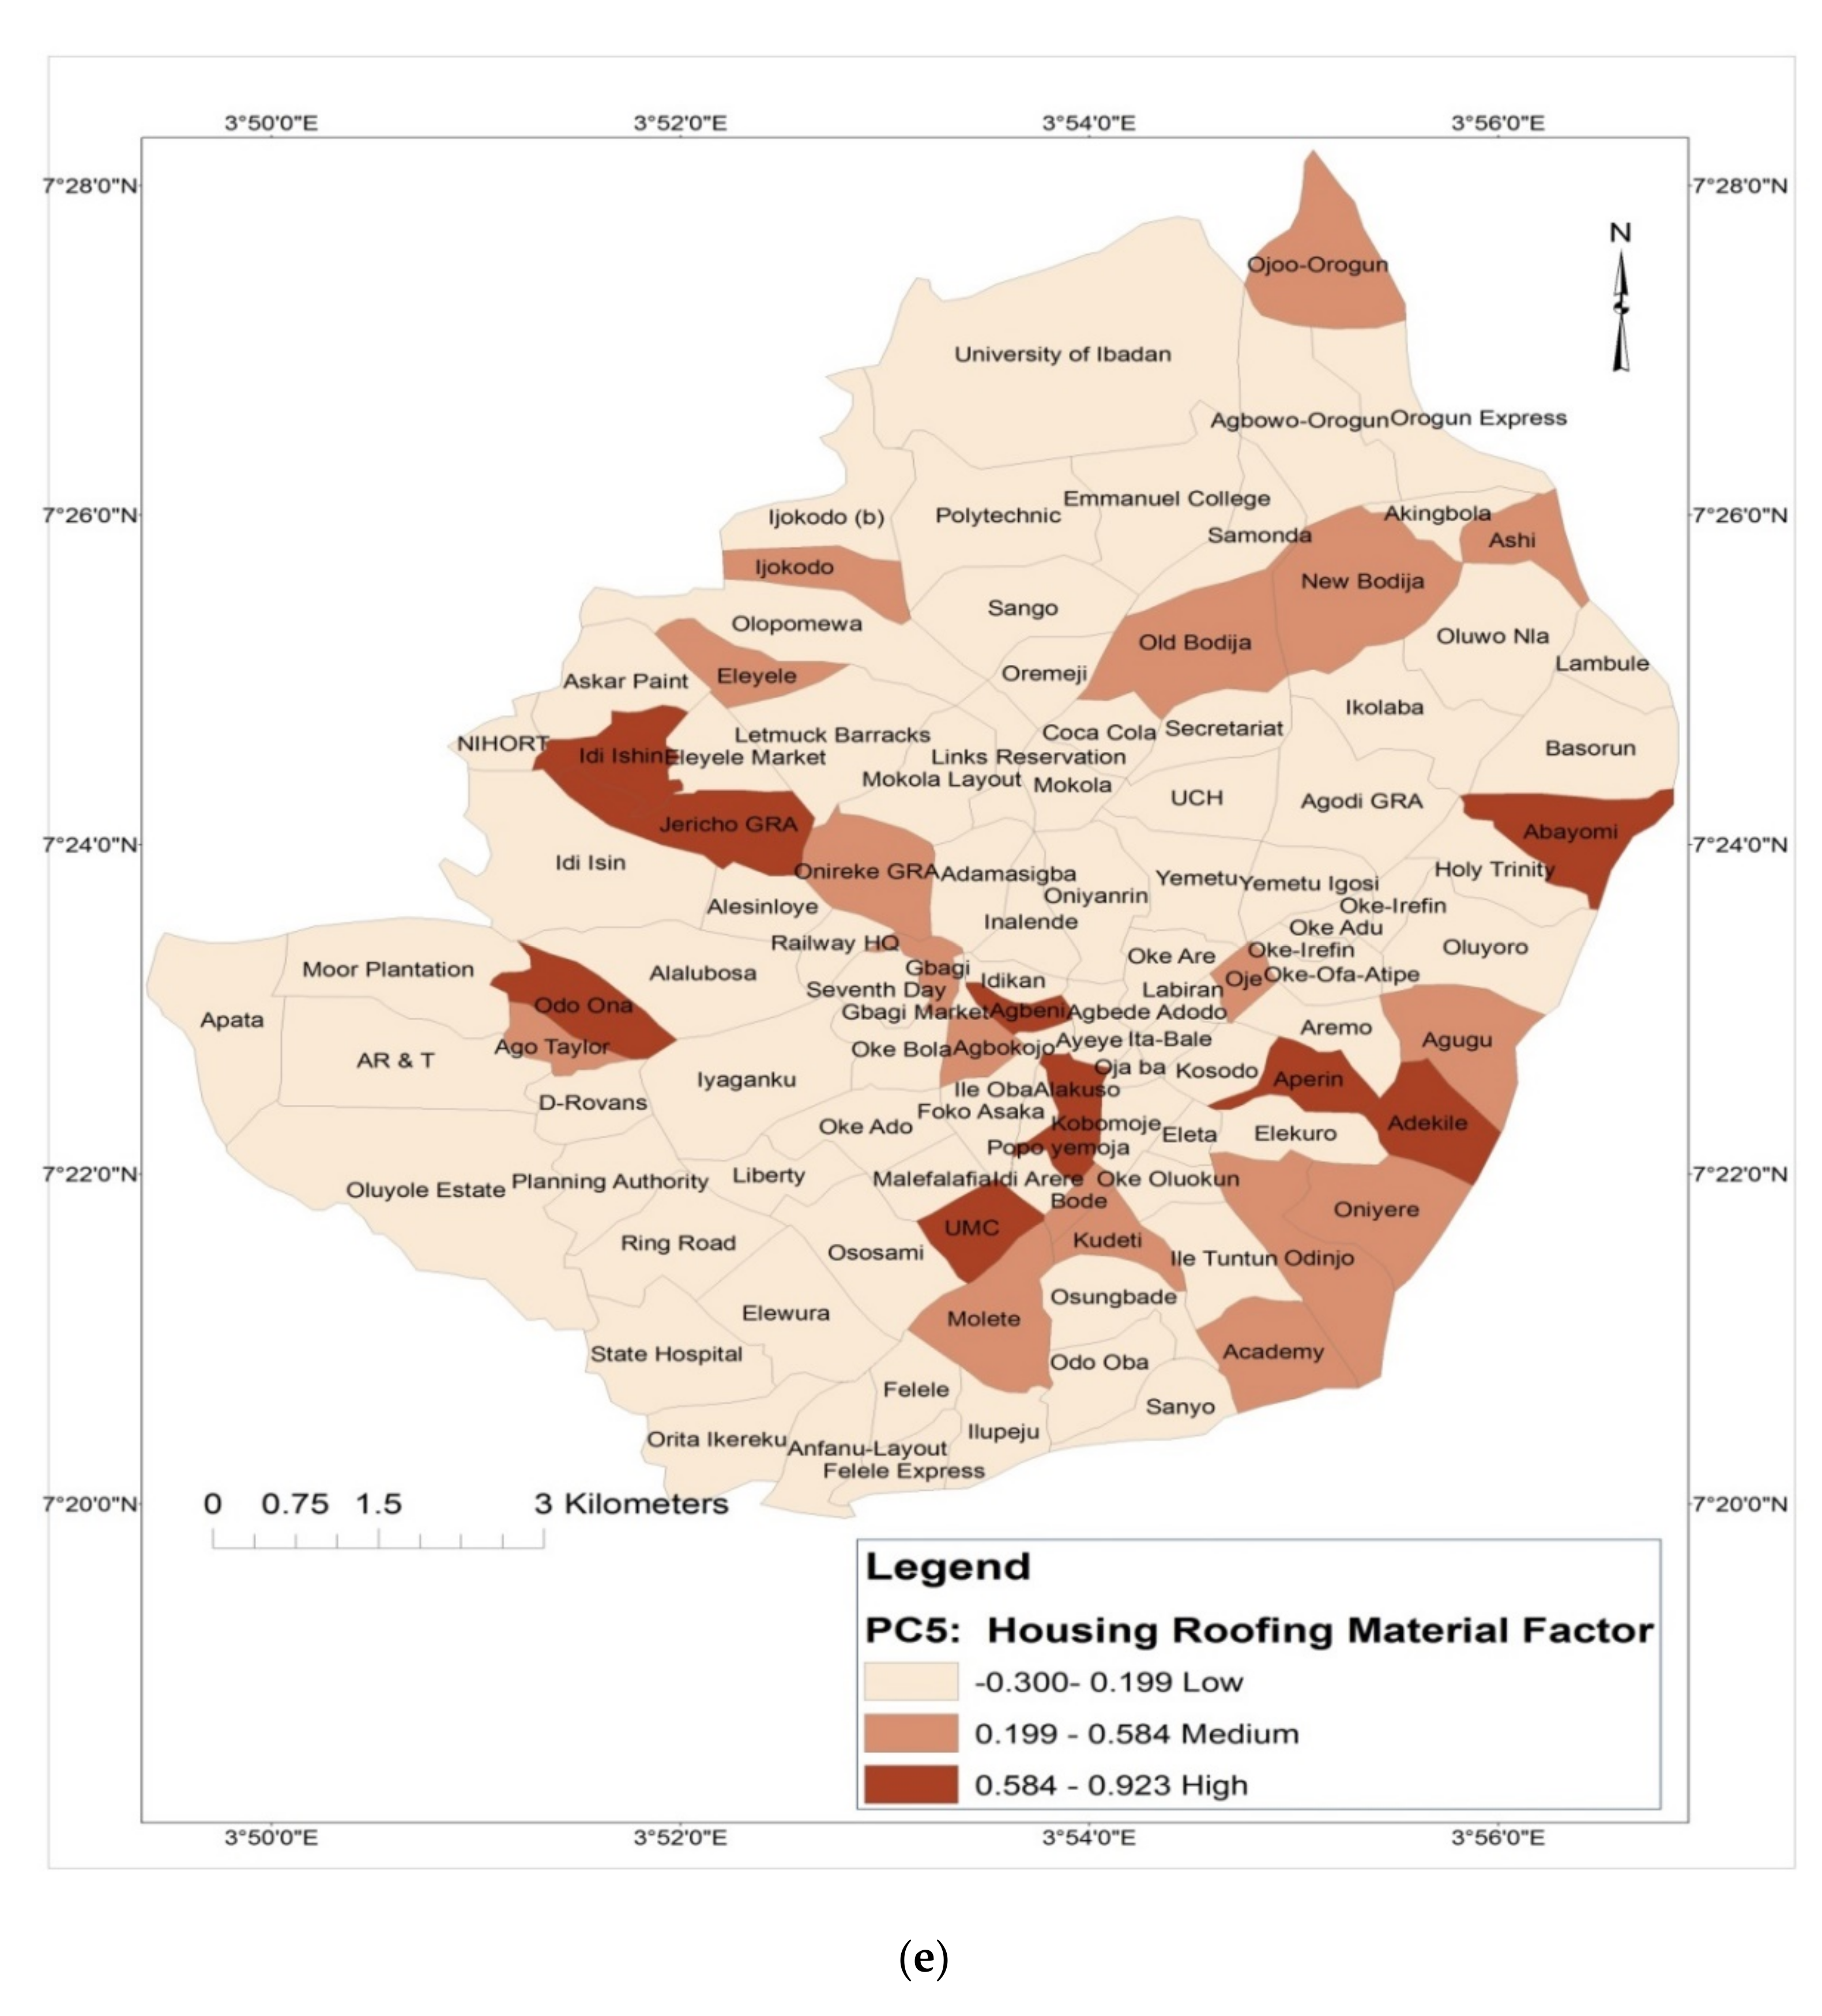
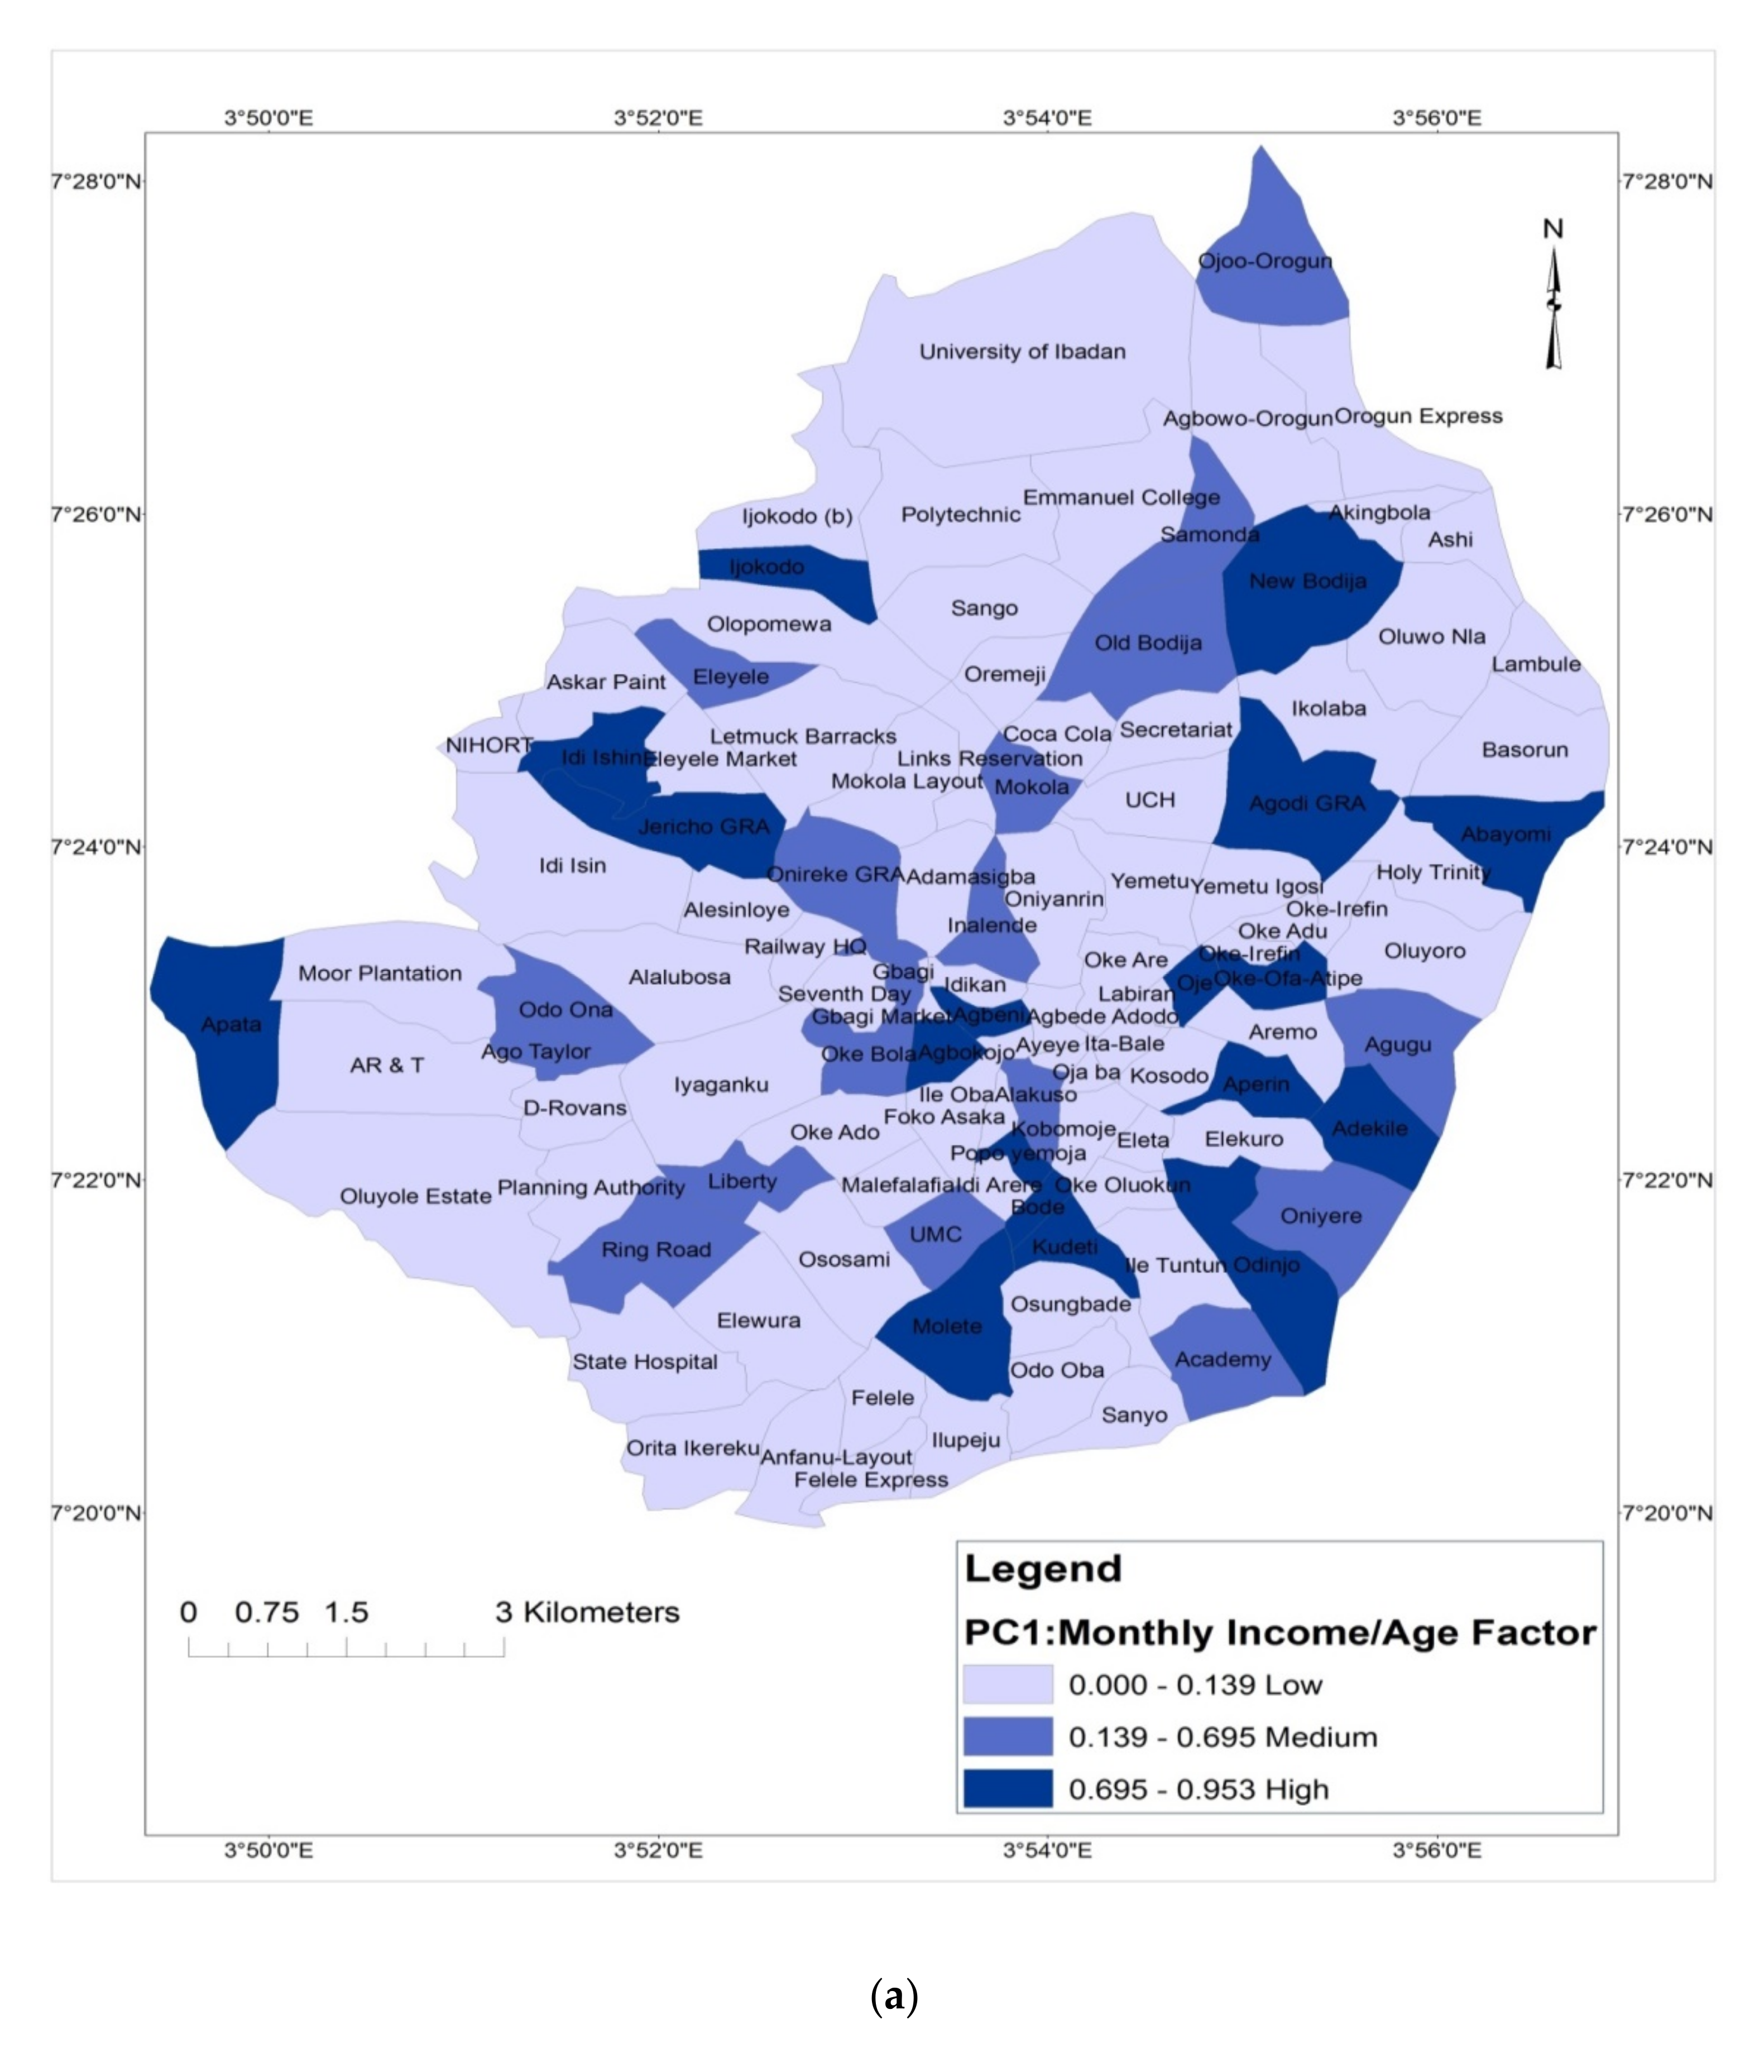
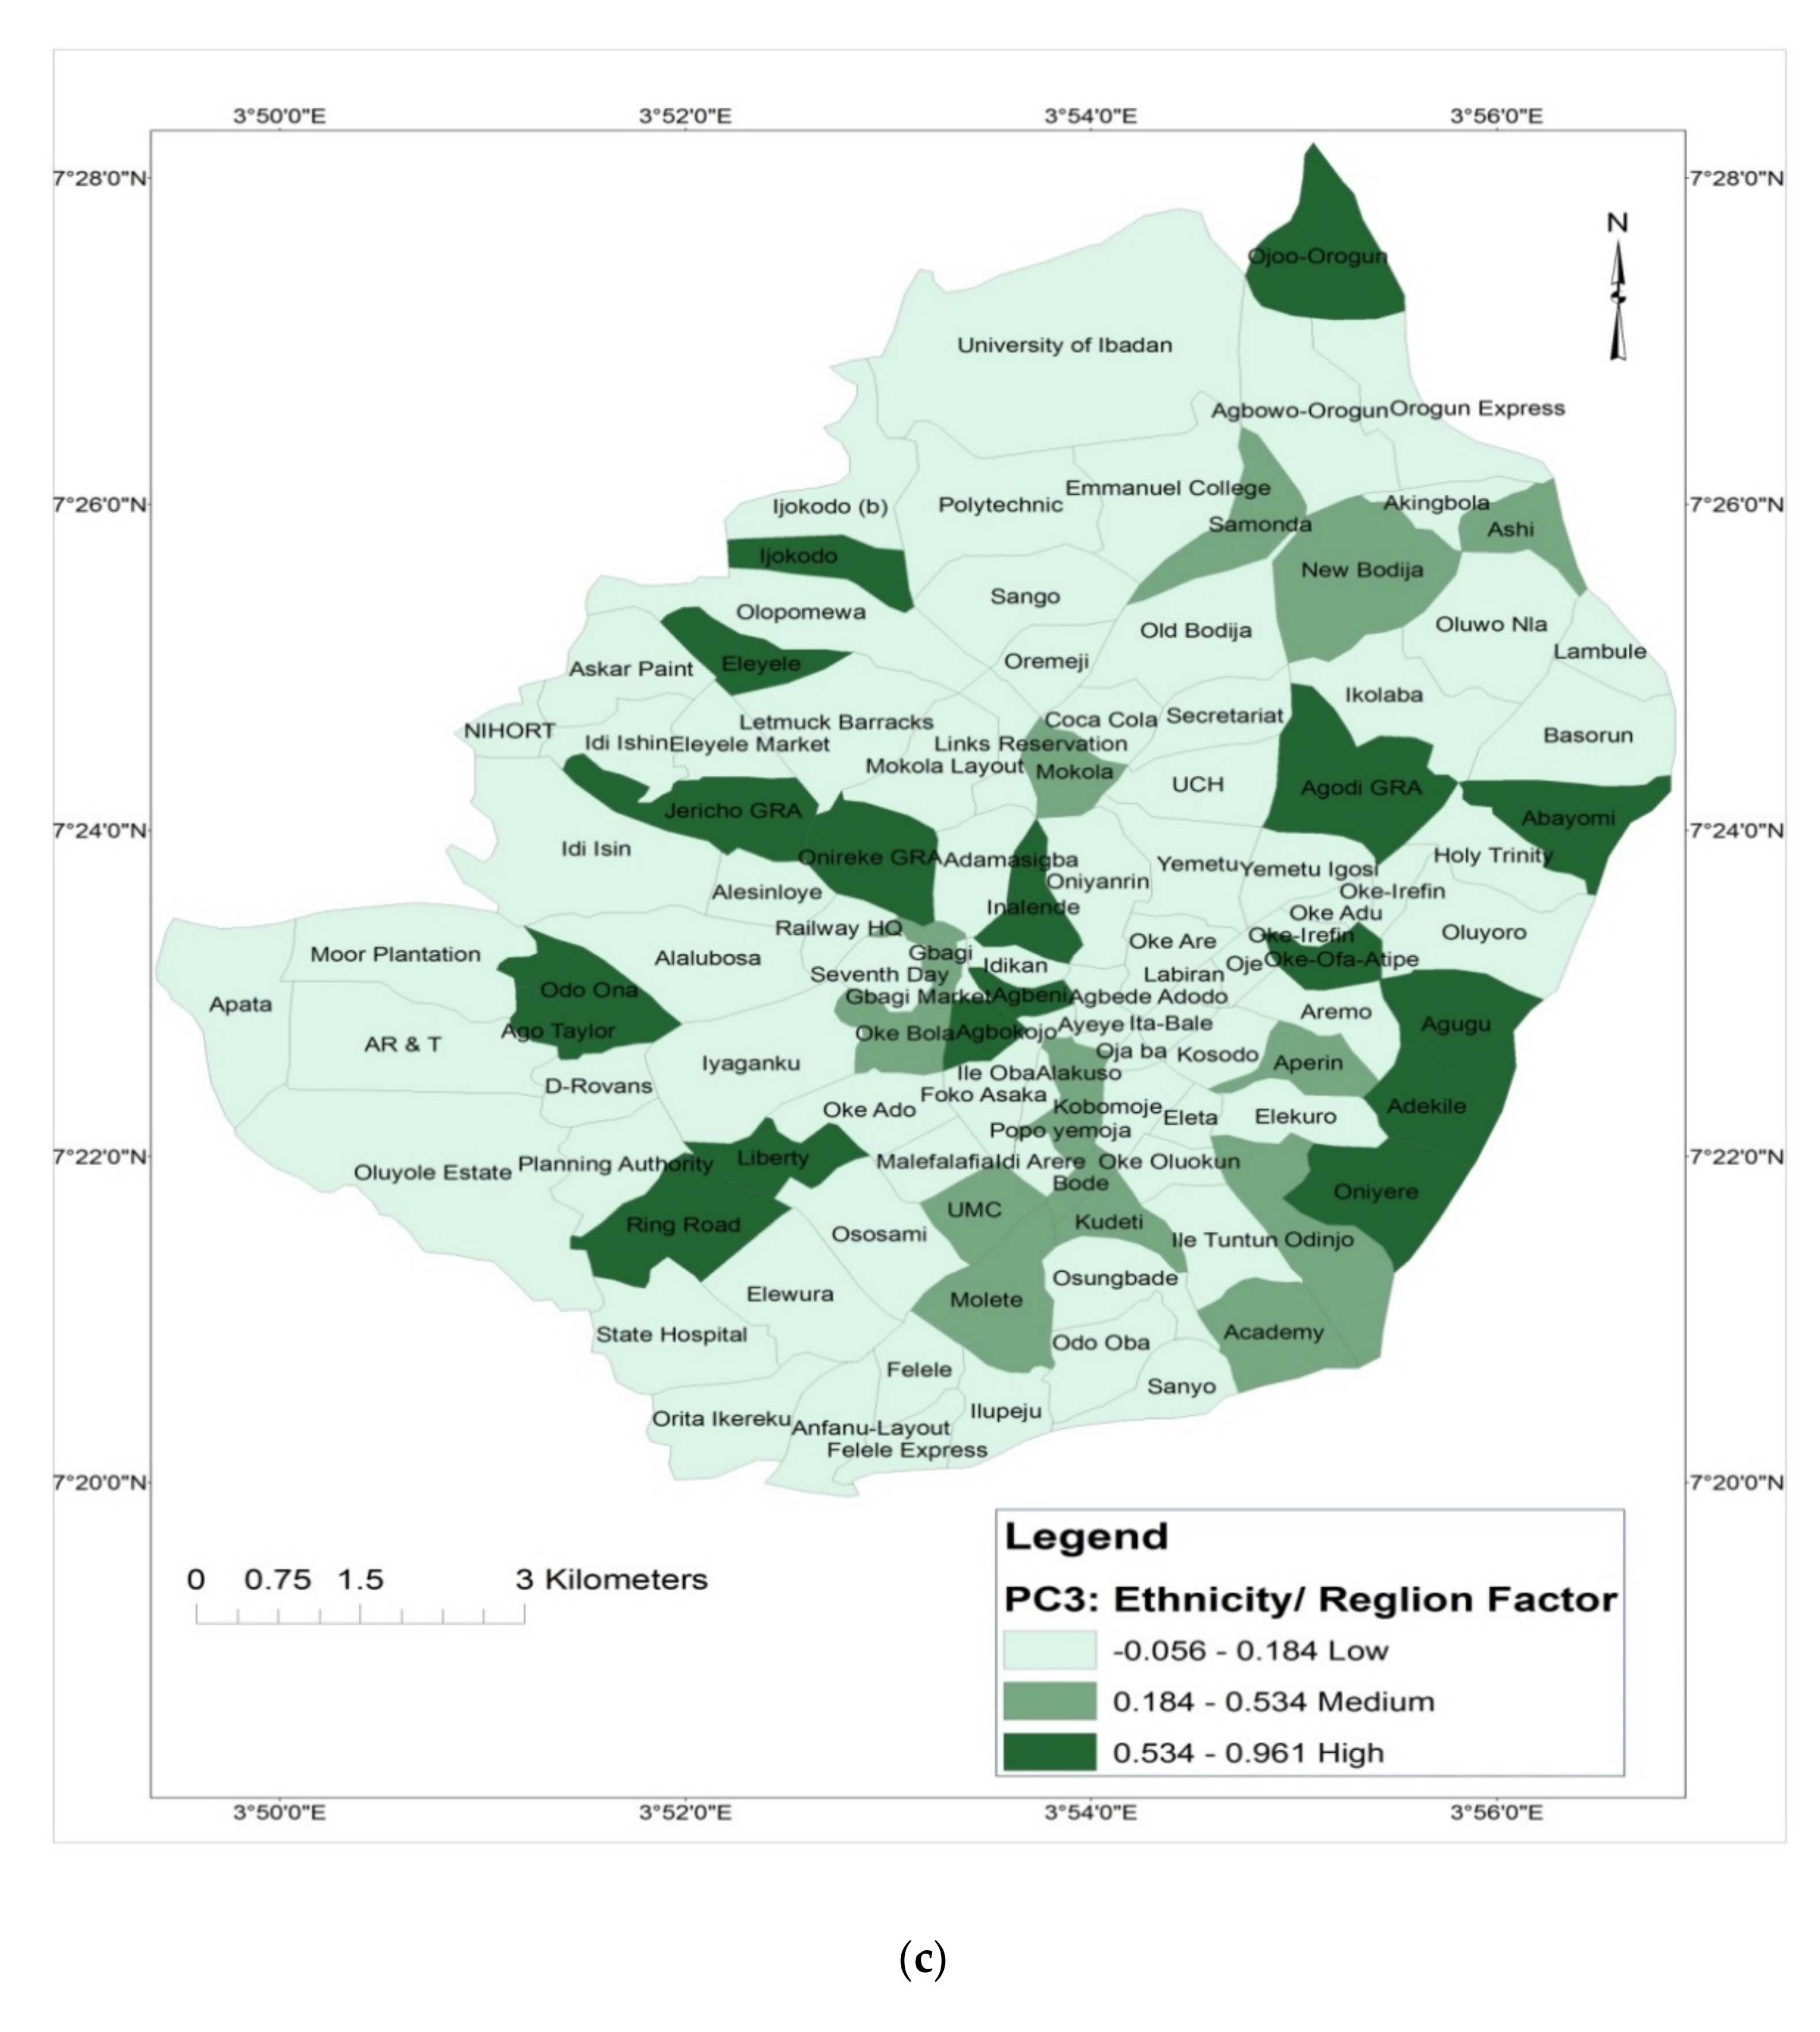
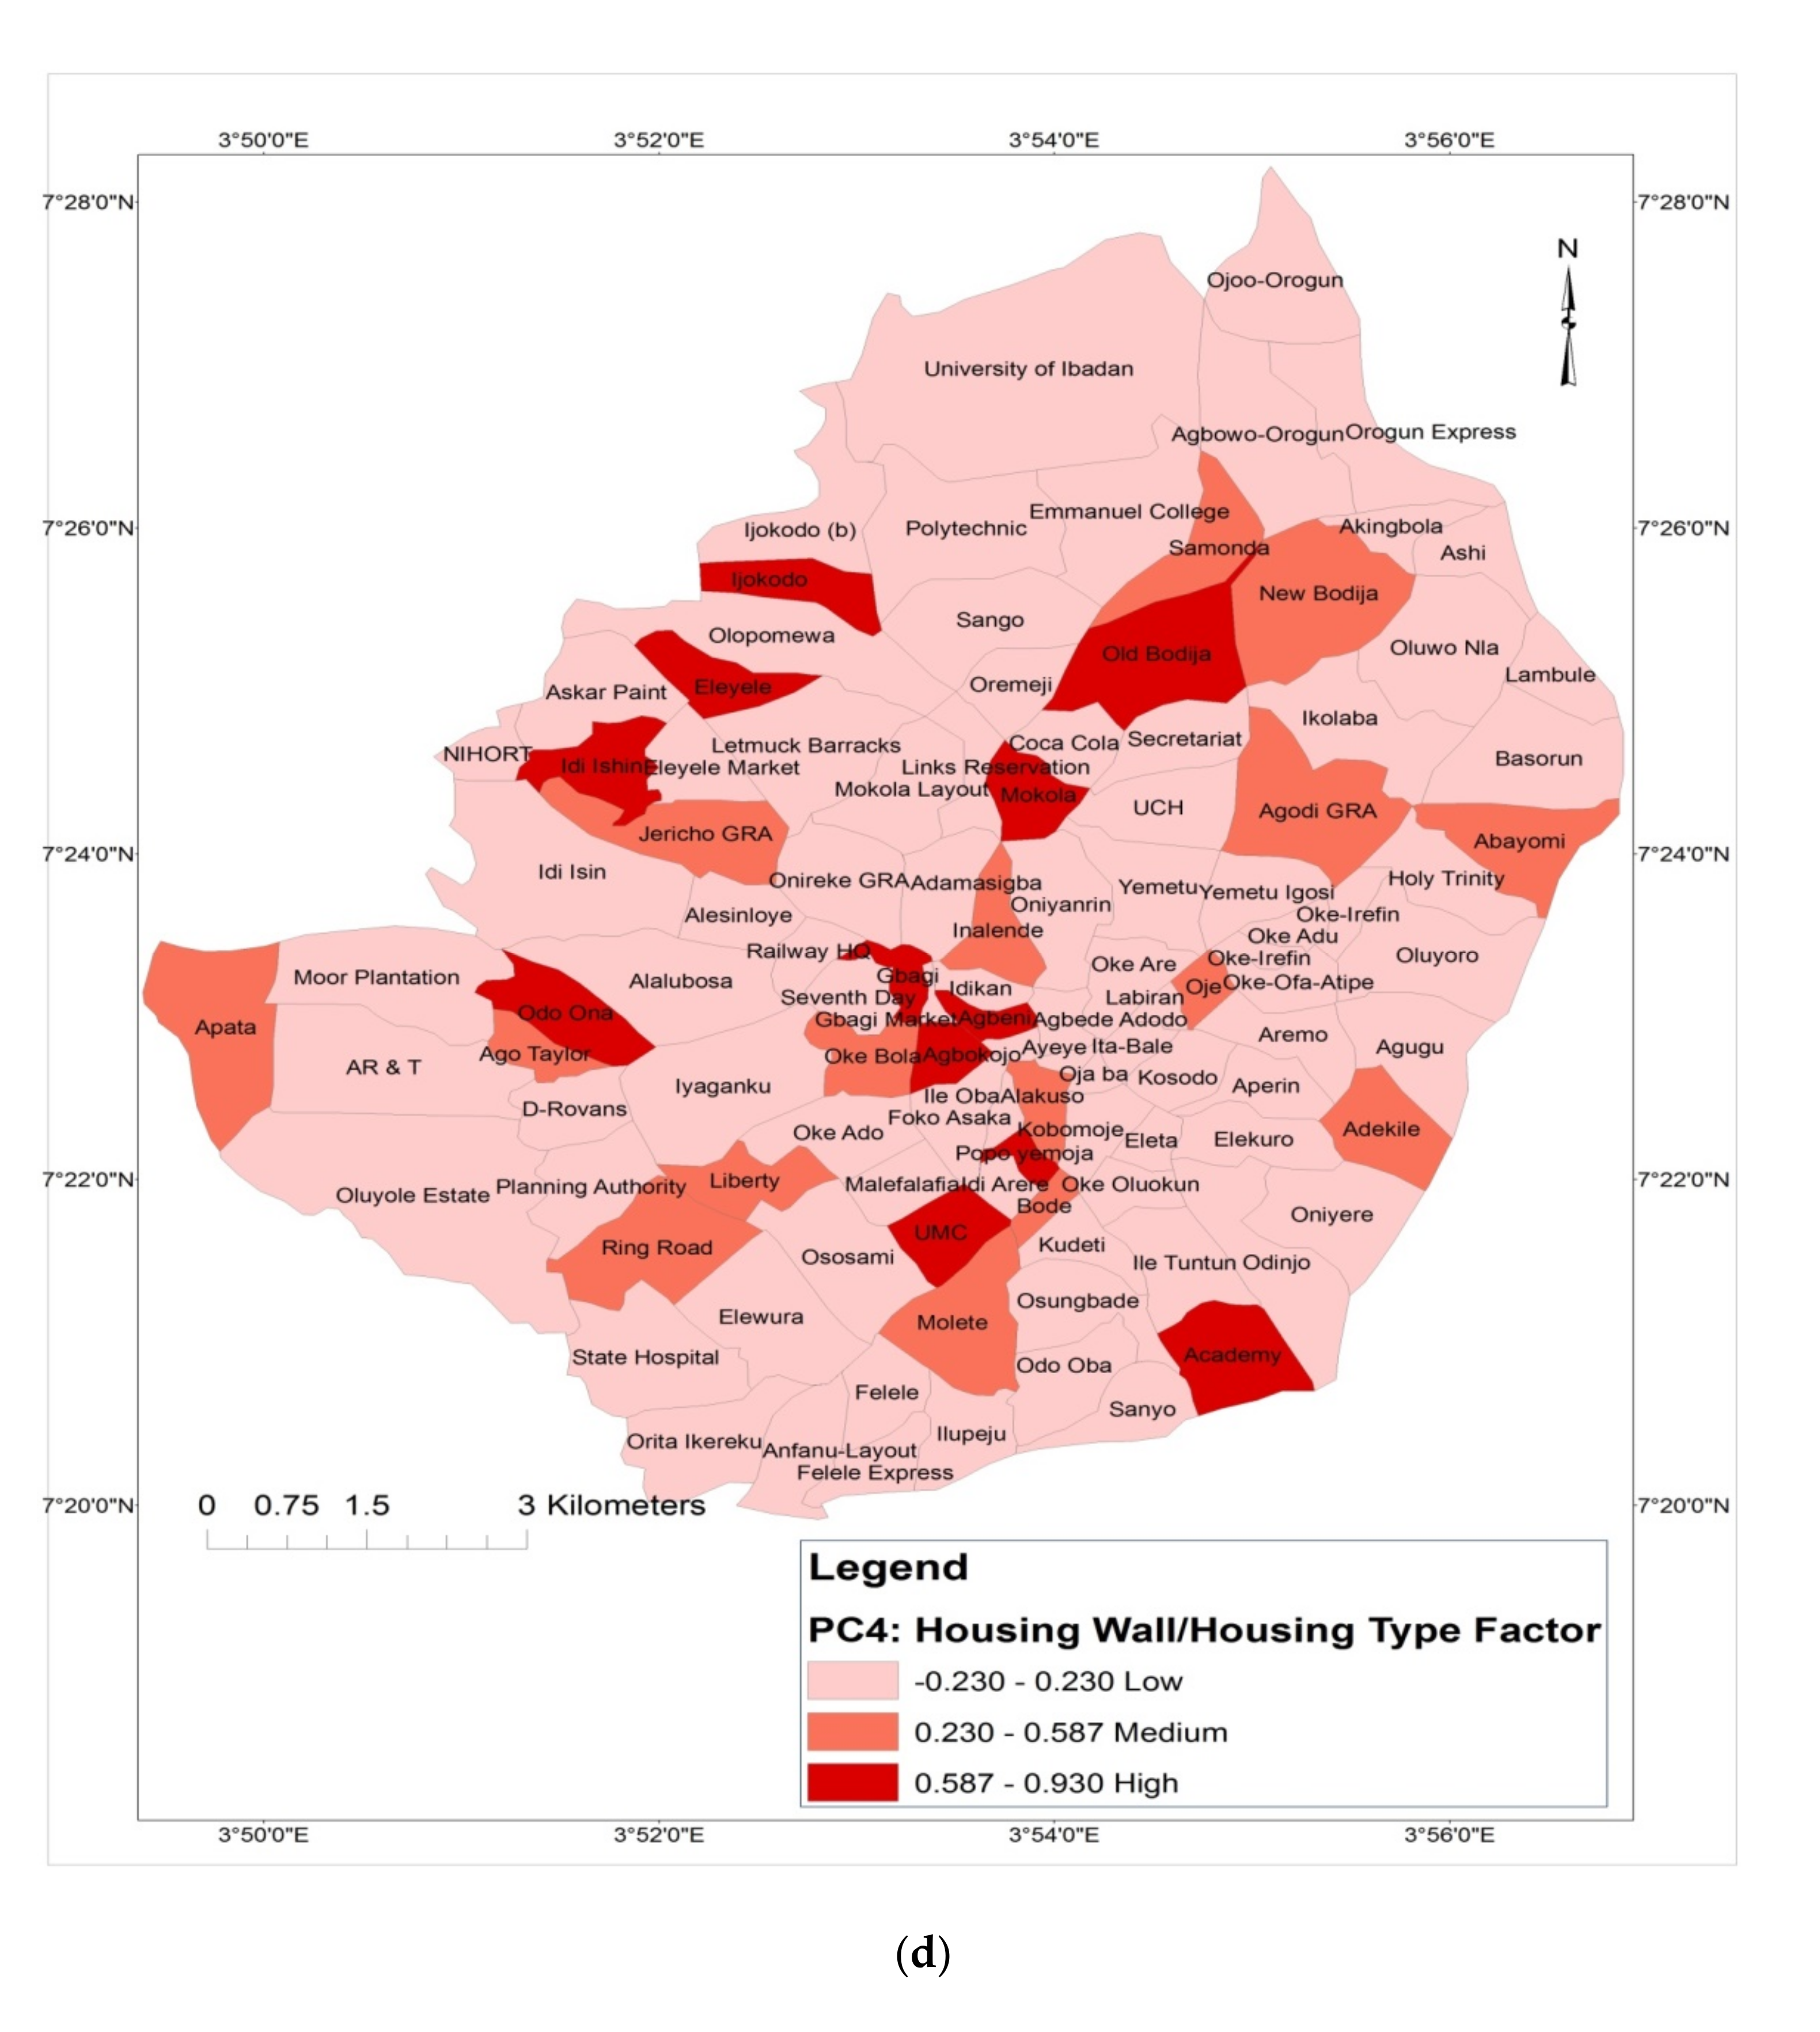
3.2.1. Principal Component Analysis

Principal component analysis (PCA) was employed to identify the underlying human group dimensions in the data sets which were collapsed to fewer uncorrelated components. The factors with the highest loadings of PC1 are monthly income (0.647) and age (0.595), whereas the highest PC2 loadings are by occupation (0.542), highest level of education (0.419) and gender (0.153). Ethnicity (0.452) and religion (0.413) load highly on the PC 3; housing wall materials (0.333) and housing types (0.331) load highly on PC4, whereas the highest loading of PC5 is by housing roofing material (0.267). Given the nature of the component loadings, the first PC was referred to as income/age; the second as occupation/education/gender; the third as ethnicity/religion; the fourth as housing wall material/housing type; and the fifth as housing roofing material.

3.2.2. Ordinary Least Square and Geographically Weighted Regression (GWR)

The next stage was to perform an Ordinary Least Square regression and a Geographically Weighted Regression in order to identify which of the factors assisted in assessing the how environmentally just is the distribution of green spaces in the metropolis. The summary of the OLS using ARCGIS 10.4.1 (Statistically significant p-value (p < 0.01) are: Income 0.004*; Occupation 0.010*; Housing type 0.001*.
The input variables for the GWR OF ArcgIS 10.4.1 therefore included “green space in sqm2 for 2015; Income; Occupation; and Housing type. The output results are as follows: Bandwidth: 0.02; Residual Squares:1672717481970.27; Effective Number: 44.36; Sigma: 157262.17; AICc: 3043.3; R2: 0.39; R2Adjusted: 0.52. Dependent Variables: Green Spaces_2015sqm; Explanatory variables: Income, Occupation and housing type.

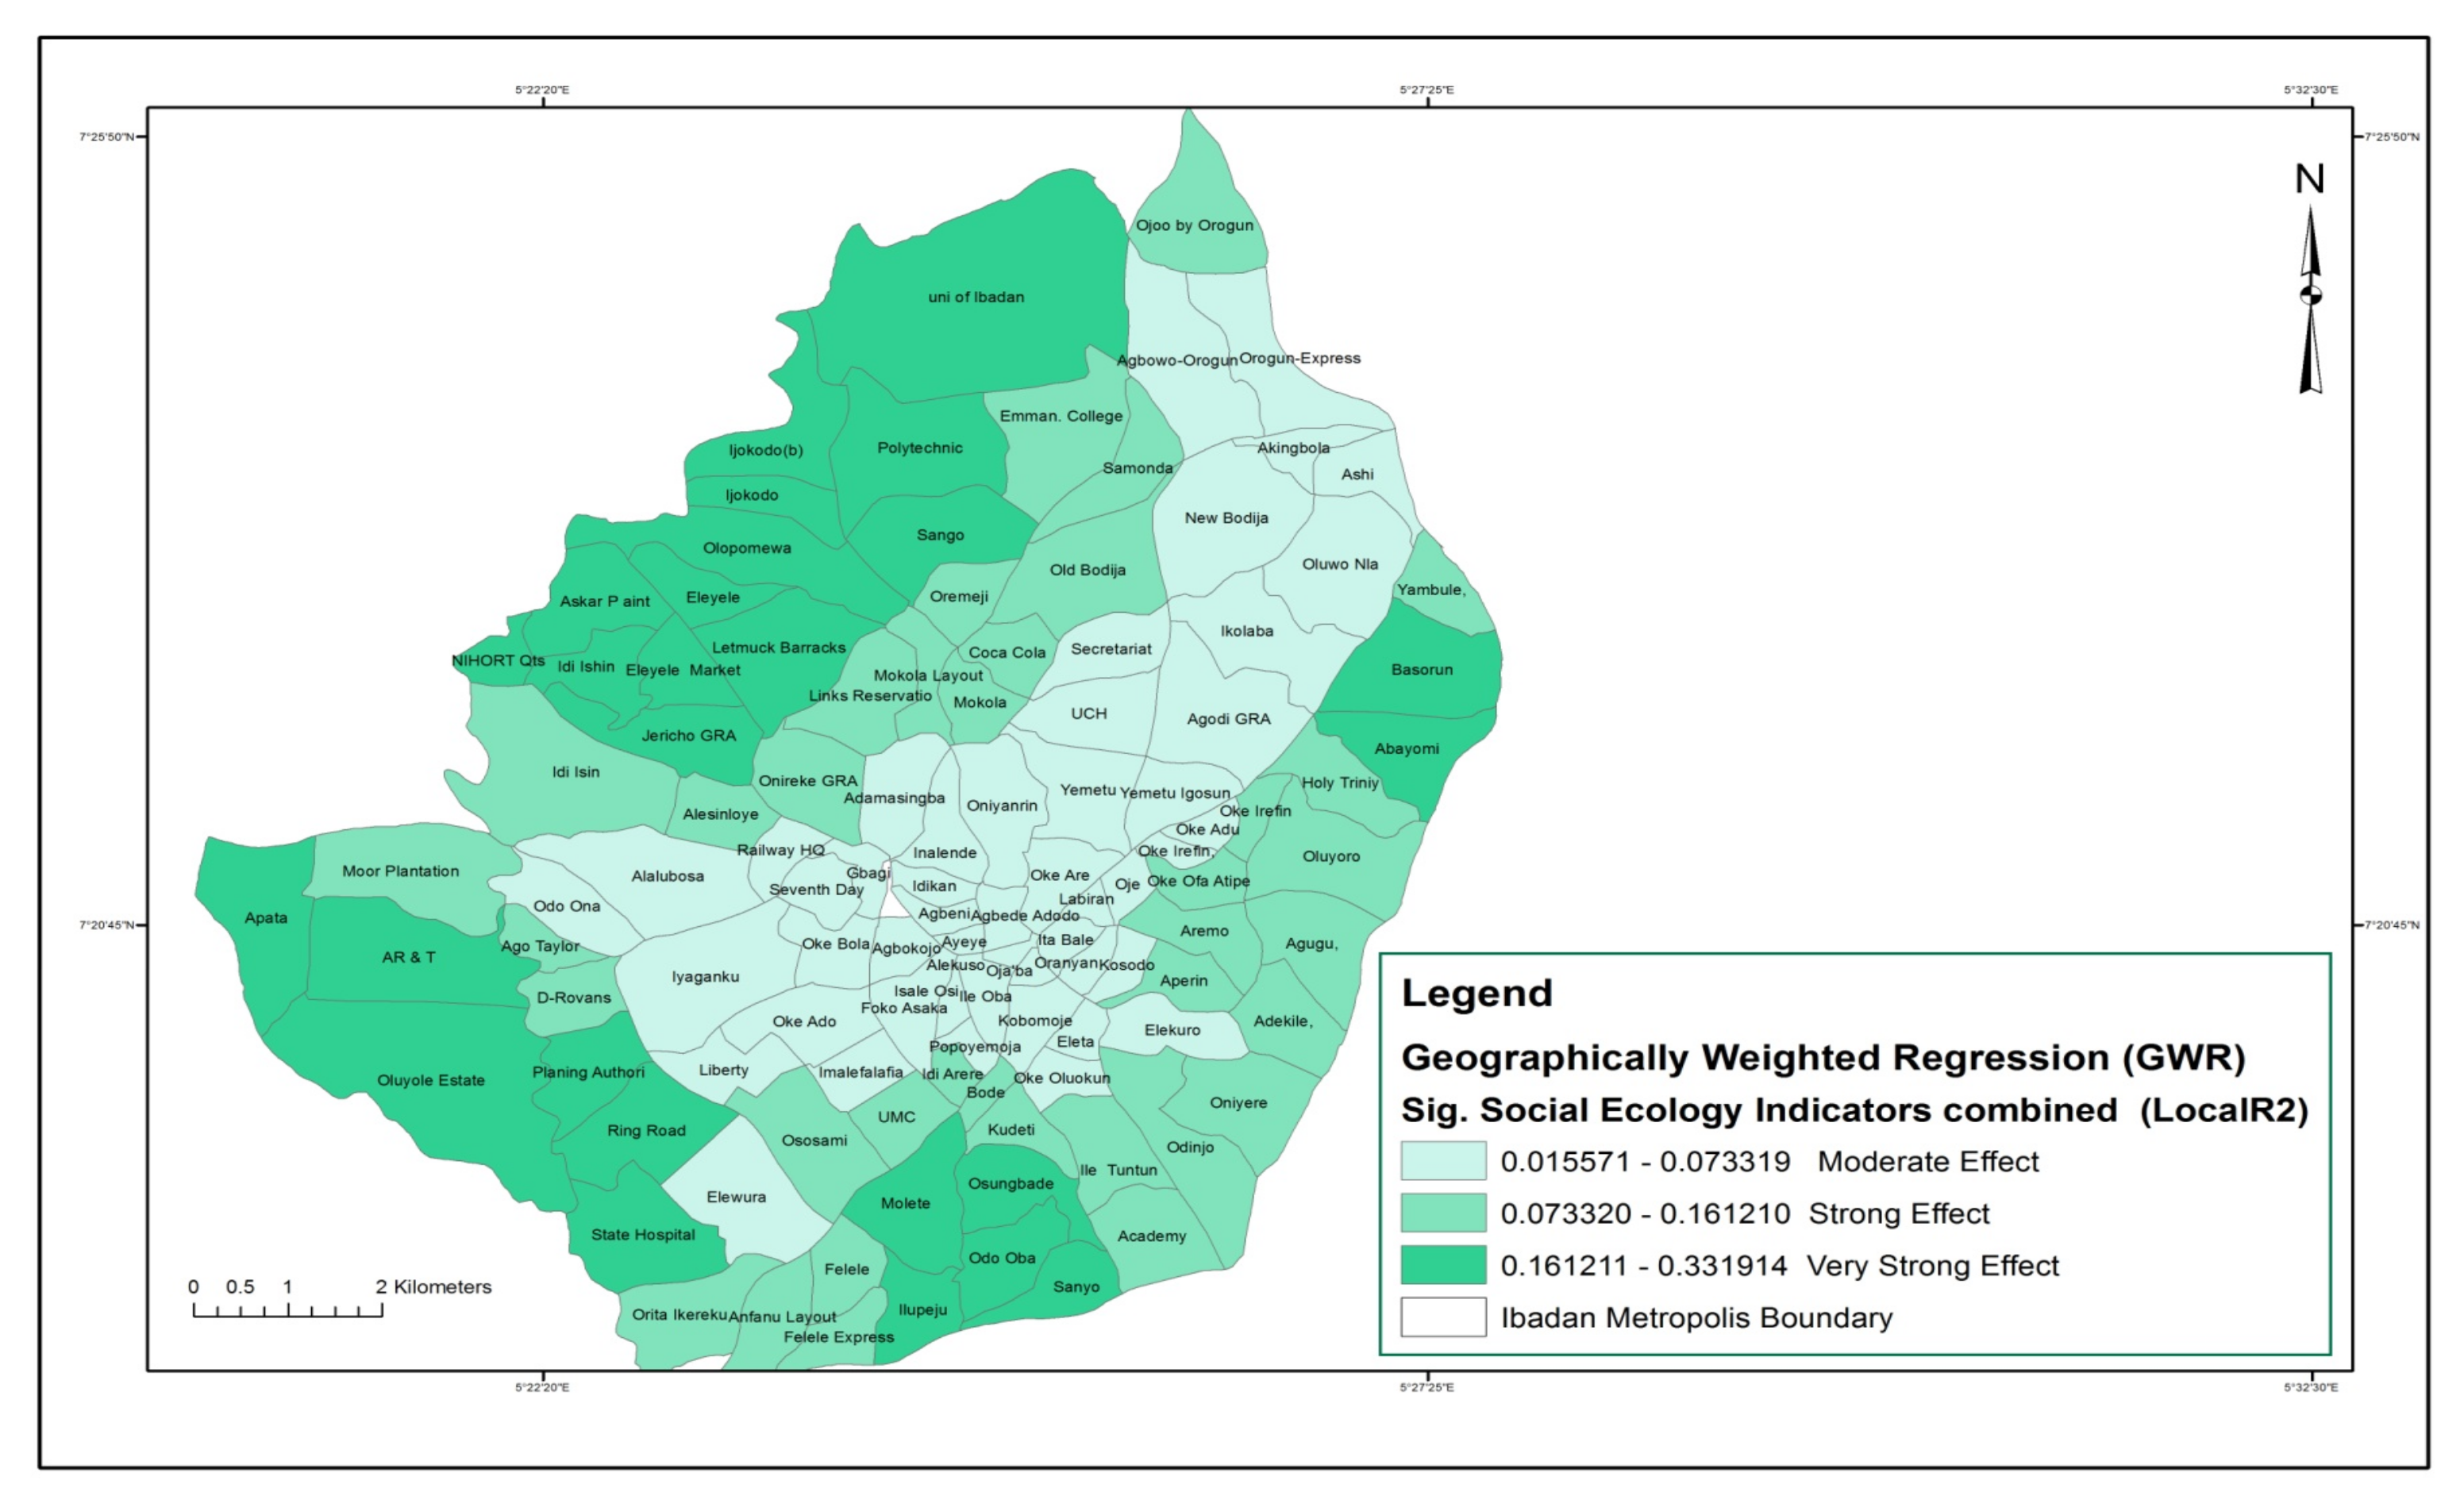
3.2.3. Geographically Weighted Regression (GWR)

Figure 3 therefore identifies the communities where the significant EJ indicators (income, occupatiom, housing types) have the greatest influence in explaining the uneven distribution of green spaces (combined: Local R2). From the map, examples of communities that exhibited very strong effects of the interplay of social indicators in explaining green space variation include Sanyo, Odo Oba, Ijokodo, Apata, Oluyole Estate, etc.The core or central parts of the metropolis exhibit only moderate impact on green space distributional pattern. They include communities such as Felele, Agugu, Oluyoro, Idi shin, Aremo, etc.

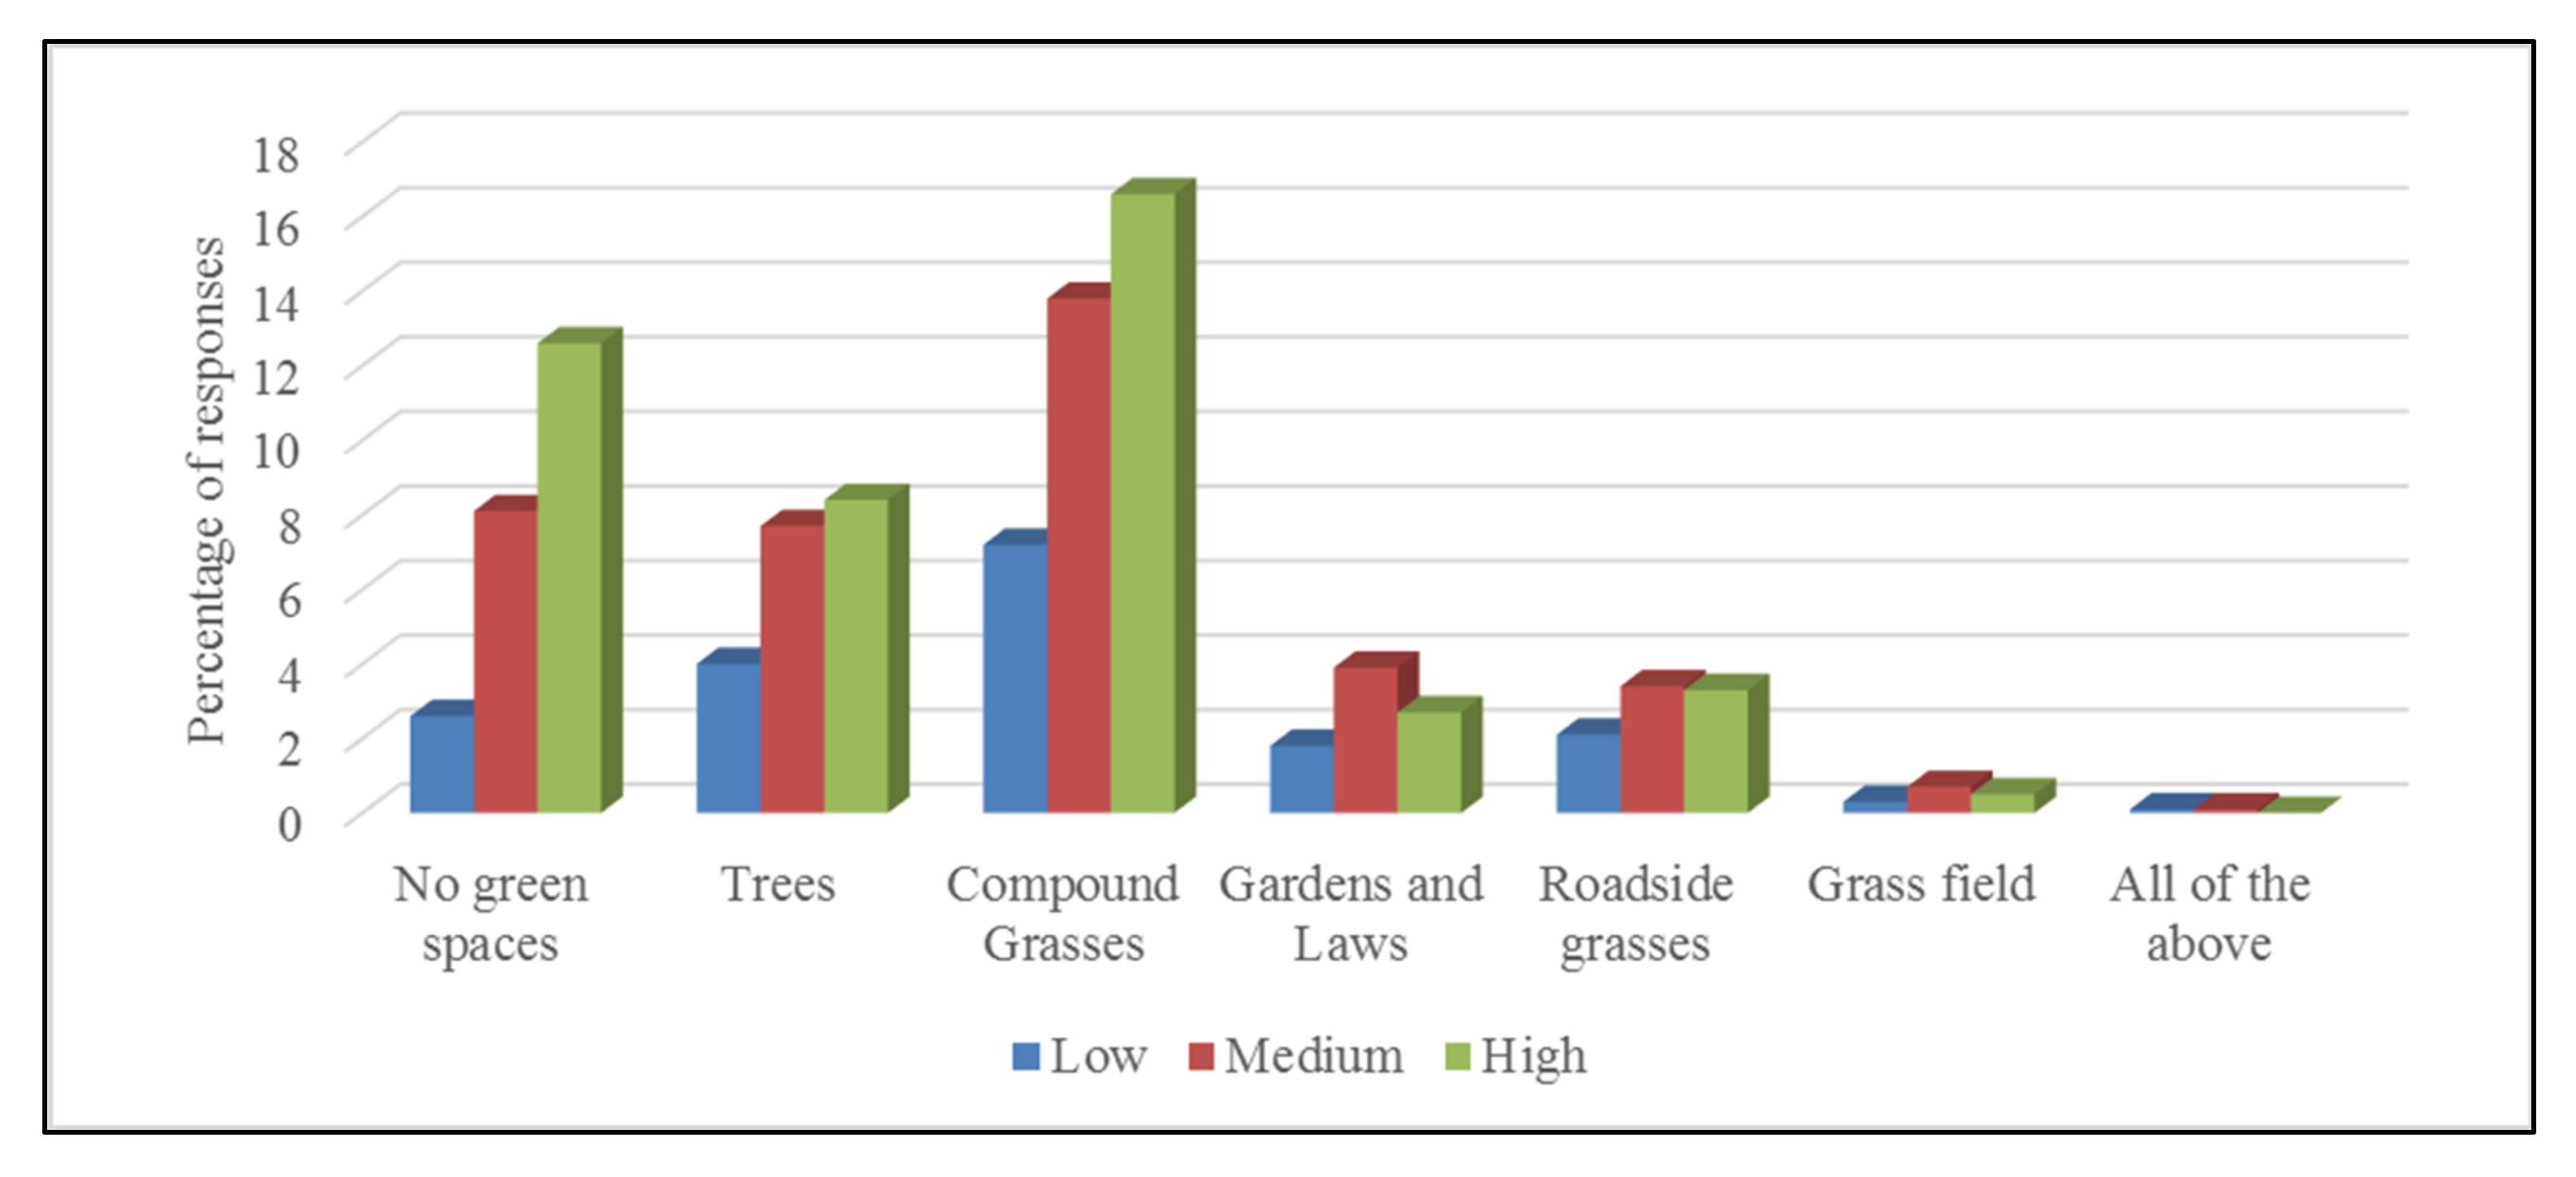
3.3. Perception on Green Spaces and Environmental Justice in Ibadan Metropolis

Result of the analysis show that 49.8% have trees as the major type of green spaces in their neighborhood. This was followed by compound grasses 46.0% and gardens/lawn 46.3%, respectively. Remarkably, roadside grasses were relatively high across the three residential zones (Low: 27.2%; Medium: 38.9%; High: 33.9%). Grass field was quite low in the low residential density zone. 50.3% have no green spaces in the medium density areas, whereas 33.2% have no green spaces in the high-density residential areas. The low density residential had the lowest percentage (16.5%) of respondents with no green spaces. The implication of this is that de- greening activities are quite high in Ibadan, and it is concentrated in the medium residential density areas. The various green space types are evident across the residential zones. However, notably are the roadside grasses, compound grasses and grass field (see Figure 4), which suggests a natural course rather than a deliberate attempt to preserve the green spaces.

3.4. Implications of Environmental Justice of Green Spaces on Sustainable Development in Urban Construction

The question at the Centre of environmental justice (EJ)) debate is whether there is an association between people’s socio-economic position and their exposure to environmental burdens as green space depletion. Additionally, how existing attitudes of individuals can help better explain their attitudes toward certain environmental behaviors as regard urban construction. Results and findings from this research study shows that environmental justice is lacking in Ibadan Metropolis and the urban construction is below satisfactory based on the following observations:
(1)
There is no fair or even distribution of green spaces in Ibadan Metropolis: Findings from this research project show that green spaces were clustered in some communities and communities which had no green spaces were also clustered. The theoretical explanation therefore from the environmental perspective shows that the attitude of Ibadan residents towards greening varies. While some have a positive attitude, others have negative attitudes, hence the uneven distribution of green spaces.
(2)
Government involvement of the people in the greening process is absence: Results and findings from the perception survey and Focus Group Discussion indicate that the government has accomplished little in ensuring the maintenance of green spaces and guiding against indiscriminately cutting of trees, etc. Reports from the FGD show that decisions on the environment are totally left in the hands of the people though their Landlord Association and community heads.
(3)
Laws, Policies and regulations on urban construction and development are not adhere to by government officials: Governmental officials such as the town planning authorities, Ministry of Lands, Housing and Development, Waste Management Authority and the Agency of Urban Beautification have not been carrying out their duties effectively. This is evident by the allocation of land for construction without proper layout spacing and consideration for green.

4. Conclusions and Recommendation for Sustainable Development

The 2030 Agenda and its Sustainable Development Goals (SDGs) offer new opportunities for the building sector to expand its focus. Studies in several African countries revealed that there is intense pressure on green spaces from urban construction resulting in persistent deterioration of green spaces. This has resulted in green spaces occupying a very small proportion of the total land space of many urban areas emanating into a process called degreening. Therefore, this study is based on the premise that economic growth (building sector) can and should occur without damaging the social fabric of the community and without harming the environment. The recommendation given for this research project is based on the findings and observations of the study. The major recommendations as follow are:
Restructuring of Ibadan Metropolis through Urban Revitalization and Environmental Planning: Revitalizing and restructuring the Ibadan metropolis will not go without a cost in terms of demolition of houses to accommodate green landscape, displacement of people and compensation plans by the government. A systematic approach of proper urban planning and environmental planning is required bearing in mind the concepts of environmental justice.
Using Religion Platforms in Promoting Greening Culture in Ibadan Metropolis: Findings and observation from the research project show that one way to promote a healthy social structure and strong environmental Justice system across communities in Ibadan Metropolis is through the various religions we have (Christianity, Islam and tradition, etc.). There is strong respect for religion, and most religions have respect for the environment. Therefore, religious platforms can be used to bring about awareness on the importance of green spaces.
Awareness of the climatic implications of greening through social media: The government show be more aggressive on educating its citizens on the importance of green spaces. Effective publicity can be achieved through social media: tv, newspaper, etc.
Policies geared towards greening culture by house owners: Behavioral attitude cannot be easily changed. Therefore, bearing this in mind the government should take more drastic measures such as passing into law for the greening of compounds by house owners. Defectors will then be persecuted or fined. This conscious movement will restore the quality of the environment.

Funding

This researched received no external funding.

Data Availability Statement

Data will be available on request.

Conflicts of Interest

There is no conflict of interest for this study.

References

  1. Enger, S.C. Planning for Parks, Recreation, and Open Space in Your Community. Interag. Comm. Outdoor Recreat. Urban Plan. 2005, 57, 40–120. [Google Scholar]
  2. Turner, B.L.; Clark, W.C.; Kates, R.W.; Richards, J.F.; Mathews, J.T.; Meyer, W.B. The Earth as Transformed by Human Action: Global and Regional Changes in the Biosphere over the Past 300 Years; Cambridge University Press with Clark University: Cambridge, UK, 1990; p. 713. [Google Scholar]
  3. Lavalle, C. Toward an Urban Atlas: Assessment of Spatial Data on 25 European Cities and Urban Areas; Environmental Issue Rep. Copenhagen; European Environment Agency: Copenhagen, Denmark, 2002; pp. 1–99. [Google Scholar]
  4. McDonald, R.I.; Forman, R.T.; Kareiva, P. Open space loss and land inequality in United States’ cities, 1990–2000. PLoS ONE 2010, 5, e9509. [Google Scholar] [CrossRef] [PubMed] [Green Version]
  5. Chiesura, A. The role of urban parks for the sustainable city. Landsc. Urban Plan 2004, 68, 129–138. [Google Scholar] [CrossRef]
  6. Cutts, B.B.; Kate, J.D.; Christopher, G.B.; Alexandra, B. City structure, obesity, and environmental justice: An integrated analysis of physical and social barriers to walkable streets and park access. Soc. Sci. Med. 2009, 69, 1314–1322. [Google Scholar] [CrossRef] [PubMed]
  7. Davoudi, S.; Brooks, E. Environmental Justice and the City; Global Urban Research Unit, School of Architecture, Planning and Landscape Newcastle University: Newcastle upon Tyne, UK, 2012; pp. 1–171. [Google Scholar]
  8. Schlosberg, D. Defining Environmental Justice: Theories, Movements, and Nature; Oxford University Press: New York, NY, USA, 2007; pp. 1–123. [Google Scholar]
  9. Shrader, F. Environmental Justice Creating Equality, Reclaiming Democracy; Oxford University Press: New York, NY, USA, 2002; pp. 1–223. [Google Scholar]
  10. Rhodes, E.L. The Challenge of Environmental Justice Measurement and Assessment. Policy Manag. Rev. 2003, 2, 86–110. [Google Scholar]
  11. United Nations Conference on Environment and Development, Rio de Janeiro, Brazil, 3–14 June 1992. The Rio Declaration on Environment and Development. 1992, pp. 1–272. Available online: https://www.un.org/en/conferences/environment/rio1992 (accessed on 27 March 2022).
  12. Ikporukpo, C.O. Petroleum, Fiscal Federalism and Environmental Justice in Nigeria. Space Polity 2004, 8, 321–354. [Google Scholar] [CrossRef]
Figure 1. Green space distribution showing disadvantaged communities Ibadan Metropolis.
Environsciproc 15 00057 g001
Figure 2. The existing concentration of the various human groups in Ibadan Metropolis based on five dimensions (a) Income/Age factor; (b) Occupation/Education/Gender factor; (c) Ethnicity/religion factor; (d) Housing wall/Housing Type factors; (e) Housing roofing material Factor.
Environsciproc 15 00057 g002aEnvironsciproc 15 00057 g002bEnvironsciproc 15 00057 g002cEnvironsciproc 15 00057 g002dEnvironsciproc 15 00057 g002e
Figure 3. Variation level of disadvantaged Communities based on EJ indicators combined.
Environsciproc 15 00057 g003
Figure 4. Types of green spaces by residential density.
Environsciproc 15 00057 g004
Table 1. Summary of Conceptual Contribution of Environmental Justice.
Conceptual Contribution of Environmental JusticeVariables to MeasureReferences
Distribution of human groups varies across a geographical space.
The distribution pattern of human groups influence the distribution of environmental burdens and benefits.
The differentiation in human groups will bring about hierarchical domination which will lead to a section of human groups becoming disadvantaged.
Socio-economic Characteristics [7,8,9,10,11,12]
Complied by author 2021.
Publisher’s Note: MDPI stays neutral with regard to jurisdictional claims in published maps and institutional affiliations.

