Abstract
Intensive management in European forests in the 20th century resulted in the substitution of the old-growth natural forests with plantations on vast territories. The spatial structure and tree species composition of the planted forests are simplified making the forests vulnerable to diseases and disturbances. The old-growth natural forests that remained in some places can be used as etalon forests for the reconstructed forests in similar environmental conditions. We studied spatial structure, biodiversity indicators and carbon stocks of the old-growth natural forests in the Ukrainian Carpathians in order to set forest management targets for the forest plantations in the region.
1. Introduction
Current forests of the Ukrainian Carpathians are at different stages of vegetation succession, from pioneer to stable phytocenosises, which were formed over a long time. The concept of forest management in the Ukrainian Carpathians, especially after the Second World War period (1950–1980s), was based on clearcut loggings and artificial reforestation (planting or sowing). This led to appearance of the large-scale areas of even-aged and single-species stands. However, in the areas with poor road infrastructure and in the protected areas, old-growth natural forests and primeval type forests remain. These forests are of a particular interest nowadays because they have complex spatial and vertical structures, multiple tree species composition and uneven age structure, with high biodiversity and adaptation capacity. The forests can be used as a target standard for performing forest management in artificial and wood production forests. In the Ukrainian Carpathians, beech, Norway spruce, and fir primeval forests (quasi-primeval forests) are located, which cover an area of up to 95 thousand ha [1,2]. The area of Ukrainian primeval forests under the protection of UNESCO is almost 24 thousand ha and almost 35 thousand ha belongs to its buffer zone (https://whc.unesco.org/en/list/1133, accessed on 2 September 2022) [3].
In the Gorgany region, at the altitude of 800–1500 m above sea level, considerable areas of the beech-fir-Norway spruce, fir-Norway spruce and Norway spruce old-growth natural forests and primeval forests are located. They are growing mostly on the damp forest site types. At the top belt of spruce forests, relict moist cedar-Norway spruce forests of fairly infertile site type grow. On the protected areas of National Natural Park “Skole Beskids”, at the altitude of 700–1200 m above sea level, forests of primeval type remain as well. They mostly include moist Norway spruce-fir-beech fairly fertile and fertile site types with the addition of fir, Norway spruce and sycamore tree species. The main site type species are beech, Norway spruce and fir. The admixtures are sycamore, mountain elm and mountain-ash. The protected zone of the National Park, based on the inventory data, is about 5 thousand ha.
The aim of the study is to establish an estimation of carbon stock in the natural old-growth forests of protected areas of the Ukrainian Carpathians, their spatial structure and biodiversity indexes as well as select the stands with the highest productivity and complex structure as a target standard for performing forest management in artificial and wood production forests.
2. Materials and Methods
2.1. Study Location
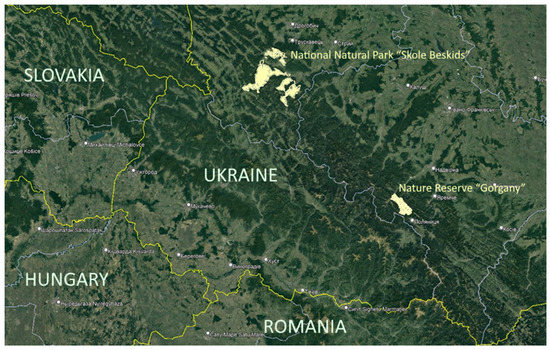
Sample plots were established in the old growth forests of the National Natural Park “Skole Beskids” and Nature Reserve “Gorgany” in the west of Ukraine (Figure 1) at altitude of 700–1400 m above sea level. For the choosing places for field measurements, we applied a uniform raster network in altitudinal and horizontal dimensions for the territory of Nature Reserve “Gorgany” and National Natural Park “Skole Beskids”. Further, using results of forest inventory, we chose the plots (inventory compartments), where the average age of stands was 120 years and more. That type of disposition of sample plots (testing plots) guarantees the unbiassed character and contingency of territory coverage.

Figure 1.
Location of the National Natural Park “Skole Beskids” and Nature Reserve “Gorgany” where the sample plots were established.
2.2. Use of Remote Sensing Data
For estimating the spatial structure of stands, the remote sensing data (RS) and the results of ground measurements on the sample plots were used. The usage of high-resolution RS data allows to analyze the spatial structure of stands on a large territory based on the measurements on the sample plots [4]. Landsat images were used for covering the whole study area. When choosing the RS data, we considered data accessibility, enough numbers of images of high quality with minimal cloud cover obtained over a short period. For the verification of classes, high-resolution QuickBird images were used. The methodology of image interpretation is described in [4,5].
2.3. Estimation of Forest Parameters
A sample plot was obtained as the basic unit for carbon stock estimation, taking into account sylvicultural and inventory indexes, i.e., species composition, average age, productivity, relative stocking. The carbon stock in the phytomass of the forest stands was calculated using the “bottom-up” approach that is based on the direct calculation of carbon stock of individual phytomass components and wood density for every tree species with the usage of conversional coefficients [6,7,8]. The calculation using the conversional coefficients method was realized in the developed database of statistical inventory of the sample plots applying statistical regressions (dependence of phytomass on tree species, average age, productivity class, relative stocking, etc.) [6,7,8,9,10,11].
The spatial and age structures, and stands growing stock were estimated for the round sample plots of area of 500 m2. The centers of the sample plots were determined using a GPS receiver. The vertical structure of the stands (the structure of tree layers or the vertical horizons) represents a percentage of occupation of each layer by vegetation. Horizontal structure was estimated using three indicators: diversity of tree positions (positioning), value diversity (variability of the indicator) and tree species diversity (composition). The diversity of the species was estimated using the Shannon index and tree differentiation index (T). The formulas of the species diversity are presented in Table 1.

Table 1.
Main criterion for the forest species diversity estimation.
The value diversity (T) was calculated as the ratio of the standard deviation of indicator (σ) by its average (X). Using this value, it is possible to determine the variability of the indicators. The type of tree disposition was estimated applying the value of Clark-Evans index R [12] and its modifications by Donelli [12], angle index of Gadow [13,14]. The formulas for the estimation of the type of tree disposition are presented in Table 2.

Table 2.
Main criteria for estimation of the disposition of trees.
The structural variety of the stand can be used for the estimation of ecological diversity and the stability of the ecosystem.
3. Results and Discussion
3.1. Diameter and Height Distributions
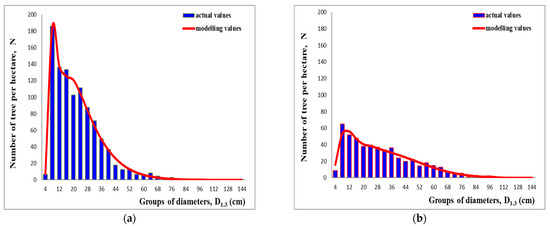
Mixed forests of the National Nature Park “Skole Beskids” and the Nature Reserve “Gorgany” grow at altitude of 700–1400 m above sea level. The differentiation of the trees by groups of diameters in the studied stands follow a bimodal distribution (Figure 2). This type of distribution is inherent to the natural forest stands with vertical diversion. In these stands, most of the trees are young with a diameter at breast height of 28 cm.

Figure 2.
Differentiation of trees by groups of diameters: (a) Nature Reserve “Gorgany”; (b) National Natural Park “Skole Beskids”.
The diameter distributions between the two studied objects is quite different. The greater number of trees per 1 ha grow in the Nature Reserve “Gorgany” (approx. 1 thousand trees per hectare), but in the National Nature Park “Skole Beskids” it is close to 500 trees per hectare. The main biometrical indexes of the studied stands by diameter and height are presented in Table 3.

Table 3.
The main biometrical indexes of the forest stands.
The variations of diameters and heights of trees on the nature reserve territories are quite high and make up more than 40%. The mode is in about 10 cm for diameter and 10 m for height. The median has considerable deviations for the diameter and the height. These results of biometrical estimation of diameter and height affirm that these stands are heterogeneous, which means that they have complex structures.
3.2. Vertical Structure
The distribution of number of trees by the vertical layers has some regularity and differs for the sample plots in the National Nature Park “Skole Beskids” and the Nature Reserve “Gorgany”. For the forest stands in the National Nature Park “Skole Beskids” the upper layer prevails (up to 60%), the lowest layer is around 30% and the middle layer is up to 20%. For the forest stands of the core zone of the Nature Reserve “Gorgany”, the three vertical layers are in the rage of 33–40%, with the lowest vertical layer containing about 40% of the trees.
The other interesting characteristic of the stands is the vertical distribution of the tree species. For the stands in the Nature Reserve “Gorgany”, the prevailing species in all vertical layers is Norway spruce (Picea abies L.). Its average contribution to the species composition is around 70%, the fir contributes up to 25% and the beech up to 5%. At the lowest vertical layer, the share of fir increases up to 30%. Swiss pine (Pinus cembra L.) is rare. This tree species grows in the high and middle vertical layers; its share in the species composition is around 1%.
For the stands in the National Nature Reserve “Skole Beskids”, the prevailing species in the vertical layers is beech (Fagus sylvatica, L.) (around 60%). The contribution of Norway spruce is 20% and fir makes up to 15%. On this territory, the share of fir of almost 20% and the share of mountain ash (Sorbus aucuparia L.) of up to 2% are observed in the lowest vertical layer. At the altitude of more than 1 thousand m, beech (Fagus sylvatica L.) prevails contributing up to 45% to the species composition, the shares of fir and Norway spruce are 25%, the share of sycamore is up to 15%.
3.3. Horizontal Structure
The main criteria of the disposition of the position of trees, the species diversity and differentiation for the stands on the nature reserve areas are presented in Table 4.

Table 4.
The main criteria of the stands estimation.
As one can see from the results of the calculations in Table 3, the natural stands in the nature reserves have mainly random and group disposition. It means that these stands have the group-random disposition of trees on the area. This type of disposition is inherent to the natural stands with the long-time absence of anthropogenic interventions and loggings. The Shannon index shows that the species diversity for the Nature Reserve “Gorgany” is average, but it is high for the National Nature Park “Skole Beskids”. Tree differentiation index by diameter is very high, but for the height, it is high. This proves the heterogeneity of the stands.
3.4. Phytomass
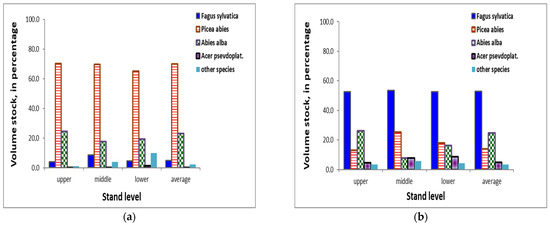
The distribution of the growing stock by the vertical layers differs considerably from the distribution by the number of trees. For the nature reserve areas, the growing stock of the upper layer contains about 80–90% of the total growing stock. It means that the dominant share of the stock is in the upper layer. The growing stock distribution by tree species in different stand layers is presented in Figure 3.

Figure 3.
Distribution of the growing stock by the stand layers and tree species: (a) Nature Reserve “Gorgany”; (b) National Nature Park “Skole Beskids”.
For the Nature Reserve “Gorgany”, where Norway spruce prevails in the forest stand composition, the growing stock of this tree species is about 70% in all the forest stand layers. For the forest stands in the National Nature Park “Skole Beskides”, where beech prevails in the forest stand composition, the growing stock of this tree species is about 55% in all stand layers. The main part of the phytomass of the forest stands in the Nature Reserve “Gorgany” is made of Norway spruce, 74%, fir, around 17%, and beech, 5%, tree species. The other tree species: birch, sycamore, Norway maple and mountain ash, contribute up to 1% of the growing stock. The carbon density of phytomass on the land covered by forests is 211 tC/ha in Nature Reserve “Gorgany”.
In the National Nature Park “Skole Beskides”, the main share of phytomass is made of beech trees, 62%, Norway spruce, 16%, and fir, 13%. The least share of phytomass (up to 5%) is made of sycamore, Norway maple, birch, Scots elm and other tree species. The carbon density of phytomass in these stands is 266 tC/ha.
The carbon density of phytmass is the highest in the upper forest stand layer, 170–250 tC/ha. The phytomass carbon density over the tree layers in the nature reserve forest stands is 220–280 tC/ha. The phytomass carbon density depends on the spatial structure of the forest stand and its species composition. The maximal values of phytomass carbon density (up to 500 tC/ha) are in the National Nature Park “Skole Beskids” in the forest stands composed of 5–7 units of beech, 4–5 units of fir and 1–2 units of Norway spruce with the group-random type of horizontal distribution and the distribution the number of trees in vertical layers of 40% in the upper layer, 15% in the middle layer and 45% in the lower layer. For the forest stands in the Nature Reserve “Gorgany”, the optimal species composition depends on altitude. Below the 900 m above sea level, the optimal stand composition is 5–6 units of fir, 2–3 units of beech and 1–2 units of Norway spruce. For the stands over 900 m above sea level, the optimal composition is 8–9 units of Norway spruce and 1–2 units of fir and admixture of Swiss pine.
4. Conclusions
Based on the analysis of horizontal and vertical structures, indexes of horizontal distribution and species diversity, we can claim that the studied forest stands are of complex structure, mixed by the tree species composition, with prevailing random and group types of tree disposition. The results of our study could be used for setting targets for forest management in artificial forest stands in similar growing conditions.
Author Contributions
Conceptualization, M.G. and M.K.; methodology, M.K., O.T. and S.H.; formal analysis, O.T.; data curation, M.K., S.H. and O.T.; writing—original draft preparation, M.G., S.H., M.K. and O.T.; writing—review and editing, M.G. All authors have read and agreed to the published version of the manuscript.
Funding
This research received no external funding.
Informed Consent Statement
Not applicable.
Data Availability Statement
The data presented in this study are available on request from the corresponding author. The data are not publicly available due to privacy restrictions.
Conflicts of Interest
The authors declare no conflict of interest.
References
- Stojko, S.M. Characteristic of primeval forests of Ukrainian Carpathian and their importance for the formation of close-to-nature sylviculture. In Natural Forests of Temperate Climate of Europe—Value and Usage, Proceedings of the International Conference 13–17 October 2003; Federal Research Institute WSL: Birmensdorf, Switzerland; Carpathian Biosphere Reserve: Rakhiv, Ukraine, 2003. (In Ukrainian) [Google Scholar]
- Smaliychuk, A.; Gräbener, U. Natural Forests of Ukrainian Carpathians; Carty i Atlasy: Lviv, Ukraine, 2008; p. 104. (In Ukrainian) [Google Scholar]
- Ancient and Primeval Beech Forests of the Carpathians and Other Regions of Europe. Available online: http://cbr.nature.org.ua/whc/whc.htm (accessed on 2 September 2022).
- Myklush, S.I.; Havryliuk, S.A. Informational content of the channels of satellite images Landsat 7 ETM+ for the vegetation interpretation. Sci. Bull. UNFU 2006, 16, 8–13. (In Ukrainian) [Google Scholar]
- Kashkin, V.B.; Suhinin, A.I. Remote Sensing from the Space; Logos: Moscow, Russia, 2001; p. 264. (In Russian) [Google Scholar]
- Lakida, P.I. Phytomass of the Forests of Ukraine: Monograph; Zbrutch: Ternopil, Ukraine, 2002; p. 256. (In Ukrainian) [Google Scholar]
- Lakida, P.; Nilsson, S.; Shvidenko, A. Estimation of forest phytomass for selected countries of the former European U.S.S.R. Biomass Bioenergy 1996, 11, 371–382. [Google Scholar] [CrossRef]
- Standard of Estimation of Aboveground Phytomass of the Trees of the Main Species in Ukraine: Reference Book; ECO-Inform: Korsun-Shevchenkivskyy, Ukraine, 2011; p. 192. (In Ukrainian)
- Tokar, O.Y.; Korol, M.M.; Shpakivska, I.M.; Dychkevich, V.M. Estimation of carbon stock in phytomass of forests using the information technologies. Sci. Bull. UNFU 2014, 24, 351–358. (In Ukrainian) [Google Scholar]
- Tokar, O.; Lesiv, M.; Korol, M. Information technology for studying carbon sink in stemwood of forest ecosystems. Econtechmod 2014, 1, 113–120. [Google Scholar]
- Tokar, O.; Gusti, M.; Vovk, O.; Havryliuk, S.; Korol, M.; Tobilevych, H. Geoinformation technology for the determination of carbon stocks in the dead organic matter of forest ecosystems in the Ukrainian Carpathians. Advances in Intelligent Systems and Computing IV. CCSIT 2019. In Advances in Intelligent Systems and Computing; Springer: Cham, Switzerland, 2020; Volume 1080, pp. 792–803. [Google Scholar]
- Pretzsch, H. Modellierung des Waldwachstums; Parey Buchverlag: Berlin, Germany, 2001; p. 341. (In German) [Google Scholar]
- Gadow, K.V. Waldstruktur und Wachstum: Beilage zur Vorlesung im Wintersemester 2003/2004; Georg-August-Universität Göttingen: Göttingen, Germany, 2003; 256p. (In German) [Google Scholar]
- Pukkala, T.; Gadow, K.V. Continuous Cover Forestry. In Managing Forest Ecosystems; Springer: Dordrecht, The Netherlands, 2012; Volume 23. [Google Scholar] [CrossRef]
Publisher’s Note: MDPI stays neutral with regard to jurisdictional claims in published maps and institutional affiliations. |
© 2022 by the authors. Licensee MDPI, Basel, Switzerland. This article is an open access article distributed under the terms and conditions of the Creative Commons Attribution (CC BY) license (https://creativecommons.org/licenses/by/4.0/).