
Framework for Evaluating Financial Impacts of Technical Risks Related to Energy-Efficient Renovation of Commercial Office Buildings †


 ,
,
Abstract
:1. Introduction
2. De-Risking Energy Efficiency in the Building Renovation Sector
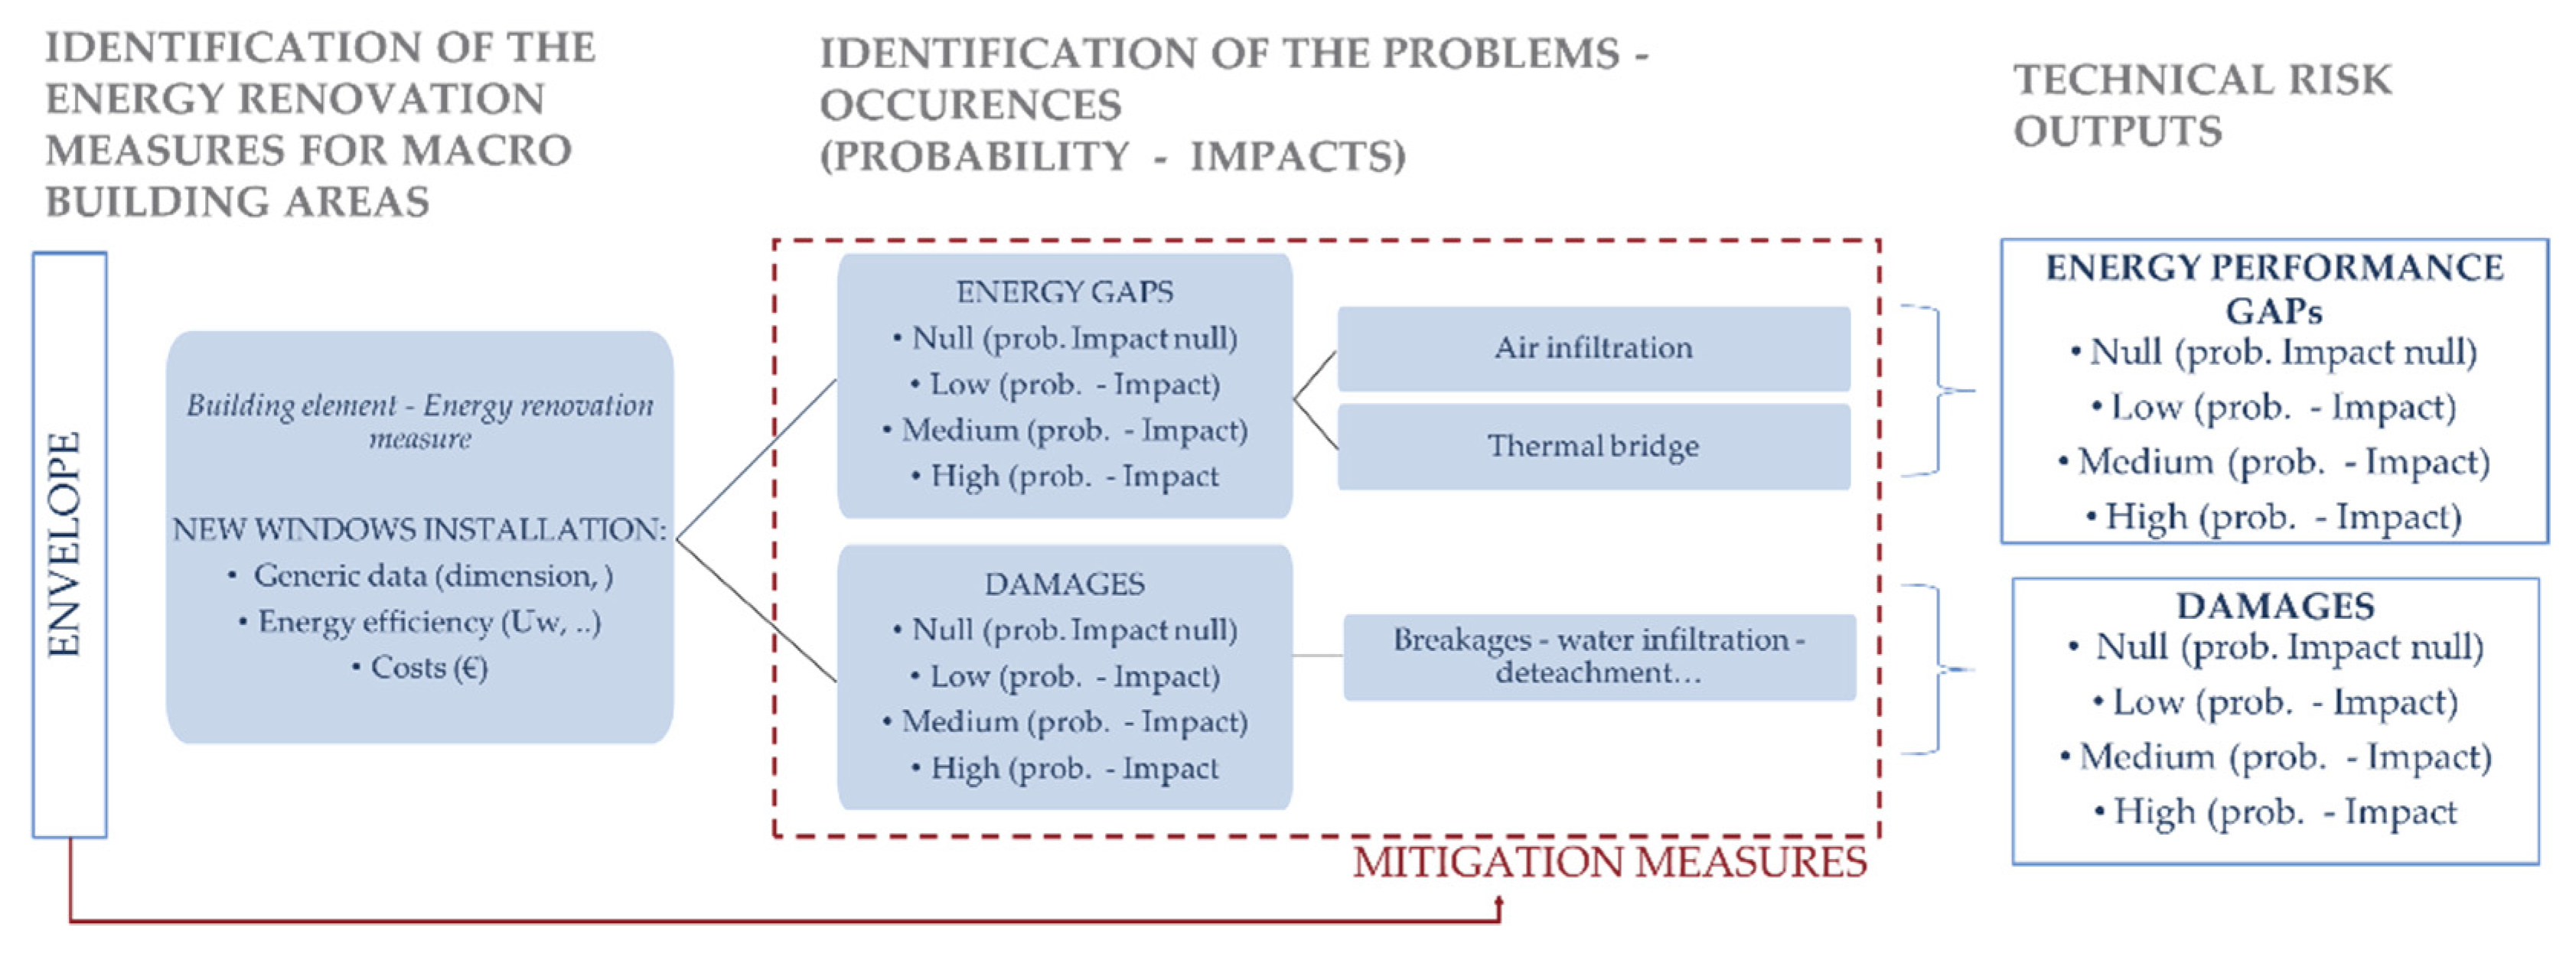
- Failure Mode and Effect Analysis (FMEA) [4], a systematic approach used in the engineering sector and for the decomposition of the building in its constitutive elements; each energy renovation measure (building component) has been associated with potential failure modes (problems/occurrences), with unique effects (impacts–probability) and mitigation measures.
- ISO 31000 standard [7] for risk management, which provides principles and a steps framework: context definition, risk identification, analysis process and mitigation measures identification.
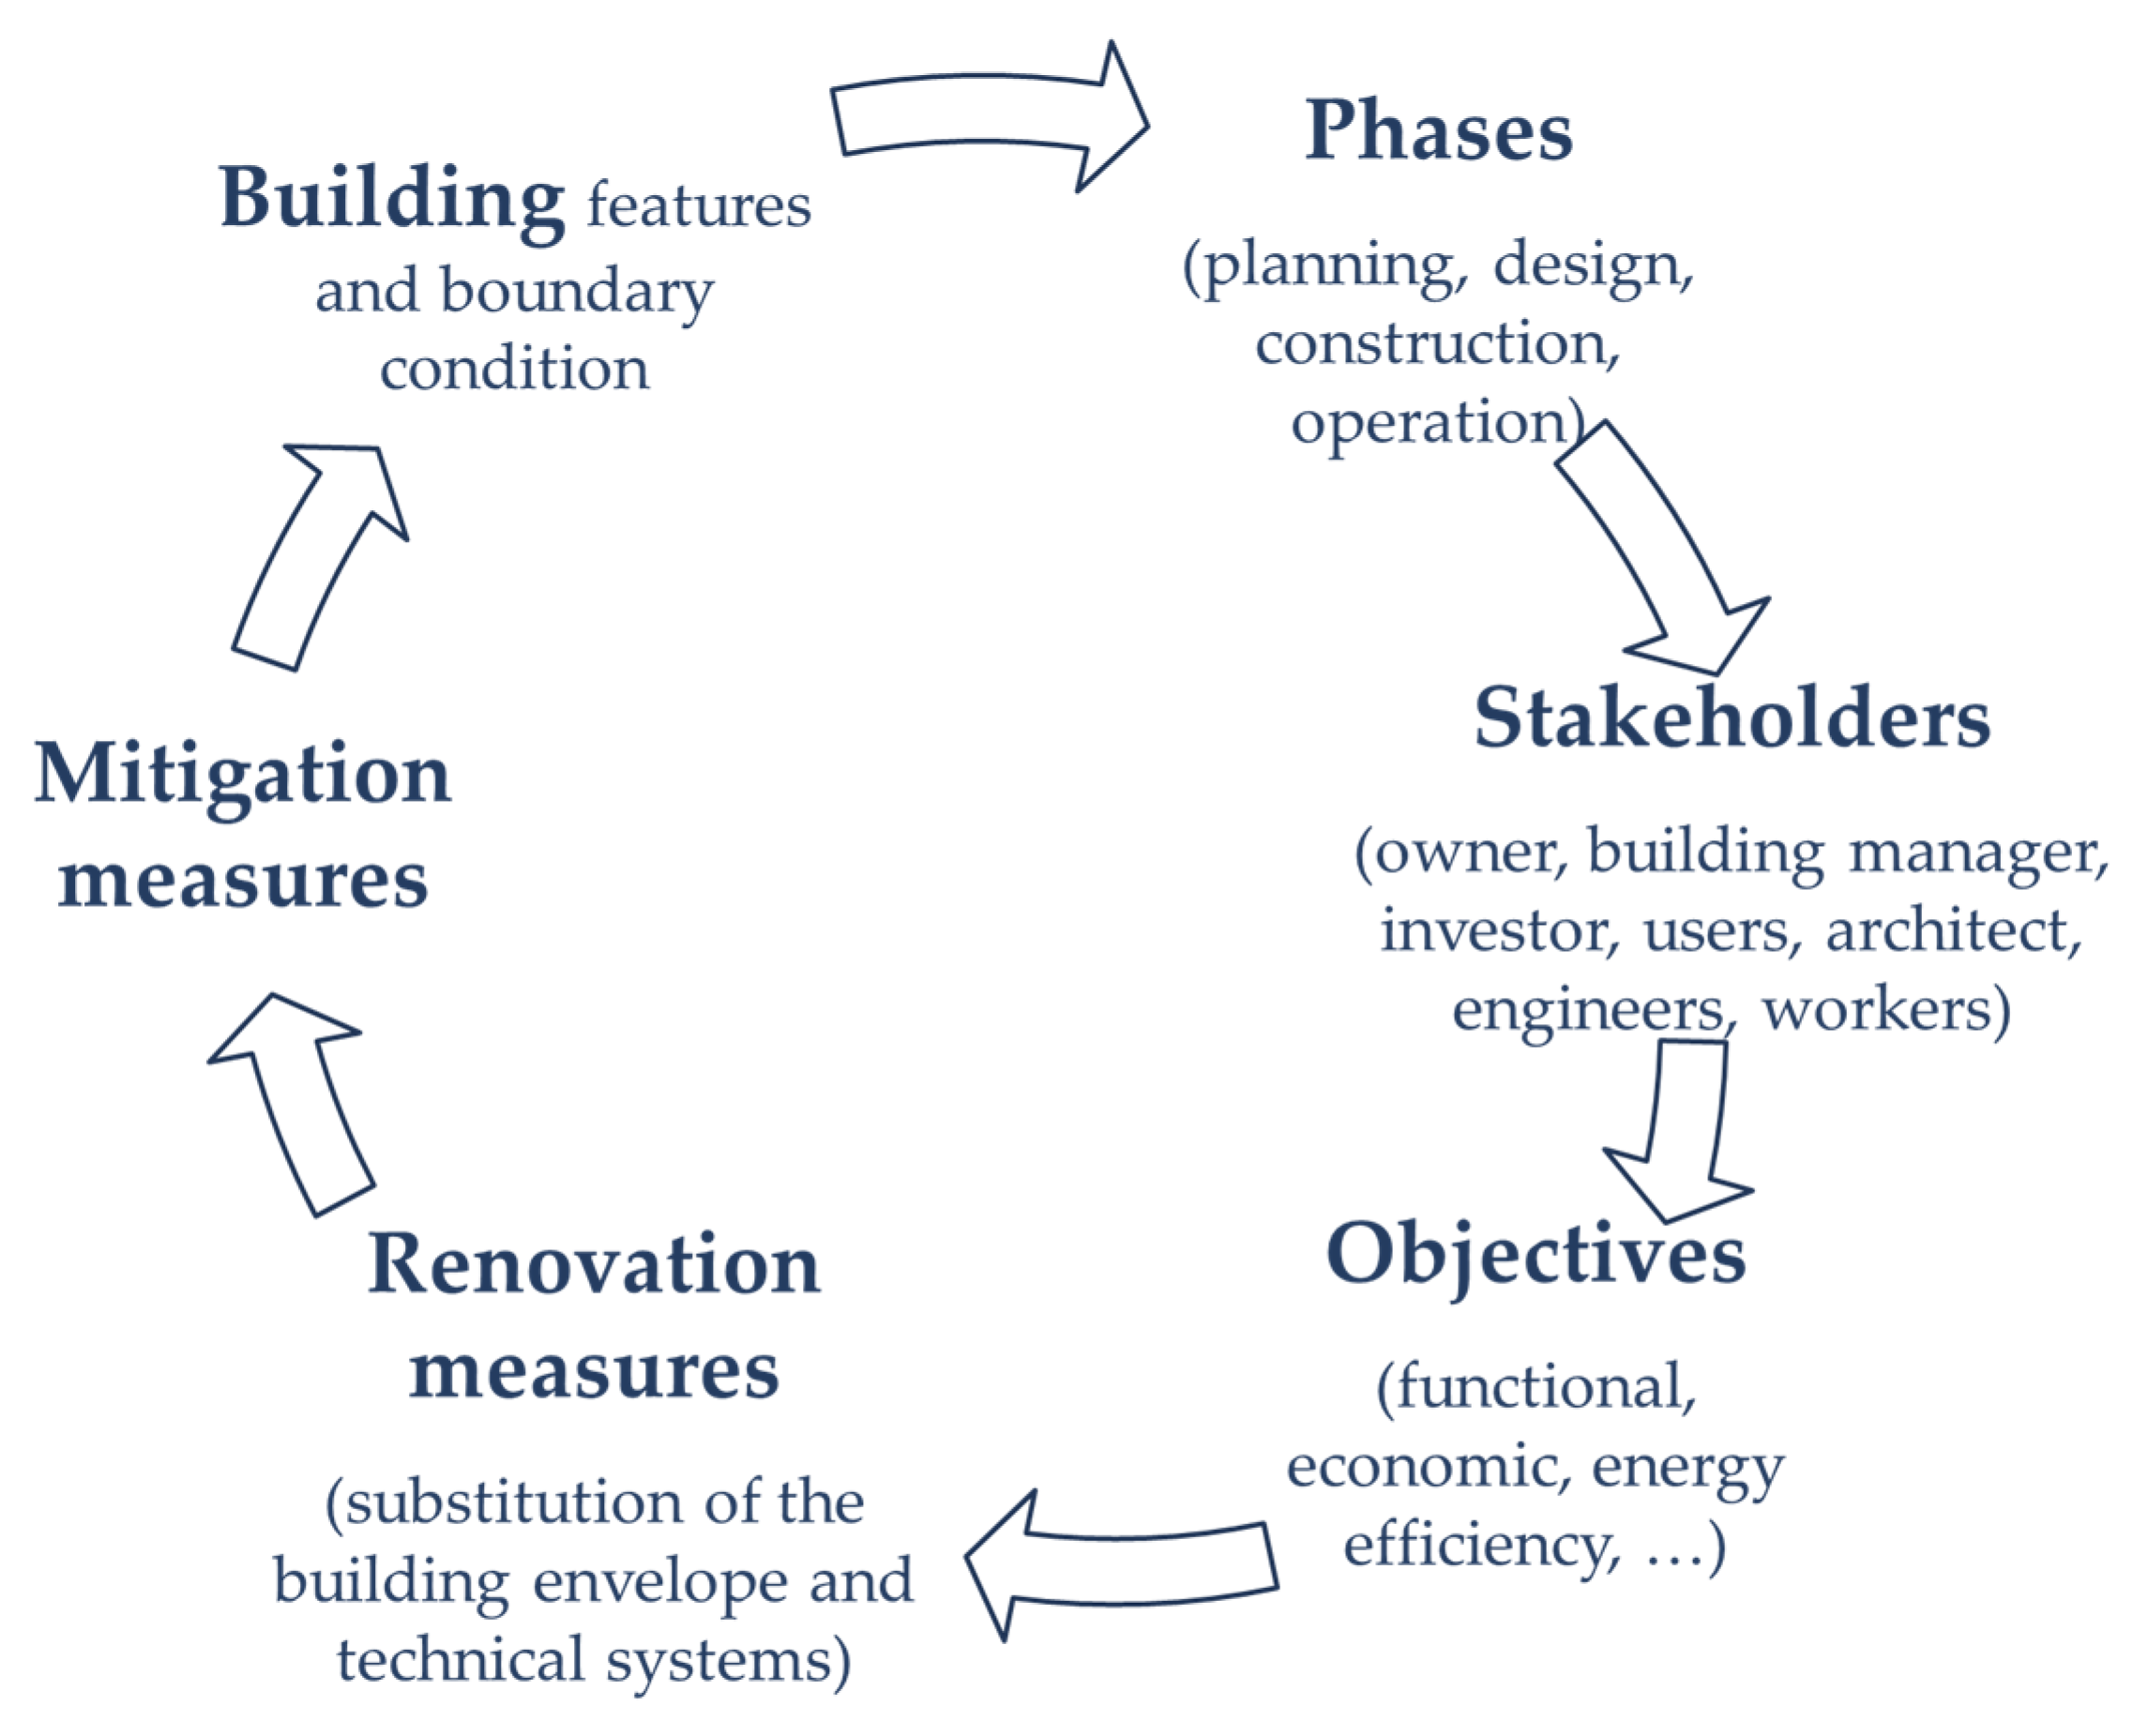
- Objectives of the renovation project (e.g., economic and energy efficiency, functional, aesthetics);
- Building features (such as architectonic characteristics) and boundary conditions;
- Renovation phases (from design to construction): requirements and goals, role of involved stakeholders and used tools;
- Renovation measures adopted for the building envelope and technical plants;
- Implemented mitigation measures (e.g., verification protocols, certification or monitoring process);
- Stakeholders involved (i.e., owners, tenants, building professional, constructors, investors).
2.1. EEnvest Key Performance Indicators
2.2. Identification of the Technical Risks
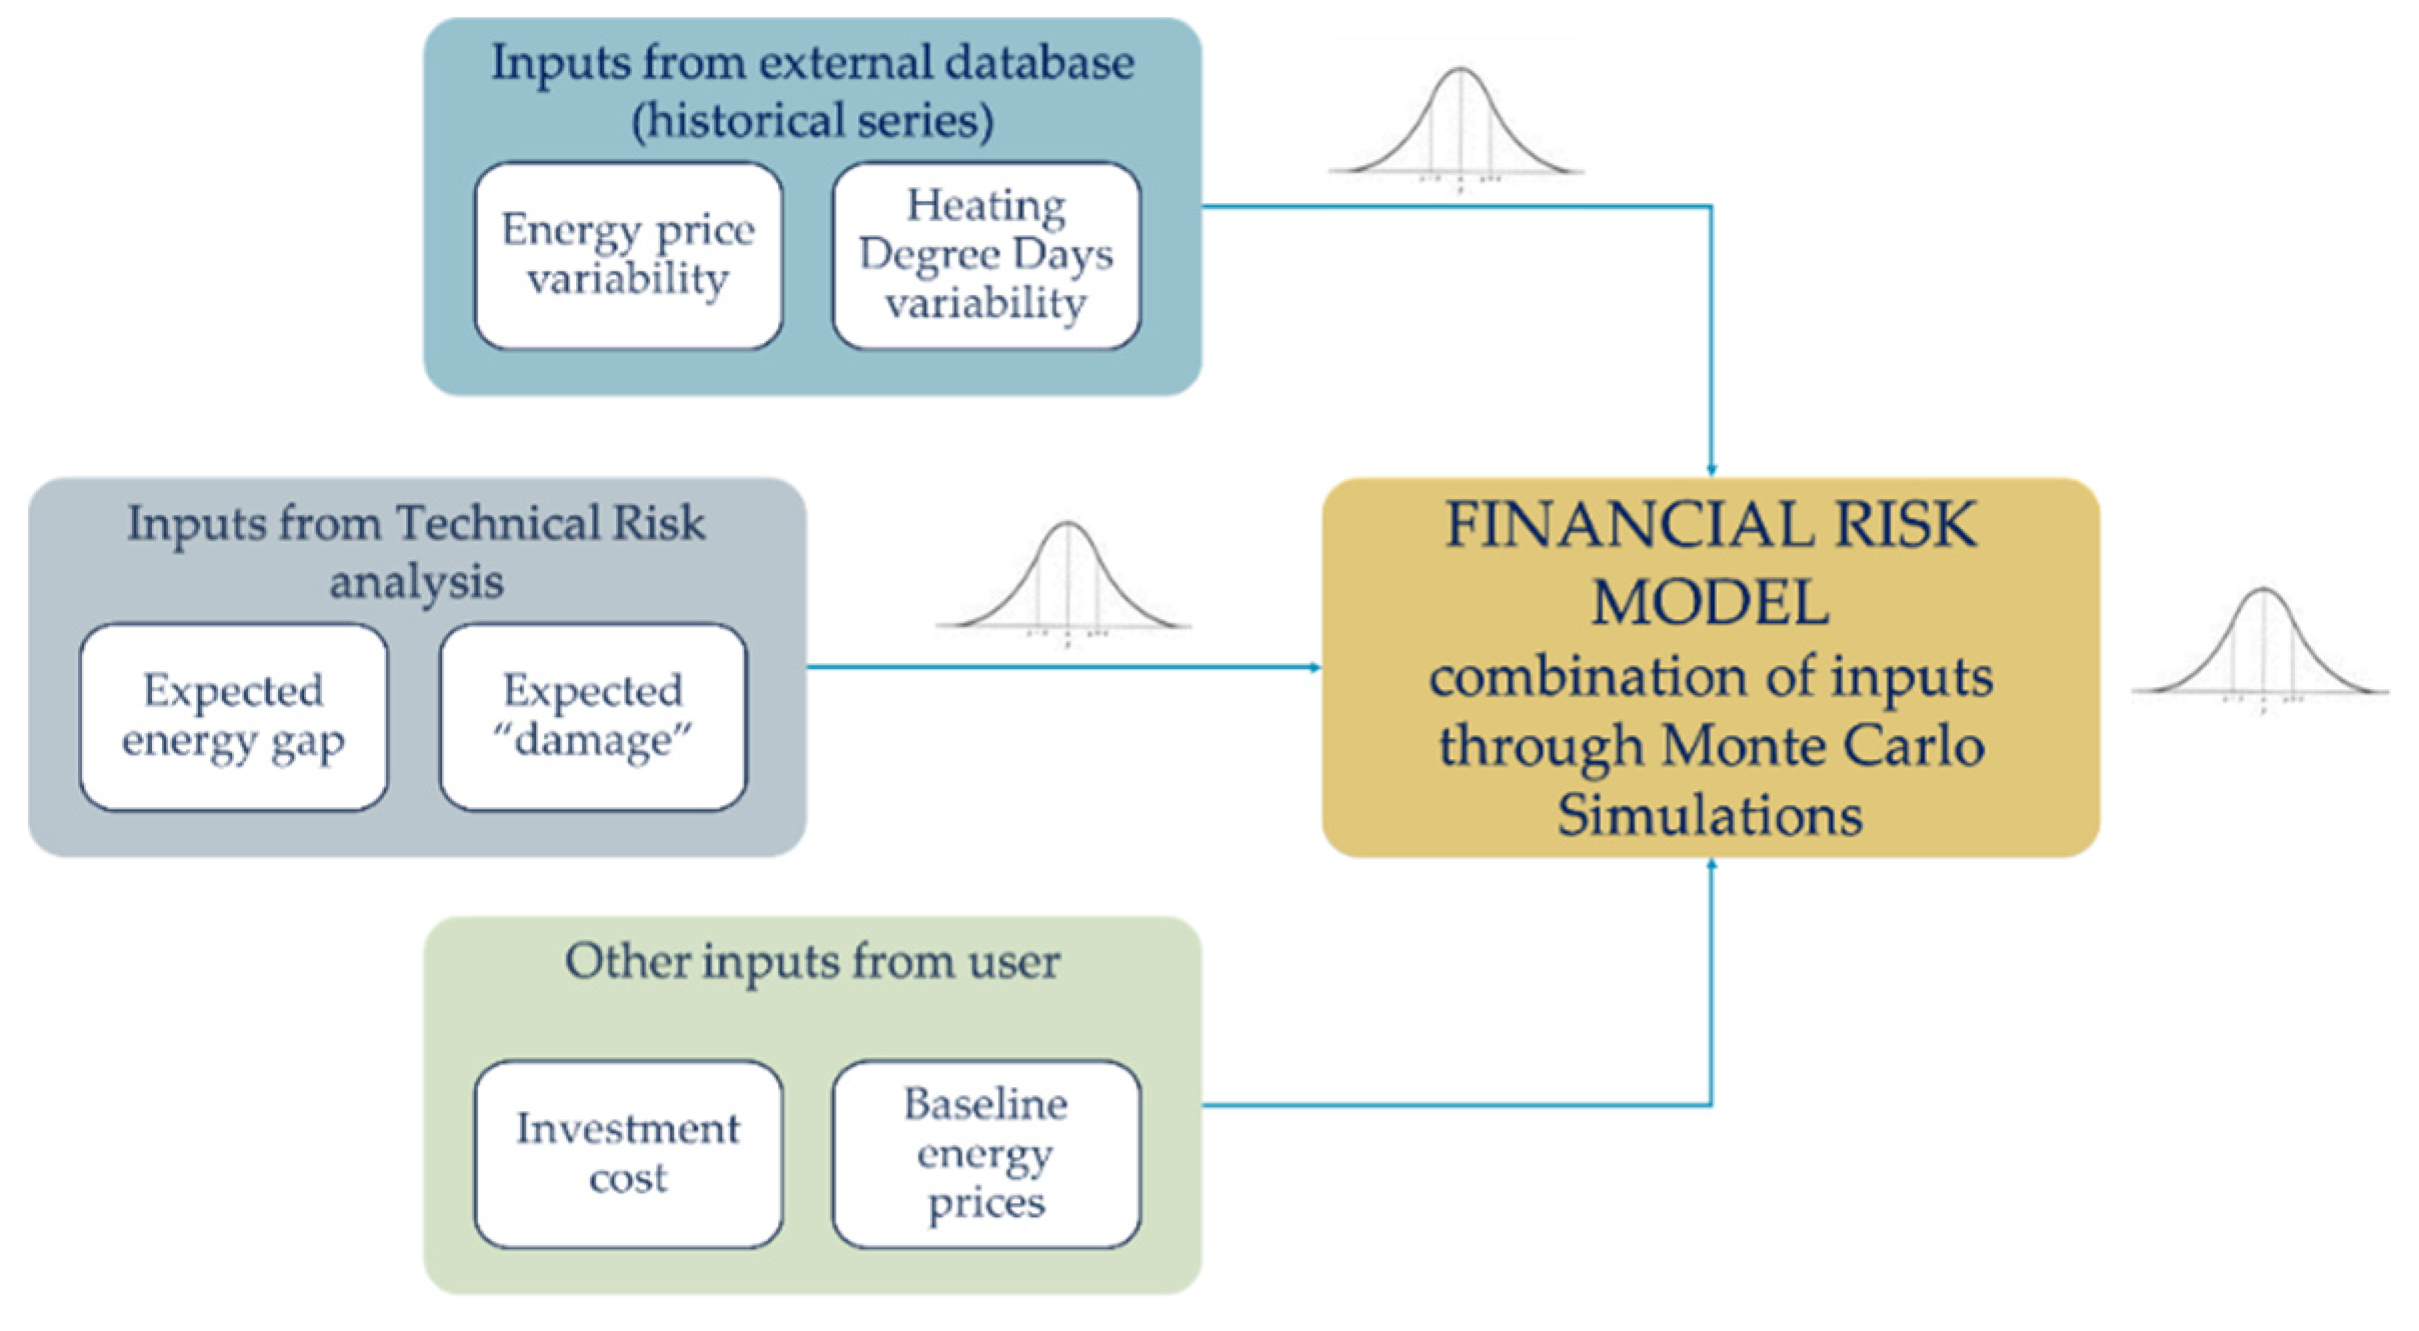
2.3. Financial Risks in Building Renovation Process
- Probability distribution of technical risks: output from technical risk analysis, it includes the probability distribution of the “energy performance gap” and of the “damage”, as defined in Table 1.
- Probability distribution of energy prices and Heating Degree Days (HDD): these two variables are calculated from historical series, extracted from external databases, and are then used to calculate the impact of the variability of energy prices and external temperature on the financial performance.
- Other inputs from the user: investment costs, financial structure, loan interest rate, etc.
2.4. EEnvest Platform Framework
3. Conclusions
Funding
Acknowledgments
References
- European Union Website. Energy Performance of Buildings Directive. Available online: https://ec.europa.eu/energy/topics/energy-efficiency/energy-efficient-buildings/energy-performance-buildings-directive_en (accessed on 28 September 2021).
- European Insulation Manufacturers Association. Available online: https://www.eurima.org/energy-efficiency-in-buildings/deep-renovation.html (accessed on 28 September 2021).
- Esser, A.; Dunne, A.; Meeusen, T.; Quaschning, S.; Wegge, D.; Hermelink, A.; Schimschar, S.; Offermann, M.; John, A.; Reiser, A.; et al. Comprehensive Study of Building Energy Renovation Activities and the Uptake of Nearly Zero-Energy Buildings in the EU. Available online: https://ec.europa.eu/energy/sites/ener/files/documents/1.final_report.pdf (accessed on 28 September 2021).
- Mecca, S.; Masera, M. Technical risk analysis in construction by means of FMEA methodology. In Proceedings of the 15th Annual ARCOM Conference, Liverpool, UK, 15–17 September 1999. [Google Scholar]
- Saaty, R.W. The analytic hierarchy process-what it is and how it is used. Math. Modes 1987, 9, 161–176. [Google Scholar] [CrossRef] [Green Version]
- Roberti, F.; Oberegger, U.F.; Lucchi, E.; Troi, A. Energy retrofit and conservation of a historic building using multi-objective optimization and an analytic hierarchy process. Energy Build 2017, 138, 1–10. [Google Scholar] [CrossRef]
- The International Organization for Standardization (ISO). ISO 31000:2009—Risk Management—Principles and Guidelines; ISO: Geneva, Switzerland, 2009. [Google Scholar]


| Technical indicators | ||
| Damage | Deviation due to technical failures, malfunctions or breakages of the building elements. | % of investment |
| Energy gap | Deviation between predicted and measured energy consumption | % of energy savings |
| Financial indicators | ||
| Payback time | The payback period refers to the amount of time an investment took to recover the initial cost, when the length of an investment time reaches a breakeven point. | Year |
| Maturity | The total duration of the project. | Year |
| Internal Rate of Return | The Internal Rate of Return (IRR) is the discount rate that makes the net present value (NPV) of a specific project equal to zero. | % |
| Net Present Value on Investment | The Net Present Value (NPV) is the value of all future cash flows (positive and negative) over the entire life of an investment discounted to the present. The Net Present Value on Investment (NPV/INV) is a ratio between the Net Present Value (NPV) and the Investment (INV). It gives a measure of the profitability of the project. | % |
| Debt–Service Coverage Ratio | Debt–Service Coverage Ratio (DSCR) is an indicator of the project’s ability to repay a debt. It is calculated as the ratio between the operative cash flows generated by the project and the cash flows for debt, lease or other obligation (debt service, both for interests and principal payment) due in one year. | % |
Publisher’s Note: MDPI stays neutral with regard to jurisdictional claims in published maps and institutional affiliations. |
© 2021 by the authors. Licensee MDPI, Basel, Switzerland. This article is an open access article distributed under the terms and conditions of the Creative Commons Attribution (CC BY) license (https://creativecommons.org/licenses/by/4.0/).
Share and Cite
Andaloro, A.; Salvalai, G.; Fregonese, G.; Tso, L.; Paoletti, G. Framework for Evaluating Financial Impacts of Technical Risks Related to Energy-Efficient Renovation of Commercial Office Buildings. Environ. Sci. Proc. 2021, 11, 32. https://doi.org/10.3390/environsciproc2021011032
Andaloro A, Salvalai G, Fregonese G, Tso L, Paoletti G. Framework for Evaluating Financial Impacts of Technical Risks Related to Energy-Efficient Renovation of Commercial Office Buildings. Environmental Sciences Proceedings. 2021; 11(1):32. https://doi.org/10.3390/environsciproc2021011032
Chicago/Turabian StyleAndaloro, Annalisa, Graziano Salvalai, Gabriele Fregonese, Linda Tso, and Giulia Paoletti. 2021. "Framework for Evaluating Financial Impacts of Technical Risks Related to Energy-Efficient Renovation of Commercial Office Buildings" Environmental Sciences Proceedings 11, no. 1: 32. https://doi.org/10.3390/environsciproc2021011032