Abstract
This paper presents an assessment of the impacts of the different tools implemented within the inteGRIDy project through the analysis of key performance indicators (KPIs) that appropriately reflect the technical and economic domains of the inteGRIDy thematic pillars, comprising demand response and battery storage systems. The evaluation is based on improvements brought about by individual components of the inteGRIDy-enabled smart solution across the Isle of Wight (IOW) pilot site. The analyses and the interpretation of findings for the pilot use case evaluation are presented. The results indicate that the smart solution implementation across the IOW pilot site resulted in achieving the inteGRIDy set objectives. Overall, a 93% reduction in energy consumption, equivalent to 643 kWh was achieved, via the M7 energy storage system and heat pumps developed as part of inteGRIDy solution. Additionally, the grid efficiency and demand flexibility contribution to the distribution network operator (DNO)-triggered DR services, based on a 10% increase/decrease in demand, resulted in stabilizing the grid efficiency.
1. Introduction
Renewable energy sources such as solar and wind are intermittent and depend on the weather and the time of day [1]. If fully relied upon, renewable energy generation can cause fluctuations in the energy system’s frequency. Energy storage systems act as a powerful buffer to mitigate this problem [2]. A comprehensive review carried out by Koohi-Fayegh and Rosen [3] classified energy storage types into electrochemical and battery [4], thermal [5], thermochemical [6], flywheel [7], compressed air [8], pumped, magnetic, and chemical or hydrogen [9,10]. Similarly, heat pumps are becoming increasingly popular due to their reduced carbon footprint and the significant efficiencies they can offer in both domestic and commercial applications [11]. The combination of heat pumps with thermal energy storage for heating has also been studied [12]. This system stores thermal energy and then allows for its transfer through a heating storage medium such as water that can be used later to provide hot water and heating. Optimization of these systems is essential for two main reasons. Firstly, to ensure the installations are financially and environmentally better than conventional heating systems. Secondly, because the systems are highly dependant on local weather conditions, energy tariffs, building occupancy and types, and government subsidies [13].
Demand response (DR) is the voluntary shifting of electricity demand by consumers either due to changes in prices of electricity over time [14] or through participation with an aggregator, for which the consumer is rewarded [15]. Price-based DR is implemented through approved utility tariffs or via contractual agreement in deregulated markets where electricity prices are varied over time to encourage customers to alter their consumption patterns [16]. Incentive-driven DR rewards customers for increasing, holding, or decreasing their electric loads upon request from the aggregator in order to achieve grid stability [17]. Both types of DR enable the consumer to play a vital role in balancing electricity demand and supply by shifting their electricity usage [18], thereby improving the reliability of power systems by lowering peak demand and reducing the overall plant and capital cost investments associated with network upgrades. DR was achieved in the IOW pilot site through the deployment of an advanced building response system—a multi-layered suite of applications which allowed energy reduction, peak management, and flexibility management within industrial and commercial buildings.
In this paper, the evaluation and assessment of the IOW pilot use cases is reported based on selected KPIs that showed significance for both DR and energy storage use case objectives and project goals. A methodology for both data collection and KPI evaluation was established, followed by the comparative assessement of the baseline scenario against the smart solution implementation. Overall, the obtained results were indicative of the success of the project in terms of achieving technical (demand flexibility) and economic (retail cost of energy) benefits.
The remainder of the paper is organized as follows. Section 2 describes the data collection and evaluation methodology. Section 3 presents the case studies, focusing on the description of the pilot site and the specification of the use cases. In Section 4, the results and analyses are presented. Section 5 concludes the paper and presents suggestions for future work, followed by references.
2. Data Collection and Evaluation Methodology
2.1. Data Collection
Both qualitative and quantitative data collection methods were established and used for the baseline assessment and the smart solution implementation scenarios. For the qualitative data collection method, bespoke questionnaires that aimed to address the use case objectives were designed. For the quantitative analyses, data were obtained from different sources such as the building management system (BMS) and building automation system (BAS), conventional and smart meters, battery management systems’ smart sensors, and online web services. A flexible platform with remote capabilities was required to visualize and share information and data. The Siemens Navigator platform was in place to provide access to building data via the BMS.
2.2. Evaluation Methodology
The evaluation process started with the definition and analysis of the KPI evaluation parameters that showed significance for the goals and objectives of the use cases. This was followed by the selection of an appropriate evaluation methodology regarding achievement of the use case goal. The evaluation of the KPIs was carried out based on data collection through the established mechanisms. The evaluation was carried out following an iterative process that comprised the required steps while ensuring that all the tasks were appropriately covered. The evaluated KPIs naturally evolved after close interaction with the pilot partners. For the KPI evaluation, the baseline (prior to the implementation of smart technologies) scenario was compared with the smart solution implementation. The performance was assessed across technical and economic domains. KPIs related to demand flexibility were evaluated considering the requested and potential energy demand flexibility based on the contractual framework applicable to the IOW pilot site.
3. Case Study
3.1. Pilot Site Description
The aim of the IOW pilot was to provide an energy management platform that controlled the load to match the dispatch of energy onto the local network. The pilot was focused on facilitating the increase in distributed generators (DGs), which is impeded by a constrained grid that subjects the integration of new generators to a greater risk of curtailment. Load shifting was required to reduce the current curtailment and create sufficient network capacity for new energy generators in the IOW. This can be achieved through demand flexibility activities aimed at stabilizing the grid.
3.2. Specification of Use Case
The inteGRIDy pillars under consideration in this use case were DR and energy storage technologies. The use cases applicable to the thematic pillar deal with the impact of DR technologies in residential settings, through thermal storage. In essence, the M7 heat pump control hub tool and the Siemens (SIE) virtual power plant (VPP) for advanced building management control technologies were both developed, tested, and deployed to provide the flexibility to shift load and stabilize the grid. The M7 thermal storage system was connected to the grid and to several domestic heating systems to enable balancing of the grid. This system was installed in residential buildings in the IOW. The SIE VPP for advanced building management control technology was connected to both the grid and the energy management system, to provide flexibility services. The deployment of both tools included software and cloud-based data collection.
4. Results and Analysis
To demonstrate the smart solution implementation at the IOW pilot site, we present the results and analyses for two use cases. First, the energy storage system use case based on heat pumps; second, the building optimization aimed at maximizing demand flexibility, minimizing costs, and reducing environmental impact.
4.1. M7 Energy Storage System Use Case
The results presented in this use case demonstrate the impact of the smart implementation compared with the baseline scenario in representative technical- and economic-domain-related KPIs, showing residential energy consumption and the retail cost of energy. Analyses of the energy consumption data for both the baseline and the smart solutions were carried out over 12 months, during the period from July 2017 to June 2018. The results for the two performance domains are presented.
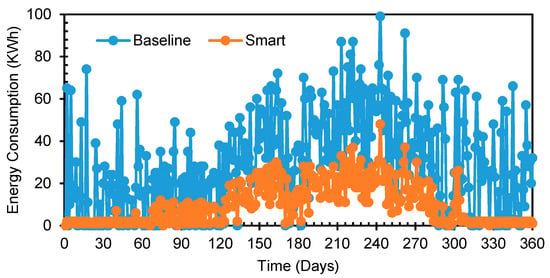
Technical: The smart solutions implementation achieved a significant reduction of 643 kWh. This resulted in a percentage decrease of 93% against the baseline energy consumption. The overall energy consumption across the 12-month evaluation period is presented in Figure 1 below.

Figure 1.
Overall energy consumption (12 months of data, July 2017 to June 2018).
As can be seen from the figure, there was a significant difference between the baseline and the smart solution, as expected. This is an indication of the positive impact of the smart implementation of the energy storage system use case at the IOW pilot site.
Economic: Table 1 presents the economic KPI results for the M7 energy storage use case. The retail cost of energy and the average cost of energy consumption for both the baseline and the smart solutions are presented using an energy tariff of GBP 0.1350. A percentage difference of 68% was obtained in the retail cost of energy between the baseline and the smart solution.

Table 1.
Economic KPI results for M7 energy storage use case.
4.2. Building Optimization Use Case
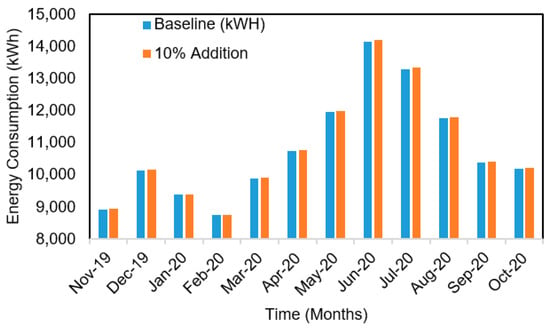
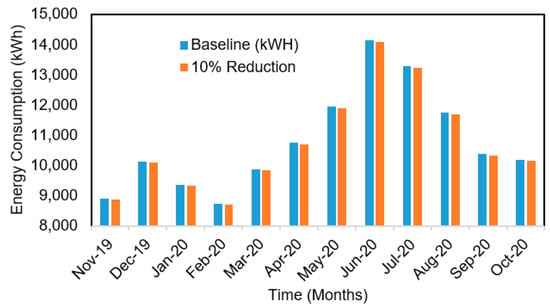
The results for the building optimization based on a 10% increase/decrease in demand are presented in Figure 2 and Figure 3. Although the differences between the two figures are not clearly visible, the main aim of optimizing the grid’s efficiency was achieved, based on the requested demand participation from the DNO.

Figure 2.
Baseline and 10% energy demand addition results.

Figure 3.
Baseline and 10% energy demand reduction results.
Economic: The KPI results in the economic domain (retail cost of energy and the average cost of energy consumption) are presented in Table 2 below.

Table 2.
Economic KPI results for building optimization use case.
5. Conclusions
The work presented in this paper demonstrated the impacts of the inteGRIDy-enabled smart solutions deployed in the IOW pilot. The results for the baseline scenario (the situation prior to the inteGRIDy project) were assessed against the smart solution implementation (the results of the activities during the project). A reduction of 93% in energy consumption, equivalent to 643 kWh, was achieved with the M7 energy storage system and heat pumps. Additionally, the assessment of grid efficiency and the demand flexibility contribution to the DNO-triggered demand response services were based on a 10% increase/decrease in demand, which resulted in stabilizing the grid efficiency. Future work will assess and evaluate the remainder of the InteGRIDy pilot site use cases based on thematic pillars such as developing a smart distribution grid and electric vehicles (EVs).
Author Contributions
Conceptualization, C.O., H.D. and T.A.; methodology, C.O., H.D., T.A. and B.G.; software, C.O. and B.G.; validation, C.O., T.A. and H.D.; formal analysis, C.O., H.D. and T.A.; investigation, C.O., H.D. and N.D.; resources, N.D.; data curation, C.O., H.D. and T.A.; writing—original draft preparation, C.O. and T.A.; writing—review and editing, C.O., H.D., T.A., B.G. and N.D.; visualization, C.O. and T.A.; supervision, H.D.; project administration, C.O., H.D. and N.D.; funding acquisition, N.D. All authors have read and agreed to the published version of the manuscript.
Funding
The work presented in this paper was carried out as part of the inteGRIDy project, co-funded by the EU’s Horizon 2020 Framework Programme for Research and Innovation under grant No. 731628. The authors wish to acknowledge the European Commission for their support, the efforts of the project partners, and the contributions of all those involved in the inteGRIDy project.
Data Availability Statement
The data that supports the findings of this study are available from the inteGRIDy consortium through the first author, but restrictions apply to the availability of these data which were used under license for the current study and so are not publicly available.
Acknowledgments
The authors acknowledge the support provided by Hamish Wilson (M7), Hugh Wilson (M7) and Tom O’Reilly (Siemens) in the project evaluation from which this paper has arisen.
Conflicts of Interest
The authors declare no conflict of interest.
References
- Cavallo, A.J. Energy Storage Technologies for Utility Scale Intermittent Renewable Energy Systems. J. Sol. Energy Eng. 2001, 123, 387–389. [Google Scholar] [CrossRef]
- Zhang, L.; Hu, X.; Wang, Z.; Ruan, J.; Ma, C.; Song, Z.; Dorrell, D.G.; Pecht, M.G. Hybrid electrochemical energy storage systems: An overview for smart grid and electrified vehicle applications. Renew. Sustain. Energy Rev. 2020, 139, 110581. [Google Scholar] [CrossRef]
- Koohi-Fayegh, S.; Rosen, M.A. A review of energy storage types, applications and recent developments. J. Energy Storage 2020, 27, 101047. [Google Scholar] [CrossRef]
- Goodenough, J.B. Electrochemical energy storage in a sustainable modern society. Energy Environ. Sci. 2014, 7, 14–18. [Google Scholar] [CrossRef]
- Sarbu, I.; Sebarchievici, C. A comprehensive review of thermal energy storage. Sustainability 2018, 10, 191. [Google Scholar] [CrossRef] [Green Version]
- Prasad, J.S.; Muthukumar, P.; Desai, F.; Basu, D.N.; Rahman, M.M. A critical review of high-temperature reversible thermochemical energy storage systems. Appl. Energy 2019, 254, 113733. [Google Scholar] [CrossRef]
- Pullen, K.R. The status and future of flywheel energy storage. Joule 2019, 3, 1394–1399. [Google Scholar] [CrossRef]
- Zeynalian, M.; Hajialirezaei, A.H.; Razmi, A.R.; Torabi, M. Carbon dioxide capture from compressed air energy storage system. Appl. Therm. Eng. 2020, 178, 115593. [Google Scholar] [CrossRef]
- Beshr, E.H.; Abdelghany, H.; Eteiba, M. Novel optimization technique of isolated microgrid with hydrogen energy storage. PLoS ONE 2018, 13, e0193224. [Google Scholar] [CrossRef] [PubMed] [Green Version]
- Li, B.; Chen, M.; Ma, Z.; He, G.; Dai, W.; Liu, D.; Zhang, C.; Zhong, H. Modelling integrated power and transportation sectors decarbonization with hydrogen energy storage. IEEE Trans. Ind. Appl. 2021. [Google Scholar] [CrossRef]
- Chua, K.J.; Chou, S.K.; Yang, W.M. Advances in heat pump systems: A review. Appl. Energy 2010, 87, 3611–3624. [Google Scholar] [CrossRef]
- Arteconi, A.; Hewitt, N.J.; Polonara, F. Domestic demand-side management (DSM): Role of heat pumps and thermal energy storage (TES) systems. Appl. Therm. Eng. 2013, 51, 155–165. [Google Scholar] [CrossRef]
- Renaldi, R.; Kiprakis, A.; Friedrich, D. An optimisation framework for thermal energy storage integration in a residential heat pump heating system. Appl. Energy 2017, 186, 520–529. [Google Scholar] [CrossRef] [Green Version]
- Albadi, M.H.; El-Saadany, E.F. Demand Response in Electricity Markets: An Overview. In Proceedings of the 2007 IEEE Power Engineering Society General Meeting, Tampa, FL, USA, 24–28 June 2007; pp. 1–5. [Google Scholar] [CrossRef]
- Cretu, M.; Ceclan, A.; Czumbil, L.; Şteţ, D.; Bârgăuan, B.; Micu, D.D. Key Performance Indicators (KPIs) for the Evaluation of the Demand Response in the Technical University of Cluj-Napoca Buildings. In Proceedings of the 2019 8th International Conference on Modern Power Systems (MPS), Cluj, Romania, 21–23 May 2019; pp. 1–4. [Google Scholar] [CrossRef]
- Baltputnis, K.; Zane, B.; Sauats, A. Analysis of the potential benefits from participation in Explicit and Implicit Demand Response. In Proceedings of the 2019 54th IEEE Internation Universities Power Engineering Conference, Bucharest, Romania, 3–6 September 2019. [Google Scholar]
- Qdr, Q. Benefits of Demand Response in Electricity Markets and Recommendations for Achieving Them; U.S. Department Energy: Washington, DC, USA, 2006. [Google Scholar]
- Goldman, C. Coordination of Energy Efficiency and Demand Response; Lawrence Berkeley National Laboratory: Berkeley, CA, USA, 2010. [Google Scholar]
Publisher’s Note: MDPI stays neutral with regard to jurisdictional claims in published maps and institutional affiliations. |
© 2021 by the authors. Licensee MDPI, Basel, Switzerland. This article is an open access article distributed under the terms and conditions of the Creative Commons Attribution (CC BY) license (https://creativecommons.org/licenses/by/4.0/).