Article

Projecting Urban Expansion by Analyzing Growth Patterns and Sustainable Planning Strategies—A Case Study of Kamrup Metropolitan, Assam, North-East India

1
Centre for Climate Change & Water Research, Suresh Gyan Vihar University, Jaipur 302017, India
2
Department of Geography, School of Environment and Earth Sciences, Central University of Punjab, Bathinda 151401, India
3
Centre for Sustainable Development, Suresh Gyan Vihar University, Jaipur 302017, India
4
Department of Ecosystem Studies, Graduate School of Agricultural and Life Sciences, The University of Tokyo, Tokyo 113-8654, Japan
5
Institute for Global Environmental Strategies, Hayama 240-0115, Japan
*
Authors to whom correspondence should be addressed.
Earth 2024, 5(2), 169-194; https://doi.org/10.3390/earth5020009
Submission received: 31 March 2024 / Revised: 20 May 2024 / Accepted: 21 May 2024 / Published: 27 May 2024

Abstract

:
This research focuses on the urban expansion occurring in the Kamrup Metropolitan District—an area experiencing significant urbanization—with the aim of understanding its patterns and projecting future growth. The research covers the period from 2000 to 2022 and projects growth up to 2052, providing insights for sustainable urban planning. The study utilizes the maximum likelihood method for land use/land cover (LULC) delineation and the Shannon entropy technique for assessing urban sprawl. Additionally, it integrates the cellular automata (CA)-Markov model and the analytical hierarchy process (AHP) for future projections. The results indicate a considerable shift from non-built-up to built-up areas, with the proportion of built-up areas expected to reach 36.2% by 2032 and 40.54% by 2052. These findings emphasize the importance of strategic urban management and sustainable planning. The study recommends adaptive urban planning strategies and highlights the value of integrating the CA Markov model and AHP for policymakers and urban planners. This can contribute to the discourse on sustainable urban development and informed decision-making.

1. Introduction

Urbanization, a phenomenon that has rapidly altered the landscape in an unplanned manner, leads to various issues such as landscape fragmentation, decreased arable land, increased urban poverty, and environmental degradation [1,2]. The United Nations predicts that by 2050, urban areas will cover 60% of the world’s rural populations [3]. The impact of urbanization and high population on land use and LULC causes substantial changes to the Earth’s surface at local, regional, and global scales over extended periods [4]. The transformation from agrarian, rural communities to industrially driven urban centers has significantly altered the landscape, converting natural terrains into urban sprawls and intensifying the issue of urban sprawl [5]. These deliberate modifications to the land have far-reaching effects on the ecological balance and the cyclical patterns of the Earth’s climate [6]. In order to create sustainable development strategies for these regions, it is crucial to observe and analyze the evolution of urban areas over time [7]. Urbanization, often associated with the process of modernization, introduces a range of challenges, including uncontrolled expansion and the depletion of natural resources, which are particularly prominent in the context of development [8]. Urban expansion encompasses various factors, including spatial, temporal, and socioeconomic elements, highlighting the significance of cities as centers of population and economic activity [9]. Therefore, it is crucial for local governments to develop models to understand urban sprawl in areas such as Kamrup Metro to address the needs of their communities and work towards sustainable urban development. It is worth noting that previous research on the Kamrup Metropolitan District has been limited, particularly in terms of employing forecasting models such as cellular automata (CA)-Markov and the analytical hierarchy process (AHP) to predict urbanization scenarios, given the region’s historical significance as a center of power in Assam’s history. This study aims to address this gap by utilizing these models to comprehensively analyze time series data on urban settlements. The CA-Markov model with AHP offers a robust method for predicting urban growth and aiding in urban planning decisions [10]. CA models simulate changes in land use by dividing an area into cells and applying rules based on the cells’ surroundings [11]. The Markov model predicts future land use changes based on past trends [12], while AHP helps prioritize options based on various criteria [13]. Additionally, using Shannon entropy to analyze urban land cover can help understand the diversity and fragmentation of urban areas [14]. Higher entropy values indicate more diverse and fragmented urban landscapes, typical of sprawl, while lower values suggest more uniform, compact urban development [15].
Ref. [16] examines the transformation of Northeast India since its independence, emphasizing the significant influence of political unrest, militarization, and governance challenges on the region’s development. His study details the shift in academic and policy focus toward urbanization and rural-to-urban migration, spurred by governmental initiatives such as the Atal Mission for Rejuvenation and Urban Transformation and the Smart Cities Mission. Additionally, Verma discusses the impact of India’s Act East policy, which aims to enhance crossborder trade by developing border towns such as Dawki, Champhai, Moreh, and Pangsau, marking a significant shift in regional development strategies. However, this urban transformation has faced opposition from local communities. Ref. [17] study addressed Assam’s significance within the framework of India’s regional connectivity policy, notably through proposed corridors such as the Guwahati-Chittagong and Guwahati-Kunming corridors. The Guwahati-Kunming Corridor, spanning 2276 km, originates from Guwahati in Assam, traverses Nampong in Arunachal Pradesh, and extends through Shindbwiyang, Bhamo and Myitkyina in Kachin (Myanmar), ultimately linking the Ledo-Burma road junction to the city of Kunming in China. These corridors hold promise for fostering subregional co-operation initiatives such as BCIM, ASEAN, SAARC, and Greater Mekong Subregion Cooperation (GMS). According to [18], the urban population in Assam state in 2011 was approximately 4,398,542 individuals, which constituted around 14.10% of the total population. Among the districts in the state, Kamrup Metro District had the highest urban population, amounting to 1,037,011 individuals, which was equivalent to 82.9% of the district’s population.
Urbanization is mainly driven by demographic growth and rural-urban migration prompted by poverty [19] emphasizes that rapid urbanization often leads to the proliferation of slums, resulting in issues such as poverty, unemployment, inequality, exploitation, and a decline in the quality of urban life. Numerous research endeavors have highlighted the effectiveness of integrating CA-Markov and AHP models in forecasting urban growth. Previous research conducted by [20] was centered on the utilization of CA-Markov chain model methodologies to evaluate the patterns of urban expansion within the swiftly evolving Thimphu city area of Bhutan. Their investigation revealed substantial increments in developed land areas from 2002 to 2018, alongside obvious environmental impacts. The projections derived from their analysis indicate a potential two-fold augmentation of urbanized regions by the 2050s, thereby emphasizing the imperative need for embracing green economy principles to safeguard ecological integrity and ensure economic sustenance. Within the framework of the Kamrup Metropolitan study, the acknowledgment pertaining to the neighboring nation of Bhutan, which shares physiographic similarities, yielded valuable insights [20]. The study by [21], which covers the spatiotemporal urban dynamics of the Kolkata Metropolitan Area (KMA), utilizes the SLEUTH model to predict urban growth and its environmental impacts, revealing organic growth patterns and peripheral expansion. This study underscores the importance of modeling and planning for sustainable urban development. Understanding these dynamics in Kolkata can inform strategies for managing rapid urbanization in Kamrup Metropolitan District, helping to anticipate growth patterns, mitigate environmental degradation, and implement sustainable policies effectively.
Ref. [22] enhanced urban expansion projects by combining an artificial neural network (ANN) with a CA-Markov chain (CA-MC), showing superior performance compared to traditional models. Their projections indicate significant urban development in South Auckland by 2026, primarily converting the grasslands within designated urban growth areas. A study by [23]) that was published in Remote Sensing examines the surge in urban areas in Nepal’s Tarai, revealing the significant transformation of agricultural land to urban sprawl from 1989 to 2016. By using ANN and MC models for prediction, the research anticipates a continued expansion of urban settlements at the expense of agriculture, highlighting critical concerns for food security and the need for strategic land-use planning in Nepal. Another study investigated land use/land cover changes in Salem, India, from 2001 to 2020, using CA-Markov and geospatial techniques. It predicted a substantial increase in urban sprawl by 2030, emphasizing the model’s utility in urban planning and growth regulation [24].
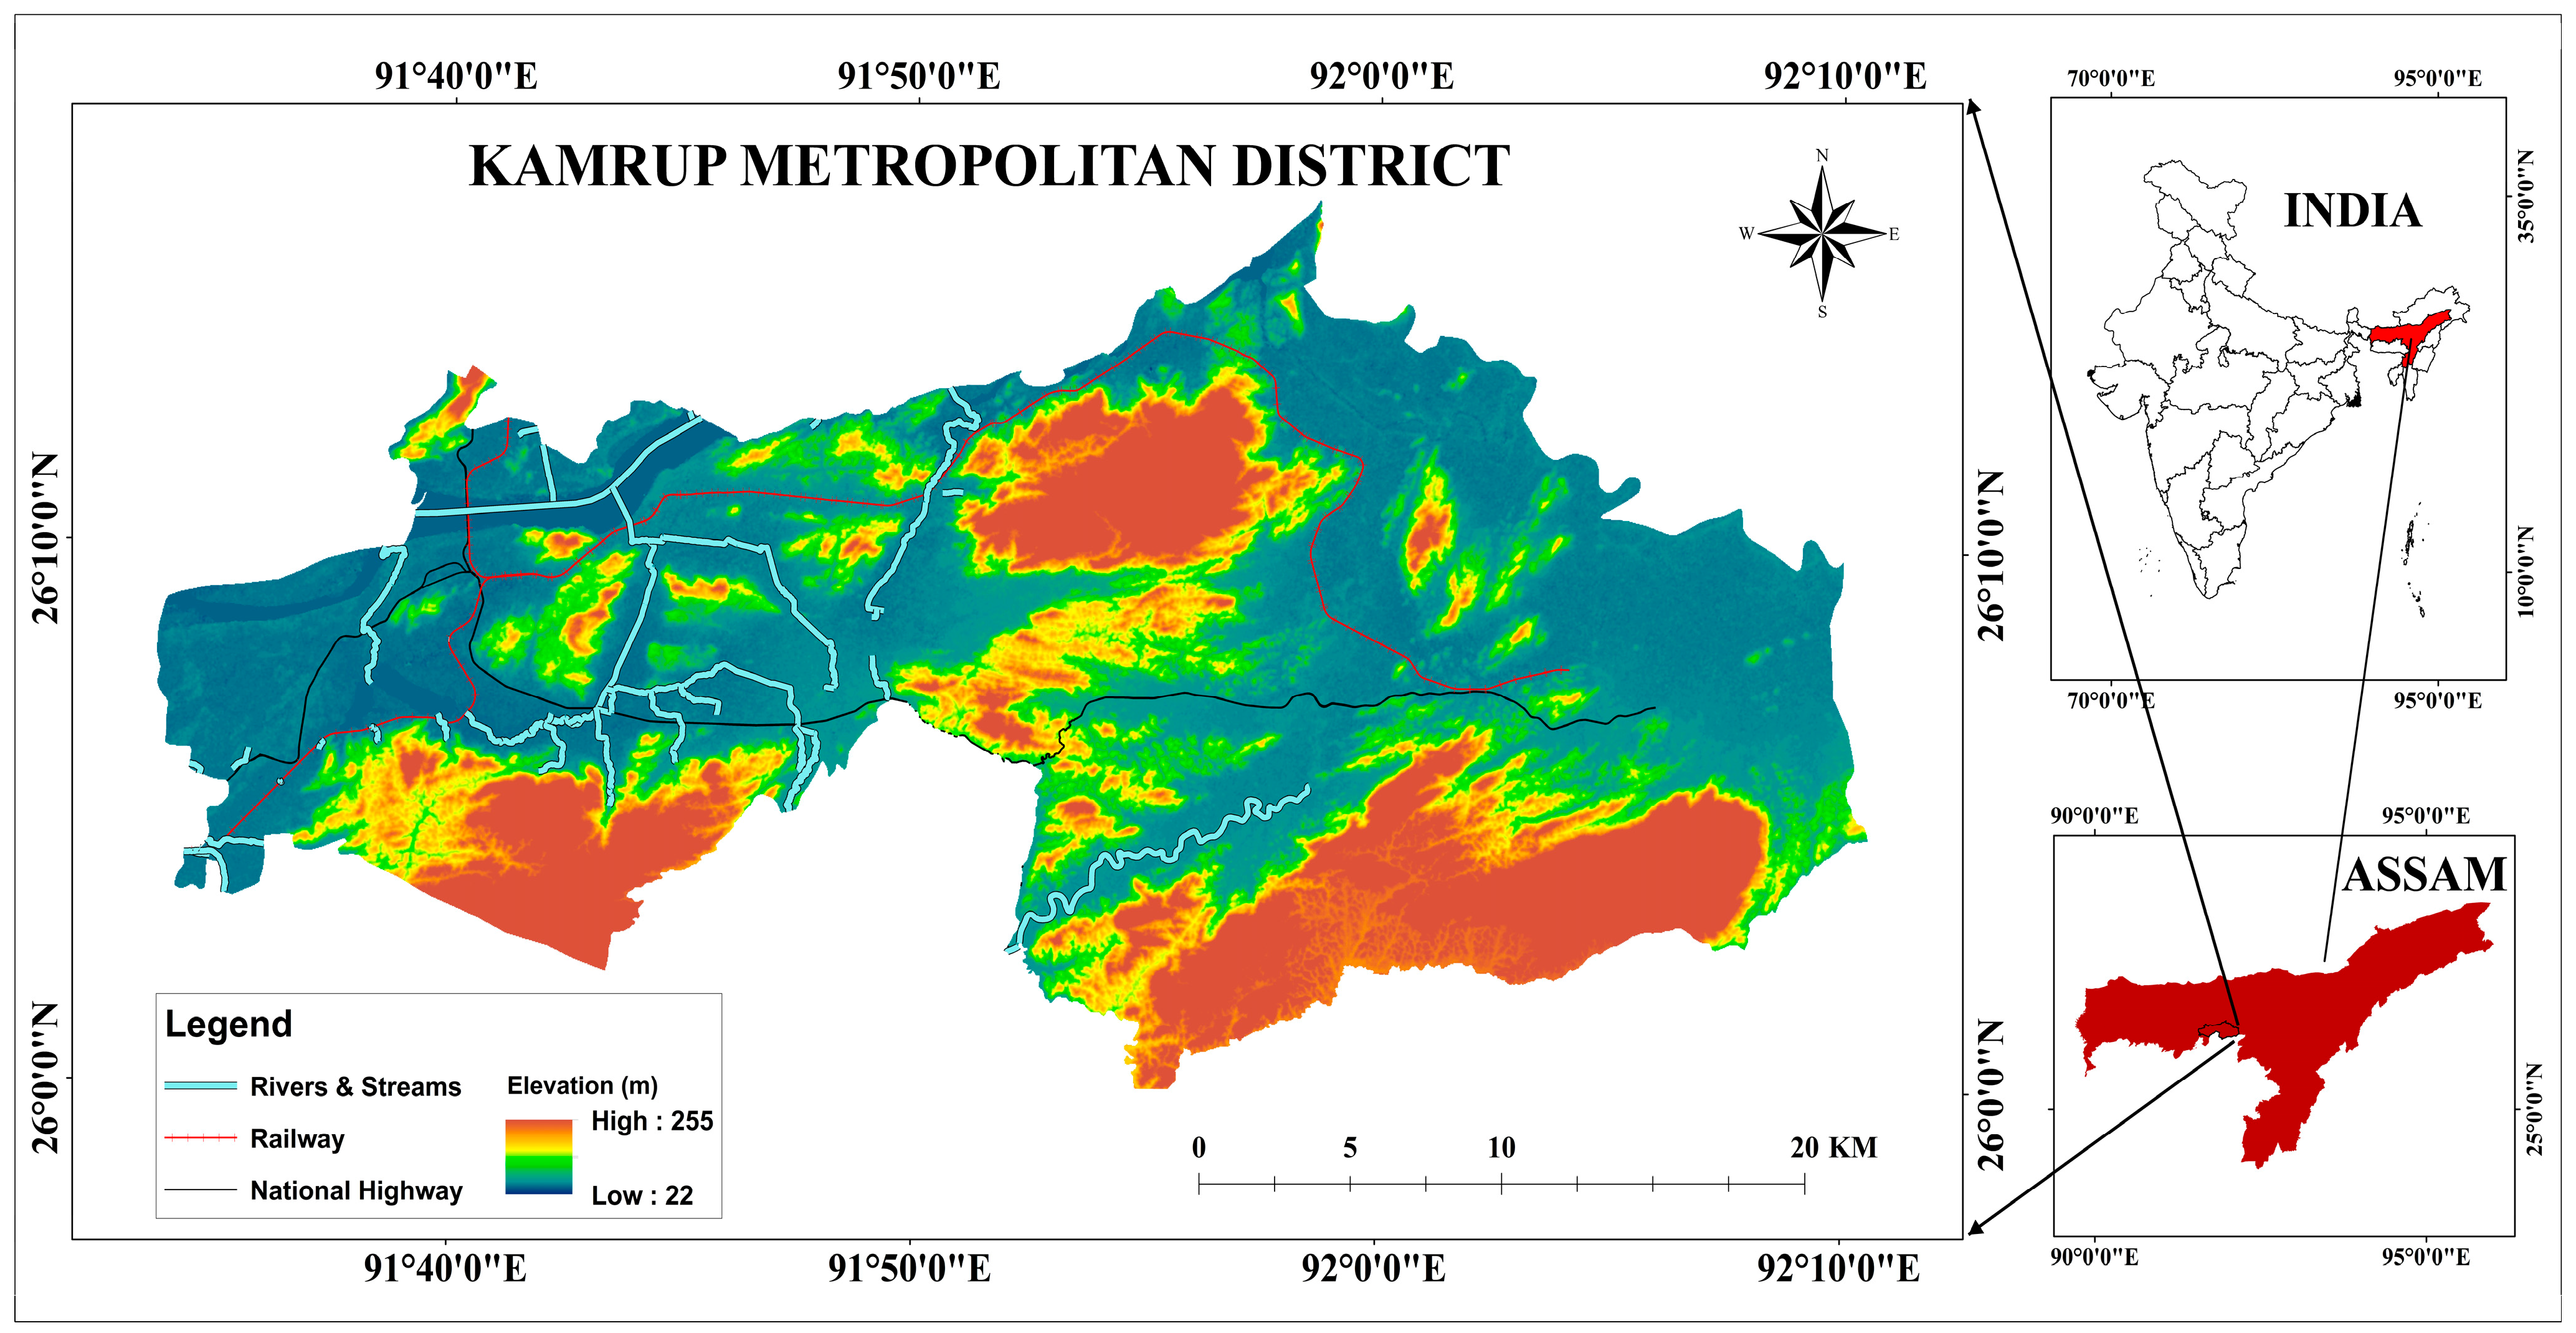
Given the region’s fragile ecosystem, characterized by proximity to the Brahmaputra River in the north, heavy monsoon rainfall, a highly seismic zone classification, and the presence of diverse wildlife species and dense forests, understanding the impacts of urbanization on the ecosystem is crucial. The study emphasizes the potential aftermaths of urban expansion, especially concerning unplanned growth, which is particularly hazardous in a seismic zone. Moreover, the encroachment of urban sprawl into suburban and transitional zones between urban settlements and protected areas threatens biodiversity and wildlife habitats [25]. The objective of this study is to investigate and predict the patterns of urban growth within the Kamrup Metropolitan District by employing a combination of the CA-Markov model and AHP. This integrated approach aims to simulate land use changes and prioritize urban planning decisions, contributing to the formulation of sustainable development strategies. By analyzing urban land cover by using Shannon entropy and other advanced methodologies, the study seeks to offer insights into the dynamics of urban sprawl, diversity, and fragmentation, thereby facilitating informed urban planning and policy-making processes. The study addresses the paucity in comprehending the spatial-temporal dynamics of urban expansion in the Kamrup Metropolitan District from 2000 to 2022. The Kamrup Metropolitan District, situated in Assam state in northeastern India, was established in 2003, following the division of the former undivided Kamrup District after the 2001 census. Notably, the undivided Kamrup District, located in western Assam, gave rise to several districts over time, including Kamrup Rural in 2003, Kamrup Metropolitan in 2003, Barpeta in 1983, Nalbari in 1985, and Baksa in 2004. Among these, Kamrup Metropolitan has witnessed significant evolution in terms of urbanization and demographic transition. The primary urban center within the district is Guwahati, the largest city in the northeast, which encompasses a substantial portion of the district and lends its name to the metropolitan area. However, it’s essential to acknowledge that the district comprises both urban and rural populations. This diversity necessitates consideration concerning the changing urbanization dynamics of the region [26].

2. Materials and Methods

2.1. Study Area

The Kamrup Metropolitan District (Figure 1), which covers an area of 1528 sq. km, is located in the northeastern state of Assam in India. It is known for its fertile plains along the lower basin of the Brahmaputra River. The territory spans from 26.07° N latitude to 91.63° E longitude, showcasing a verdant landscape that is typical of the area [27].
In recent times, the Kamrup Metropolitan District has experienced a significant acceleration in urban development, evidenced by an 18.34% increase in its urban population since the 2001 census, according to the 2011 Census of India data [28]. Urban expansion has increased population density to 2010 individuals per sq. kilometer, driven by rural-urban migration, economic opportunities, and infrastructure development, marking the area’s transformation into a significant urban center [29]. The administrative center of the Kamrup Metropolitan District is situated in Guwahati, which is the largest city in the northeastern region of India and encompasses a significant portion of the district’s territory. It is noteworthy that the district derives its name from this metropolitan city [26].
The study focuses on the Guwahati Metropolitan Development Authority’s jurisdiction, covering a substantial part of the Kamrup Metropolitan District, with Guwahati as its administrative center. Situated on the southern banks of the Brahmaputra River and nestled at the foothills of the Shillong Plateau, Guwahati spans 176.2 sq. km within the Guwahati Municipal Corporation boundaries. Urban development has expanded into natural landscapes, including wetlands, with Guwahati experiencing notable demographic growth since becoming Assam’s capital in 1972, highlighting the implications of rapid urbanization in the region [30].
According to the 2011 Census of India, the population of the Guwahati Municipal Corporation area surged from 43,615 in 1951 to 962,334 in 2011, driving substantial urban development. This rapid growth has altered land usage, affected local climate, and raised urban health concerns, underscoring the necessity for systematic urban planning and sustainable development strategies to alleviate environmental and public health impacts [31].

2.2. Methods

A detailed examination and analysis of changes in land use/land cover (LULC) within the Kamrup Metropolitan District from 2000 to 2032 required a comprehensive collection of various data sources to ensure the study’s success. Satellite images from Landsat TM and OLI/TIRS for the specified years were sourced from the USGS Earth Explorer platform to create detailed maps of LULC. Additionally, Cartosat Digital Elevation Model (DEM) data, with a resolution of 30 m, were obtained to outline elevation and slope features. The spectral characteristics of these satellite images are outlined in Table 1. Road network data were retrieved using Open Street Maps, and a topographical map from the Survey of India helped to map the boundary layer for reserved forest areas delineating protected zones. Points of interest (POI) from Google Earth were also incorporated into the dataset, providing vital spatial information necessary for conducting a multicriteria analysis. Moreover, high-resolution imagery from Google Earth was integrated to enhance the precision of the LULC classification process.

2.2.1. Image Classification (LULC)

The study delineated six distinct categories of land use and coverage: Agricultural Land, Barren Land, Dense Forest/Tree, Built-up Areas, Vegetation, and Water Bodies. ARC GIS software, version 10, was utilized for various analytical procedures, including image processing, the creation of classified LULC maps, and spatial analysis. The classification of Landsat 5 and 8 satellite images was carried out using the supervised maximum likelihood classification method to ensure accuracy and reliability. A consistent spatial resolution of 30 m by 30 m was maintained during the resampling process to preserve spatial details and prevent data loss. Thematic raster layers for each category were generated and analyzed using the Arc Info GIS platform, with grid cells uniformly set to a 30 m by 30 m resolution [32,33]. The classification method applied here assigned each pixel of the satellite image to the LULC category that most closely matched its spectral characteristics, following recognized typologies, such as urban areas and forested lands. Training sites for each category were chosen based on a detailed analysis of Landsat images, with additional verification using Google Earth data. This method’s effectiveness in categorizing land LULC was evaluated by analyzing the classification’s overall accuracy, producer’s accuracy, and user’s accuracy, employing a confusion matrix to assess the precision of the classification process [34].

2.2.2. Shannon’s Entropy

Shannon’s entropy was used to compute and gauge the spatial dispersion and concentration tendencies inherent within geographical variables among “n” spatial zones, as expounded within a compact pattern [35]. Entropy, spanning from 0 to 1, summarizes the spectrum of spatial distribution degrees. At its nadir, entropy attains a value of 0, signifying maximal concentration, while at its zenith, it reaches 1, indicative of an even dispersal [36]. Shannon’s entropy provides a useful method for assessing urban sprawl by quantifying the diversity of land use within a given area. However, it does not account for spatial arrangements of land cover types.
In contrast, gradient analysis focuses on capturing the outward spread of urban development, spatial autocorrelation identifies clustering patterns, patchiness assesses fragmentation, and fractal dimension measures the complexity of urban edges. Each of these methods offers distinct strengths and limitations, depending on the specific aspect of urban sprawl under investigation. Combining Shannon’s entropy with other measures can enhance our understanding of urban sprawl by providing a more comprehensive assessment. Therefore, this study utilizes both Shannon’s entropy and landscape fragmentation analysis to gain deeper insights into urban sprawl dynamics. Previous studies have demonstrated its effectiveness in assessing urban sprawl dynamics and its ability to complement other metrics by providing insights into the spatial patterns and heterogeneity of land use changes [37]. Additionally, Shannon’s entropy has been found to be robust and relatively easy to calculate, making it a practical choice for assessing urbanization processes across different spatial and temporal scales [38].
The study area is segregated into nine ring buffers, each spanning a distance of 5 km from the central point based on the spatial extent of the Kamrup Metropolitan District. Due to the elongated shape of the district, these buffers have been strategically divided to capture the built-up areas effectively. The central point of each buffer zone was positioned at the heart of the city, specifically Guwahati, serving as the main center. These central points were oriented towards the Central Business District (CBD), reflecting the typical pattern of settlement growth in and around such urban focal points. Subsequently, the built-up areas within each delineated buffer zone originating from the city center are meticulously extracted, facilitating the computation of land development density and enabling an assessment of the directional trends characterizing urban sprawl. This iterative process is replicated for the years 2000, 2014, and 2022, thus furnishing a robust basis for comparative analysis regarding the concentration or dispersal dynamics inherent in the region’s urban expansion over time. Shannon’s entropy can be expressed as
P i log P i
where Pi = the built-up area in the i zone/the total built-up area.

2.2.3. Landscape Metrics

Landscape metrics play a crucial role in understanding the complexities of landscape structure and arrangement [39]. These metrics quantify the structural patterns of landscapes through sophisticated algorithms tailored for landscape analysis. Typically, a variety of landscape metrics are developed to assess the patterns of categorical maps, serving as essential tools for computing two fundamental attributes of landscape structure: composition and configuration. Composition refers to the richness and diversity of patch types within the landscape, independent of their spatial attributes or precise placement within the mosaic [40]. On the other hand, configuration encompasses the spatial disposition, arrangement, orientation, or positioning of patches within the landscape or class. The list of metrics quantified for this study is outlined in (Table 2).

2.2.4. CA-Markov Model

Markov Chain: In this study, the Markov model was implemented using IDRISI SELVA software 17 to generate transition probability matrices for the time intervals of 2000–2014 and 2014–2022. Initially, the classified LULC thematic maps were converted into a raster format to serve as the foundational input for the Markov model [41]. Subsequently, the model produced two distinct files: the transition probability file and the transition area file. The transition probability matrix quantified the likelihoods of pixel or pixel cluster transitions from one LULC class to another over periods. Meanwhile, the transition area matrix provided insights into the volumetric extent of spatial cells or pixels transitioning between classes. Mathematical formulations supporting Markov chain analysis were applied to facilitate these computations.
S(t + 1) = Pij × S(t)
P i j =     P 11 P 12 P 1 n P 21 P 22 P 2 n P n 1 P n 2 P n n
0 P i j 1         a n d         j = 1 N P i j = 1 , ( i , j = 1 , 2 n )
where S(t) = state at time t, S(t + 1) = state at time (t + 1), and Pij = transition probability matrix in a state.
Cellular Automata (CA): Cellular automata (CA) comprise a structured arrangement of cells within a defined grid, which undergoes successive discrete temporal iterations following a predetermined transition rule based on neighboring cell states [42]. Initially conceptualized by Ullan and Neuman in 1940, the CA model [43] embodies several fundamental components: (a) cell state, indicating the specific state assumed by a cell from a range of possibilities; (b) neighborhood, representing the array of cells adjacent to a given cell; (c) transition rule, dictating the future state of a cell based on its current state and the states of neighboring cells; and (d) temporal progression. The mathematical formulation of CA can be expressed as follows:
S t + 1 = f S t I t h V
where S(t+1) is the future state of the cell at time t + 1, f is the defined transition rule, St is the state of the cell at time t, I is the neighborhood at time t, the defined neighborhood size is h, and V is the cell’s suitability for urban growth.
The Markov model is proficient at quantifying the probability and rate of transitions in land use dynamics but lacks the ability to simulate spatial extent. Conversely, the cellular automata (CA) method excels at simulating landscape dynamics across both spatial and temporal dimensions but faces challenges in structuring models and defining transition rules. Therefore, integrating both methodologies into a CA-Markov model offers a robust approach for projecting spatially distributed dynamics across various land use patterns. This integration incorporates insights from the Markov model’s analysis of LULC and considers neighboring cells to define transition rules. In this study, the CA-Markov model was implemented using IDRISI Selva software 17 to simulate the built-up land use class for the years 2022, 2032, and 2052. Input images from 2000 and 2014 were utilized to generate the transition probability matrix for simulating the 2022 image, while images from 2014 and 2022 were used for simulating 2032. Similarly, data from 2022 and 2032 informed the simulation of the 2052 transition matrix via the Markov model.

2.2.5. Analytical Hierarchical Process (AHP)

The analytic hierarchy process (AHP) stands as a fundamental methodology in the domain of multicriteria decision-making, offering a structured approach to discerning optimal solutions amidst complex objectives [44]. Its core principles, grounded in pairwise comparisons, enable the construction of priority hierarchies by leveraging expert insights. A key aspect of its effectiveness lies in quantifying intangible factors using relative scales, allowing for the comparison of the dominance of one element over another across defined attributes through careful consideration of absolute judgments [27]. Driving Factors for Urban Growth: Various socio-physical parameters contribute to the growth or expansion of built-up areas within a region, including factors such as slope, elevation, rainfall, population density, and proximity to key geographical features such as roads, rivers, and central business districts (CBDs), among others. The CA-Markov model integrates these spatial parameters to generate suitability maps, as illustrated in Figure 2. Among these parameters, proximity to various geospatial features, such as roads, existing built-up areas, CBDs, and rivers, is a fundamental driver of urban growth. The selection of factors or constraints for inclusion in the model depends on existing analyses, literature reviews, expert opinions, or specific study requirements. However, establishing a coherent standard for determining the suitability level of land use or land cover is subjectively influenced by the researcher’s ideas, knowledge, or study objectives. In this study, the factors influencing urban growth include slope, elevation, proximity to roads, existing built-up areas, and points of interest (POIs), while the constraints considered are roads and protected areas (reserved forests), as depicted in (Figure 2). In order to ensure consistency and comparability, the standardization of factor measurements is essential, employing basic criteria to standardize each factor image to facilitate meaningful analysis.

2.2.6. Integration of AHP in Multicriteria Evaluation (MCE)

The multicriteria evaluation (MCE) method (Table 3) was utilized to standardize and calibrate various factors and constraints selected for generating suitability maps for the built-up area. This model operates by rescaling the criteria of factors such as elevation, slope, proximity to roads, and proximity to urban areas to a standardized scale ranging from 0 to 255 (Figure 2). In this scale, a value of 0 indicates areas less suitable for built-up growth, while 255 denotes the most suitable areas. Constraints were expressed in Boolean form, with 0 representing excluded areas for built-up growth and 1 indicating potential areas [45]. Additionally, the MCE calculates the weight of each selected factor criterion based on its importance in influencing built-up growth. The analytical hierarchy process (AHP) was employed to determine the weight of each driving factor by assessing their percentage of influence. This process involves creating a comparison matrix of the criteria of the factors involved in influencing urban growth [46]. An advantage of using the AHP model is its ability to compare factors pairwise at any given time, regardless of the number of factors involved [47].
The factors were evaluated using a nine-point continuous rating scale to determine their relative importance, with the aim of assigning weights to each factor and calculating a consistency ratio to guide the algorithm (Table 4). Pairwise ratings were adjusted to ensure a consistency ratio below 0.1. However, the resulting consistency ratio was found to be 0.8, with corresponding weights assigned to each factor detailed in (Table 5). Notably, the most influential factor received the highest weight value, while the least influential factor was assigned the lowest weight value. Proximity to urban areas emerged as the most significant factor, whereas elevation was identified as the least influential factor in driving urban phenomena within the study.
Moreover, the consistency ratio (CR) of 0.08 in the table suggests that efforts were made to address inconsistencies in the analytic hierarchy process (AHP), although complete elimination may not be feasible or preferable. Saaty recommends a CR of 10% or less as acceptable [48]. If the CR is too high, decision-makers can review and revise their pairwise comparisons to enhance consistency. However, it is important to acknowledge that some level of inconsistency can reflect real-world complexities in decision-making [49]. The key is to ensure that the CR is low enough to have confidence in the results of the AHP process.

3. Results

3.1. Land Use and Land Cover Classification

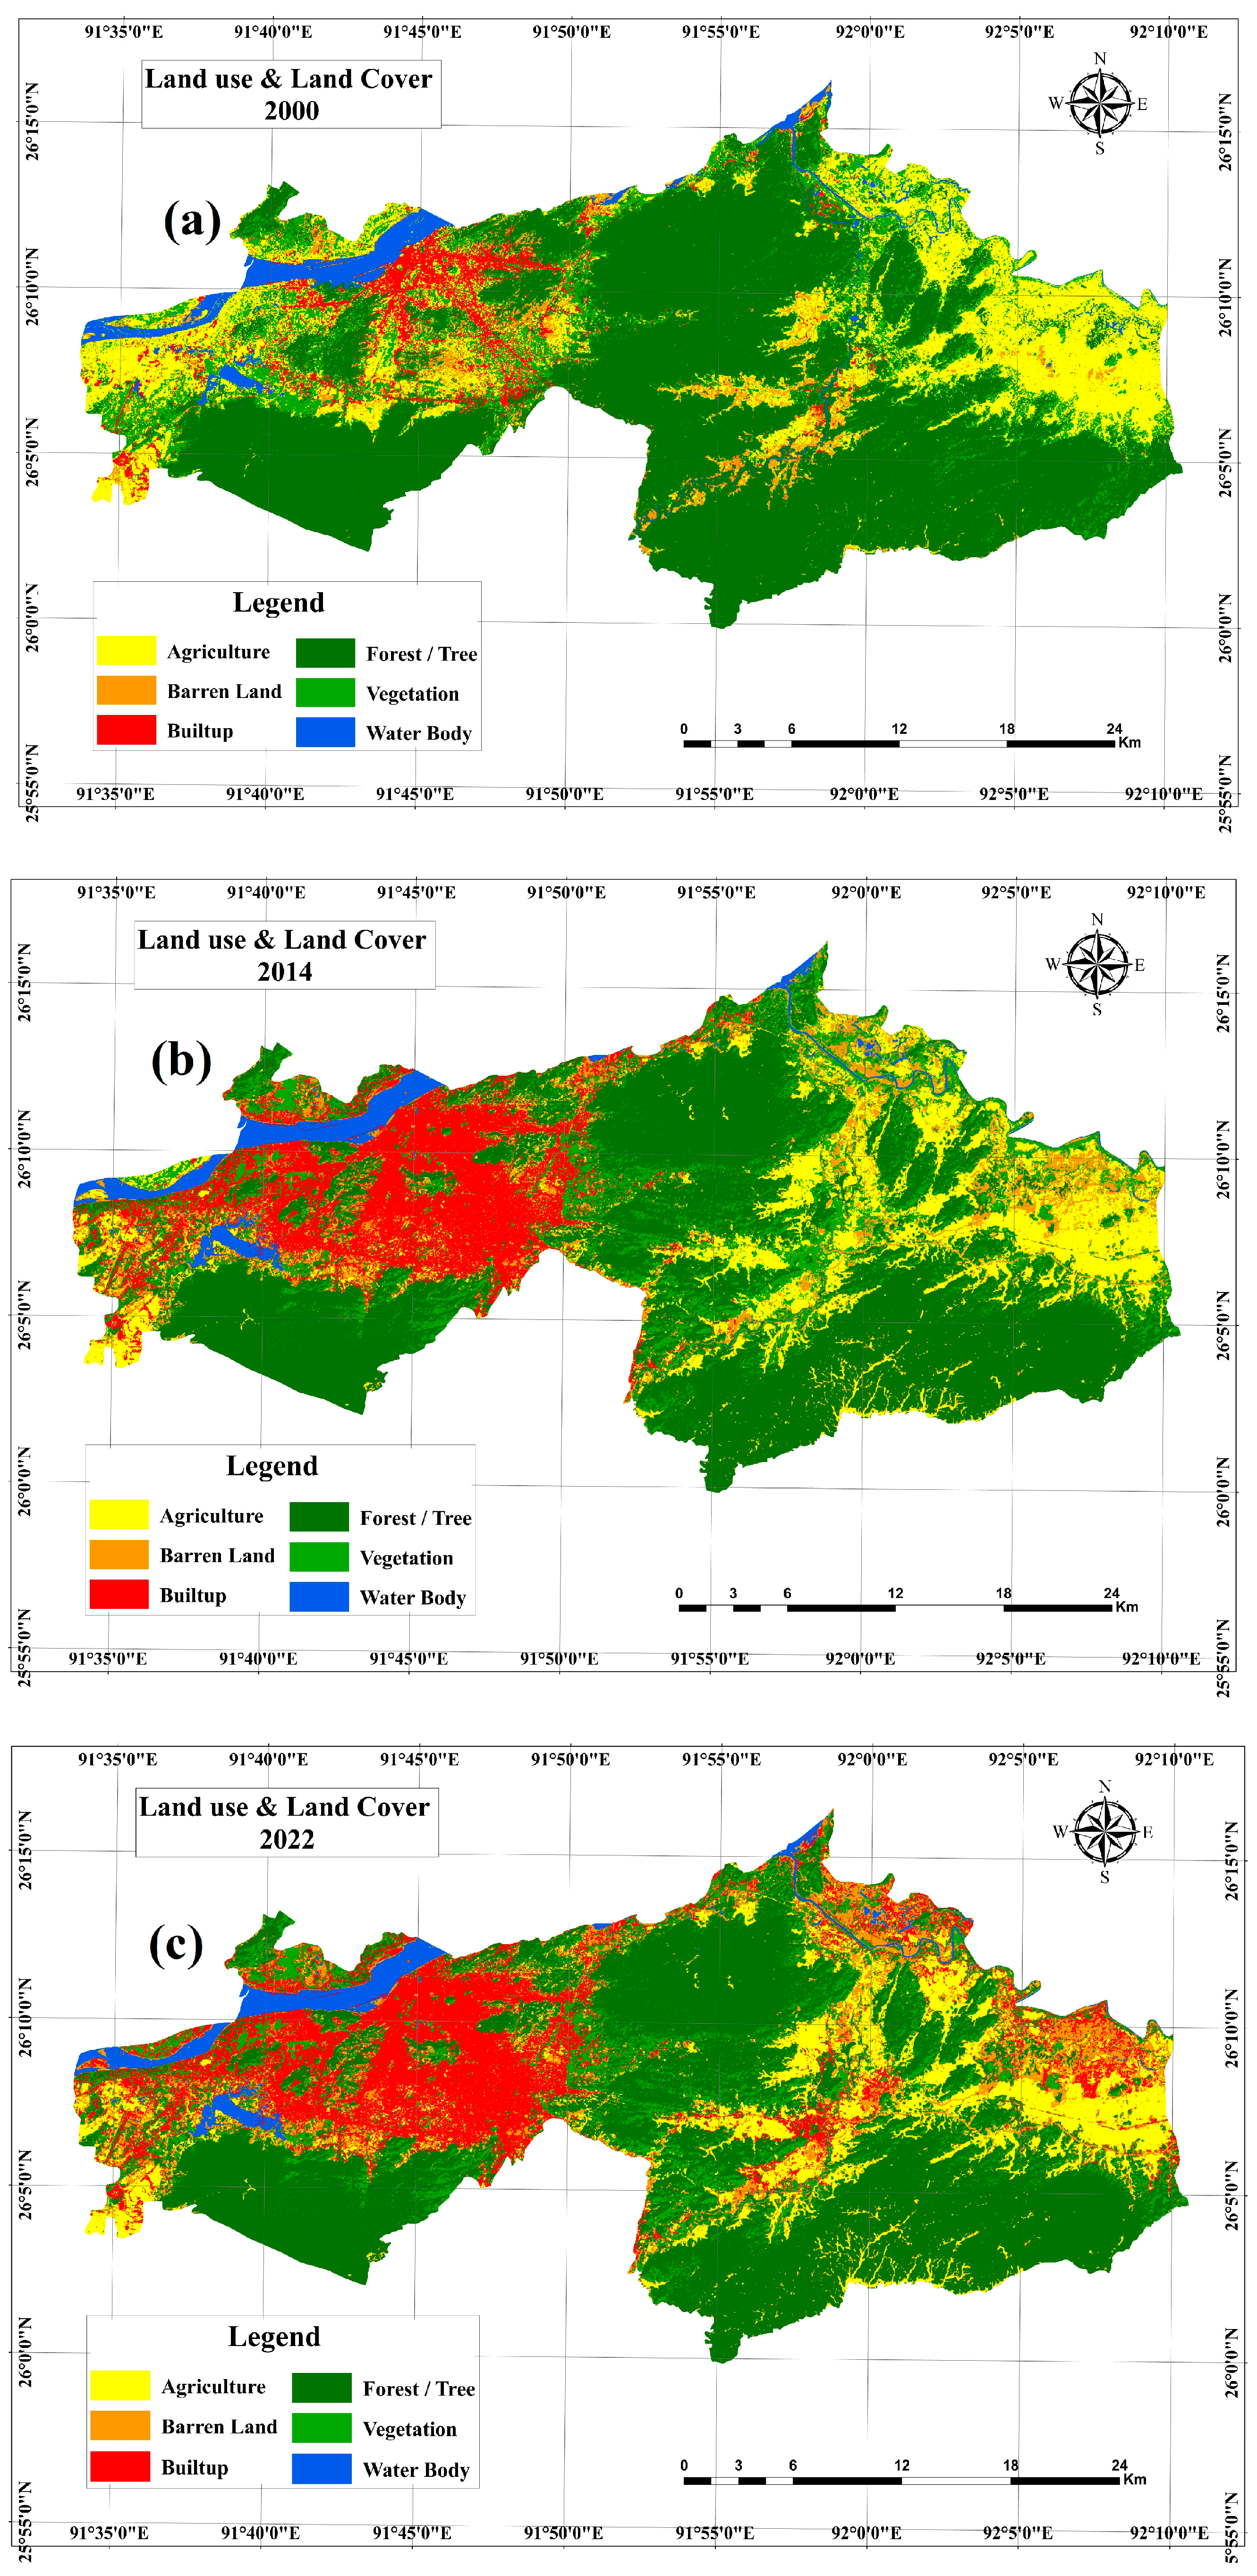
A thorough examination of the Land Use and Land Cover (LULC) class areas across the years 2000, 2014, and 2022 revealed notable landscape transformations (Figure 3). The most significant change observed (
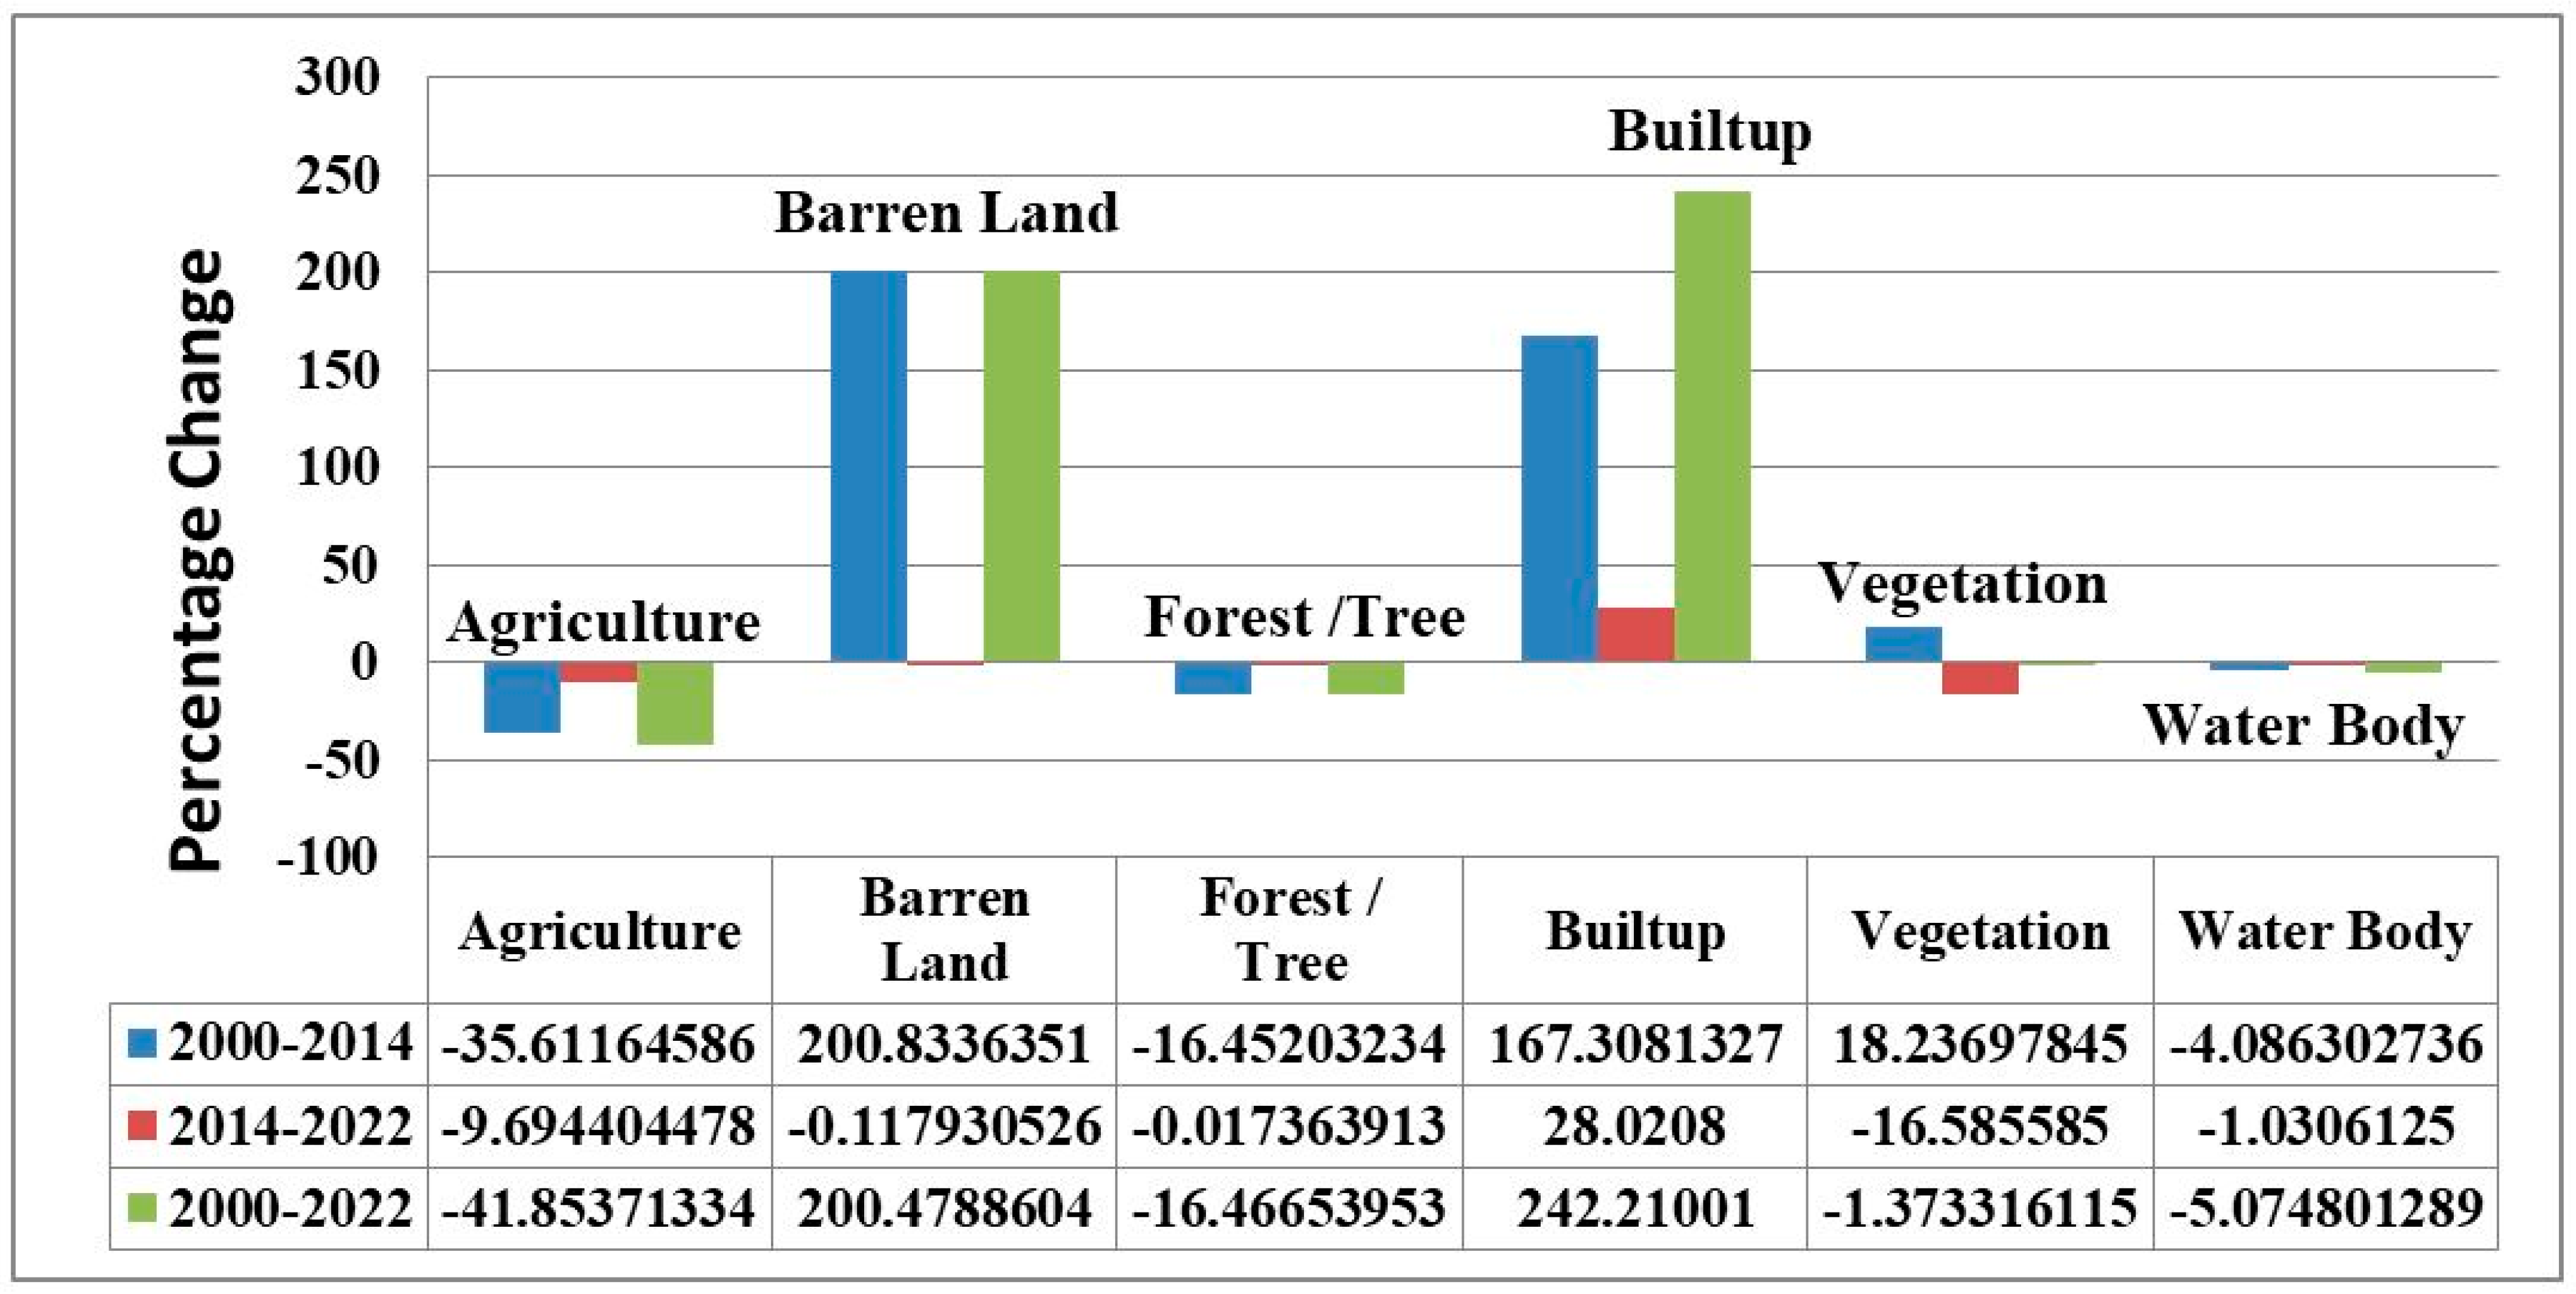
Table 6) is the substantial increase in barren land, which surged by over 200% by 2014 and continued to exhibit a significant rise by 2022. This trend suggests potential desertification processes or industrial activities rendering the land infertile. Similarly, built-up areas experienced a notable increase, surpassing 167% by 2014, indicating rapid urbanization and encroachment on other land classes. This transformation underscores the dynamic nature of land use patterns and the impact of human activities on the landscape over time.
On the contrary, agricultural land has experienced a significant decrease of over 41% up until 2022, which raises concerns. This decline may be attributed to factors such as conversion to built-up areas or a shift towards more intensive agricultural practices that require less land. While forest/tree cover has also exhibited a moderate decline up until 2022, the extent of change is less significant compared to the substantial losses in agriculture. Similarly, vegetation areas have shown a slight decrease up until 2022. Conversely, water bodies seem to have remained relatively stable, with a minor decrease in the same year. In summary, the LULC analysis indicates a landscape undergoing notable transformation, characterized by an increase in barren land and built-up areas, a troubling decline in agricultural land, and relatively stable vegetation and water cover (Figure 4). Additionally, based on the findings of the accuracy assessment, the classification accuracies exceeded the threshold of 80% (Table 7).

3.2. Urban Sprawl Measurement

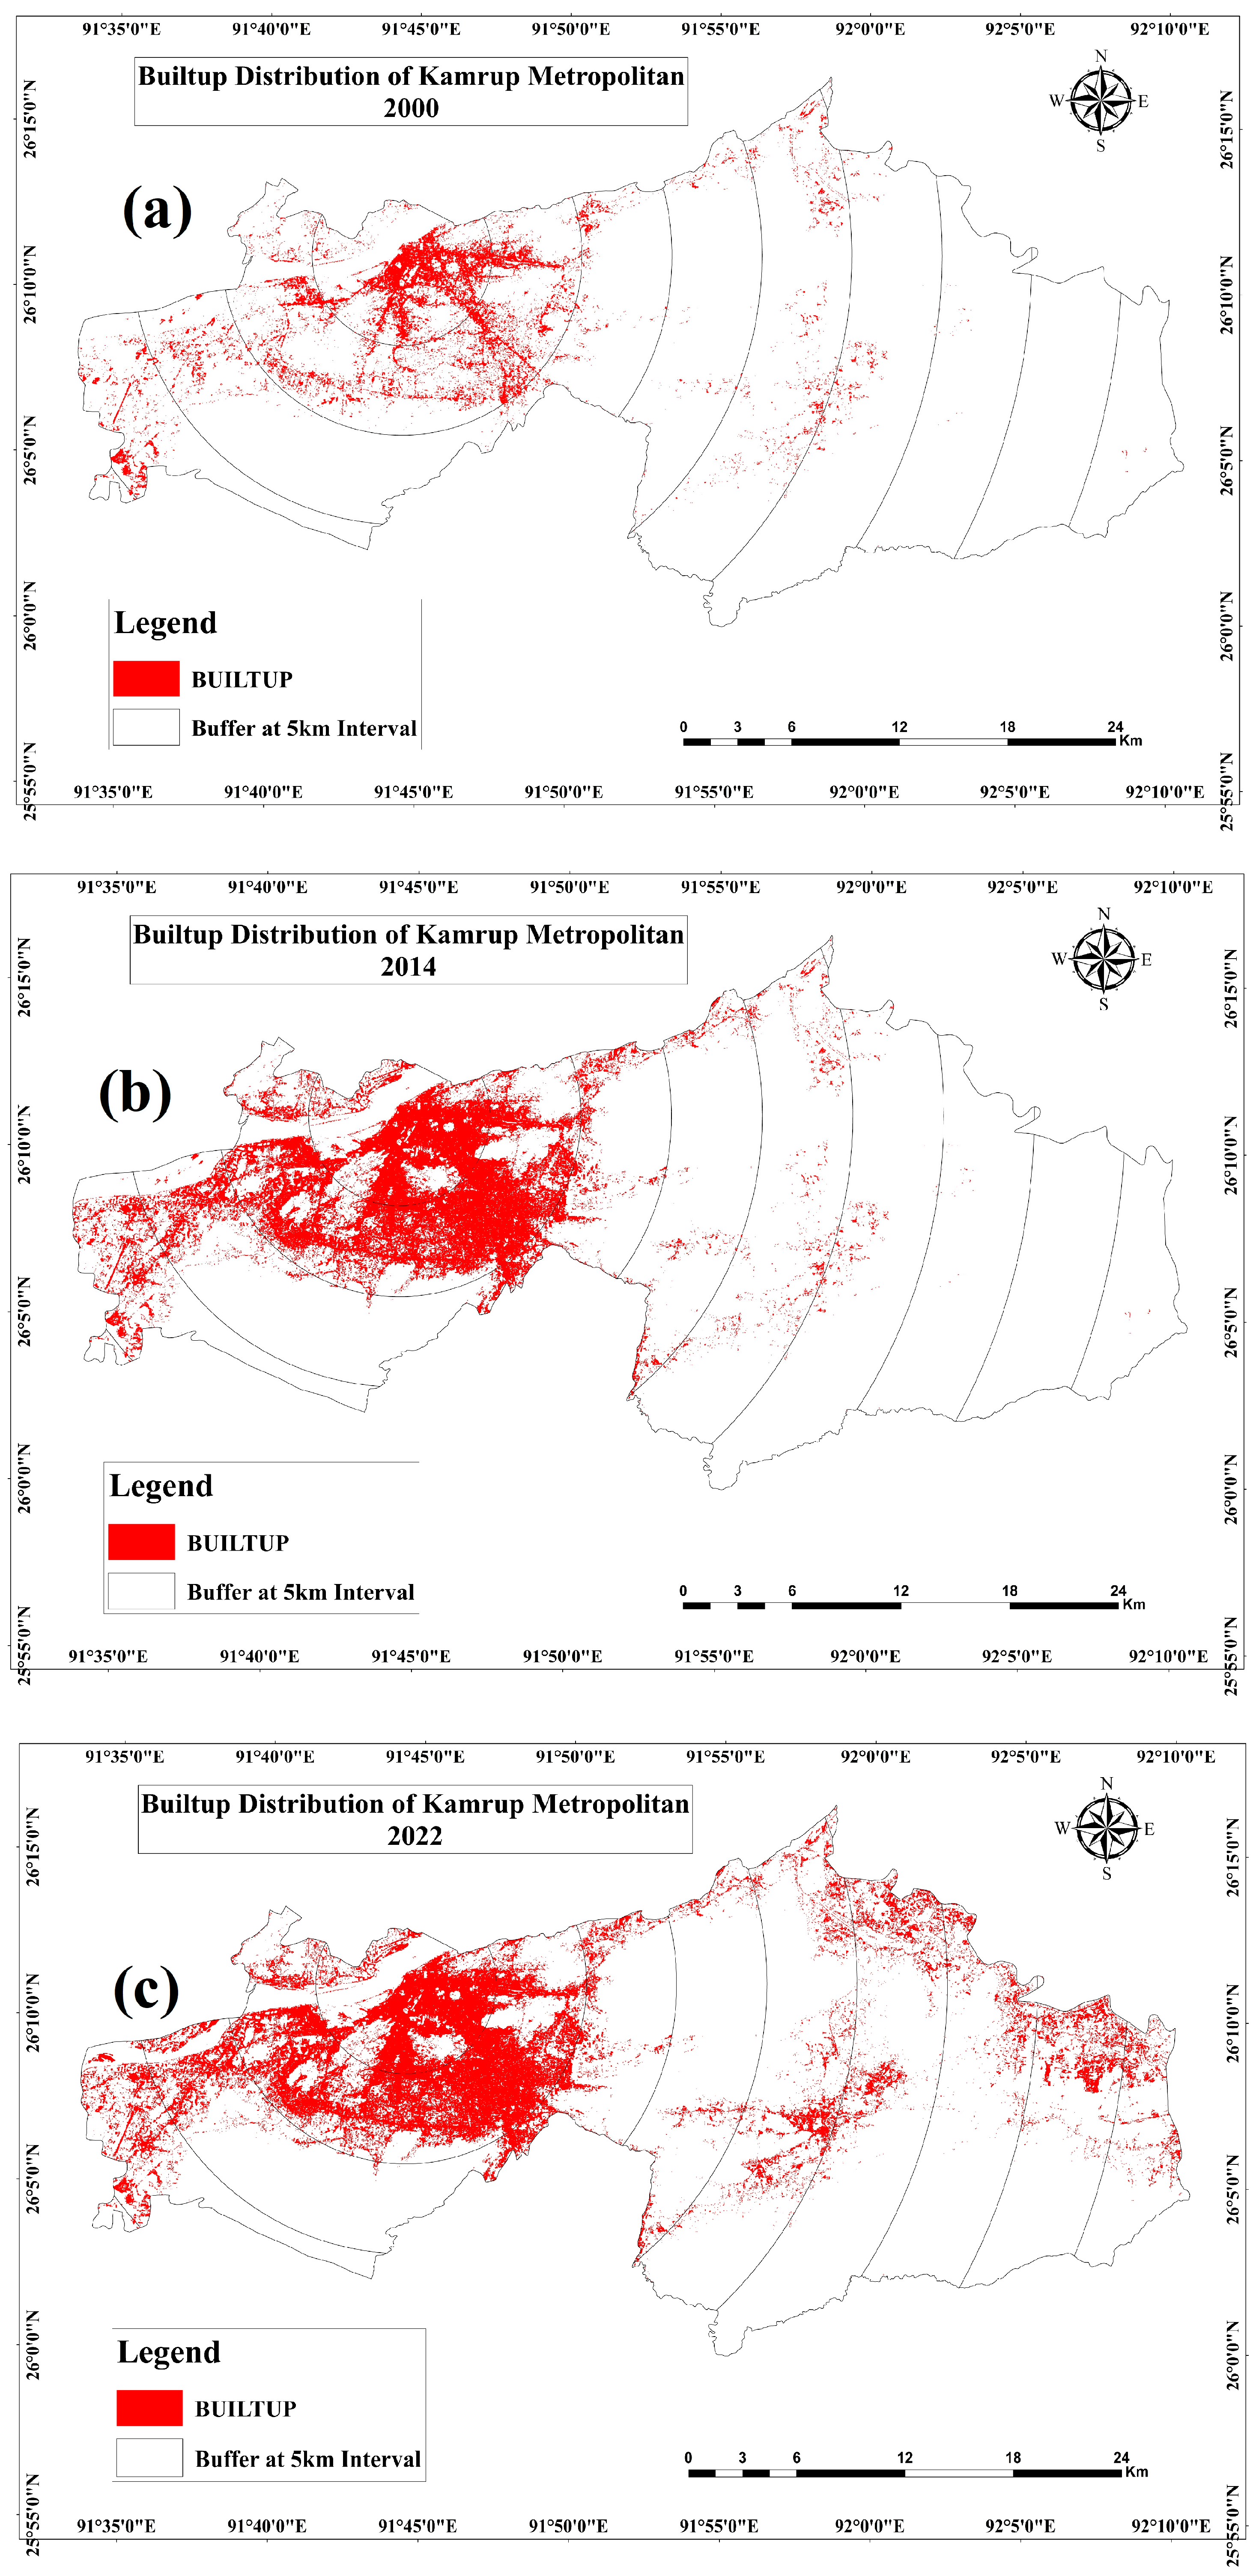
A comprehensive examination of the provided data reveals notable changes in the built-up area surrounding the city center from 2000 to 2022. The data presented in Table 8 and Figure 5 detail changes in eight buffer zones ranging from 5 km to 45 km from the city center; this demonstrates a consistent increase in the built-up area across all zones by 2022. Particularly noteworthy are the substantial increases observed in the zones farther from the city center, such as the 15 km zone, which nearly quadrupled its built-up area from 4.47 sq. km in 2000 to 18.70 sq. km in 2022. This outward expansion trend is further illustrated in a graph (Figure 6) where the distance from the city center is plotted against the built-up area, which highlights the significant growth in built-up areas as distance increases. Additionally, Table 8 shows the normalized entropy calculations, indicating the concentration of built-up areas within each zone. Interestingly, the entropy values generally decrease over the years, suggesting a trend of development becoming more concentrated in zones closer to the city center despite the overall outward sprawl. In summary, the data provides a clear depiction of urban sprawl, characterized by development spreading outward from the city center.

3.3. Landscape Fragmentation Analysis

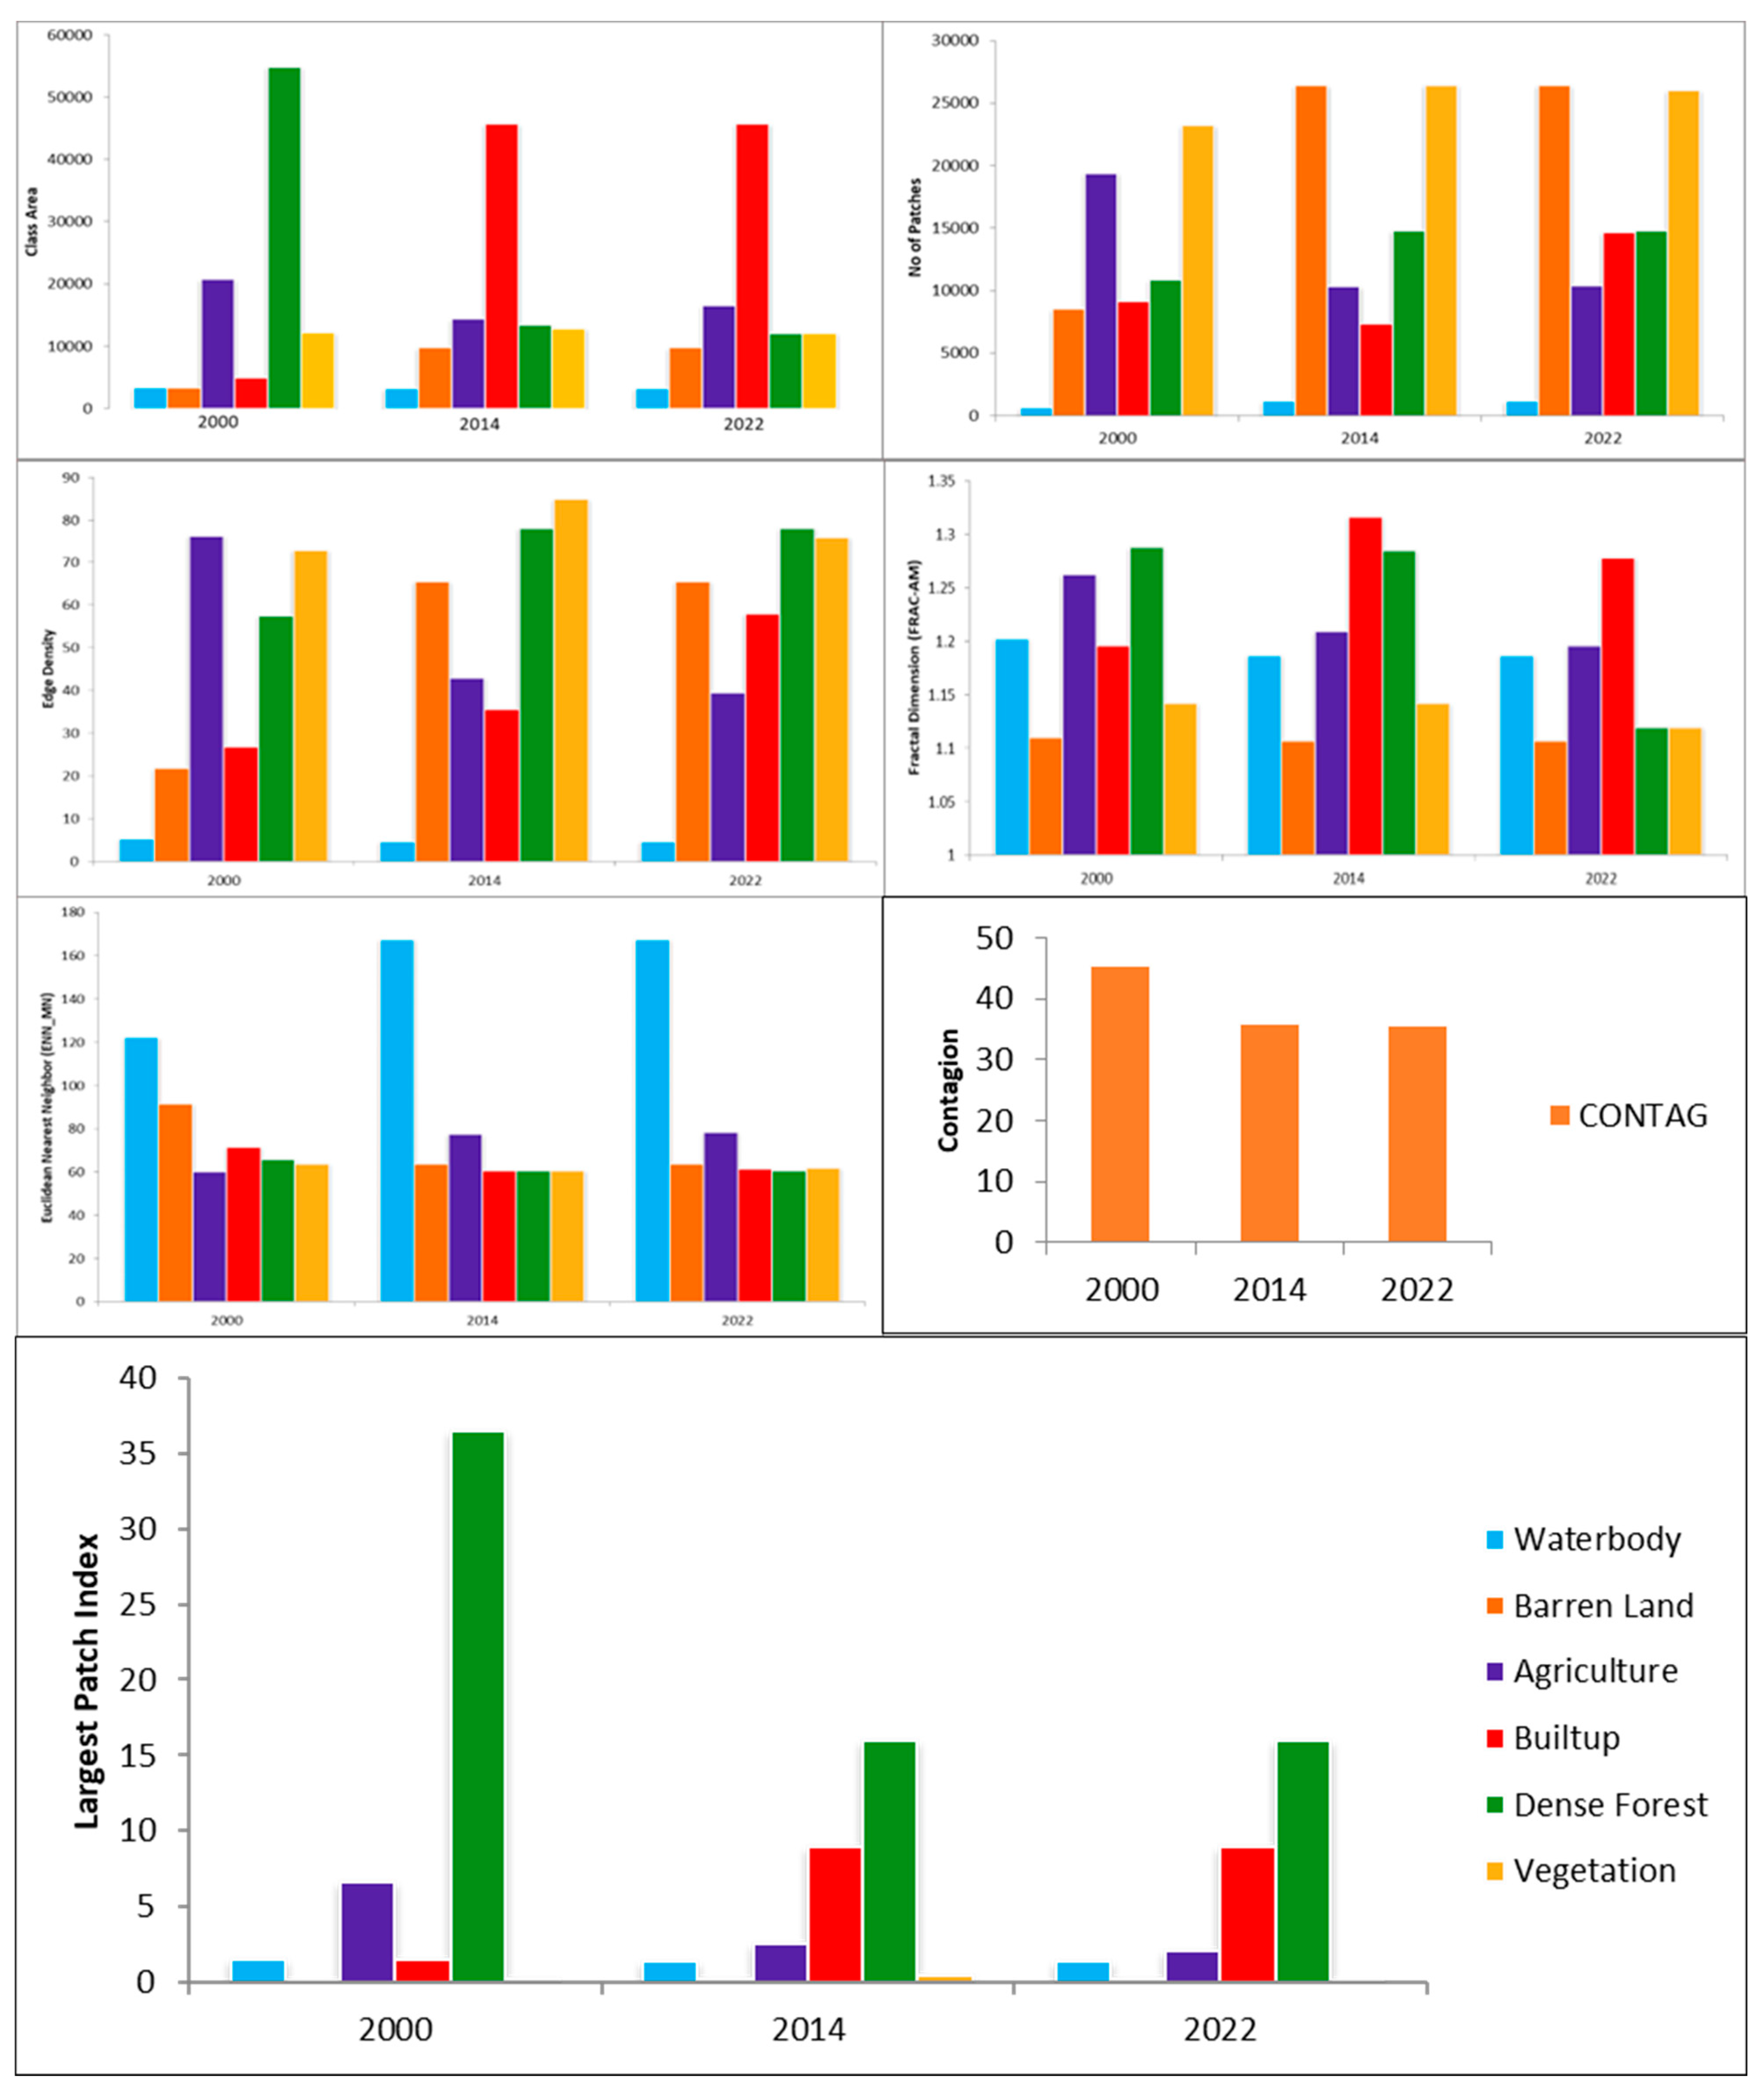
Seven landscape/class metrics, namely Class Area (CA), Number of Patches (NP), Largest Patch Index (LPI), Edge Density (ED), Fractal Dimension (FRAC_AM), Euclidean Nearest Neighbor (ENN_MN), and Contagion (CONTAG), were assessed for the Kamrup Metropolitan region (Table 9 and Figure 7). While Contagion is computed solely at the landscape level, the remaining six metrics can be computed at both the class and landscape levels. In 2000, the Class Area (CA) metric revealed that Agriculture occupied the largest area, followed by Forest/Tree and Vegetation, whereas Built-up areas and Water bodies were relatively small. By 2014, Agriculture maintained its prominence but decreased compared to 2000, whereas Built-up areas saw a significant increase. This trend continued into 2022, with Agriculture diminishing further and Built-up areas expanding substantially. These changes signify a transition from rural to urban landscapes, potentially leading to habitat fragmentation and biodiversity loss.
In 2000, the Number of Patches (NP) metric illustrates that Forest/Tree areas have the highest patch value, indicating a contiguous forested landscape. This pattern is also noticeable in the Barren land and Vegetation classes. However, by 2014, there is a notable decrease in patch values across various land cover classes, especially in Barren land and Vegetation, which persists into 2022, albeit with a slight decrease. This decline suggests habitat fragmentation and the potential disruption of ecosystem services, particularly in forested and vegetated habitats. Similarly, the Largest Patch Index (LPI) metric in 2000 shows that Forest/Tree areas have the highest index, representing extensive contiguous forest cover. However, by 2014, LPI values decrease across all classes, indicating landscape fragmentation. This trend intensified up until 2022, signaling heightened fragmentation across all land cover types. The decreasing LPI values signify escalating landscape fragmentation, posing risks to biodiversity, habitat connectivity, and ecosystem resilience.
Edge Density (ED) analysis conducted over the span of three years, from 2000 to 2022, reveals notable shifts in land cover contributions to edge density within the Kamrup Metropolitan District. Initially, in 2000, Water body exhibited the highest edge density, succeeded by Built-up areas and Agriculture. However, by 2014, Built-up areas emerged as the predominant contributor to ED, followed by Water body and Agriculture, a trend that persisted into 2022. This escalation in ED within built-up areas underscores urban expansion and encroachment into natural habitats, leading to habitat loss and alterations in hydrological dynamics. Additionally, the Fractal Dimension Index (FRAC_AM) analysis highlights patterns in land cover complexity. In 2000, Water body exhibited the highest fractal dimension index, indicative of intricate shapes, followed by Forest/Tree and Agriculture. This pattern remained consistent in 2014 and 2022, emphasizing the persistence of natural formations and human-induced constructs in the landscape. Comparatively, the Contagion metric provides insights into the spatial arrangement and distribution of land cover types. The observed decrease in Contagion from 2000 to 2014 indicates a trend towards more fragmented land cover patterns, while relatively stable values between 2014 and 2022 suggest consistent levels of landscape fragmentation. These findings contribute valuable insights into connectivity, habitat fragmentation, and overall landscape structure within the Kamrup Metropolitan District.

3.4. Markov Transition Matrix

The probability distributions for land class transitions across three distinct temporal periods, spanning from 2000 to 2014, 2014 to 2022, and a projection to 2032, were derived from meticulous Markov chain analyses and are presented in Table 10. The analysis reveals that the majority of transitions leading to the Built-up classification primarily originated from the Vegetation, Agriculture, and Forest/Tree categories. Specifically, during the initial period from 2000 to 2014, the likelihood of transition from Vegetation to Built-up was observed at 18.21%, followed by Agriculture at 14.58%, with Forest/Tree exhibiting a minimal propensity of 1.79%. Subsequently, from 2014 to 2022, there was a notable increase in transition dynamics, notably with Vegetation showing a surge in transitioning to Built-up areas, reaching 30.63%. Agriculture and Forest/Tree also experienced proportional increases, reaching 24.2% and 3%, respectively.
For the transition probabilities from 2022 to 2032, there is a notable increase in the likelihood of Vegetation transitioning into built-up areas, exceeding a 51% threshold. Agriculture also saw a rise to 44%, and Forest/Tree showed an ascent to 8.1%. An examination of the transition area matrix (Table 11) further highlights these trends, particularly emphasizing Vegetation’s propensity to transition into Built-up regions. This is evidenced by the increasing pixel count transitioning from Vegetation to Built-up areas, rising from 29,142 pixels during 2000–2014 to 40,966 pixels within the 2014–2022 timeframe. A projected increase to 60,908 pixels during the 2022–2032 interval is anticipated. Similar transition patterns, albeit to a lesser extent, were observed for the Agriculture and Forest/Tree categories, reinforcing the overarching trends identified within the probabilistic analyses.

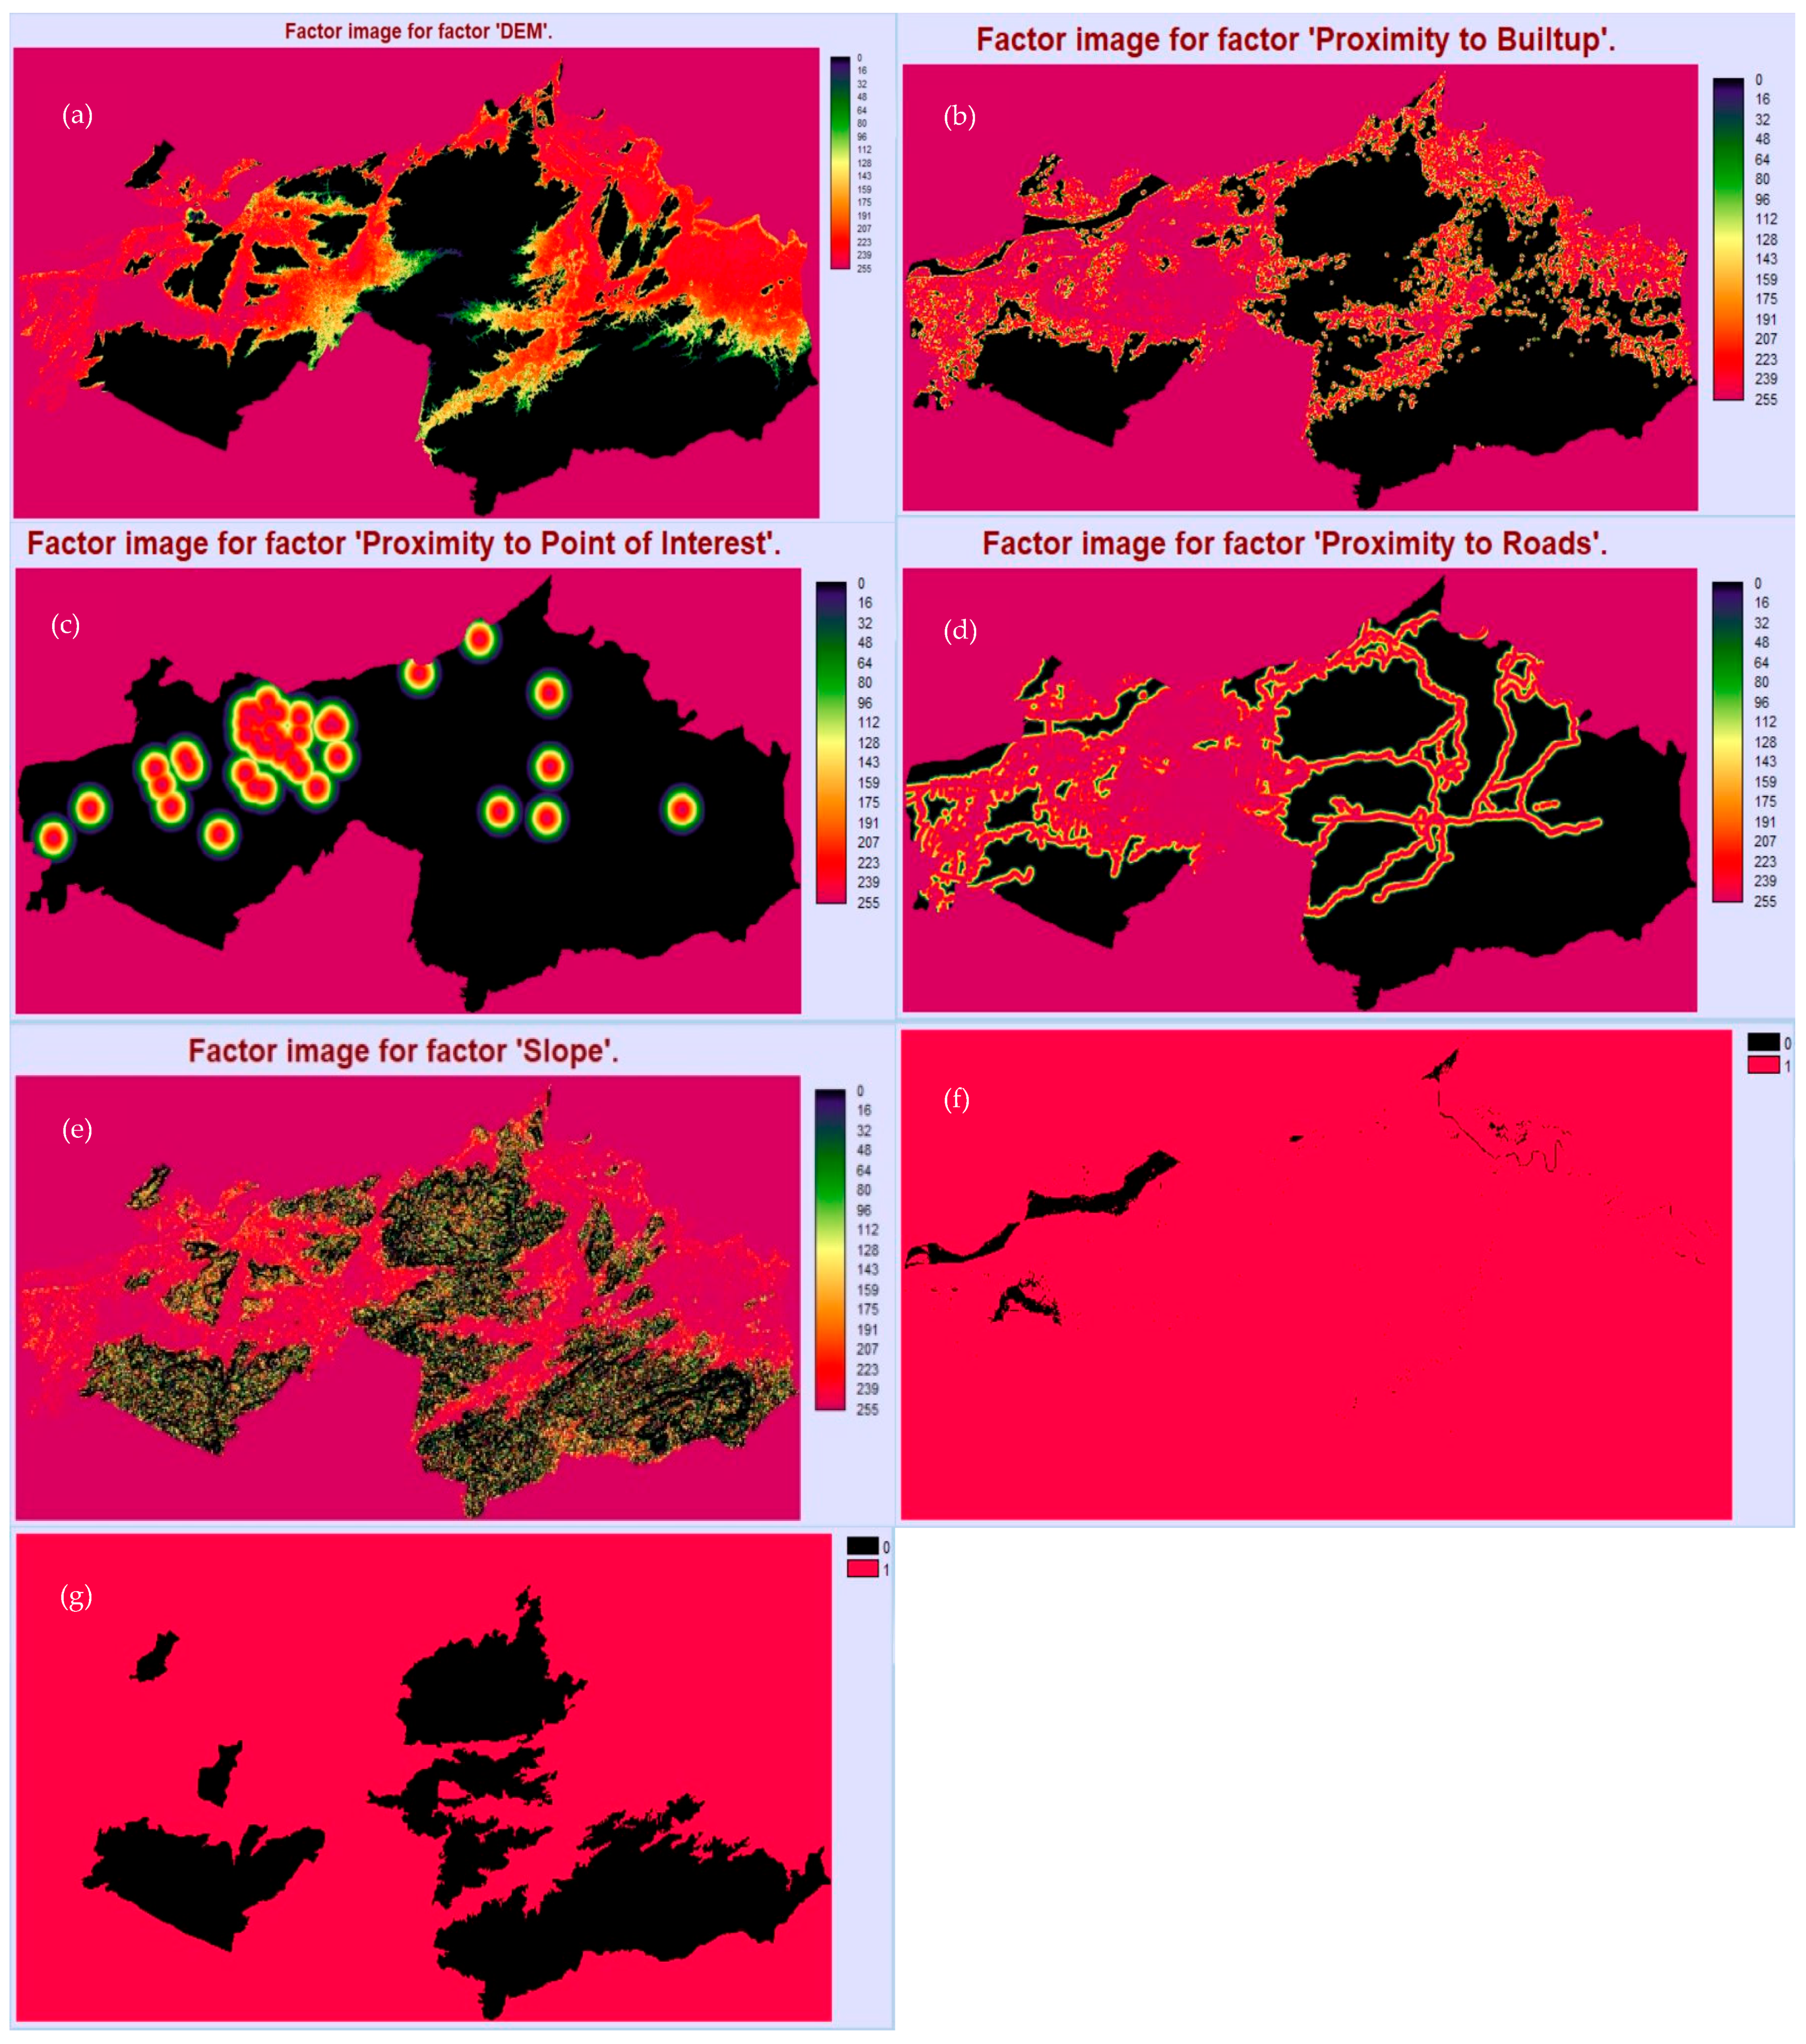
3.5. Projected Potential Built-Up Expansion Using Integrated CA-Markov and AHP Model

The process of delineating suitability zones for future urban development in 2032 and 2052 involves combining the CA-Markov model and the analytic hierarchy process (AHP). This amalgamation utilizes transition matrices derived from temporal spans of 2014–2022 and 2022–2032. The CA-Markov model projects future urban expansion based on past land cover transitions, while the AHP model helps prioritize those factors that influence suitability. The outcome is a suitability map that identifies areas suitable for urban development in the projected years.
The suitability map (Figure 2) serves as a crucial input for the cellular automata (CA) model, aiding in the projection of potential urban expansion areas for the years 2032 and 2052. Through visual representation, the map illustrates the virtual extent of prospective urban growth. Additionally, an analysis covering the period from 2000–2014 was conducted to validate the accuracy of the model. The data presented in 
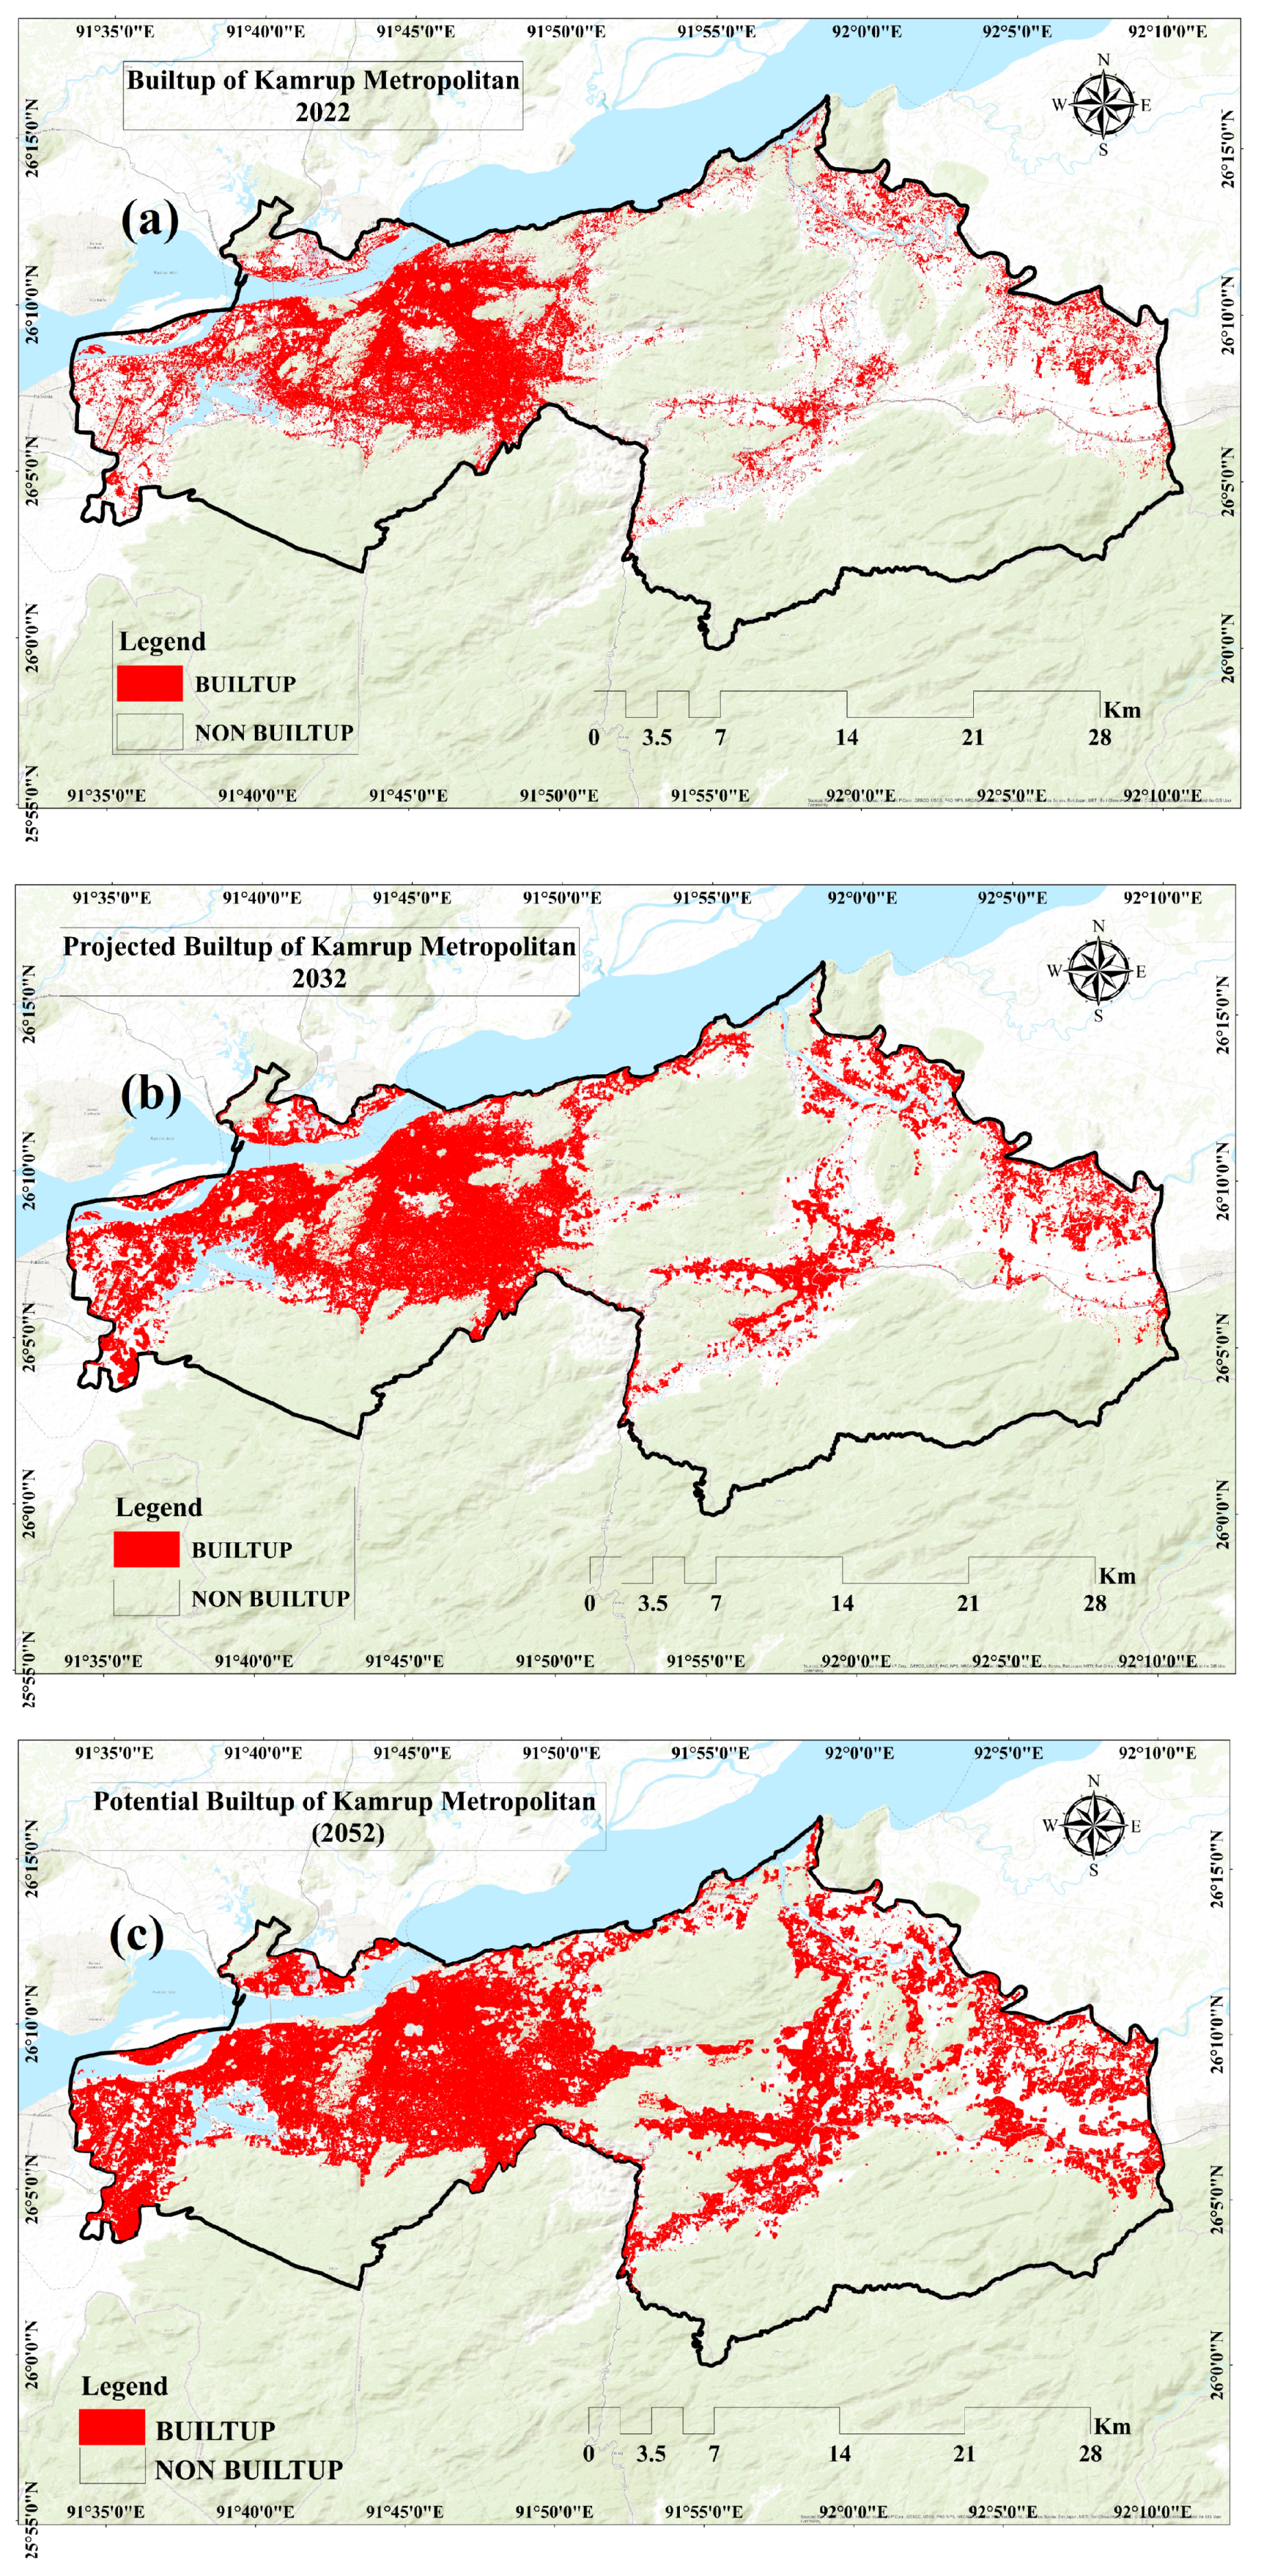
Table 12 highlight the dynamic trends in land use between 2022 and 2032, extending further into 2052, focusing on two distinct classifications: Non-built-up and Built-up. In 2022, the land area categorized as “Non-Builtup” amounted to 824.2680 sq. km, experiencing a marginal decrease to 763.8766 sq. km by 2032, reflecting a −7.3267% change. This downward trend persists in the projected figures for 2052, with a further decline to 671.8511 units, indicating a cumulative decrease of −12.04716856% from 2032.
On the other hand, there is a notable increase in the quantity of Built-up land, rising from 166.4270 sq. km in 2022 to 226.8094 sq. km by 2032, indicating a significant change of +36.2816%. Projections for 2052 anticipate a further rise, reaching 318.7588 sq. km, marking a +40.54% change from 2032. These contrasting trends suggest a shift towards urbanization or developmental activities, underscoring the evolving dynamics of land use over the projected period. The expansion of built-up areas extends outward from the city center, illustrating an infilling growth pattern. The visual representations in Figure 8 depict Built-up expansion in 2032 and 2052, offering a clear display of the spatial changes over time.

3.6. Validation Using Crosstabulation

The kappa index is a statistical measure that ranges from 0 to 1, indicating the level of agreement between observed and expected values in a classification model. It is commonly categorized into three ranges for interpretation: a coefficient greater than 0.75 suggests robust association, values between 0.4 and 0.75 signify moderate correlation, and those below 0.4 indicate weak agreement. In this study, the computed kappa index (Table 13) attained a value of 0.87, indicating strong agreement between the observed and expected values, thus affirming the reliability of the model’s outcomes. Additionally, the validation process provided supplementary statistical metrics, including chi-square, Cramer’s V, degrees of freedom, and p-value. Chi-square analysis evaluates the likelihood of an observed association between categorical variables, with a p-value of less than 0.001 indicating strong evidence supporting the alternative hypothesis of a significant association. Degrees of freedom, calculated based on the contingency matrix’s dimensions, represent the maximum number of independent values within the data sample. Cramer’s V, ranging from 0 to 1, measures the strength of association between variables, with higher values indicating a stronger relationship. Interpretively, Cramer’s V values exceeding certain thresholds (e.g., 0.05, 0.10, and 0.25) suggest weak, moderate, and strong associations, respectively, further confirming the linkage between the variables under analysis.

4. Discussion

A comprehensive analysis of LULC dynamics in the Kamrup Metropolitan District reveals significant transformations in the landscape over the studied period. The surge in Barren land, particularly notable by 2014 and sustained through 2022, raises concerns regarding potential desertification processes or intensified industrial activities rendering land infertile. Various industrial activities in the Kamrup Metropolitan District contribute to the increase in Barren land through a combination of direct and indirect mechanisms. The article The Growing Role of Assam in India’s Foreign Policy by Sharma, 2017 addresses the significance of Assam in India’s Act East Policy, and the associated connectivity development initiatives further amplify the impact of these activities [50]. According to Mehzabeen Sultana (2020), rapid industrialization often leads to land degradation and the conversion of fertile land into barren areas. Industries such as mining, manufacturing, and infrastructure development require large tracts of land, often leading to deforestation, soil erosion, and the contamination of water bodies [51]. In the context of Assam’s pivotal role in the Act East Policy, the need for infrastructure development, including roads, railways, and ports [52], intensifies land use changes and contributes to the expansion of barren land.
Concurrently, the substantial increase in built-up areas, coupled with a worrying decline in agricultural land, underscores the rapid urbanization and encroachment on agricultural spaces. These shifts signify a transition towards urban landscapes, potentially leading to habitat fragmentation and biodiversity loss, and this is evident from the study by Pawe and Saikia, 2022 [53]. Moreover, the analysis of urban sprawl in this research highlights the outward expansion of built-up areas from the city center, with intensified development observed in closer zones. Interestingly, while development is spreading outward, it is also becoming more concentrated in zones nearer to the city center, as evidenced by decreasing normalized entropy values, which is similar to the findings of Bhattacharjee et al., 2022 [54]. Landscape fragmentation analysis further elucidates these trends, showcasing alterations in patch values, largest patch index, edge density, and fractal dimension, all indicative of habitat fragmentation and changes in land cover patterns. The observed decrease in agriculture’s extent and the surge in built-up areas can be attributed to various factors, including land conversion for urban development, shifts towards intensive agricultural practices, and possibly the influence of industrial activities. Additionally, the projected potential built-up expansion using integrated CA-Markov and AHP models underlines the ongoing urbanization trend, predicting further increases in built-up areas by 2032 and 2052. This discussion highlights the multifaceted nature of landscape dynamics, influenced by urbanization, agricultural practices, and industrial activities, all of which contribute to the observed changes in land usage. Further research is warranted to explore the underlying drivers of these transformations and their implications for ecosystem services, biodiversity conservation, and sustainable land management strategies.

5. Limitations and Future Scope

While the CA-Markov model and the analytic hierarchy process (AHP) offer valuable methods for predicting land use and land cover changes, they are not without limitations. One key limitation lies in the assumption of stationary transition probabilities, which is inherent in Markov models and may not adequately capture the complex and dynamic socioeconomic and environmental factors influencing land use changes. Additionally, the accuracy of predictions in the CA-Markov model heavily relies on the quality and resolution of input data and the appropriateness of model parameters and assumptions. Similarly, while AHP provides a structured approach for evaluating and weighting criteria in spatial decision-making, it requires subjective judgments from experts, which may introduce biases and uncertainties into the modeling process. Furthermore, the integration of AHP with the CA-Markov model adds complexity and increases the potential for errors, particularly in calibrating model parameters and interpreting results. Thus, while these methods offer valuable insights into future LULC dynamics, caution should be exercised in their application, and their limitations should be carefully considered when interpreting results and informing decision-making processes. Future research in this area holds promise for addressing several key avenues. Firstly, incorporating advanced machine learning techniques, such as deep learning algorithms, might enhance the accuracy and predictive capabilities of LULC models by leveraging the complexity of spatial and temporal data. Additionally, integrating socioeconomic and policy factors into predictive models might provide a more holistic understanding of the drivers of urbanization and land use changes. Furthermore, exploring the potential impacts of climate change on LULC dynamics and incorporating climate scenarios into predictive models would contribute to more robust and adaptive planning strategies. Moreover, investigating the effectiveness of different urban planning interventions and policies in mitigating the adverse effects of urban sprawl and promoting sustainable development warrants attention. Finally, engaging stakeholders and local communities in participatory planning processes might enhance the relevance and effectiveness of predictive models and facilitate more inclusive and sustainable urban development pathways.

6. Conclusions

The methodology proposed for investigating the built-up scenario of Kamrup Metropolitan underwent comprehensive scrutiny, covering the temporal spectrum from 2000 to 2022 and extending into future projections for 2032 and 2052. By employing supervised machine learning, the study facilitated robust outcomes, generating dependable LULC mappings that delineate the transition from agricultural to urban domains, highlighting the trajectory of urbanization. Validation through Shannon’s entropy revealed spatial and directional characteristics of urban expansion, with a notable tendency towards both inward development and outward sprawl, particularly in western regions. Our landscape fragmentation analysis, utilizing metrics such as contagion, patch number, and edge density, demonstrated consequential loss and fragmentation, predominantly affecting vegetation, agricultural lands, and forests. Projection using the CA-Markov model indicated a discernible escalation in built-up zones, predominantly towards the west. The integration of AHP assisted in delineating suitable zones for future built-up expansion. While acknowledging the potency of remote sensing data, uncertainties regarding data quality and resolution were noted. The study underscores the imperative of sustainable land management and urban planning interventions to mitigate the deleterious effects of urban sprawl while charting a sustainable developmental trajectory. Our recommendations include integrating strategic urban planning with smart growth policies, enhancing public transportation, adopting sustainable land use practices, promoting urban greening, and engaging local communities in planning processes. These strategies contribute to a holistic approach to sustainable urban development, aligning with global sustainability goals. Future research endeavors aim to delve into the time-series analysis of urban settlements from multifaceted perspectives. By examining various aspects, including demographic shifts, infrastructure development, environmental impacts, and ecosystem conservation, efforts can be directed toward addressing the challenges posed by rapid urbanization while ensuring sustainable development and environmental conservation in the Kamrup Metropolitan District.

Author Contributions

Conceptualization, G.M., S.K., U.C. and S.K.S.; Methodology, G.M., S.K., S.K.S., A.K., P.K. and U.C.; Software, A.K. and U.C.; Validation, G.M., S.K., P.K., U.C. and A.K.; Formal Analysis, G.M., S.K., U.C., P.K. and A.K.; Investigation, G.M., S.K. and U.C.; Resources, S.K. and P.K.; Data Curation, G.M., S.K. and P.K.; Writing—Original Draft Preparation, G.M., S.K., U.C. and A.K.; Writing—Review and Editing, G.M. and S.S.; Visualization, G.M. and S.K.S.; Supervision, S.K. and S.K.S.; Project Administration, G.M. and S.K.S. All authors have read and agreed to the published version of the manuscript.

Funding

This research received no external funding.

Data Availability Statement

The data shall be available from the first author upon reasonable request.

Acknowledgments

The authors would like to thank three anonymous reviewers for their critical comments on the earlier versions of this manuscript that helped a lot to improve this manuscript. The corresponding author G.M. acknowledges the support of Japan Society for the Promotion of Science for JSPS KAKENHI (Grant Number 23KF0024).

Conflicts of Interest

The authors declare no conflict of interest.

References

  1. Theres, L.; Radhakrishnan, S.; Rahman, A. Simulating Urban Growth Using the Cellular Automata Markov Chain Model in the Context of Spatiotemporal Influences for Salem and Its Peripherals, India. Earth 2023, 4, 16. [Google Scholar] [CrossRef]
  2. Abass, K.; Adanu, S.K.; Agyemang, S. Peri-urbanisation and loss of arable land in Kumasi Metropolis in three decades: Evidence from remote sensing image analysis. Land Use Policy 2018, 72, 470–479. [Google Scholar] [CrossRef]
  3. 68% of the World Population Projected to Live in Urban Areas by 2050, Says UN|UN DESA|United Nations Department of Economic and Social Affairs. Available online: https://www.un.org/development/desa/en/news/population/2018-revision-of-world-urbanization-prospects.html (accessed on 30 March 2024).
  4. Patra, S.; Sahoo, S.; Mishra, P.; Mahapatra, S.C. Impacts of urbanization on land use/cover changes and its probable implications on local climate and groundwater level. J. Urban Manag. 2018, 7, 70–84. [Google Scholar] [CrossRef]
  5. Xiao, J.; Shen, Y.; Ge, J.; Tateishi, R.; Tang, C.; Liang, Y.; Huang, Z. Evaluating urban expansion and land use change in Shijiazhuang, China, by using GIS and remote sensing. Landsc. Urban Plan. 2006, 75, 69–80. [Google Scholar] [CrossRef]
  6. Cristina, M.; Elvidge, C.; Nemani, R.; Running, S. Assessing the impact of urban land development on net primary productivity in the southeastern United States. Remote Sens. Environ. 2003, 86, 401–410. [Google Scholar] [CrossRef]
  7. Small, C.; Nicholls, R.J. A Global Analysis of Human Settlement in Coastal Zones. J. Coast. Res. 2003, 19, 584–599. [Google Scholar]
  8. Ozturk, D. Urban Growth Simulation of Atakum (Samsun, Turkey) Using Cellular Automata-Markov Chain and Multi-Layer Perceptron-Markov Chain Models. Remote Sens. 2015, 7, 5918–5950. [Google Scholar] [CrossRef]
  9. Inter-Calibration and Urban Light Index of DMSP-OLS Night-Time Data for Evaluating the Urbanization Process in Australian Capital TerritoryInter-calibration and Urban Light Index of DMSP-OLS Night-Time Data for Evaluating the Urbanization Process in Australian Capital Territory. Available online: https://www.researchgate.net/publication/329175413_Inter-calibration_and_Urban_Light_Index_of_DMSP-OLS_Night-Time_Data_for_Evaluating_the_Urbanization_Process_in_Australian_Capital_TerritoryInter-calibration_and_Urban_Light_Index_of_DMSP-OLS_Night-Tim (accessed on 30 March 2024).
  10. Ebrahimipour, A.; Farshchin, A. Prediction of Urban Growth through Cellular Automata-Markov Chain. Bull. Soc. R. Sci. Liege 2016, 85, 824–839. [Google Scholar] [CrossRef]
  11. Land-Use Change Modeling with Cellular Automata Using Land Natural Evolution Unit—ScienceDirect. Available online: https://www.sciencedirect.com/science/article/pii/S0341816223000899 (accessed on 30 March 2024).
  12. Khawaldah, H.A.; Farhan, I.; Alzboun, N.M. Simulation and prediction of land use and land cover change using GIS, remote sensing and CA-Markov model. Glob. J. Environ. Sci. Manag. 2020, 6, 215–232. [Google Scholar] [CrossRef]
  13. AHP Approach—An Overview|ScienceDirect Topics. Available online: https://www.sciencedirect.com/topics/economics-econometrics-and-finance/ahp-approach (accessed on 30 March 2024).
  14. Assessment of Urban Growth in Relation to Urban Sprawl Using Landscape Metrics and Shannon’s Entropy Model in Jalpaiguri Urban Agglomeration, West Bengal, India. Available online: https://www.researchgate.net/publication/377700661_Assessment_of_urban_growth_in_relation_to_urban_sprawl_using_landscape_metrics_and_Shannon’s_entropy_model_in_Jalpaiguri_urban_agglomeration_West_Bengal_India (accessed on 30 March 2024).
  15. Cabral, P.; Augusto, G.; Tewolde, M.; Araya, Y. Entropy in Urban Systems. Entropy 2013, 15, 5223–5236. [Google Scholar] [CrossRef]
  16. Verma, N. Urban Expansion in Northeast India: A Case Study of Guwahati, Assam, orfonline.org. 2023. Available online: https://www.orfonline.org/expert-speak/urban-expansion-in-northeast-india/ (accessed on 30 April 2024).
  17. Pattnaik, J.K. Act East through the North-East, Mainstream, Vol LIII, No 16. 2015. Available online: https://www.mainstreamweekly.net/article5596.html (accessed on 22 April 2017).
  18. Hazarika, N.; Dutta, S.S.; Devi, D.; Sonowal, M. Urbanization in Assam: Its Impact On Socioeconomic Development and Environment. J. Pharm. Negat. Results 2023, 14, 1679–1685. [Google Scholar]
  19. Deka, N. Deprivation characteristics of slum dwellers in Guwahati City of assam (india): Statistics and beyond. Social Science Research Network (SSRN), 2023; preprint. [Google Scholar] [CrossRef]
  20. Wang, S.W.; Munkhnasan, L.; Lee, W.-K. Land use and land cover change detection and prediction in Bhutan’s high-altitude city of Thimphu, using cellular automata and Markov chain. Environ. Chall. 2021, 2, 100017. [Google Scholar] [CrossRef]
  21. Das, S.; Jain, G.V. Assessment and prediction of urban expansion using CA-based Sleuth Urban Growth Model: A case study of kolkata metropolitan area (KMA), West Bengal, India. J. Indian Soc. Remote Sens. 2022, 50, 2277–2302. [Google Scholar] [CrossRef]
  22. Xu, T.; Gao, J.; Coco, G. Simulation of urban expansion via integrating artificial neural network with Markov chain—Cellular automata. Int. J. Geogr. Inf. Sci. 2019, 33, 1960–1983. [Google Scholar] [CrossRef]
  23. Rimal, B.; Sloan, S.; Keshtkar, H.; Sharma, R.; Rijal, S.; Shrestha, U.B. Patterns of Historical and Future Urban Expansion in Nepal. Remote Sens. 2020, 12, 628. [Google Scholar] [CrossRef]
  24. Palanisamy, A. Analysis of land use/land cover changes using geospatial techniques in Salem district, Tamil Nadu, South India. SN Appl. Sci. 2019, 1, 432. [Google Scholar] [CrossRef]
  25. Pawe, C.K.; Saikia, A. Decumbent development: Urban sprawl in the Guwahati Metropolitan Area, India. Singap. J. Trop. Geogr. 2020, 41, 226–247. [Google Scholar] [CrossRef]
  26. India—Census of India 2011—Assam—Series 19—Part XII B—District Census Handbook, Kamrup Metropolitan. Available online: https://censusindia.gov.in/nada/index.php/catalog/225 (accessed on 23 February 2024).
  27. Harshasimha, A.C.; Bhatt, C.M. Flood Vulnerability Mapping Using MaxEnt Machine Learning and Analytical Hierarchy Process (AHP) of Kamrup Metropolitan District, Assam. Environ. Sci. Proc. 2023, 25, 73. [Google Scholar] [CrossRef]
  28. Kamrup Metropolitan District Population Census 2011–2021–2024, Assam Literacy Sex Ratio and Density. Available online: https://www.census2011.co.in/census/district/156-kamrup-metropolitan.html (accessed on 30 March 2024).
  29. (PDF) Spatio Temporal Analysis of Urban Expansion and Its Impact on Land Use Land Cover: A Case Study of Guwahati Metropolitan Area. Available online: https://www.researchgate.net/publication/328338142_Spatio_temporal_analysis_of_urban_expansion_and_its_impact_on_land_use_land_cover_A_case_study_of_Guwahati_metropolitan_area (accessed on 30 March 2024).
  30. Mahadevia, D.; Desai, R.; Mishra, A. City Profile: Guwahati; Centre for Urban Equity (CUE), CEPT University: Ahmedabad, India, 2014. [Google Scholar]
  31. Choudhury, U.; Singh, S.K.; Kumar, A.; Meraj, G.; Kumar, P.; Kanga, S. Assessing Land Use/Land Cover Changes and Urban Heat Island Intensification: A Case Study of Kamrup Metropolitan District, Northeast India (2000–2032). Earth 2023, 4, 26. [Google Scholar] [CrossRef]
  32. Cell Size of Raster Data—ArcMap|Documentation. Available online: https://desktop.arcgis.com/en/arcmap/latest/manage-data/raster-and-images/cell-size-of-raster-data.htm (accessed on 30 March 2024).
  33. Accuracy Assessment of Land Use/Land Cover Classification Using Remote Sensing and GIS. Available online: https://www.scirp.org/html/14-2801413_75926.htm (accessed on 30 March 2024).
  34. Lu, L.; Weng, Q.; Xiao, D.; Guo, H.; Li, Q.; Hui, W. Spatiotemporal Variation of Surface Urban Heat Islands in Relation to Land Cover Composition and Configuration: A Multi-Scale Case Study of Xi’an, China. Remote Sens. 2020, 12, 2713. [Google Scholar] [CrossRef]
  35. A Constrained CA Model for the Simulation and Planning of Sustainable Urban Forms by Using GIS—Anthony Gar-On Yeh, Xia Li. 2001. Available online: https://journals.sagepub.com/doi/10.1068/b2740?icid=int.sj-abstract.similar-articles.6 (accessed on 30 March 2024).
  36. Sarvestani, M.; Ibrahim, A.L.; Kanaroglou, P. Three decades of urban growth in the city of Shiraz, Iran: A remote sensing and geographic information systems application. Cities 2011, 28, 320–329. [Google Scholar] [CrossRef]
  37. Xiao, R.; Shen, Z.; Ye, Y.; Zhang, Y.; Wu, J. Assessing the effects of landscape patterns on urban sprawl using Shannon’s entropy: A case study of Shanghai, China. Landsc. Urban Plan. 2014, 121, 35–49. [Google Scholar]
  38. Deng, X.; Hagen, S.C. Urban sprawl sustainability assessment using entropy-weighted TOPSIS approach. J. Environ. Manag. 2012, 101, 96–105. [Google Scholar]
  39. Cardille, J.; Turner, M. Understanding Landscape Metrics. In Learning Landscape Ecology: A Practical Guide to Concepts and Techniques; Springer: Berlin/Heidelberg, Germany, 2017; pp. 45–63. [Google Scholar] [CrossRef]
  40. McGarigal, K. FRAGSTATS: Spatial Pattern Analysis Program for Quantifying Landscape Structure; U.S. Department of Agriculture, Forest Service, Pacific Northwest Research Station: Washington, DC, USA, 1995. [Google Scholar]
  41. Huang, W.; Liu, H.; Luan, Q.; Bai, M.; Mu, X. Monitoring Urban Expansion in Beijing, China by Multi-Temporal TM and SPOT Images. In Proceedings of the IGARSS 2008–2008 IEEE International Geoscience and Remote Sensing Symposium, Boston, MA, USA, 7–11 July 2008; p. 698. [Google Scholar] [CrossRef]
  42. Neural-Network-Based Cellular Automata for Simulating Multiple Land Use Changes Using GIS. Available online: https://www.researchgate.net/publication/220649562_Neural-Network-Based_Cellular_Automata_for_Simulating_Multiple_Land_Use_Changes_Using_GIS (accessed on 30 March 2024).
  43. Cellular Automata Models for the Simulation of Real-World Urban Processes: A Review and Analysis. Available online: https://www.researchgate.net/publication/222061317_Cellular_automata_models_for_the_simulation_of_real-world_urban_processes_A_review_and_analysis (accessed on 30 March 2024).
  44. Multi-Criteria Decision-Making (MCDM) as a Powerful Tool for Sustainable Development: Effective Applications of AHP, FAHP, TOPSIS, ELECTRE, and VIKOR in Sustainability. Available online: https://www.researchgate.net/publication/370074323_Multi-Criteria_Decision-Making_MCDM_as_a_powerful_tool_for_sustainable_development_Effective_applications_of_AHP_FAHP_TOPSIS_ELECTRE_and_VIKOR_in_sustainability (accessed on 30 March 2024).
  45. Omar, N.; Ahamad, M.S.S.; Hussin, W.; Samat, N.; Ahmad, S.Z. Markov CA, Multi Regression, and Multiple Decision Making for Modeling Historical Changes in Kirkuk City, Iraq. J. Indian Soc. Remote Sens. 2014, 42, 165–178. [Google Scholar] [CrossRef]
  46. Applying the Analytical Hierarchy Process (AHP) Approach to Convention Site Selection. Available online: https://www.researchgate.net/publication/249701097_Applying_the_Analytical_Hierarchy_Process_AHP_Approach_to_Convention_Site_Selection (accessed on 30 March 2024).
  47. AHP, a Reliable Method for Quality Decision Making: A Case Study in Business. Available online: https://www.researchgate.net/publication/357122781_AHP_a_Reliable_Method_for_Quality_Decision_Making_A_Case_Study_in_Business (accessed on 30 March 2024).
  48. Saaty, T.L. The Analytic Hierarchy Process; McGraw-Hill: New York, NY, USA, 1980. [Google Scholar]
  49. Saaty, T.L. Decision making with the analytic hierarchy process. Int. J. Serv. Sci. 2008, 1, 83–98. [Google Scholar] [CrossRef]
  50. Sharma, I. The Growing Role of Assam in India’s Foreign Policy, Eurasia Review. 2017. Available online: https://www.eurasiareview.com/27062017-the-growing-role-of-assam-in-indias-foreign-policy (accessed on 30 March 2024).
  51. Sultana, M. The Effect of Urbanisation on Environment: With Special Reference to the City of Guwahati, Assam. PalArch’s J. Archaeol. Egypt/Egyptol. 2020, 17, 98–105. Available online: https://archives.palarch.nl/index.php/jae/article/view/3290 (accessed on 30 March 2024).
  52. Act East Policy|Assam State Portal. Available online: https://assam.gov.in/business/438 (accessed on 30 March 2024).
  53. Pawe, C.K.; Saikia, A. These hills called home: Quantifying Urban Forest Dynamics in the hills of the Guwahati Metropolitan Area, India. Geogr. Tidsskr. -Dan. J. Geogr. 2022, 122, 87–102. [Google Scholar] [CrossRef]
  54. Bhattacharjee, J.; Mishra, S.; Acharjee, S. Monitoring of land use/land cover changes and its implications in the peri-urban areas using multi-temporal landsat satellite data: A case study of Guwahati city, Assam, India. Proc. Indian Natl. Sci. Acad. 2022, 88, 778–789. [Google Scholar] [CrossRef]
Figure 1. Location map of the study area, Kamrup Metropolitan District.
Earth 05 00009 g001
Figure 2. The standardized factors and constraints used in AHP: (a) Elevation; (b) proximity to built-up; (c) proximity to point of interest (POI); (d) proximity to roads; (e) slope; (f) water body; (g) reserved forest (protected areas).
Earth 05 00009 g002
Figure 3. Land use and land cover classification for the years (a) 2000, (b) 2014, and (c) 2022.
Earth 05 00009 g003
Figure 4. Graphical representation of the changing trend of LULC (2000–2022).
Earth 05 00009 g004
Figure 5. Built-up distribution of Kamrup Metropolitan among different buffer zones for the years (a) 2000, (b) 2014, and (c) 2022.
Earth 05 00009 g005
Figure 6. Representing the built-up density in each buffer for the years 2000, 2014, and 2022.
Earth 05 00009 g006
Figure 7. Diagram illustrating landscape metrics at the class level within the Kamrup Metropolitan District.
Earth 05 00009 g007
Figure 8. (a) Built-up for 2022, (b) projected Built-up for 2032, and (c) projected Built-up for 2052.
Earth 05 00009 g008
Table 1. Dataset (sensors, resolution, and sources).
DateSensorsPath/RowResolutionSources
2 November 2000Landsat 5 TM137/4230https://earthexplorer.usgs.gov/ (accessed on 27 December 2022)
9 November 2014Landsat 8 OLI137/4230
15 November 2022Landsat 8 OLI137/4230
Digital Elevation ModelCARTOSAT 30https://bhuvan.nrsc.gov.in/ (accessed on 5 May 2022)
Topological Map https://www.surveyofindia.gov.in/ (accessed on 28 February 2024)
Road Layer https://www.openstreetmap.org/ (accessed on 5 May 2022)
Table 2. List of the quantified landscape metrics in the study.
MetricsDescriptionUnits
Class area (CA)The summation of the areas of all the patches of similar class type, divided by 10,000.Hectares
Number of patches (NP)Quantification of the number of patches of corresponding class types.None
Edge density (ED)This involves the length of the boundary of patches of the same class type abutting each other in a per-hectare area.Meters per hectare
LPILPI equals the percentage of the landscape comprised by the largest patch.Percent
Fractal dimension index (FRAC)For simple patch shapes, this metric approaches a value of 1, and complicated patch shapes with high convolution give a value of 2.None
ENN_MNThe shortest distance between two neighboring patches of the same class type.Meters
CONTAGCONTAG approaches 0 when the patch types are maximally disaggregated. CONTAG = 100 when all patch types are maximally aggregated.Percent
Table 3. Criteria of the influencing factors for fuzzy standardization.
FactorsMembership Function TypeMembership Function ShapeControl Points
Slope (°)SigmoidMonotonically decreasingc = 0, d = 20
ElevationSigmoidMonotonically decreasingc = 0, d = 35
Proximity to roadSigmoidMonotonically decreasingc = 0, d = 150
Proximity to built-upSigmoidMonotonically decreasingc = 0, d = 200
Proximity to POISigmoidMonotonically decreasingc = 0, d = 2000
Table 4. Pairwise comparison between the factors using the AHP approach.
AHP WEIGHT DERIVATION
Pairwise Comparison 9 Point Continuous Rating Scale
Less ImportantMore Important
1/91/71/51/313579
ExtremelyVery StronglyStronglyModeratelyEquallyModeratelyStronglyVery StronglyExtremely
FactorsDEMProximity to Built-upProximity to POIProximity to RoadSlope
DEM11/91/71/71/3
Proximity to Built-up91335
Proximity to POI71/3135
Proximity to Road71/31/315
Slope31/51/51/51
Table 5. The weights assigned to the influencing factors and consistency ratio.
The Eigenvector of the Weights
Slope0.0629
Proximity to built-up0.4498
Proximity to road0.2970
Proximity to POI0.2785
DEM0.0312
Consistency ratio0.08
Table 6. LULC area of various classes and their percentage growth from (2000–2022).
Area of LULC Classes for 2000, 2014, and 2022
LULC Class20002014Change (%)20142022Change (%)20002022Change (%)
Agriculture208.1121684134−5.61164586134121.0095−9.6944208.1122121.0095−41.8537
Barren Land31.5789156995200.83363519594.88797−0.1179331.5789294.88797200.4789
Forest/Tree550.581914646016.45203234460459.92010.01736550.5819459.9201−16.4665
Built-up48.63301339130167.3081327130166.42728.020848.63301166.427242.21
Vegetation118.406273414018.23697845140116.7802−6.5856118.4063116.7802−1.37332
Water Body33.3633265232−0.0863027363231.6702−0.0306133.3633331.6702−5.0748
Table 7. Accuracy assessment using kappa statistics for LULC (2000, 2014, and 2022).
User’s Accuracy (%) Producer’s Accuracy (%)Overall Accuracy Kappa
YearsAgricultureBarren LandDense ForestBuilt-upVegetationWater BodyAgricultureBarren LandDense ForestBuilt-upVegetationWater Body(%)
200085.77092.88083.390907096.28066.69087.382.5
201487.58089.193.782.39082.57595.383.393.381.887.584
202286.672.793.89092.899.7892.888.89285.781.288.88985.4
Table 8. Shannon’s entropy values from 2000–2022.
Distance from City Centre
(m)
Built-Up Area in Each Buffer Zone (sq. km)
200020142022
5 km17.1304130.4424530.44245
10 km18.8919770.365870.36579
15 km4.4692417.4820918.69887
20 km3.91672510.4680511.52802
25 km3.086210.94135110.95818
30 km1.0670660.0008649.277692
35 km0.043240.0023764.399319
40 km007.183438
45 km0.02815303.480194
Total48.63301130166.3339
Entropy0.4153149830.5034758050.91259466
Normalized entropy0.4352300170.5276182940.956355068
Table 9. Comparative analysis among classified LULC class metrics for the years 2000, 2014, and 2022.
YearTypeCANPLPIEDFRAC_AMENN_MNCONTAG
2000Agriculture20,712.2419,4026.651176.35831.262660.294545.5320
Barren land3283.5685120.062621.82131.109791.4972
Forest/Tree54,803.5210,88736.439557.60221.288165.7527
Built-up4849.2991451.572726.85341.19671.4021
Vegetation12,101.5823,1990.220672.97611.14263.8104
Water body3327.846191.5535.28671.2025122.1511
2014Agriculture13,359.610,3342.523343.09971.209377.42235.9230
Barren land9727.226,3920.222265.64471.10763.8254
Forest/Tree45,607.0514,77615.928978.17541.285160.3887
Built-up12,817.4473528.952635.81821.316560.482
Vegetation14,403.6926,4190.494884.93891.141860.5457
Water body3162.9611471.4414.74081.1868167.5914
2022Agriculture12,050.3710,4042.093239.60581.196178.535135.6256
Barren land9727.226,3920.222265.64461.10763.8254
Forest/Tree45,607.0514,77615.928978.17571.285160.3887
Built-up16,495.214,6518.952658.04911.278261.5013
Vegetation12,035.2525,9820.165675.99011.119861.8278
Water body3162.9611471.4414.74081.1868167.5914
Table 10. Markov transition probability matrix for 2000–2014, 2014–2022, and 2022–2032 (projected).
YearLULCAgricultureBarren LandForest/TreeBuilt-UpVegetationWater Body
2000–2014Agriculture0.38220.23350.06750.14580.160.011
Barren land0.54270.19650.02660.13960.06380.0308
Forest/Tree0.03120.05860.68960.01790.20120.0015
Built-up0000.79710.20290
Vegetation0.11230.20750.19310.18210.29550.0096
Water body0.00170.19250.04310.02390.04810.6907
2014–2022Agriculture0.7574000.242600
Barren land0.030.850.030.030.030.03
Forest/Tree0.030.030.850.030.030.03
Built-up0.030.030.030.850.030.03
Vegetation0000.30630.69370
Water body0.030.030.030.030.030.85
2022–2032Agriculture0.5460.00290.00060.44380.00050.0061
Barren land0.09480.725600.03740.07120.071
Forest/Tree0.07380.06050.64120.08190.07230.0704
Built-up0.01320.05890.01140.780.01020.1263
Vegetation0.00070.00360.00070.51730.47040.0074
Water body0.1292000.01980.03610.815
Table 11. Markov transition area matrix for 2000–2014, 2014–2022, and 2022–2032 (projected).
YearLULCAgricultureBarren landForest/TreeBuilt-upVegetationWater body
2000–2014Agriculture56,73534,66310,01921,64323,7441635
Barren land58,65021,235287215,08869003334
Forest/Tree15,81929,692349,4379077101,945775
Built-up000113,52328,8920
Vegetation17,96533,20630,90429,14247,2881536
Water body6167641515839169024,275
2014–2022Agriculture101,4080032,48500
Barren land324291,8683242324232423242
Forest/Tree15,20215,202430,73315,20215,20215,202
Built-up549854985498155,78754985498
Vegetation00040,96692,7590
Water body1054105410541054105429,872
2022–2032Agriculture69,0173737556,10163774
Barren land10,77482,4482424880938065
Forest/Tree32,49226,654282,46636,08731,82931,006
Built-up329214,6342839193,925252431,400
Vegetation854188460,90855,382869
Water body6967001068194643,958
Table 12. Statistics of the potential expansion of built-up in 2032 and 2052.
LULC2022 (Area in Sq. km)2032 (Area in Sq. m)Change % (2022–2032)2032 (Area in Sq. m)2052 (Area in Sq. m)Change % (2032–2052)
Built-Up824.2680763.8766−7.3267763.8766671.8511−12.0472
Non-built-up166.4270226.809436.2816226.8094318.758840.5404
Table 13. Cross tabulation results and kappa index of agreement (KIA).
Crosstabulation of 2022 Classified (Columns) against 2022 Projected (Rows)
ClassesNon-built-upBuilt-upTotal
Non-Built-up861,93849,641911,588
Built-up55,564133,613189,178
Total917,587183,2801,100,766
Chi-square = 3,078,365
df = 4
P-level = 0
Cramer’s V = 0.8472
Proportional Crosstabulation
ClassesNon-built-upBuiltupTotal
Non-built-up0.40190.02310.4251
Built-up0.02590.06230.0882
Total0.42790.08550.5133
Kappa index of agreement (KIA)
Using 2022 projected as the reference imageUsing 2022 classified as the reference image
Non-built-up0.9048Non-built-up0.8945
Built-up0.6788Built-up0.7028
Overal Kappa = 0.9144
Disclaimer/Publisher’s Note: The statements, opinions and data contained in all publications are solely those of the individual author(s) and contributor(s) and not of MDPI and/or the editor(s). MDPI and/or the editor(s) disclaim responsibility for any injury to people or property resulting from any ideas, methods, instructions or products referred to in the content.

