
The Application of Life Cycle Assessment to Evaluate the Environmental Impacts of Edible Insects as a Protein Source


Department of Management, Sapienza, University of Rome, Via del Castro Laurenziano 9, 00161 Rome, Italy
*
Author to whom correspondence should be addressed.
Earth 2022, 3(3), 925-938; https://doi.org/10.3390/earth3030054
Submission received: 23 June 2022
/
Revised: 26 July 2022
/
Accepted: 18 August 2022
/
Published: 20 August 2022
Abstract
:Animal based-food products represent an essential source of protein supply in overall diets, and livestock provide 25% of the total protein content consumed by humans as food. Concurrently, livestock significantly impacts the environment, being responsible for 10–12% of total anthropogenic CO2 emissions. Among livestock, pork is considered one that accounts for the greatest impact in terms of emissions, about 4.62 kg CO2 eq/kg. Furthermore, the growing global demand for protein sources has led to a widespread need to find agri-food solutions that meet the demand for food through sustainable production systems. The high nutritional quality of edible insects, in terms of amino acids, fats, minerals, and vitamins, is comparable with meat products. This study aims to compare protein production from pork and mealworm, assessing the degree of substitution and environmental impacts of the two production systems. To assess the impacts of protein production from mealworms and pork on the ecosystem, resources, and human health, an LCA was conducted using the ReCiPe 2016 Endpoint method, with a 100-year hierarchical perspective (H) V1.05. It emerged that pork production is characterized by high impacts on the ecosystem, land use, climate-altering emissions, and fossil resources, in contrast with mealworm protein production. The low impact of insect protein production and the high nutritional values make edible insects a sustainable solution to growing food demand and economic benefits render edible insects globally a major potential future food.
1. Introduction
The recent pandemic crisis has affected the progress of achieving the goals defined in the 2030 Agenda, such as food security [1], but also the development of solutions to mitigate the impacts of agribusiness production. It has been estimated by the Food and Agriculture Organization (FAO) that the pandemic crisis led to chronic hunger among 83–132 million people (2020), with world hunger increasing between 8.4 and 10.4% globally just in 2020 [2]. Food insecurity is all the more worrying when compared with the prospects for global population growth. According to the latest projections from the World Population Prospect, the world’s population is continuously growing, and by 2050 it will reach 10.9 billion [3]. This, as well as the rise of the middle class, has a direct effect on the growth of global food demand, especially the demand for protein products, which risk increasing the spread of intensive animal husbandry practices [4]. In industrialized countries (ICs), the average daily consumption of animal-origin protein is more than double the average consumption in developing countries (DCs) [5]. According to the FAO, to satisfy the growing protein demand, world meat production will reach 352.7 million tons (in carcass weight equivalent) by 2021, registering a 4.2% increase over the previous year. However, intensive livestock systems have been shown to produce externalities such as soil and water pollution and deforestation, thus contributing to climate change [6]. In terms of production efficiency, pork meat is considered one of the most impactful, accounting for 4.62 of GHG emissions kg CO2 eq/kg of product at farmgate, following lamb (20.44 kg CO2 eq/kg of product), and beef (15.23 kg CO2 eq/kg of product) meats [7]. In these regards, pork production was chosen to serve as an animal-based benchmark for insect (T. molitor larvae) production. It has been estimated that for the production of equal amounts of protein, insect farms consume only one hectare of land compared with 2–5 hectares occupied for pork farming [8]. Therefore, combating climate change associated with livestock GHGs emissions, thus providing energy and nutritional requirements for the increasing human population, is the major challenge today. In this scenario, insects represent a valuable protein source for human nutrition and are therefore counted among the possible solutions. Insects are the largest class of animals among the groupings of animals that populate our planet [9]. The consumption of insects is already widespread: About 2000 species are regularly consumed, and 9 are currently cultivated for human and animal food, according to the European Scientific Committee on Food Safety (2015). Entomophagy is a practice in multiple areas of our planet; it is widespread in 113 countries, and it contributes up to 50% of the protein intake of some populations [10]. According to the FAO [11], insects are part of the traditional diet of at least 2 billion people and more than 2000 species are used as food. Insect consumption is well known in Thailand, where a typical family eats an average of about 49 kg of ant larvae and pupae per harvesting season. Insect consumption is also widespread in China, where the medicinal and trophic values of insects are well known [12]. About 26 ethnic groups in the country currently consume insects, such as the Guangxi Zhuang who eat ants and the Dai minority who use ant eggs in hospitality rituals [13]. Gao et al. report that the Chinese oak moth (Antheraea pernyi) was recently listed as a new common food source by the Ministry of Health of the People’s Republic of China. Recent regulatory developments such as the entry into force of the European Food Safety Authority (EFSA)’s Novel Foods Regulation, which addressed the non-harmfulness of novel foods such as a range of edible insects and the publication of “Safety of dried yellow mealworm (Tenebrio Molitor larvae) as a novel food under Regulation (EU) 2015/2283” (EFSA) and the “Guidance on sustainable cricket farming—A practical manual for farmers and inspectors” (FAO) reflect the widespread interest in the subject. The market for edible insects is also expected to reach a value of USD billion by 2030. Although the value of the edible insect market (USD 770.96 million in 2021 [5]) is significantly lower than that of animal meat (USD 867.3 billion in 2021) [14], statistics predict strong market growth, especially in ICs such as in North America (up 28% by 2023) [11]. However, the mass production of edible insect protein is still not competitive compared with traditional meat production. It is also estimated that by 2054, 33% of global protein sources will be alternative, to 311 million metric tons, of which insects account for 11% [15,16]. From an environmental perspective, compared with livestock production, many insects have high feed conversion efficiency, can be raised with side streams, and emit fewer GHGs [9]. As shown in a life cycle analysis (LCA) study, cricket production has a lower environmental impact than pork farms. LCA is an international standardized methodology for assessing the environmental and human health impacts associated with a product or a service. It was considered a valuable tool for evaluating the sustainability of the production of animal-based food [8,9].
In terms of nutrition, insects are foodstuffs capable of meeting daily energy demand while also providing the right amount of protein for human diets [17]. Studies have shown that 100 g of insect has a similar energy content to that of 100 g of meat (fresh weight), the exception being pork given its high fat content [18]. It is important to consider the nutritional value and in particular the biological value of proteins, which depends on the type of amino acids present, essential or non-essential, and the digestibility of the proteins, which refers to the digestibility of amino acids. Essential amino acids are indispensable but the metabolism cannot synthesize them, so they must be taken in through food. In this sense, insects can provide high-quality protein and many nutrients comparable with those provided by meat and fish [19]. On average, the protein content of edible insects ranges from 35% to 60% based on dry matter, thus being higher than that of vegetable protein sources (e.g., cereals, soy, and lentils) and comparable with animal protein sources, such as chicken meat and eggs [20,21]. During the period 2016–2018, the worldwide average daily consumption of animal-origin protein was about 36.19 g per day per person [22]. Many studies have focused solely on the nutritional and environmental benefits of widespread insect production as an alternative protein source to animal protein [4,6]. This paper aims to provide an assessment of the effects of the widespread use of insects as a sustainable solution to the growing demand for protein in diets.
2. Materials and Methods
According to standards ISO 14040:2006 and ISO 14044:2006, LCA is a standard tool for environmental impact assessment, and it should involve four phases [23,24]: (1) goal and scope definition, describing the objective of the study, the functional unit (FU), and the system boundary; (2) a life cycle inventory (LCI), collecting the data necessary for the environmental assessment of the product, process, or activity; (3) a life cycle impact assessment (LCIA), which is aimed at evaluating sustainability in terms of impacts on the environment, human health, and resources; and (4) interpretation of results, in which LCIA results are interpreted according to the objectives and scope definition. SimaPro 9.2.2 (PRè-Sustainability, B.V.). software was used for the evaluation of environmental impacts. The data analyzed in the study were partly processed based on those collected by previous studies [25,26,27].
2.1. Goal and Scope Definition
This study aimed to assess the environmental performance of the production of an edible insect, mealworm (Tenebrio Molitor), for human consumption, comparing it with protein production from pork.
2.1.1. Functional Unit (FU)
Considering the possibility of introducing edible insects as an alternative food source for protein, 1 kg of edible protein was chosen as the equivalent nutritional value FU of both worm meat and pork. According to Dreyer et al. (2021) [25], the protein content of a food is assessed by its nitrogen content, which is determined using the modified Kjeldahl method. The Kjeldahl method evaluates most of the nitrogen in food, excluding nitrates, nitrites, and some cyclic nitrogen compounds. The edible protein of mealworms was then calculated as follows:
where N is the amount of nitrogen; 6.25 corresponds to a typical conversion factor usually used for insects [25,28]. As nitrogen is also bound to the chitin of the worm’s exoskeleton, the average nitrogen values determined were subtracted from the reported values of 5–6% chitin-bound nitrogen [29]. It was therefore concluded that 1 kg of mealworm protein requires 7.30 kg of mealworm mass as the live weight.
Crude protein (g/kg) = g N/kg × 6.25
In contrast, for pork production, the edible protein fraction was calculated following the proportions found in the study by Flachowsky [30], who initially distinguished between the edible fraction, i.e., meat plus edible organs and tissues, and the live weight product (LWP), which represents the actual weight of the animal before slaughter. The calculation for pork is carried out as follows:
1 kg LWP = 0.60 kg edible fraction
Then, the protein content within the edible fraction is calculated, which for pork corresponds to the following ratio:
1 kg edible fraction = 0.150 kg edible protein.
Summarizing by relating 1 kg of edible protein to the LWP, we obtain the following formula [30]:
1 kg edible protein = 11.05 kg LWP
Data for mealworm and pork production were derived from Dreyer, Pazmiño, and Reckmann and supplemented with data from the Statista database 2019 for edible insect protein and FAOSTAT, 2021 for pork production. Calculations related to edible protein from mealworms and pork are reported in Supplementary Materials (Section 2.1.1).
2.1.2. System Boundary Definition
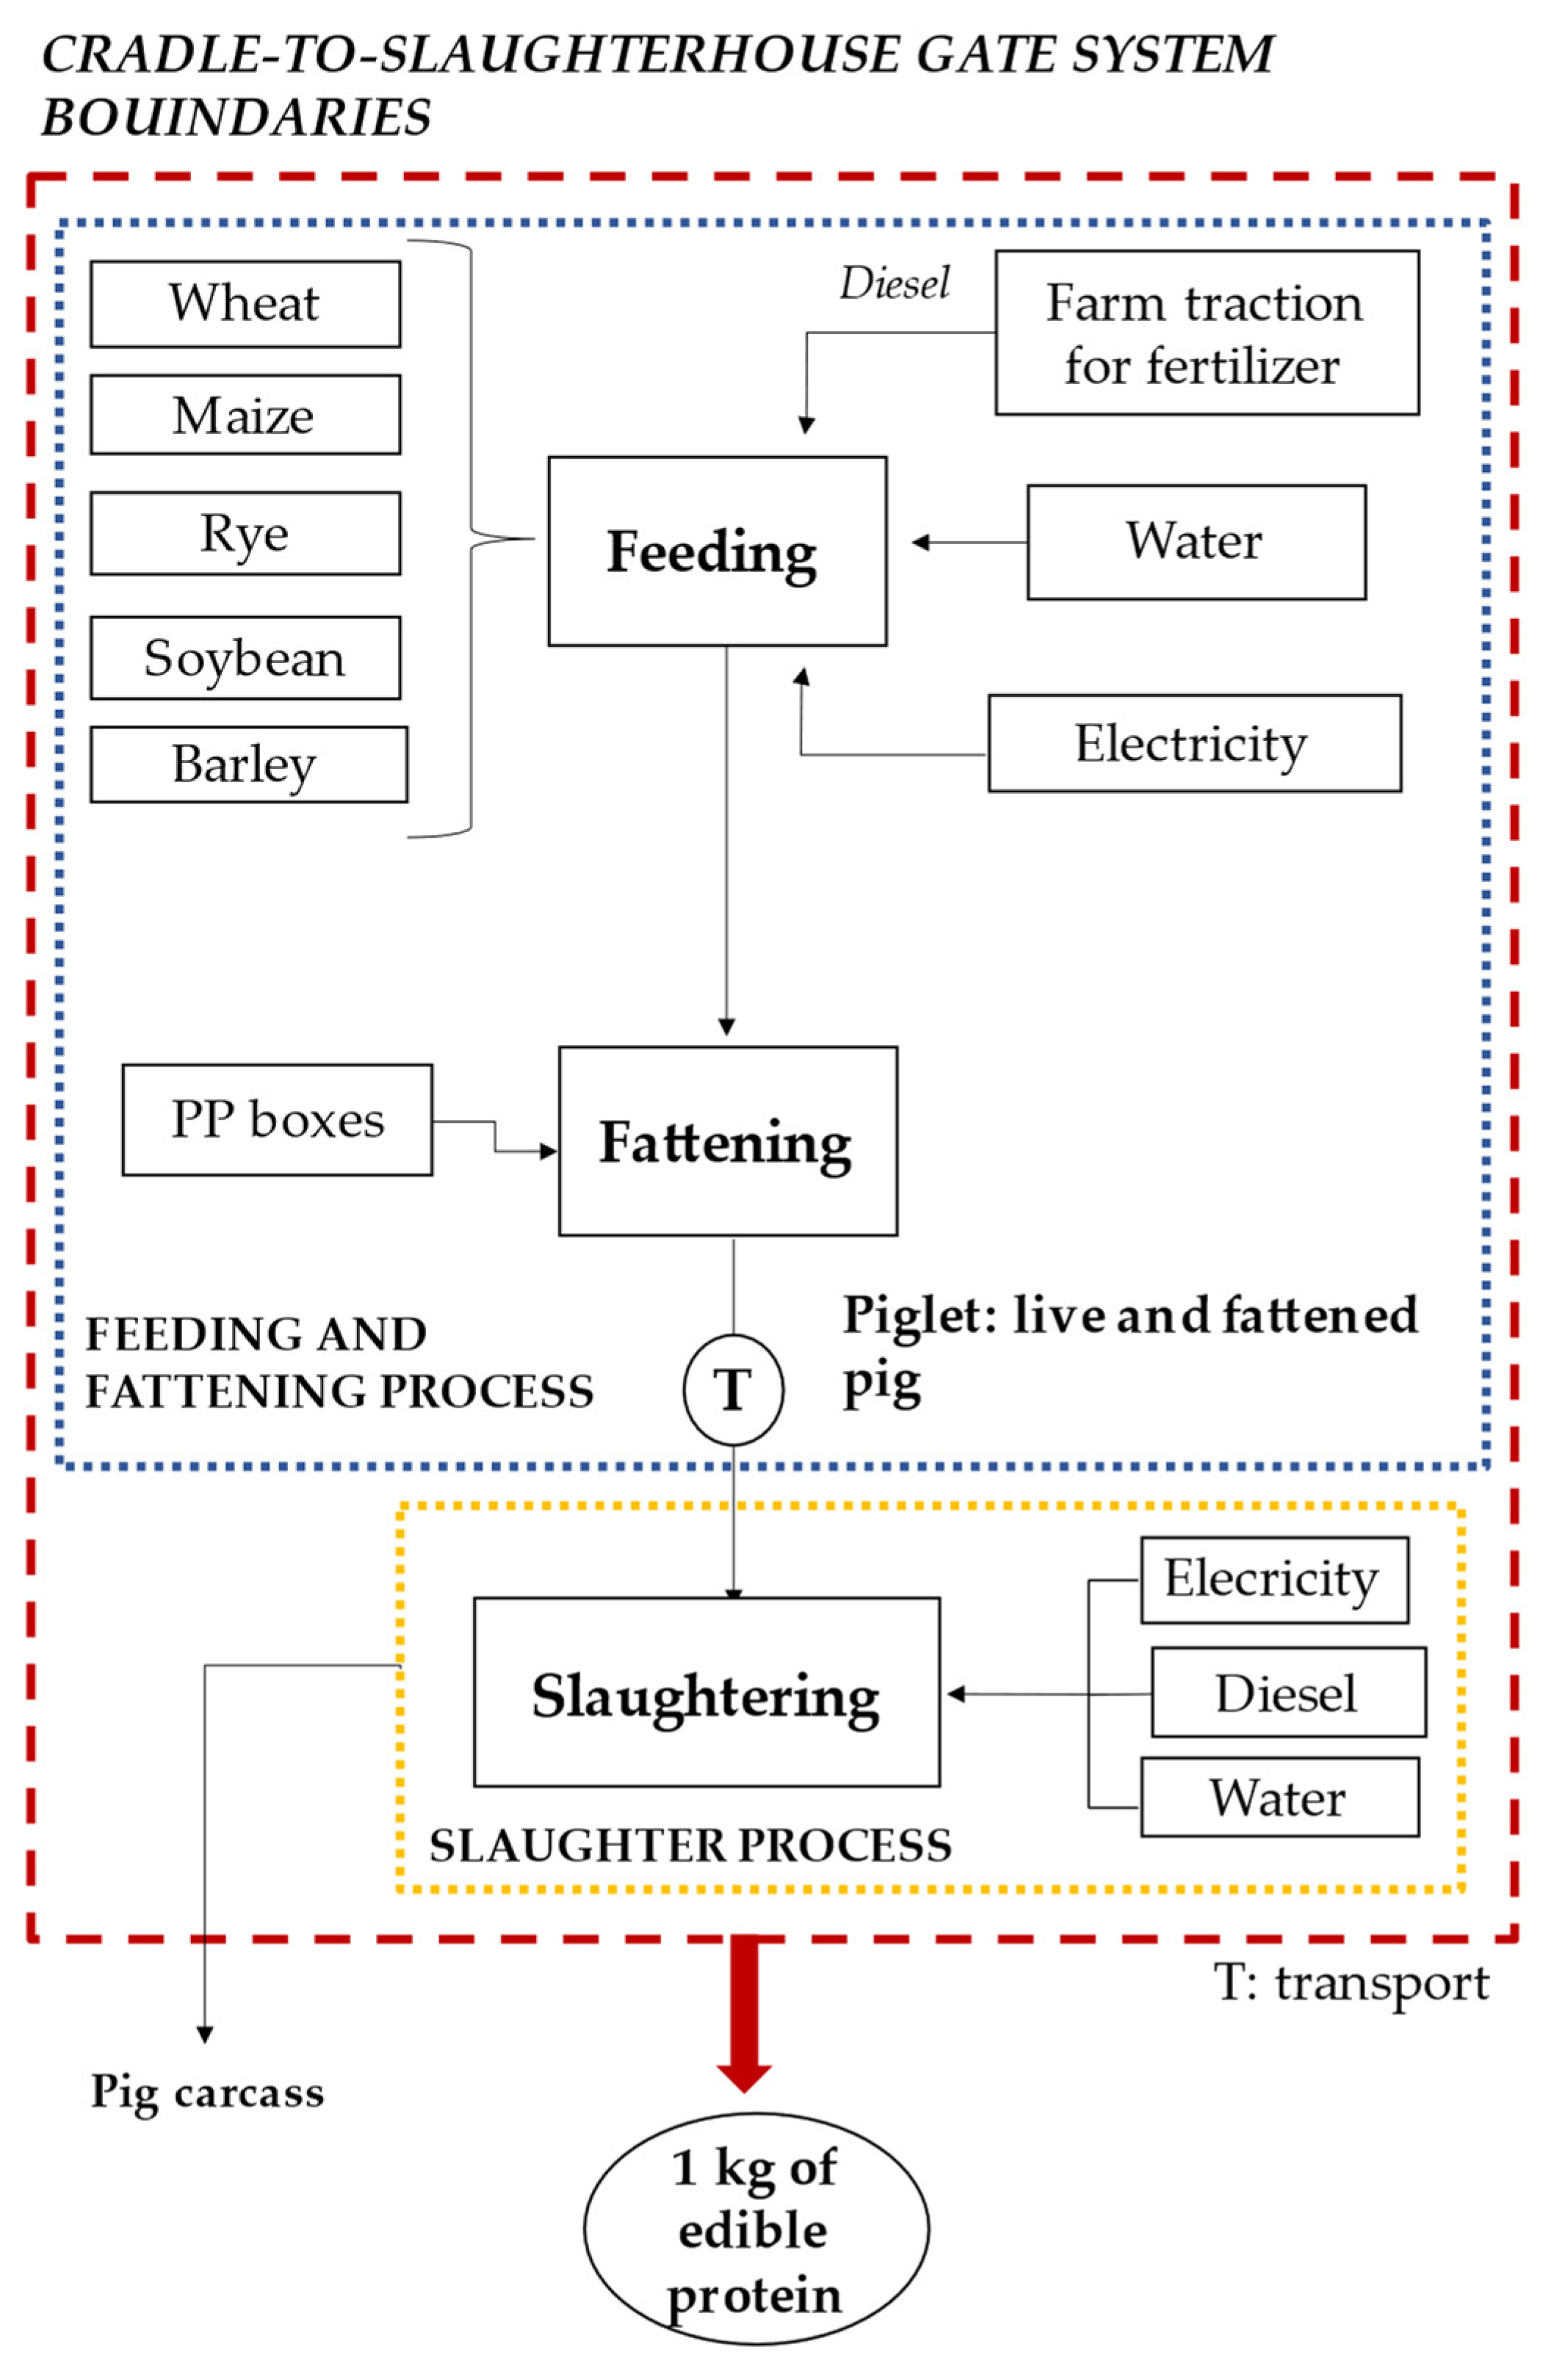
The system boundary was defined on a cradle-to-slaughterhouse gate, thus considering the environmental impacts from the animal’s breeding until slaughter. The system accounts for the feeding of animals, including on-farm operations (as farm traction for fertilizer), feed production, rearing facilities (polypropylene boxes), slaughtering operations, and the production of inputs such as electricity and feed. Concerning insect production, mealworms are eaten without chitin, which was subtracted from the final weight. According to data obtained from farm suppliers, the feed formulation comprises wheat bran (70%), maize (12%), brewer’s yeast (10%), and lucerne (8%) [25,26]. The transportation from the field to the mealworm farm gate was assessed for all feed ingredients, while for pork production, the final product considered corresponded to a pork slaughter weight of about 95 kg. It was considered that the fattened porks were transported 350 km from the farm to the slaughterhouse, as mentioned in Dreier et al., 2012 [31].
In both production systems, the impacts related to manure management, the anaerobic digestion of manure, and handling waste products were not included. Figure 1 shows the flowchart related to the mealworm production system. The cradle-to-slaughterhouse gate approach for pork meat production is illustrated in Figure 2.
2.2. Life Cycle Inventory (LCI)
The inputs refer to the production of 1 kg of edible protein, which for mealworms corresponds to 7.3 kg of the killed and preserved animal and for pork meat corresponds to 11.05 kg of slaughtered and preserved animal. Inventory data for the mealworm production process were obtained and re-elaborated from a previously published study [25]. All the inputs necessary for mealworm production are shown in Table 1.
Primary inputs for pork production, shown in Table 2, were re-elaborated based on previous work [26].
For both systems, generic input processes and flow were obtained from the Agribalyse v3.0.1, Ecoinvent v3.8, and World Food LCA Database (WFLDB) v3.5 datasets [32]. Calculations for input values considered for production in both systems are reported in Supplementary Materials (Section 2.1.2).
2.3. Life Cycle Impact Assessment (LCIA)
The life cycle impact assessment phase was aimed at evaluating the contributions of both mealworms and pork meat production, thus providing information for the interpretation and comparison of their environmental performances. Re.Ci.Pe. 2016 Endpoint (H) V1.05 was used for the impact calculations. It consists of characterizing the consequences of midpoint impact categories at the endpoint level by requiring the modeling of all environmental mechanisms, linking inventory results with their respective impacts on three macro-categories: human health, ecosystems, and resources [33,34]. For human health, expressed in disability-adjusted life years (DALYs), the subcategories are global warming; human health; human carcinogenic toxicity; human noncarcinogenic toxicity; stratospheric ozone depletion; ionizing radiation; ozone formation; water consumption; and fine particulate matter formation. Ecosystems are expressed in species lost per year (species.yr); the subcategories are ozone formation; terrestrial ecosystems; terrestrial acidification; freshwater eutrophication; marine eutrophication; terrestrial ecotoxicity; freshwater ecotoxicity; marine ecotoxicity; land use; water consumption, terrestrial ecosystem; water consumption; and aquatic ecosystems. For resources, expressed in US USD as of 2013; the subcategories are mineral resource scarcity and fossil resource scarcity.
3. Results and Discussion
A sustainability assessment related to 1 kg edible protein (FU) from mealworm and pork production was carried out with life cycle analyses.
3.1. Sustainability Assessment of INSECT (T. molitor) Production
Table 3 shows the contributions of the three phases of the mealworm (T. molitor) production system, feeding, rearing and killing, and storage. The analysis of the output showed that mealworm production has a greater impact on human health and resources than on the ecosystem.
3.1.1. Human Health
Considering the human health macro-category, the impacts are the highest in the production phase, especially in the categories of fine particulate matter formation (3.72 × 10⁻⁵ DALYs per kg edible protein), water consumption (3.12 × 10⁻⁵ DALYs per kg edible protein) and global warming (2.58 × 10⁻⁵ DALYs per kg edible protein). As shown in Figure 3, in which all impact categories in three macro-areas (human health, ecosystem, and resources) and the influence of individual inputs for each macro area are summarized, the impacts on human health are mainly related to the composition of feedstuffs, in particular brewer’s yeast (43%) and maize grain (19%).
3.1.2. Ecosystem
Mealworm production is a source of greenhouse gas (GHGs) emissions, the impact of which can be considered within other indicators, such as global warming terrestrial and global warming freshwater ecosystems. The results showed that the highest values occur in the mealworm production phase, as upstream feed production and on-farm energy demand related to plant heating can be identified as environmental hotspots, and depending on the impact category, feed supply affects up to 90%. Feed production mainly comprises the cultivation and drying of harvested feed. The heating energy required for drying liquid brewer’s yeast was also taken into account. The impact in the feeding phase on the terrestrial ecosystem of global warming is 7.79 × 10⁻⁸ species.yr, and on the freshwater ecosystem of global warming, it is 2.13 × 10⁻¹². These values are greater than in the other phases. These findings confirm the work of Smetana et al. on the impact of insect production on ecosystems that insect proteins have the greatest potential to reduce consumers’ carbon footprints. [35]. Concerning biodiversity loss due to ozone formation, in the mealworm production phase, the value is 2.15 × 10⁻⁹ species.yr. Other variables concerning the ecosystem and specifically water consumption and the terrestrial ecotoxicity of water and marine ecotoxicity have low values, highlighting that mealworm production does not decisively affect these categories. Impacts on the ecosystem are linked to the use of brewer’s yeast (63%) and maize grain (20%) (Figure 3). Furthermore, as studies have shown, it is possible to reduce the impact on the ecosystem of insect farming through the use of biological waste [36]. The use of protein can further contribute to the reduction of environmental contamination, as well as increase the profitability of the production system.
3.1.3. Resources
In terms of impact categories, the highest impacts are found in the production phase, including those related to fossil fuel depletion (USD 6.63 per kg of edible protein) and mineral resource scarcity (USD 0.05 per kg of edible protein) (Table 3). Regarding impacts on resources, the heaviest inputs are diesel (68%) and electricity (13%) (Figure 3).
3.2. Sustainability Assessment of Pork Production
The potential environmental impacts associated with pork production are presented in Table 4. The contributions of the two phases of the pork production system, divided into the feeding and fattening process and slaughtering, are shown. As in the case of mealworms, the impact categories with the highest values fall into the categories of human health and resources. The two phases of the system are influenced by different categories.
3.2.1. Human Health
Impacts on human health concern noncarcinogenic toxicity (4.52 × 10⁻⁵ DALYs per 1 kg of edible protein) and carcinogenic toxicity (3.15 × 10⁻⁵ DALYs per 1 kg of edible protein). At the slaughter stage, high impacts are also found in the human health categories and particulate matter production (4.9 × 10⁻⁴ DALYs per 1 kg edible protein), global warming (4.52 × 10⁻⁵ DALYs per 1 kg edible protein) and water consumption (4.5 × 10⁻⁵ DALYs per 1 kg edible protein). In terms of the inputs that most affect the human health macro-category, as shown in Figure 4, piglet (fattening pork) resulted in the highest impacts (71%), followed by electricity (15%) and diesel (7%).
3.2.2. Ecosystems
Concerning ecosystem impacts, the categories with the highest values are global warming terrestrial ecosystem (1.27 × 10⁻⁶ species.yr), terrestrial acidification (1.68 × 10⁻⁷ species.yr), land use (4.63 × 10⁻⁷ species.yr), ozone formation terrestrial ecosystem (4.97 × 10⁻⁸ species.yr), water consumption, and terrestrial ecosystems (7.08 × 10⁻⁸ species.yr). In terms of impact on the ecosystem, slaughtering is particularly impactful in terms of land use (4.39 × 10⁻⁶ species.yr). These results are comparable with other studies carried out on pork production [37,38] in which environmental impacts are particularly related to the production phase. During this phase, the main source of environmental impacts identified was the production of feed, which proved to be more important than energy use on farms. In Figure 4, it can be seen that among the inputs, piglet accounts for 84% of the impacts on the ecosystem, followed by barley (10%).
3.2.3. Resources
In the production phase, the highest value is found in the depletion of fossil resources (USD 47.28 per 1 kg of edible protein), At the slaughter stage, the highest-impact categories concern fossil fuel depletion resources (USD 11.37 per 1 kg edible protein) and mineral resources (USD 0.30 per 1 kg edible protein). Diesel consumption has a strong impact on resources (62%), while electricity affects resources (17%) (Figure 4).
3.3. System Production Comparison
The two production systems, mealworm and pork, were analyzed taking one kg of edible protein as the functional unit. The results of the present analysis demonstrated that the environmental burden of feed ingredients is significant in mealworm farming, similar to findings by Halloran et al. [39] in which broiler and cricket production are compared. An alternative way to reduce the impacts associated with feed production is to look for alternative feed sources using surpluses and waste from crop production, as well as keeping in mind that high protein feeds result in the most efficient conversion ratios. The comparison of these two productions showed that in terms of impact on human health, pork production is higher than mealworm production, with values of 1.38 × 10⁻³ DALYs and 1.22 × 10⁻⁴ DALYs, respectively. Mealworm production is also better in terms of impact on resources. The inputs used in the mealworm industry are such that they have a lower impact on the depletion of mineral and fossil sources; the resource impact values for the two productions are 7.53USD per kg of mealworm protein and 59.04USD per kg of edible pork protein. These data are confirmed in the study by Smetana et al. [40], according to which insects are a sustainable alternative to the growing demand for food protein compared with other meat substitutes. Concerning the impact on the ecosystem of pork production (7.98 × 10⁻⁶ species.yr) compared with mealworm production (1.14 × 10⁻⁶ species.yr), it is approximately seven times greater. The results of the analysis clearly showed that the environmental burden of pork is mainly associated with the agricultural phase where feed is the main input. A graph showing some of the ecosystem impact categories is shown in Figure 5, which demonstrates that the total impacts of pork production and slaughtering are significantly higher than mealworm production in terms of global warming, ozone formation, soil acidification and land use: all exceed 90% of the total impacts caused by the 2 production systems. Particularly important is the use of land for pork, which is a major source of greenhouse gases, which are found to have particularly high values. These data also confirm the previous observations of Oonincx [41], who pointed out that land availability is limited and slowing down the expansion of agricultural land is a key step towards more sustainable agriculture.
In this study, mealworms are a viable protein alternative, requiring only 9% of the amount of land used to produce one kg of pork protein.
4. Conclusions
In the current context of fast growth in food demand, there is a widespread need to evaluate different food production systems in terms of their environmental impacts. Particularly strategic is the comparison between food chains in the case of products and supply chains with a high degree of substitution. Indeed, the work that has been conducted here has shown how the growing global demand for protein can be met through an alternative solution characterized by a high level of environmental sustainability rather than the traditional (in the ICs) animal-based protein, such as protein from mealworms. The production systems examined in our study involved protein production chains from pork and mealworms to identify the less impactful production system for reduced impacts on human health, ecosystem, and resources. The results showed that the value chain for producing a protein from mealworm is less impactful than producing an equal amount of protein from pork. Widespread protein production from mealworms proves sustainable and consistent with biodiversity conservation. Indeed, it has fewer impacts on the ecosystem, in keeping with the need to occupy less land for the production of an equal amount of protein, compared to the process of pork production and slaughter. Pork production and slaughtering result in more impacts on the ecosystem given the amounts of nitrogen produced, the potential for soil acidification, and the impacts on global warming. Protein production from mealworms results in lower use of mineral and fossil resources, which makes the production system scalable in poor realities where protein demand is growing. The study clearly showed that in the face of growing food demand given population growth and industrial development, there is an alternative and sustainable solution for meeting protein demand: the production of mealworms. However, the by-products generated by the two production processes and their respective emissions were not evaluated in the study, so future applications should also take this into account. Other issues are that the literature highlights the need for a multidisciplinary approach to support the widespread application of insects in diets and the lack of a regulatory framework, which should also be analyzed to promote standard setting.
Supplementary Materials
Author Contributions
Conceptualization, G.V. and S.A.P.; Data curation, S.A.P. and M.G.Z.; Formal analysis, L.M. and S.A.P.; Investigation, L.M. and M.G.Z.; Methodology, G.V. and S.A.P.; Software, S.A.P.; Supervision, G.V.; Visualization, G.V.; Writing—original draft, S.A.P., L.M. and M.G.Z.; Writing—review and editing, G.V. All authors have read and agreed to the published version of the manuscript.
Funding
This research received no external funding.
Institutional Review Board Statement
Not applicable.
Informed Consent Statement
Not applicable.
Data Availability Statement
Data can be accessible upon request to corresponding author ([email protected]).
Conflicts of Interest
The authors declare no conflict of interest.
References
- World Health Organization. The State of Food Security and Nutrition in the World 2021: Transforming Food Systems for Food Security, Improved Nutrition and Affordable Healthy Diets for All; Food & Agriculture Org.: Rome, Italy, 2021; Volume 2021. [Google Scholar]
- Bongaarts, J.; FAO; IFAD; UNICEF; WFP; WHO. The State of Food Security and Nutrition in the World 2020: Transforming Food Systems for Affordable Healthy Diets; FAO: Rome, Italy, 2021; 320p. [Google Scholar]
- United Nations. Department of Economic and Social Affairs, Population Division. In World Population Prospects 2019; United Nations Department of Economic and Social Affairs: New York, NY, USA, 2019; Highlights (ST/ESA/SER.A/423). [Google Scholar]
- Toral, P.G.; Hervás, G.; González-Rosales, M.G.; Mendoza, A.G.; Robles-Jiménez, L.E.; Frutos, P. Insects as alternative feed for ruminants: Comparison of protein evaluation methods. J. Anim. Sci. Biotechnol. 2022, 13, 1–8. [Google Scholar] [CrossRef] [PubMed]
- Food and Agriculture Organization of the United Nations. FAOSTAT—Digital Database: Food Security Indicators. 2022. Available online: https://www.fao.org/faostat/en/#data/FS (accessed on 6 June 2022).
- Raheem, D.; Raposo, A.; Oluwole, O.B.; Nieuwland, M.; Saraiva, A.; Carrascosa, C. Entomophagy: Nutritional, ecological, safety and legislation aspects. Food Res. Int. 2019, 126, 108672. [Google Scholar] [CrossRef] [PubMed]
- Environmental Working Group; Hamerschlag, K.; Venkat, K. Meat Eaters Guide: Methodology 2011. Life Cycle Assessment: Methodology and Results. 2011. Available online: http://static.ewg.org/reports/2011/meateaters/pdf/methodology_ewg_meat_eaters_guide_to_health_and_climate_2011.pdf (accessed on 5 June 2022).
- Alexander, P.; Brown, C.; Arneth, A.; Dias, C.; Finnigan, J.; Moran, D.; Rounsevell, M.D.A. Could consumption of insects, cultured meat or imitation meat reduce global agricultural land use? Glob. Food Secur. 2017, 15, 22–32. [Google Scholar] [CrossRef]
- Food and Agriculture Organization of the United Nations. Meat Market Review: Emerging Trends and Outlook; FAO: Rome, Italy, 2021. [Google Scholar]
- Raubenheimer, D.; Rothman, J.M. Nutritional ecology of entomophagy in humans and other primates. Annu. Rev. Entomol. 2013, 58, 141–160. [Google Scholar] [CrossRef] [Green Version]
- Van Huis, A.; Van Itterbeeck, J.; Klunder, H.; Mertens, E.; Halloran, A.; Muir, G.; Vantomme, P. Edible Insects: Future Prospects for Food and Feed Security; Food and agriculture organization of the United Nations: Rome, Italy, 2013; p. 17. [Google Scholar]
- Gao, Y.; Wang, D.; Xu, M.L.; Shi, S.S.; Xiong, J.F. Toxicological characteristics of edible insects in China: A historical review. Food Chem. Toxicol. 2018, 119, 237–251. [Google Scholar] [CrossRef]
- Yi, C.H.; He, Q.J.; Lin, W.; Kuang, R.P. The utilization of insect- resources in Chinese rural area. J. Agric. Sci. 2010, 2, 146–154. [Google Scholar] [CrossRef]
- Statista. Edible Insects—Statistics and Facts. 2019. Available online: https://www.statista.com/topics/4806/edible-insects/ (accessed on 4 June 2022).
- Finke, M.D.; DeFoliart, G.R.; Benevenga, N.J. Use of a four-parameter logistic model to evaluate the quality of the protein from three insect species when fed to rats. J. Nutr. 1989, 119, 864–871. [Google Scholar] [CrossRef] [Green Version]
- Probst, L.; Frideres, L.; Pedersen, B.; Amato, F.; Luxembourg, P. Sustainable Safe, and Nutritious Food: New Nutrient Sources. Bruss. Belg. Eur. Comm. 2015, 53, 1–18. [Google Scholar]
- Nowak, V.; Persijn, D.; Rittenschober, D.; Charrondiere, U.R. Review of food composition data for edible insects. Food Chem. 2016, 193, 39–46. [Google Scholar] [CrossRef]
- Sirimungkararat, S.; Saksirirat, W.; Nopparat, T.; Natongkham, A. Edible products from eri and mulberry silkworms in Thailand. For. Insects Food Hum. Bite Back 2010, 189, 189–200. [Google Scholar]
- Lange, K.W.; Nakamura, Y. Edible insects as a source of food bioactives and their potential health effects. J. Food Bioact. 2021, 14, 4–9. [Google Scholar] [CrossRef]
- Rumpold, B.A.; Schlüter, O.K. Potential and challenges of insects as an innovative source for food and feed production. Innov. Food Sci. Emerg. Technol. 2013, 17, 1–11. [Google Scholar] [CrossRef]
- Kim, T.K.; Yong, H.I.; Kim, Y.B.; Kim, H.W.; Choi, Y.S. Edible insects as a protein source: A review of public perception, processing technology, and research trends. Food Sci. Anim. Resour. 2019, 39, 521–540. [Google Scholar] [CrossRef] [PubMed] [Green Version]
- FAOSTAT Several Statistics. Available online: https://www.fao.org/faostat/en/#data/FS (accessed on 7 July 2022).
- International Organization For Standardization 14040. Environmental Management: Life Cycle Assessment; Principles and Framework; ISO: Geneva, Switzerland, 2006. [Google Scholar]
- International Organization For Standardization 14044. Environmental Management—Life Cycle Assessment—Requirements and Guidelines; ISO: Geneva, Switzerland, 2006. [Google Scholar]
- Dreyer, M.; Hörtenhuber, S.; Zollitsch, W.; Jäger, H.; Schaden, L.M.; Gronauer, A.; Kral, I. Environmental life cycle assessment of yellow mealworm (Tenebrio molitor) production for human consumption in Austria—A comparison of mealworm and broiler as protein source. Int. J. Life Cycle Assess. 2021, 26, 2232–2247. [Google Scholar] [CrossRef]
- Pazmiño, M.L.; Ramirez, A.D. Life cycle assessment as a methodological framework for the evaluation of the environmental sustainability of pig and pork production in Ecuador. Sustainability 2021, 13, 11693. [Google Scholar] [CrossRef]
- Reckmann, K.; Traulsen, I.; Krieter, J. Life Cycle Assessment of pork production: A data inventory for the case of Germany. Livest. Sci. 2013, 157, 586–596. [Google Scholar] [CrossRef]
- Miglietta, P.P.; de Leo, F.; Ruberti, M.; Massari, S. Mealworms for food: A water footprint perspective. Water 2015, 7, 6190–6203. [Google Scholar] [CrossRef]
- Barker, D.; Fitzpatrick, M.P.; Dierenfeld, E.S. Nutrient composition of selected whole invertebrates. Zoo Biol. 1998, 17, 123–134. [Google Scholar] [CrossRef]
- Flachowsky, G.; Meyer, U.; Südekum, K.H. Land use for edible protein of animal origin—A review. Animals 2017, 7, 25. [Google Scholar] [CrossRef]
- Dreier, C. Untersuchung zu den Schlachtschweinetransporten aus dem Raum Norddeutschland in den Jahren 2005 bis 2011; Institute of Animal Breeding and Husbandry, Chritian-Albrechts University Kiel: Kiel, Germany, 2012. [Google Scholar]
- Cortesi, A.; Pénicaud, C.; Saint-Eve, A.; Soler, L.G.; Souchon, I. Life cycle inventory and assessment data for quantifying the environmental impacts of a wide range of food products belonging to the same food category: A case study of 80 pizzas representatives of the French retail market. Data Brief 2022, 41, 107950. [Google Scholar] [CrossRef]
- Dalgaard, T.; Halberg, N.; Porter, J.R. A model for fossil energy use in Danish agriculture used to compare organic and conventional farming. Agric. Ecosyst. Environ. 2001, 87, 51–65. [Google Scholar] [CrossRef] [Green Version]
- Vinci, G.; Rapa, M. Hydroponic cultivation: Life cycle assessment of substrate choice. Br. Food J. 2019, 121, 1801–1812. [Google Scholar] [CrossRef]
- Smetana, S.; Spykman, R.; Heinz, V. Environmental aspects of insect mass production. J. Insects Food Feed. 2021, 7, 533–571. [Google Scholar] [CrossRef]
- Offenberg, J. Oecophylla smaragdina food conversion efficiency:prospects for ant farming. J. Appl. Entomol. 2011, 135, 575–581. [Google Scholar] [CrossRef]
- Winkler, T.; Schopf, K.; Aschemann, R.; Winiwarter, W. From farm to fork–A life cycle assessment of fresh Austrian pork. J. Clean. Prod. 2016, 116, 80–89. [Google Scholar] [CrossRef] [Green Version]
- González-García, S.; Belo, S.; Dias, A.C.; Rodrigues, J.V.; da Costa, R.R.; Ferreira, A.; de Andrade, L.P.; Arroja, L. Life cycle assessment of pigmeat production: Portuguese case study and proposal of improvement options. J. Clean. Prod. 2015, 100, 126–139. [Google Scholar] [CrossRef]
- Smetana, S.; Mathys, A.; Knoch, A.; Heinz, V. Meat alternatives: Life cycle assessment of most known meat substitutes. Int. J. Life Cycle Assess. 2015, 20, 1254–1267. [Google Scholar] [CrossRef]
- Halloran, A.; Hanboonsong, Y.; Roos, N.; Bruun, S. Life cycle assessment of cricket farming in north-eastern Thailand. J. Clean. Prod. 2017, 156, 83–94. [Google Scholar] [CrossRef]
- Oonincx, D.G.A.B.; De Boer, I.J.M. Environmental Impact of the Production of Mealworms as a Protein Source for Humans - A Life Cycle Assessment. PLoS ONE 2012, 7, e51145. [Google Scholar] [CrossRef] [Green Version]
Figure 1.
The system boundaries for mealworm production.
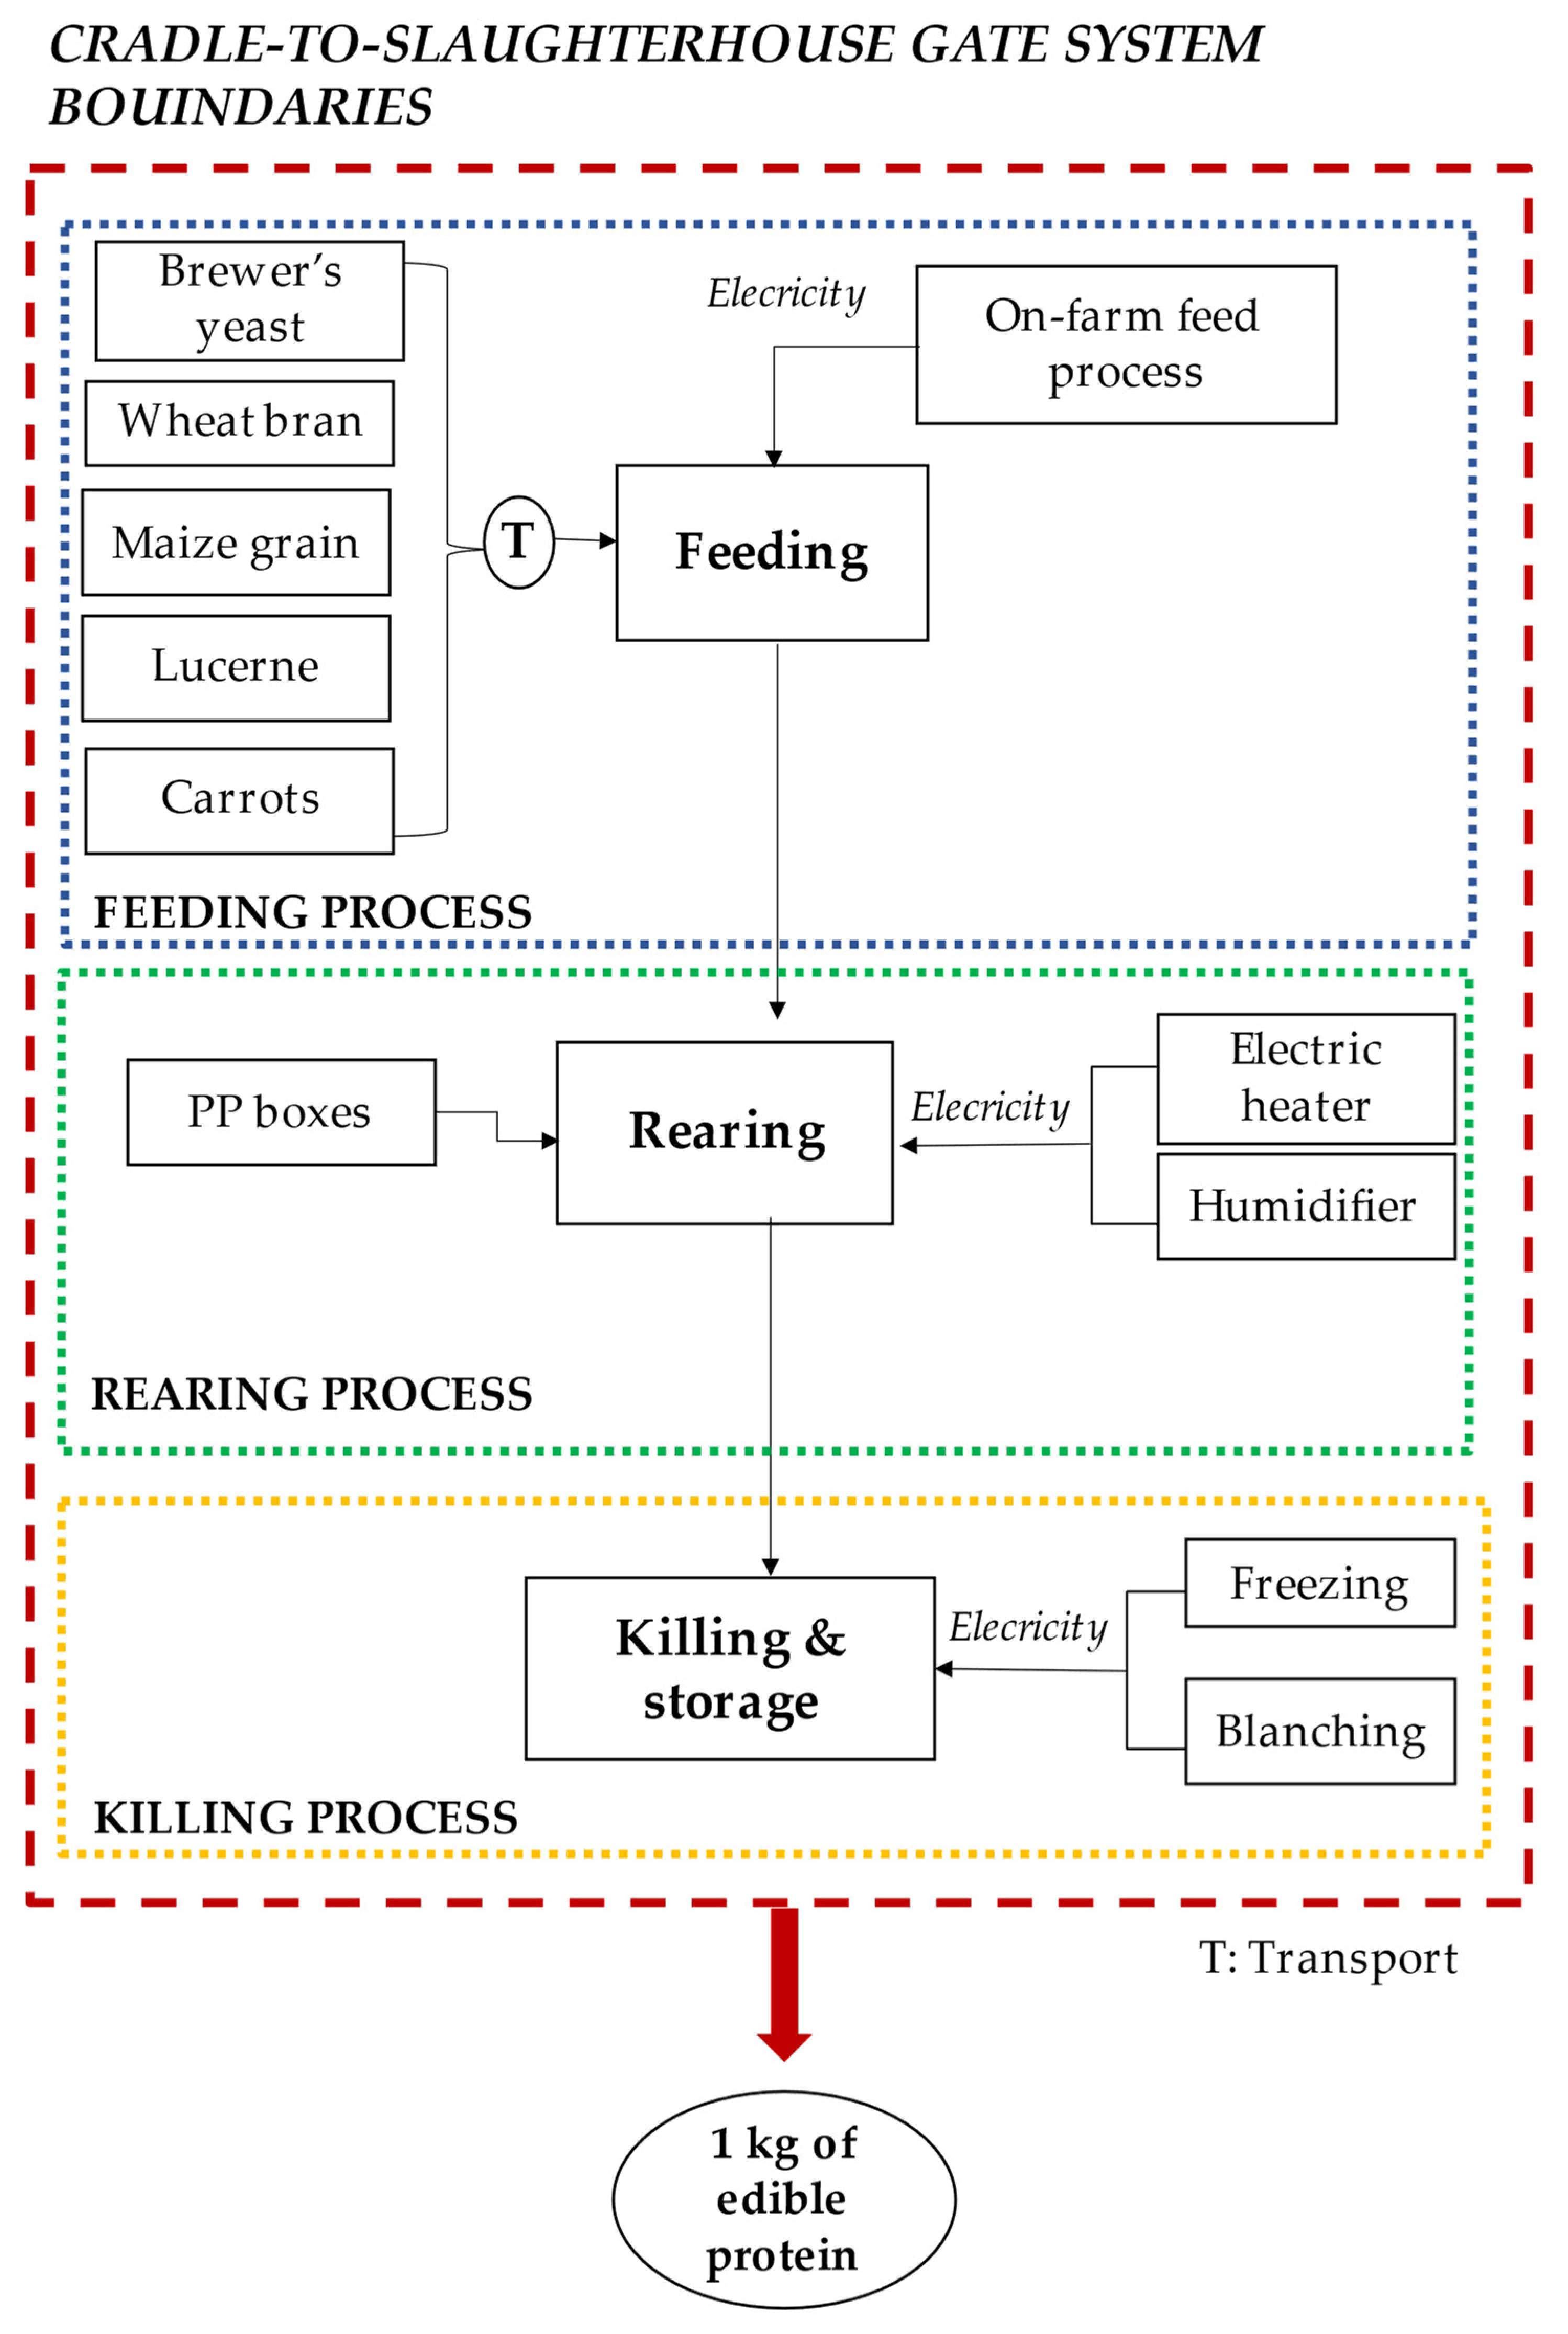
Figure 2.
The system boundaries for pork meat production.

Figure 3.
Characterized results for mealworm production divided into the three macro-categories.
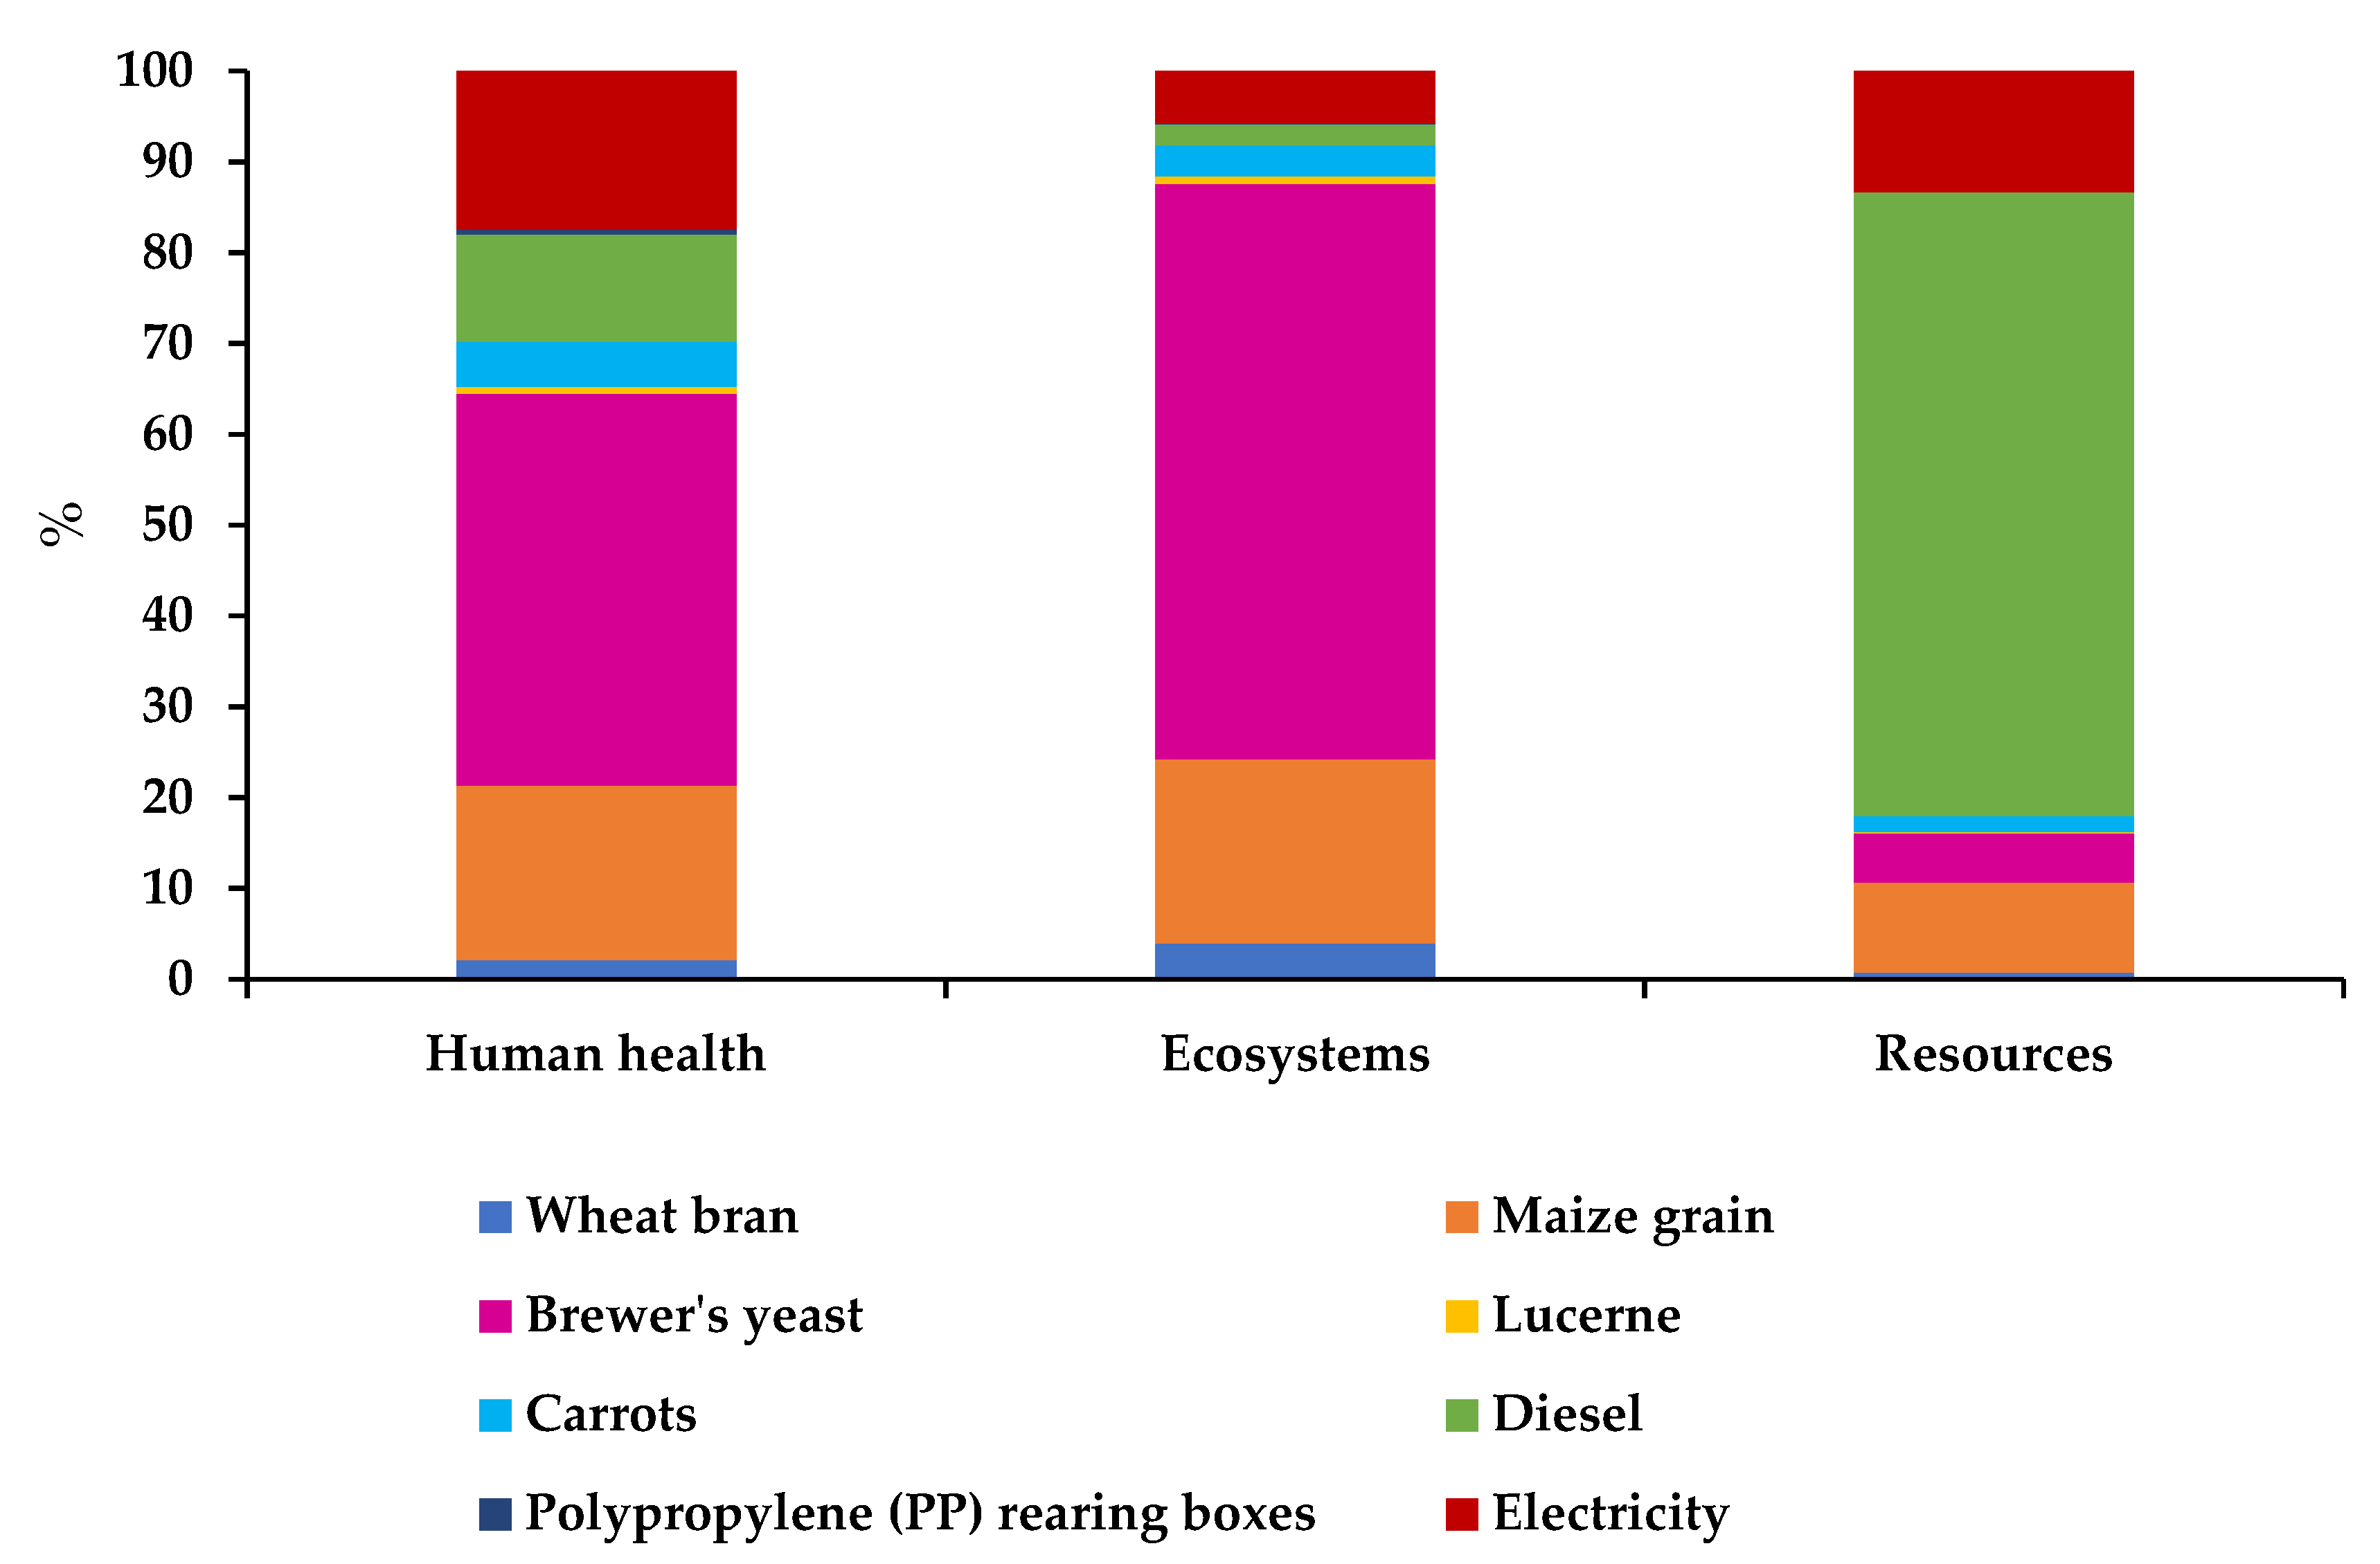
Figure 4.
Characterized results for pork production considering the three macro-categories.

Figure 5.
Main impact categories for the ecosystem: comparison within the two production systems.


Table 1.
Inputs per kg of mealworm protein (FU).
| Input | Unit | Quantity | Data Sources | |
|---|---|---|---|---|
| Feeding | Wheat bran | Kg | 18.43 | Data from [25] |
| Maize grain | Kg | 14.33 | ||
| Brewer’s yeast | Kg | 2.63 | ||
| Lucerne | Kg | 2.11 | ||
| Carrots | Kg | 20.28 | ||
| Diesel | Kg | 9.91 | ||
| On-farm feed processing | MJ | 0.32 | ||
| Rearing | Land for rearing facilities | m2 | 0.15 | |
| Polypropylene (PP) rearing boxes | Kg | 0.23 | ||
| Electric heater | MJ | 75.67 | ||
| Humidifier | MJ | 0.67 | ||
| Killing and storage | Freezing | MJ | 1.60 | |
| Blanching | MJ | 12.03 | ||
| Output | Unit | Quantity | ||
| Killed and stored mealworms | Kg | 7.30 | ||
Table 2.
Inputs per kg of edible pork protein (FU).
| Input | Unit | Quantity | Data Sources | |
|---|---|---|---|---|
| Feeding and Fattening | Barley | Kg | 4.86 | Own calculations based on [27] |
| Wheat | Kg | 12.04 | ||
| Rye | Kg | 1.78 | ||
| Soybean | Kg | 2.1 | ||
| Maize | Kg | 7.16 | [26] | |
| Farm traction for fertilizer (diesel) | Kg | 70.27 | [33] | |
| Water (tap) | L | 3900 | Own calculations based on [27] | |
| Land use for rearing facilities | m2 | 5.73 | ||
| Electricity | kWh−1 | 247.8 | ||
| Slaughtering | Piglet (One fattening pig) | Kg | 120 | |
| Electricity for machinery | kWh−1 | 2.47 | ||
| Diesel | Kg | 0.8 | ||
| Water (tap) | L | 36 | ||
| Output | Unit | Quantity | ||
| Slaughtered and preserved pork | Kg | 11.05 | ||
Table 3.
LCIA for mealworm production.
| Impact Category | Unit | Feeding | Rearing | Killing and Storage |
|---|---|---|---|---|
| HUMAN HEALTH | ||||
| Global warming | DALYs | 2.58 × 10⁻⁵ | 9.11 × 10⁻⁶ | 1.51 × 10⁻⁶ |
| Human carcinogenic toxicity | DALYs | 1.89 × 10⁻⁶ | 1.52 × 10⁻⁶ | 2.71 × 10⁻⁷ |
| Human non-carcinogenic toxicity | DALYs | 6.98 × 10⁻⁶ | 1.62 × 10⁻⁶ | 2.90 × 10⁻⁷ |
| Stratospheric ozone depletion | DALYs | 1.45 × 10⁻⁷ | 3.72 × 10⁻⁹ | 6.64 × 10⁻¹⁰ |
| Ionizing radiation | DALYs | 3.44 × 10⁻⁸ | 8.48 × 10⁻⁹ | 1.51 × 10⁻⁹ |
| Ozone formation | DALYs | 6.05 × 10⁻⁸ | 1.50 × 10⁻⁸ | 2.67 × 10⁻⁹ |
| Water consumption | DALYs | 3.12 × 10⁻⁵ | 3.24 × 10⁻⁷ | 5.78 × 10⁻⁸ |
| Fine particulate matter formation | DALYs | 3.73 × 10⁻⁵ | 6.18 × 10⁻⁶ | 1.10 × 10⁻⁶ |
| ECOSYSTEMS | ||||
| Global warming. Terrestrial ecosystems | species.yr | 7.79 × 10⁻⁸ | 2.75 × 10⁻⁸ | 4.56 × 10⁻⁹ |
| Global warming. Freshwater ecosystems | species.yr | 2.13 × 10⁻¹² | 7.51 × 10⁻¹³ | 1.25 × 10⁻¹³ |
| Ozone formation. Terrestrial ecosystems | species.yr | 2.15 × 10⁻⁹ | 8.81 × 10⁻⁹ | 3.85 × 10⁻¹⁰ |
| Terrestrial acidification | species.yr | 6.06 × 10⁻⁹ | 6.72 × 10⁻⁸ | 1.08 × 10⁻⁹ |
| Freshwater eutrophication | species.yr | 1.16 × 10⁻⁸ | 1.81 × 10⁻⁹ | 3.23 × 10⁻¹⁰ |
| Marine eutrophication | species.yr | 1.02 × 10⁻¹⁰ | 4.32 × 10⁻¹³ | 7.71 × 10⁻¹⁴ |
| Terrestrial ecotoxicity | species.yr | 5.57 × 10⁻¹⁰ | 1.25 × 10⁻¹⁰ | 2.24 × 10⁻¹¹ |
| Freshwater ecotoxicity | species.yr | 1.38 × 10⁻⁹ | 5.56 × 10⁻¹⁰ | 9.93 × 10⁻¹¹ |
| Marine ecotoxicity | species.yr | 1.06 × 10⁻¹⁰ | 1.05 × 10⁻¹⁰ | 1.87 × 10⁻¹¹ |
| Water consumption. Terrestrial ecosystem | species.yr | 5.16 × 10⁻⁷ | 1.22 × 10⁻⁹ | 2.18 × 10⁻¹⁰ |
| Water consumption. Aquatic ecosystems | species.yr | 3.86 × 10⁻¹¹ | 7.37 × 10⁻¹⁴ | 1.32 × 10⁻¹⁴ |
| Land use | species.yr | 4.02×10⁻⁷ | 1.80 × 10⁻⁸ | 3.21 × 10⁻⁹ |
| RESOURCES | ||||
| Mineral resource scarcity | USD2013 | 5.62 × 10⁻² | 3.95 × 10⁻³ | 7.06 × 10⁻⁴ |
| Fossil resource scarcity | USD2013 | 6.63 | 8.49 × 10⁻¹ | 1.52 × 10⁻¹ |
Table 4.
LCIA for pork production.
| Impact Category | Unit | Feeding and Fattening | Slaughter Process |
|---|---|---|---|
| HUMAN HEALTH | |||
| Global warming | DALYs | 1.41 × 10⁻⁴ | 4.23 × 10⁻⁴ |
| Stratospheric ozone depletion | DALYs | 1.75 × 10⁻⁷ | 1.23 × 10⁻⁶ |
| Ionizing radiation | DALYs | 1.25 × 10⁻⁷ | 1.12 × 10⁻⁷ |
| Ozone formation | DALYs | 3.39 × 10⁻⁷ | 4.95 × 10⁻⁷ |
| Fine particulate matter formation | DALYs | 1.53 × 10⁻⁴ | 4.90 × 10⁻⁴ |
| Human carcinogenic toxicity | DALYs | 3.14 × 10⁻⁵ | 1.48 × 10⁻⁵ |
| Human non-carcinogenic toxicity | DALYs | 4.51 × 10⁻⁵ | 2.72 × 10⁻⁵ |
| Water consumption | DALYs | 1.31 × 10⁻⁵ | 4.17 × 10⁻⁵ |
| ECOSYSTEM | |||
| Global warming. Terrestrial ecosystems | species.yr | 1.27 × 10⁻⁶ | 4.27 × 10⁻⁷ |
| Global warming. Freshwater ecosystems | species.yr | 3.48 × 10⁻¹¹ | 1.16 × 10⁻¹¹ |
| Ozone formation. Terrestrial ecosystems | species.yr | 4.97 × 10⁻⁸ | 7.37 × 10⁻⁸ |
| Terrestrial acidification | species.yr | 1.68 × 10⁻⁷ | 8.41 × 10⁻⁷ |
| Freshwater eutrophication | species.yr | 2.78 × 10⁻⁸ | 4.60 × 10⁻⁸ |
| Marine eutrophication | species.yr | 1.01 × 10⁻¹⁰ | 9.07 × 10⁻¹⁰ |
| Terrestrial ecotoxicity | species.yr | 3.01 × 10⁻⁹ | 6.42 × 10⁻⁹ |
| Freshwater ecotoxicity | species.yr | 7.41 × 10⁻⁹ | 5.80 × 10⁻⁹ |
| Marine ecotoxicity | species.yr | 1.34 × 10⁻⁹ | 6.35 × 10⁻¹⁰ |
| Land use | species.yr | 4.63 × 10⁻⁷ | 4.39 × 10⁻⁶ |
| Water consumption. Terrestrial ecosystem | species.yr | 7.08 × 10⁻⁸ | 1.11 × 10⁻⁷ |
| Water consumption. Aquatic ecosystems | species.yr | 5.25 × 10⁻¹² | 2.33 × 10⁻¹¹ |
| RESOURCES | |||
| Mineral resource scarcity | USD2013 | 9.91 × 10⁻² | 3.01 × 10⁻¹ |
| Fossil resource scarcity | USD2013 | 47.27 | 11.36 |
Publisher’s Note: MDPI stays neutral with regard to jurisdictional claims in published maps and institutional affiliations. |
© 2022 by the authors. Licensee MDPI, Basel, Switzerland. This article is an open access article distributed under the terms and conditions of the Creative Commons Attribution (CC BY) license (https://creativecommons.org/licenses/by/4.0/).
Share and Cite
MDPI and ACS Style
Vinci, G.; Prencipe, S.A.; Masiello, L.; Zaki, M.G. The Application of Life Cycle Assessment to Evaluate the Environmental Impacts of Edible Insects as a Protein Source. Earth 2022, 3, 925-938. https://doi.org/10.3390/earth3030054
AMA Style
Vinci G, Prencipe SA, Masiello L, Zaki MG. The Application of Life Cycle Assessment to Evaluate the Environmental Impacts of Edible Insects as a Protein Source. Earth. 2022; 3(3):925-938. https://doi.org/10.3390/earth3030054
Chicago/Turabian StyleVinci, Giuliana, Sabrina Antonia Prencipe, Luca Masiello, and Mary Giò Zaki. 2022. "The Application of Life Cycle Assessment to Evaluate the Environmental Impacts of Edible Insects as a Protein Source" Earth 3, no. 3: 925-938. https://doi.org/10.3390/earth3030054