Abstract
Globally, urbanisation has been the most significant factor causing land use and land cover changes due to accelerated population growth and limited governmental regulation. Urban communities worldwide, particularly in Iraq, are on the frontline for dealing with threats associated with environmental degradation, climate change and social inequality. However, with respect to the effects of urbanization, most previous studies have overlooked ecological problems, and have disregarded strategic environmental assessment, which is an effective tool for ensuring sustainable development. This study aims to provide a comprehensive vulnerability assessment model for urban areas experiencing environmental degradation, rapid urbanisation and high population growth, to help formulate policies for urban communities and to support sustainable livelihoods in Iraq and other developing countries. The proposed model was developed by integrating three functions of fuzzy logic: the fuzzy analytic hierarchy process, fuzzy linear membership and fuzzy overlay gamma. Application of the model showed that 11 neighbourhoods in the study area, and more than 175,000 individuals, or 25% of the total population, were located in very high vulnerability regions. The proposed model offers a decision support system for allocating required financial resources and efficiently implementing mitigation processes for the most vulnerable urban areas.
1. Introduction
Globally, rapid urbanisation to meet the needs of uncontrolled population growth has led to several challenges, such as pollution, congested traffic, poor sustainability and negative impacts on the natural environment [1,2]. Cities have expanded at the expense of green areas, leading to environmental degradation [3,4]. Rapid expansion has resulted in the proliferation of many human activities that are difficult to manage; consequently, significant impacts on ecology and public health are likely to arise [5,6]. In the context of uncontrolled urban sprawl, a lack of financial resources and expertise, coupled with spatial marginalisation, has exposed entire urban areas to degradation risks [7]. Communities in vulnerable areas face significant challenges, such as access to suitable public buildings, and the availability of electricity, transportation, government education, healthcare and water supply [8]. To respond to these challenges, current techniques need to be enhanced to cope with the complex changes occurring to the urban environment [9,10].
Locally, given that Iraq is facing the consequences of long wars (1980 to 2003), military action has strongly affected land use and land cover changes. The wars experienced have contributed to environmental degradation, including through the transformation of rivers, scorched earth exercises, the annihilation of animals and plants, oil spills, burning of petroleum wells and the use of chemical and biological weapons [11,12]. Moreover, non-traditional weapons used in Gulf Wars I and II have exposed Iraq’s environment to the harmful effects of the use of radioactive weapons [13]. Although a high level of environmental degradation and significant changes in Iraq’s environment have occurred, suitable measures to protect the environment are still lacking [14]. Urban communities have been on the frontline in dealing with the challenges of ecological degradation, urbanisation and the occurrence of different pandemics [15,16].
The sustainable development goals (SDGs) are goals for achieving long-term sustainability on Earth. With respect to these, in the short term, improvement in techniques that can provide sustainable solutions for urban areas that are high vulnerable should be a primary objective [17]. Mitigation and enhancement processes in urban areas must integrate approaches that match the SDGs and be applied to the most vulnerable areas as a priority [18,19,20]. Vulnerable areas should be prioritized when launching urban interventions, whilst urban sprawl should be simultaneously monitored and controlled [21]. There are a number of different approaches to the design of indicators that can comprehensively define, evaluate and address vulnerability, by integrating traditional data sources with modern Earth observation data [22,23,24,25]. Some researchers have proposed deprivation indices to measure deprivation in urban areas, such as the English indices of deprivation (IoD 2019) [26]. Others, such as Lynch and Mosbah (2017), have developed local indices to comprehensively measure sustainability [27]. Studies that have applied vulnerability theory to identify vulnerable urban areas have tended to be more comprehensive because they have sought to include a wide range of factors that can affect urban environments.
Vulnerability theory has been applied by many researchers in the urban planning field. Hazell (2020) proposed ten criteria, divided into three major categories, namely, topographic, demographic and land cover attributes, to identify potentially vulnerable populations and to characterise desirable urban environment quality [28]. Ge et al. (2019) presented sixteen primary indicators for assessing social vulnerability, divided into four major categories: health inequality, cultural inequality, economic inequality and social inequality [29]. Ruá et al. (2021) defined four major domains, including the urban domain (UD), building domain (BD), sociodemographic domain (SD) and the socioeconomic domain (SE), to evaluate vulnerable urban areas [30]. Similarly, Gerundo, Marra and de Salvatore (2020) utilized three dimensions (i.e., social domain, UD and BD) to construct a composite vulnerability index for describing vulnerable urban areas [7]. In another study, conducted by Gerundo et al. (2020), the authors proposed a set of mitigation indicators for three major dimensions, the social domain, BD and UD, as useful tools for assessing vulnerability [31]. However, most models used in this context overlook ecological problems that are associated with urbanisation and disregard strategic environmental assessment (SEA), which is an effective technique for assessing environmental damage due to human activity to ensure that urban development is sustainable [32,33,34]. Therefore, the current study seeks to bridge this gap by presenting a comprehensive vulnerability assessment technique that can effectively define vulnerable urban areas and monitor urban sprawl. The approach is relevant to the environmental impact assessment of polluting activities in urban areas as a significant part of a total vulnerability evaluation.
Many techniques are available for evaluating vulnerability in urban areas, including multi-criteria decision analysis (MCDA) for assessing multiple factors that contribute to the complexity of the urban fabric [35,36]. The integration of MCDA into a geographic information system (GIS) is commonly used to resolve various complicated spatial problems. Furthermore, available remote-sensing (RS) datasets and expert opinion make such integration more efficient for supporting the decision-making process [37,38]. The approach enables the combining of data derived from different geographical factors into a single measurement index [39], to assess the reality of the situation and identify implications for ecological sustainability [19,35,40]. Although more than 15 different MCDA methods are currently available, the most notable is the analytic hierarchy process (AHP) [41,42]. However, AHP applies crisp values, and its results are accompanied by uncertainty; thus, fuzzy AHP (FAHP) has emerged as an upgraded version of AHP that reflects human reasoning processes [43]. Indicators with multiple levels and weighted importance that result from FAHP can be compared to support decision-makers in defining optimal alternatives and indicators [2]. Whilst the AHP technique provides satisfactory results, FAHP deals with uncertainty values that are associated with vulnerability indicators [44].
Fuzzy logic (FL) is the most effective application of spatial analysis in the urban planning field which has been extensively improved as a significant function of GIS [45,46]. It can evaluate the different degrees of membership for complex topics associated with uncertainty, such as vulnerability indicators [7]. FL includes several types of functions. Fuzzy linear membership (FLM) is one of these functions; it can be operated with MCDA to standardise criteria to make wise decisions and convert various parameters into fuzzy values between 0 and 1 [47,48]. The fuzzy overlay (FO) function is applied when analysing the effects of various factors related to many sets in the multi-criteria overlay technique. The FO function analyses the relationships between the sub-criteria of multiple major criterion sets [49]. Furthermore, some significant functions are involved in FO that allow combining fuzzy membership values for diverse variables by performing a cell-by-cell overlay process [50,51]. FO gamma (FOG) is the most significant function that results from multiplying a fuzzy product value by a fuzzy sum value. Both values are raised to the power of gamma. FOG makes an adjustment between the increasing fuzzy sum value and the diminishing effect of the fuzzy product value [52,53].
The current study presents a new approach for the comprehensive vulnerability assessment of urban areas. The proposed approach takes advantage of effective fuzzy logic functions to overcome uncertainty in the classification and combination of vulnerability indicators, which represents a significant strategy for making sensitive decisions associated with human life. It was used to integrate (FAHP), (FLM) and (FOG) to derive a comprehensive vulnerability indicator for Nasiriyah City in Iraq. The comprehensive vulnerability indicator is an algebraic product of environmental vulnerability with urban vulnerability, building vulnerability and social vulnerability, produced in accordance with vulnerability theory to define vulnerable urban areas. The new approach enables building of a robust database and provision of relevant guidance for comprehensive vulnerability assessment, serving as an improved decision support system for determining priority intervention sites within complicated urban areas. In addition, the system enables optimisation of public spending for mitigating vulnerability given that local authorities responsible for city services frequently have insufficient financial resources. This approach can be applied to enhance policies formulated for urban communities and help build sustainable livelihoods in all regions of Iraq and other developing countries.
2. Vulnerability Indicators
Vulnerability emerges from environmental, physical, economic, and social problems in urban areas. This term is used to describe a reduced capacity to adapt to, resist and recuperate from risks [54,55]. Thus, urban vulnerability can be described as a situation that arises from the combination of multiple disadvantageous factors leading to challenging circumstances that it is difficult for an urban community to overcome [56,57]. The recognition and measurement of these factors is essential before implementing plans to mitigate vulnerability. The most suitable measurement approach is based on vulnerability theory; it combines different vulnerability indicators, such as social, urban, building and environmental indices, into a single indicator to represent the situation to support mitigation planning. This method enables diagnosis of urban problems and identification of solutions without requiring substantial data collection [58].
Collecting data associated with many indicators is extremely difficult; hence, the vulnerability assessment process can be accomplished by focusing on different indicators dependent on local conditions or data availability [59]. A comprehensive vulnerability assessment based on vulnerability theory was performed for the study area (Nasiriyah City, Iraq) to define vulnerable urban areas by measuring multiple criteria that are pertinent to urban communities. A total of twelve sub-criteria were selected based on literature review, local urban and environmental indicators and data availability. The Delphi technique was applied to confirm the suitability of criteria for the vulnerability indicators. The sub-criteria were categorised into four major domains: environment, urban, building and social.
2.1. Environment Domain
Environmental vulnerability indicators estimate the capability of urban communities to recover from possible risks of pollution arising from several pollution sources; this capability depends primarily on the healthiness, integrity and organisational level of a community [60]. Pollution sources can be classified into two major groups: point and non-point sources of pollution. The locations of point sources of pollution, such as industrial activities, can be determined. However, point-source pollution in Iraqi cities mostly originates from distributed pollution sites, such as oil industry operations, power stations, landfill sites, brick factories and wastewater treatment plants (WWTPs). The oil industry sector is a key environmental pollution source in Iraq; it releases polluting gases that affect residential neighbourhoods close to or in buffer zones [61]. WWTPs can be hotspots for the spread of antibiotic-resistant pathogens with significant effects on water ecosystems. In addition, weapon storage sites in which depleted uranium was used during the wars have continued to be tremendously harmful to public health and to Iraq’s environment since the conflict period. By contrast, non-point sources of pollution are more difficult to determine and require more effort to control. Many sites release polluting materials simultaneously [62].
The current study applied local environmental standards (specifically, number 3-2011) that have been adopted by the Iraqi Ministry of Environment. These standards determine buffer zones with different radii based on the degree of pollution. Residential neighbourhoods located inside buffer zones are considered as urban areas exposed to pollution risks. The local environmental standards classify point-source pollution into three categories, as described below.
2.1.1. Class A: High-Polluting Projects
This category includes many polluting projects, such as oil refineries, iron industries, WWTPs, brick factories, thermal power plants and landfill sites. Table 1 lists some types of high-polluting projects with their respective buffer zones based on the classification of local environmental indicators in Iraq.

Table 1.
Samples of high-polluting projects (Class A).
2.1.2. Class B: Moderately Polluting Projects
This class involves polluting projects that affect the environment less than Class A projects, such as the poultry industry, plastic manufacturers, gas turbine power plants, concrete manufacturers, flour mills and date canning factories. Table 2 lists several types of moderately polluting projects with their respective buffer zone radii based on Iraqi environment indicators.

Table 2.
Examples of moderately polluting projects (Class B) according to Iraqi environment standards.
2.1.3. Class C: Low-Polluting Projects
This class includes polluting projects that affect the environment less than Class B projects, such as wastewater pumping stations, oil stores and industrial complexes. Table 3 presents some types of low-polluting projects and their respective buffer zones based on Iraqi environmental indicators.

Table 3.
Examples of low-polluting projects (Class C) according to Iraqi environment standards.
2.1.4. Effects of Weapons and War
A number of major international reports have confirmed that unconventional weapons used during the Gulf wars (1991–2003) were among the primary reasons for an increase in cancerous diseases in Iraq [62,63]. Large amounts of depleted uranium (DU) were fired during the Iraq wars [64]. DU has increased environmental pollution dangerously due to effects that appeared after the wars [65,66]. About 300 tons of DU were fired in the first Gulf war and about 1700 tons were fired during the 2003 war [67]. Reports have confirmed that radioactive materials (DU) that were routinely stored in military bases located close to Nasiriyah City, i.e., the study area, have leaked into the environment [68]. The most dangerous site (the Khamisiyah site) in which chemical weapons and DU were stored is located 17 km from the border of the study area [69,70]. Radioactive emissions have permeated into the surroundings, and, as a result, people have been exposed to their dangerous effects [13]. In the current study, the effect of weapon use was defined as a polluting factor within the environmental domain. Thus, an evaluation of the effects of weapons on the environment in the study area was performed according to Iraqi environment standards, which contributed to determining the buffer zone for dangerous landfills, detailed in Table 1.
2.2. Building Domain
Statistical analysis conducted using quantitative and qualitative indices has shown that the vulnerability of an urban environment is primarily linked to financial resources, authority policies and city size [71]. As urbanisation continues to accelerate due to rapid population growth in Iraq, the problems arising in urban communities are becoming more complex. City authorities do not have sufficient financial and technical capabilities to provide all city neighbourhoods with basic infrastructure, such as paved streets and sewage networks. The Nasiriyah City administration is unable to control the rapid sprawl, and informal settlements involving illegal construction have continuously increased to accommodate the accelerating population growth. The informal settlements are a source of environmental pollution and a reason for the increasing number of vulnerable urban areas in Iraq. The most dangerous consequence of informal construction is the lack of proper services, such as construction of unpaved roads, which are considered a significant source of dust pollution, and the lack of public sewer and solid waste treatment systems [72]. Urban areas can be defined as vulnerable areas based on construction characteristics, particularly the infrastructure, shape and density of a settlement and its location [23]. Two sub-criteria were adopted in the current study to define vulnerable neighbourhoods within the building domain: (1) the ratio of informal settlements, and (2) the lack of infrastructure at the neighbourhood scale.
2.3. Urban Domain
The most important impact factors in urban planning are urban density, population density and green public spaces, which are directly or indirectly related to vulnerability indicators. The well-being of urban communities is central to consideration of how the urban landscape, building density and open spaces can be utilized to address urban sprawl [73]. The integration of population and dwelling density maps enables the identification of neighbourhoods with high population density and low basic services in which mitigation interventions are urgently required [10]. In the current study, vulnerability indicators, including population density, dwelling density and green area, were classified under the urban domain to define vulnerable urban areas.
2.4. Social Domain
A body of previous research has defined social vulnerability as the vulnerability of people or neighbourhoods. Social vulnerability, as a concept, has been used to characterise the capacity to control hazards and their consequences for urban communities, social groups and families [60]. Social vulnerability assessment has focused on understanding the factors associated with social inequality that increase vulnerability at family and community scales [74]. The provision of health care and educational services and the availability of job opportunities are significant social indicators that can indicate the social vulnerability of urban communities [9,75,76]. Therefore, data for three criteria, namely, health care services, education services and unemployment ratio, were collected in the current study to define social vulnerability indicators consistent with the local urban planning indicators of Iraq (Table 4).

Table 4.
Iraqi urban planning standards that refer to access distance to health care centres and schools, along with the size of social services required based on the number of people.
3. Method
3.1. Study Area
Nasiriyah City was selected as the study area for this research. It represents Iraqi cities because Iraq’s urban characteristics are quite similar across the whole area. Nasiriyah City is located along the banks of the Euphrates River, between latitudes 31°90′00″ N and 30°50′00″ N, and between longitudes 46°00′00″ E and 46°20′00″ E, as shown in Figure 1. The average elevation is about 4 m above mean sea level, and its area is more than 46,000 hectares. The total population of over 700,000 people (based on the 2021 local census) currently occupy 92 neighbourhoods. The study area covered the Ur archaeological site (4000 BCE), as shown in Figure 1. Nasiriyah City is the capital of Dhi Qar Province. The city has suffered from the severe effects of wars. The most dangerous site, i.e., the Khamisiyah site, where chemical weapons and depleted uranium (DU) were used, is located about 17 km from its borders. Figure 2 shows the location of this site [69,70]. This dangerous site has become closer to the city settlements due to rapid urban sprawl, high population growth, migration towards the city and poor urban planning, resulting in the establishment of large informal settlements in the study area.
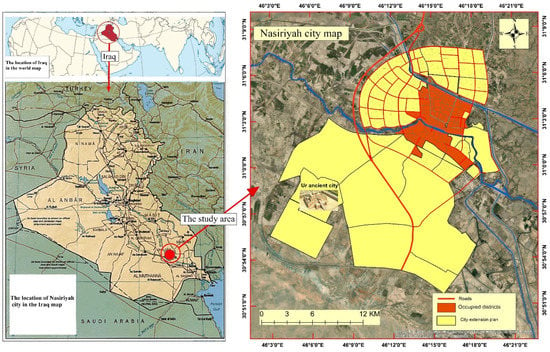
Figure 1.
Location of Nasiriyah City. Upper left: location of Iraq on the world map. Bottom left: location of Nasiriyah City on the Iraq map. Right: map of Nasiriyah City showing the location of the ancient city of Ur (4000 BC). The brown area comprises 92 occupied neighbourhoods.
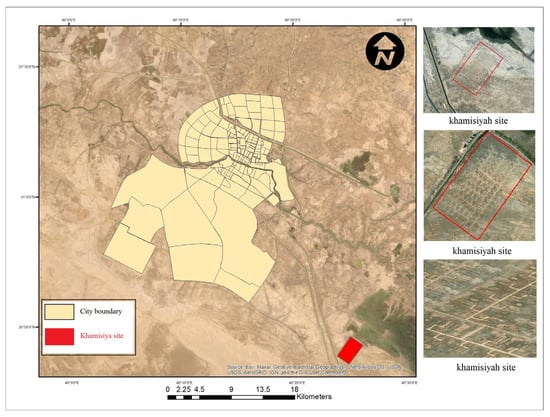
Figure 2.
Khamisiyah site and boundary of Nasiriyah City. The three pictures on the right show a close-up view of the Khamisiyah site.
3.2. Data Collection
In this study, 12 dataset layers were collected to identify the vulnerable urban areas in Nasiriyah City. These layers were as follows: high-polluting sources, moderately polluting sources, low-polluting sources, DU landfill, informal settlement rate, lack of infrastructure, housing density, population density, green space, health care service size, education service size and unemployment rate. They were categorised into four major domains: environment, building, urban and social, as shown in Figure 3. In addition, land surveying was conducted to obtain accurate results by utilising global positioning system (GPS) instruments. Table 5 describes the datasets used in this study.

Table 5.
Types, description and accuracy of the data used in this study.
3.3. GIS Database Design and Management
A geodatabase was designed by applying various GIS operations. These procedures were applied to vector data versus raster data, which differed in structure. Raster data contain equal-sized cells that form a continuous surface. Vector data comprise polygons, lines and points that form distinct geographic features on Earth. In addition, spatial and textual data were integrated into the geodatabase. Subsequently, the sub-criteria relevant to vulnerability were extracted and then categorised into four major criteria: environment, building, urban and social. Figure 3 shows the layers of the sub-criteria that were required for running the MCDA to define vulnerable urban areas.
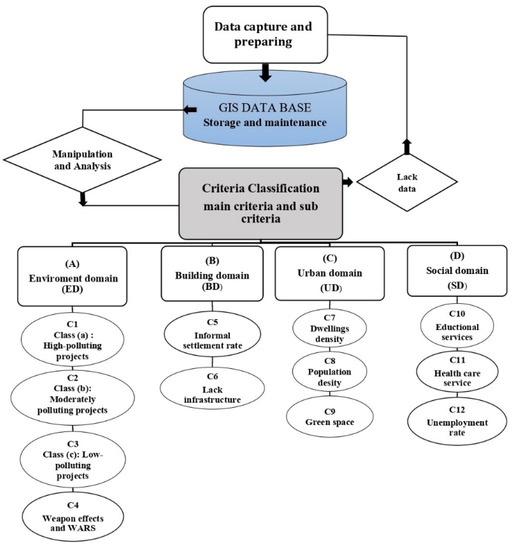
Figure 3.
Flowchart of data collection and classification of the criteria and sub-criteria.
3.4. Delphi Technique
The criteria and sub-criteria that were defined based on the literature review were reviewed by an expert panel using the Delphi method to confirm the criteria that were the most relevant to the vulnerability indicators. Delphi is an expert judgment technique in which a group of well-known experts in a specific field express their opinions during a series of discussions by following a prepared questionnaire to arrive at the group’s opinions about a specific issue [77]. An expert panel was carefully selected. It consisted of 22 qualified experts, six experts from the environment domain, ten experts from the urban planning department and six experts from the construction domain. The experts participated in multiple meetings with the purpose of integrating viewpoints into a group consensus. After each round, the answers were summarised and transferred to the experts. The experts were allowed to modify their responses in the next rounds, depending on how they analysed the group opinion. The result of this method was that nearly all the criteria and sub-criteria were approved as relevant to urban vulnerability indicators. Figure 3 shows the major criteria and sub-criteria endorsed by the expert panel.
3.5. Spatial Analysis Processes
After the collected data were organised into four primary datasets (urban, building, social and environment), two types of spatial analysis technique (continuous and discrete) were performed according to the type of data before a weighted linear combination function (WLC) was applied to produce vulnerability indicators for each domain, as shown in Figure 4.
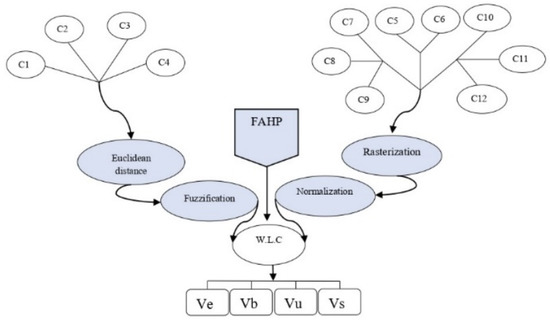
Figure 4.
Flowchart of the methods used to produce vulnerability indicators: environment (Ve), urban (Vu), building (Vb) and social (Vs).
3.5.1. Spatial Analysis of Continuous Data
In this study, data belonging to the environment domain was continuous. Given that all polluting projects and the DU landfill represented point sources of pollution (PSPs), their effects could be continuous across the study area to a different degree based on distance from the source. Therefore, two sequential operations, namely, Euclidean distance and FLM, were conducted before the sub-criteria were weighted with values obtained from FAHP. Then, an FO analysis was performed on the major criteria to obtain the final fuzzy map of total vulnerability.
- Euclidean distance function
Euclidean distance is a spatial analysis function available in the GIS environment. It uses the Pythagorean theorem to calculate the Euclidean distance to the closest source for each cell based on Formula (1). Through this function, the vector layer dataset that belonged to the environment domain was converted into raster form that indicated the existing distances from the pollution source to the remaining buffer area.
where d represents the distance between a pollution source and the remaining points.
- 2.
- Fuzzification
Whilst FL emulates human logic by using artificial intelligence (AI) techniques, only two options are restricted in the Boolean logic (BL) of computers: 0 or 1 [78]. FL allows for a degree of contribution to the reaction, represented by a membership function [49]. Although classical theory is founded on crisp sets, according to which each indicator belongs to a quite-determined class, FL access evaluates the different degrees of membership of each indicator to various classes. This approach has been used in contemporary research by examining a complex topic affected by uncertainty, such as vulnerability to climate change and urbanisation [7]. A negative FLM function was used to standardise the sub-criteria of the environment domain (effects of Classes A, B and C and DU) into fuzzy values between 0 and 1 based on Formula (2). Figure 5 illustrates negative and positive FLM functions, i.e., Formula (3).
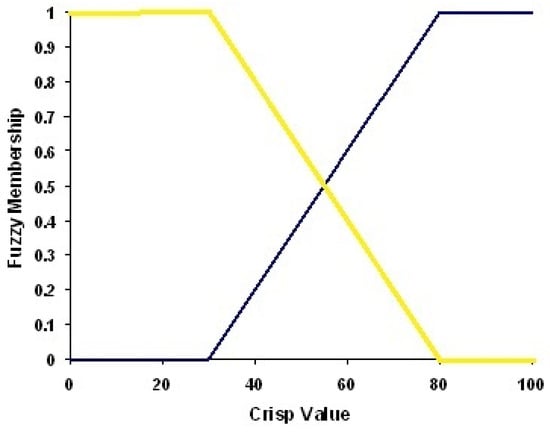
Figure 5.
The yellow line represents a negative FLM function based on Formula (2), whilst the blue line represents a positive FLM function based on Formula (3).
3.5.2. Methods for Processing and Analysing Discrete Data
Data belonging to the urban, building and social domains are discrete data. The collected data were distributed inside the boundaries of neighbourhoods based on actual quantities. The collected data related to the sub-criteria were manipulated, and spatial analysis was performed within the boundaries of the neighbourhoods. Therefore, discrete data were converted into raster form using the rasterisation function and then normalisation was applied to standardise the original values of the sub-criteria.
- Rasterisation
Eight raster layers were generated from the shape file form of the sub-criteria belonging to the three domains (building, urban and social) based on specific values, as shown in Figure 6.
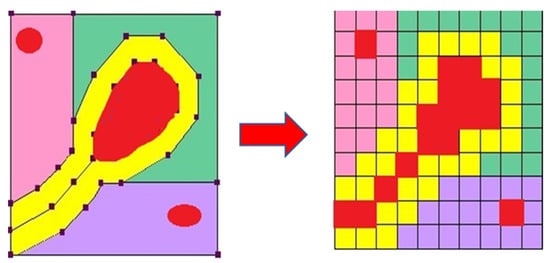
Figure 6.
Conversion of a shape file into raster form using the rasterisation tool.
- 2.
- Normalisation
In quantitative studies with various data sources, such as the current study, standardisation is required to make meaningful comparisons on the basis of values measured in different units [79]. Therefore, normalising the original values of the generated raster from the previous step was necessary to permit expressive comparisons. All original values were converted between 0 and 1 in this step based on the linear interpolation equation, i.e., Formula (4). Whilst number one indicates extreme vulnerability, zero indicates minimum vulnerability. Therefore, the increment in value is associated with an increase in potential vulnerability for a specific sub-criterion, as shown in Figure 7.
where 0 ≤ yi ≥ 1,and (xi) is the value of any raster cell.
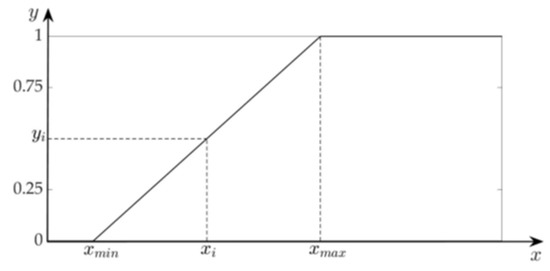
Figure 7.
Normalisation process.
3.6. AHP and FL
AHP is a technique used to evaluate a group of factors, criteria or activities that affect a specific phenomenon to varying degrees [80]. Although AHP was proposed in the 1980s, it remains an essential analysis method for subjects involving many options when performing a pairwise comparison of the options is difficult. FAHP is an enhanced version of AHP that supports a methodical alternative choosing rationale [43]. The traditional AHP method is accompanied by uncertainty because of crisp value judgements; thus, it does not reflect human reasoning. Accordingly, FAHP was ultimately used to address this issue and achieve a more confident decision. The two methods were selected and used in the current research. The AHP method was first applied to organise the hierarchical form and calculate the consistency ratio (CR) when investigating the consistency degree between the weights of different values. Subsequently, the FAHP technique was used to obtain the criterion weights of the major domains (environment, urban, building and social) and the sub-criteria according to the following sequential steps:
- Creating a pairwise comparison matrix. A pairwise comparison matrix was prepared based on the questionnaire survey results. Nine experts compared the relevant criteria with vulnerability indicators. The related weights of these criteria based on AHP were computed. To examine the consistency grade between the weighted values of various parameters, CR was calculated using the three formals (5)–(7). The results showed that the CR values were less than 0.1; thus, the pairwise comparison matrices were suitable.where (aij) is a pairwise comparison matrix element, and (wi) is the weight value of each parameter.
CI denotes the consistency index, whilst RI represents the mean of the random index that was calculated in accordance with Saaty’s rating RI (1–10) [81].
- 2.
- The comparative importance hierarchy values are crisp in AHP. Thus, crisp values were transformed into fuzzy numbers in this step based on the triangular fuzzy membership equation, i.e., Formula (8). Fuzzy value is described by three determinations {a, b, c}, as illustrated in Figure 8.
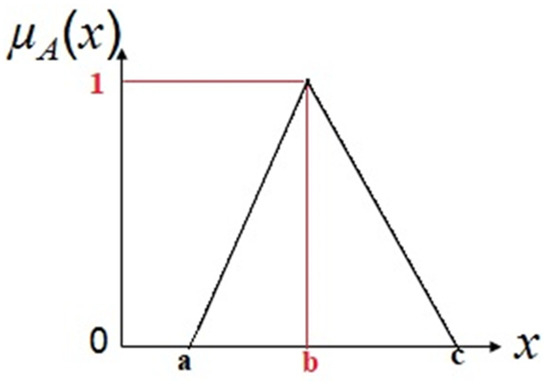 Figure 8. Triangular fuzzy membership equation.
 - 3.
- In this step, the fuzzy geometric mean value () of every criterion was calculated using Formula (9).
- 4.
- The fourth step was the determination of the fuzzy comparative weight of each criterion, as follows:where (ij) is a fuzzy comparison matrix of dimension i to criterion j.
- 5.
- Determining the weights of the crisp values using the centre of area (COA) method based on Formula (11).
- 6.
- The final step was the standardisation of the relative weights (wi) by applying Formula (12), and lastly, collecting the final weight (Wni). Table 6 provides the results.
 Table 6. Results of the FAHP method.
3.7. WLC
Using WLC, the acquired weights from FAHP were entered on the basis of Formula (13) to aggregate each group of sub-criteria into a single layer [82,83]. The results were four individual vulnerability maps: environmental vulnerability (Ve), building vulnerability (Vb), social vulnerability (Vs) and urban vulnerability (Vu), as shown in Figure 4.
where n is the number of sub-criteria, (wi) is the relative weight of a sub-criterion (ci) and (qi) is the amount of a sub-criterion (ci).
3.8. Final Fuzzy Map
3.8.1. Aggregated Vulnerability (Va)
In accordance with the theory of vulnerability, the aggregated vulnerability (Va) was taken to be the product of the three vulnerability domains: urban, social and building, Va = Vu ∗ Vs ∗ Vb [31]. FL was used to consider uncertainty in the classification and combination of the vulnerability indicators. Similarly, the FO tool was used to examine the potential of an event relevant to various sets in a multi-criterion overlay examination. Although FO specifies which sets a phenomenon is possibly a member of, it also examines the relationships amongst members of various sets [49]. The FO tool was applied twice (fuzzy product and fuzzy sum) to obtain the best indicator of vulnerability by calculating FOG using Formula (14), as shown in Figure 9.
where n is the number of input rasters, f(c) is the value of the pixel of each input raster, γ is gamma (0.90) and Va,t is the fuzzy gamma map of aggregation vulnerability and comprehensive vulnerability.
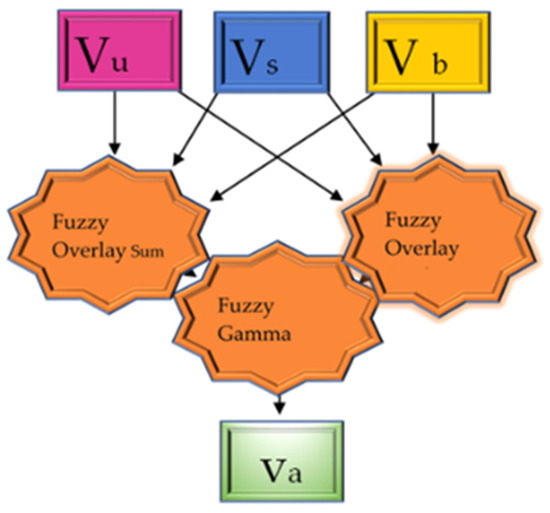
Figure 9.
FOG was used to aggregate the three vulnerability indicators (urban, social and building) into a single indicator, called the aggregated vulnerability Indicator.
3.8.2. Comprehensive Vulnerability Maps (Vt)
The final fuzzy map presents a comprehensive vulnerability map of the study area that was produced by multiplying the environment vulnerability indicators (Ve) by the aggregated vulnerability indicators (Va) based on vulnerability theory, in accordance with Formula 15 using FOG, as shown in Figure 10. To reduce evaluation subjectivity, two different scenarios of the overall vulnerability maps were proposed. In the first scenario, each of the four domains (environment, urban, social and building) was weighted with the obtained value from the FAHP method. In the second scenario, each of the four domains had the same value.
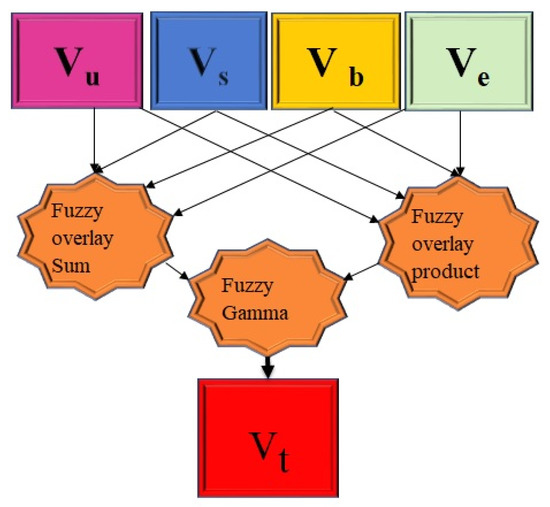
Figure 10.
FOG was used to aggregate the four vulnerability indicators (environment, urban, social and building) into a single indicator, called the comprehensive vulnerability indicator.
3.9. Jenks Optimisation Method
To understand vulnerability maps produced in this study and to characterise the data visually, the Jenks natural breaks (JNB) classification technique was used to reclassify the numerical values of the spatial data. The JNB technique utilises an algorithm that aims to minimise the deviation of weight in each type from the type average [84]. Furthermore, this algorithm attempts to increase the deviation of weights from the average of the other types on the basis of Formula (16) [85,86]. Consequently, the vulnerability maps were reclassified into five classes (very high, high, medium, low and very low) to enable decision-makers to interpret the results easily.
where GVF is between 1 and 0, and represents the goodness of fit of the different proper variables; SDAM represents the total of the squared deviations from the average of the current array; and SDCM represents the total of the squared deviations from the average of each type.
4. Results
The results were six vulnerability maps produced at the neighbourhood scale of the study area (Nasiriyah City): 1—urban vulnerability map (Vu), 2—social vulnerability map (Vs), 3—building vulnerability map (Vb), 4—aggregated vulnerability map (Va), comprising three domains (urban, social and building), 5—environmental vulnerability map (Ve), and 6—final fuzzy map (Vt), as well as overall vulnerability maps (urban, social, building and environment). To provide understandable vulnerability maps, JNB classification was used to classify the study area into five classes, depending on the proposed vulnerability indicators, from a very high vulnerability region to a very low vulnerability region.
4.1. Urban Vulnerability Map
Based on Formula (13), an urban vulnerability map (Vu) was produced by the overlapping of sub-criteria, namely, dwelling density (C7), population density (C8) and green space ratio (C9), as shown in Figure 11. In Figure 12, 13 neighbourhoods of the city are shown to be located in the very high vulnerability region. More than 196,928 people, i.e., 28% of the city’s total population, are located in this region. In addition, eight neighbourhoods with more than 89,000 people, or 12% of the total population, are located in the high vulnerability region.
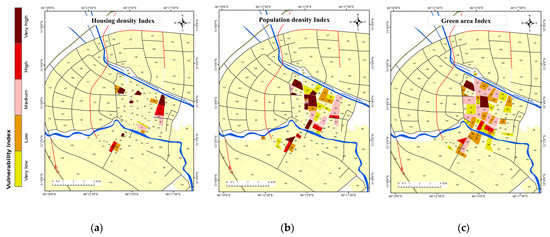
Figure 11.
Sub-criteria of the urban domain: (a) dwelling density (C7), (b) population density (C8) and (c) green space ratio (C9).
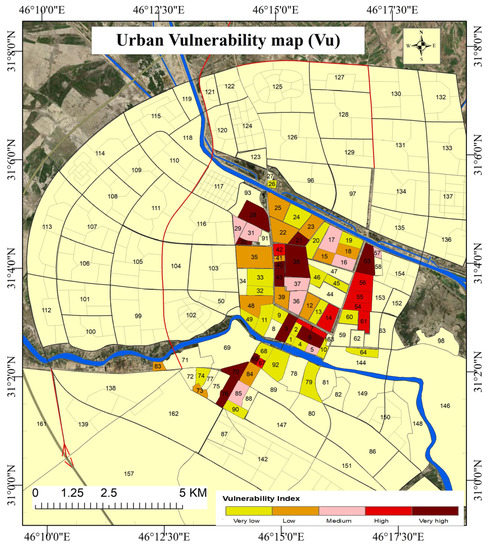
Figure 12.
Urban vulnerability map (Vu).
4.2. Social Vulnerability Map
Using the same technique, a social vulnerability map (Vs) was produced by overlapping sub-criteria, namely, education services (C10), health care services (C11) and unemployment rate (C12), as shown in Figure 13. In the process of gathering sub-criteria, each criterion was multiplied by the relevant weight obtained from FAHP using Formula (14) to produce Vs, as shown in Figure 14.
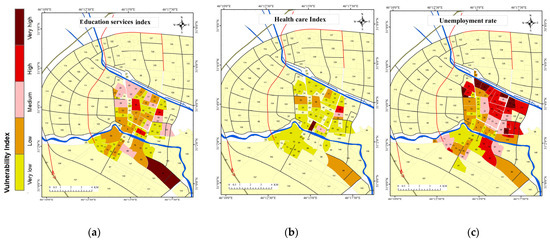
Figure 13.
Sub-criteria of the social domain: (a) education index (C10), (b) health care index (C11) and (c) unemployment rate (C12).
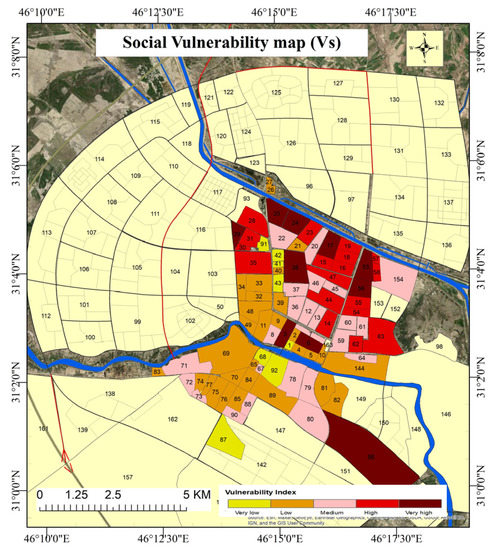
Figure 14.
Social vulnerability map (Vs).
As shown in Figure 14, 10 neighbourhoods of the city are located in the very high vulnerability region. These neighbourhoods are home to more than 197,559 people, i.e., 28% of the total population. In addition, 18 neighbourhoods with more than 172,000 residents, i.e., about 24% of the total population, are located in the high vulnerability region.
4.3. Building the Vulnerability Map
The building vulnerability map (Vb) was created by overlapping two sub-criteria, i.e., informal settlement rate (C5) and the lack of infrastructure rate (C6), using the same technique mentioned earlier, as shown in Figure 15 and Figure 16. The latter shows that three neighbourhoods of the city are located in the very high vulnerability region. These neighbourhoods have more than 23,000 residents, i.e., 3% of the city’s total population. In addition, only seven neighbourhoods with more than 36,000 residents, i.e., 5% of the total population, are located in the high vulnerability region.
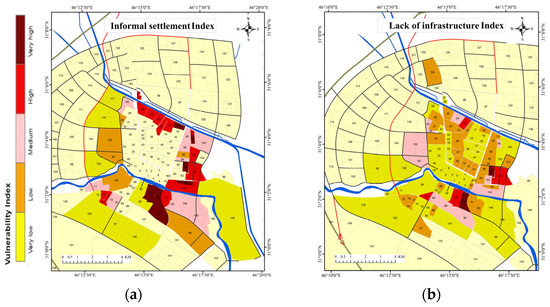
Figure 15.
Sub-criteria of the building domain: (a) informal settlement rate (C5) and (b) lack of infra-structure rate (C6).
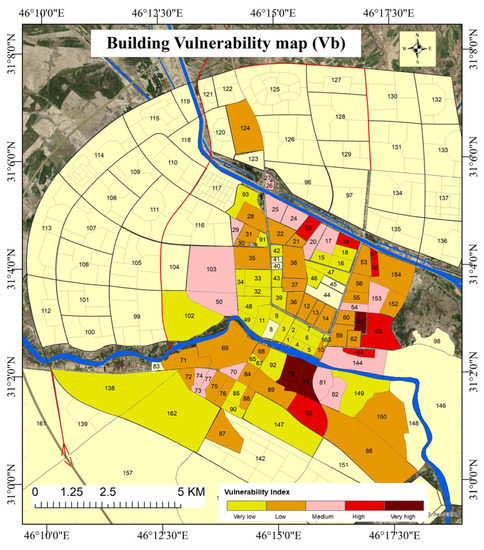
Figure 16.
Building vulnerability map (Vb).
4.4. Aggregated Vulnerability Map
The aggregated vulnerability map (Va) was produced by multiplying Vu, VS and Vb using the FOG technique based on Formula (14). As shown in Figure 17, six neighbourhoods of the city are located in the very high vulnerability region. These neighbourhoods have more than 106,000 residents, or 15% of the total population. In addition, 17 neighbourhoods with more than 204,000 people, or 29% of the total population, live in the high vulnerability area. Table 7 provides the spatial distribution of the population based on the proposed vulnerability indicators, while Table A1 provides the codes and names of the neighbourhoods of Nasiriyah City in south Iraq.
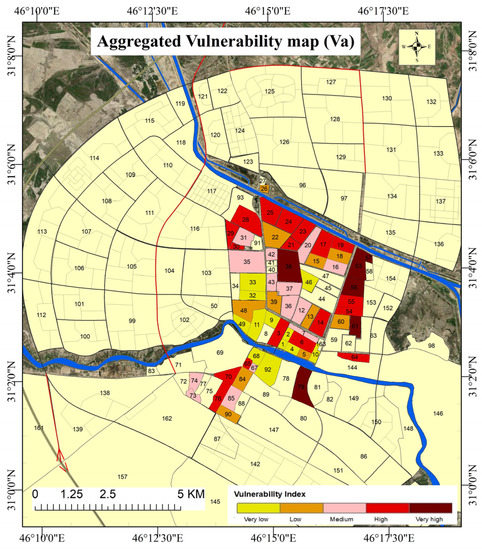
Figure 17.
Classification of city neighbourhoods based on the aggregated vulnerability indicators (Va).

Table 7.
Classification of city neighbourhoods based on the aggregated vulnerability indicators.
4.5. Environmental Vulnerability Map (Ve)
Overlapping of sub-criteria, i.e., high sources of pollution (C1), moderate sources of pollution (C2), low sources of pollution (C3) and effects of weapons and wars, DU landfill (C4), produced the environmental vulnerability map based on Formula (14), as shown in Figure 18, Figure 19 and Figure 20. The environmental vulnerability map classifies the study area into five classes, as mentioned earlier. For higher accuracy, the values of pixels were extracted from the boundaries of each neighbourhood based on its coordinates. Figure 21 shows that six neighbourhoods of the city are located in the very high vulnerability area. More than 68,660 people, i.e., 9.7% of the total population of the study area, are living in these neighbourhoods, which are exposed to environmental risks. In addition, eight neighbourhoods with more than 38,000 residents, or 5.4% of the total population, are located in the high vulnerability region.
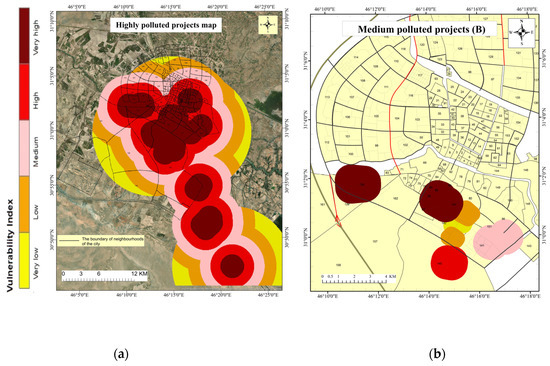
Figure 18.
Sub-criteria of the environmental domain: (a) map of the high sources of pollution (C1) and (b) map of the moderate sources of pollution (C2).
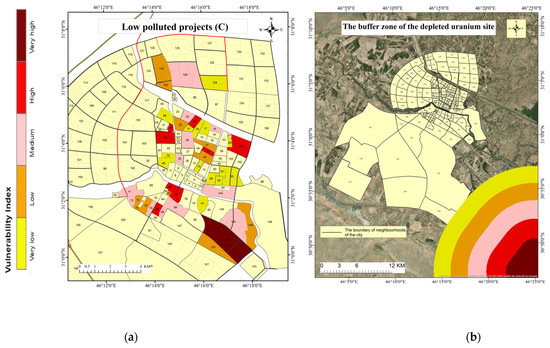
Figure 19.
Sub-criteria of the environmental domain: (a) map of the low-polluting projects (C3) and (b) buffer zones of DU landfill (C4).
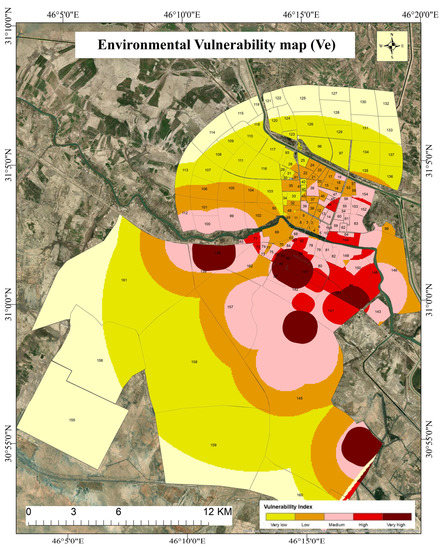
Figure 20.
Environmental vulnerability map (Ve).
4.6. Comprehensive Vulnerability Map
By using the FOG function based on Formula (14), a first scenario of the comprehensive vulnerability map (Vt) was produced by multiplying Va by Ve. As shown in Figure 21, 11 city neighbourhoods are located in the very high vulnerability region. They are home to more than 175,000 residents, or 25% of the total population of the study area. Furthermore, 12 neighbourhoods with more than 115,000 residents, or 16% of the total population, are located in the high vulnerability region, as indicated in Table 8. The second scenario results showed that only five neighbourhoods with 104,000 residents, i.e., 15% of the total population, are located in the very high vulnerability region. Furthermore, 15 neighbourhoods with more than 202,208 persons, or 29% of the total population, are located in the high vulnerability region, as shown in Figure 22. Table 9 provides the second scenario results.

Table 8.
First classification scenario of city neighbourhoods based on the comprehensive vulnerability index (Vt).
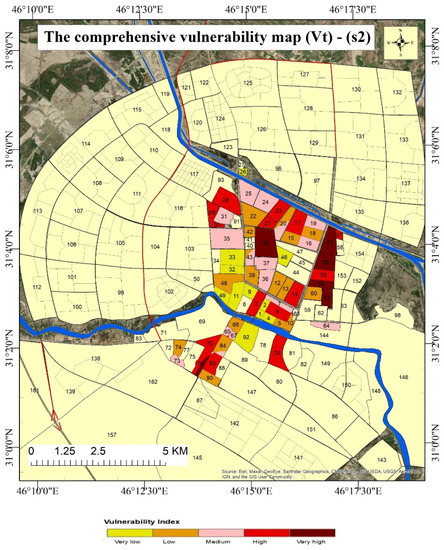
Figure 22.
Second classification scenario of city neighbourhoods based on the comprehensive vulnerability index (Vt).

Table 9.
Second classification scenario of city neighborhoods based on the comprehensive vulnerability index (Vt).
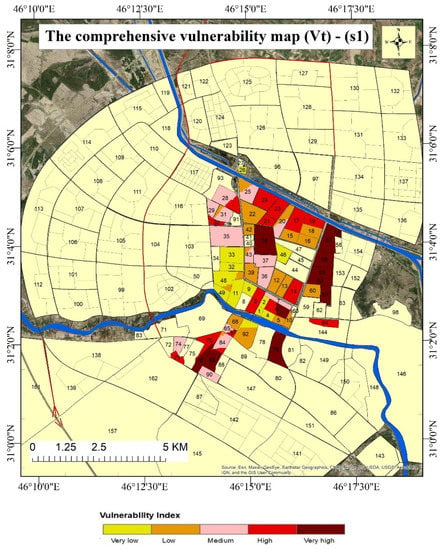
Figure 21.
First classification scenario of city neighbourhoods based on the comprehensive vulnerability index (Vt).
4.7. Validation
4.7.1. Using Machine Learning (ML)
The ML technique was used to verify the accuracy and robustness of the vulnerability map classification. ML is a technique that uses a small part of the data (the testing dataset) to evaluate a large part of the same dataset (a trained sample) [87]. The naïve Bayes (NB) classifier that is available in the Weka software was applied on the basis of Formula (17) [88]. Weka software is a group of ML algorithms for mining data; it is an open-source application [89]. The validation result showed that correctly classified instances were 90.4762%, and the kappa statistic value was 0.8786. Thus, the level of agreement of the classification results was demonstrated to be ‘almost perfect’. If the kappa value is between 0.80 and 1, then the result is interpreted as an ‘almost perfect agreement’ [90].
P(A/B) presents the posterior likelihood, where (A) is the probability of the hypothesis, and (B) presents the observed event. P(B/A) represents probability: the probability of the proof given that the probability of a hypothesis is correct.
4.7.2. Spatial Analysis Validation
Three aerial photos of the study area were acquired, i.e., drone imagery (2009), Pleiades 1 ORTHO (2014) and Sentinel 2 imagery (October 2021), to validate the results of the comprehensive vulnerability map (Vt), as shown in Figure 21. Six neighbourhoods from the eleven located in the very high vulnerability region (61, 54, 55, 56, 53 and 57) were spatially analysed as a sample to validate the vulnerability indicator results. Figure 23 shows the neighbourhoods located in the buffer zone of the main WWTP of the city, a high pollution source. In addition, the streets of this area are dusty (unpaved streets), and more than half of the total dwellings are informal housing. Compared with the other neighbourhoods, these are the most vulnerable areas. The spatial analysis confirmed the validity of the results.
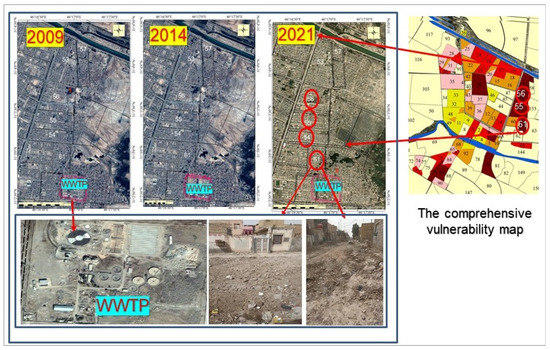
Figure 23.
Spatial analysis process for the region with very high vulnerability.
4.7.3. Sensitivity Analysis
Sensitivity analysis was used to investigate the model sensitivity to different criterion weights. It is typically applied as a mechanism for assessing the responses of a model to modifying the input parameters and evaluating the reliability of the obtained results [91]. Thus, model outcomes are substantial if the study results are altered when the input weights of the criteria are different [92,93,94]. In this study, a sensitivity analysis process was applied to demonstrate the effect of different weights on the classification outcomes to verify the robustness or sensitivity of the proposed model versus the relative importance of the major criteria. In addition, sensitivity analysis addresses the hypothesis that the study results will be changed if another scenario is used. In this context, another scenario was prepared in which the weights of the major criteria were changed. The classes of the city’s neighbourhoods were changed when the new weighted values were inputted, as illustrated in Figure 24. Consequently, the sensitivity analysis process confirmed that the model results were robust.
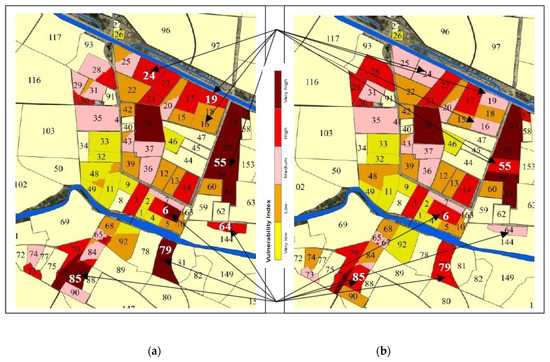
Figure 24.
Change in a neighbourhood’s classification between the first scenario (a) and the second scenario (b).
5. Discussion
Previous studies have used different methods to define vulnerable urban areas, and have adopted various criteria that are relevant to vulnerability assessment. Some scholars, such as Hazell (2020), classified the criteria into three categories (topographic, land cover attribute and demographic), whilst others, such as Gerundo, Marra and de Salvatore (2020), classified criteria into social, urban and building domains [7,28]. Similarly, Ruá et al. (2021) classified criteria into four categories: socioeconomic, sociodemographic, urban and building [30]. However, most of these approaches have disregarded potential environmental issues in urban areas resulting from urbanisation and human activities. Instead, they have focused primarily on financial and social criteria for studying land use change. Furthermore, the simulation results obtained were difficult to utilise in optimising land use on Earth [33].
In contrast with conventional approaches, the current study involved a new approach that is capable of comprehensively measuring vulnerability indicators (Vt), including environmental vulnerability indicators. Compared with previous studies, in which classical theory based on the logic of crisp sets was used, in the current study, FL was used to consider the uncertainty in the classification and combination of vulnerability indicators. In addition, the FOG function was applied to produce the final fuzzy map to balance the rising effect of the fuzzy sum and the lessening effect of the fuzzy product to obtain the best result.
In contrast to previous studies that used various criteria derived only from the existing literature, the current study involved a conservative approach to confirm the relevance of the criteria with the actual reality of vulnerable urban areas. The proposed approach included three sequential phases, starting with selecting relevant criteria from the literature review, then using the Delphi technique to arrive at the group’s opinion to endorse these criteria, and relating the endorsed criteria to national urban and environmental indicators. Furthermore, this study used the JNB method to provide a more meaningful visualisation for the vulnerability maps. ML was used to validate the model results. Two different scenarios of the overall vulnerability maps were created to reduce evaluation subjectivity.
The results indicated, both visually and statistically, that the city neighbourhoods suffered from environmental pollution and regional marginalisation. A large area of the city was suffering from pollution effects, with residential land use overlapping with polluted industrial use because of rapid urbanisation and poor land use. In addition, the comprehensive vulnerability maps showed that many neighbourhoods were located in very high and high vulnerability regions. The western part of the city, which is involved in future city expansion based on the master plan approved by local authorities, is located in a region with environmental pollution. By contrast, the northern part of the study area is outside the region with environmental pollution, and thus is suitable for future city extension. The conclusion can be drawn that local urban planning standards and environmental legislation have been disregarded in the planning stages for urban development.
With respect to the comparability of Nasiriyah City, i.e., the case study, and other Arab cities, the study produced results that were consistent, to a certain extent, with those of other studies that have been conducted to define vulnerable urban areas in Egyptian cities. For example, a study conducted by Effat, Ramadan and Ramadan (2021) in Assiut City, Egypt, revealed that the informal settlement rate, population density, urban growth rate and the lack of essential services are the most significant factors that increase the degree of vulnerability in urban areas [95]. Similarly, another study conducted by Waly, Ayad and Saadallah (2021) in Alexandria City, Egypt indicated that demographic characteristics, infrastructure indicators, urban domain, unemployment and poverty were the most consequential factors leading to urban vulnerability in the city [96]. However, the current study utilized a new approach that can evaluate urban areas more realistically by adopting comprehensive vulnerability indicators, including environmental indicators that are integrated with social, urban and building indicators. The proposed comprehensive assessment approach can be more reliable as a decision support system for analysing urban areas, and for allocating required financial resources and efficiently executing mitigation processes for the most vulnerable Arabic urban areas and developing countries.
In summary, compared with previous techniques, the proposed approach, based on vulnerability theory, contributes to identifying priority areas of intervention, exhibits novelty and makes a significant contribution to Earth’s sustainability. The proposed integration, i.e., using aggregated vulnerability indicators coupled with environment vulnerability indicators, enables the building of a robust database and provides a guide for comprehensive vulnerability assessment, offering an improved decision support system to determine priority areas for intervention in complex urban areas. In addition, this system can help optimise public spending to mitigate vulnerability as local authorities responsible for city services frequently have insufficient financial resources.
Why is the identification of vulnerable urban areas necessary before starting with intervention procedures? Evaluating a city’s situation before implementing intervention procedures has many purposes: 1—to identify the magnitude of the problem and clarify why a comprehensive plan for mitigating city problems with four dimensions (urban, social, building and environment) is urgently needed; 2—to define intervention priorities based on accurate vulnerability indicators; and, 3—to prepare a spatial database for monitoring vulnerability indicators when implementing intervention plans to mitigate the adverse effects of urbanisation and human activities.
6. Conclusions
Although SEA was introduced in the 1990s as an effective mechanism for assessing the environmental effect of polluting activities to preserve Earth’s sustainability, most previous studies have overlooked environmental pollution when defining vulnerable urban areas. The current research attempts to bridge the research gap by presenting a new comprehensive assessment model for defining vulnerable urban areas based on vulnerability theory with four dimensions: urban, social, building and environment. To overcome uncertainty in expert opinions and uncertainty in the classification and combination of vulnerability indicators, three FL techniques were integrated, FAHP, FLM and FOG, to ensure a comprehensive assessment of vulnerability. The proposed approach adopted twelve criteria organised into four domains (building, social, urban and environment) to define a vulnerable urban area. Furthermore, the proposed vulnerability indicators were classified using the JNB classification technique, and then the results were validated via ML. The validation model that used ML confirmed that the level of agreement of the classification results was ‘almost perfect’. Therefore, the model can facilitate making a wise decision, particularly when city districts are suffering simultaneously from diverse adverse effects. The major contribution of this study is the provision of a powerful decision support system for the assessment and analysis of urban areas that are exposed to environmental degradation and spatial marginalisation. This system can be used to allocate the required financial resources and ensure mitigation processes are executed efficiently for the most vulnerable urban areas in Iraq and other developing countries. However, strict restrictions are imposed on accessing data regarding environmental pollution and social vulnerability at the household scale to analyse the effects of polluting projects on human health in very high vulnerability regions. In addition, no actual investigations have determined the effect of DU in the study area due to a lack of experience and tools. Nevertheless, international reports have indicated an increase in disease cases associated with DU in the study area. Thus, further studies that focus on the effects of DU in conflict areas in general, and in Iraq in particular, are urgently needed. Improving the ability to evaluate overall vulnerability in urban areas under rapid urbanisation and high population growth will be essential when formulating policies for urban communities and building sustainable livelihoods in developing countries.
Author Contributions
Conceptualization, S.K.H. and A.F.A.; methodology, S.K.H.; software, S.K.H.; validation, S.K.H., A.F.A., H.Z.M.S. and A.W.; formal analysis, S.K.H.; investigation, S.K.H. and A.F.A.; resources, S.K.H.; data curation, S.K.H.; writing—original draft preparation, S.K.H.; writing—review and editing, S.K.H. and A.F.A.; supervision, S.K.H., A.F.A., H.Z.M.S. and A.W. All authors have read and agreed to the published version of the manuscript.
Funding
This research received no external funding.
Institutional Review Board Statement
Not applicable.
Informed Consent Statement
Not applicable.
Data Availability Statement
All data are reported in this paper.
Conflicts of Interest
The authors declare no conflict of interest.
Appendix A

Table A1.
The codes and names of the neighbourhoods of Nasiriyah City in south Iraq.
Table A1.
The codes and names of the neighbourhoods of Nasiriyah City in south Iraq.
| Neighbourhood Code | Name | Neighbourhood Code | Name |
|---|---|---|---|
| 1 | Aljamaa | 46 | Alaskary_3 |
| 2 | Sawage | 47 | Alhasan |
| 3 | Alseray | 48 | Bashaeer |
| 4 | Syaf | 49 | Rasool_1 |
| 5 | Sabeah | 50 | Rasool_2-3 |
| 6 | Alsharqyah_1 | 53 | Feda_2 |
| 7 | Alsharqyah_2 | 54 | Alamen dakhaly_1 |
| 8 | AbuJada_1 | 55 | Alamen dakhaly_2 |
| 9 | AbuJada_2 | 56 | Alamen dakhaly_3 |
| 10 | Alarooba | 57 | Karama_1 |
| 11 | AladaraAlmahalyah | 58 | Karama_2 |
| 12 | Alsalhyah_1 | 59 | Tadahayh_1 |
| 13 | Alsalhyah_2 | 60 | Tadahayh_2 |
| 14 | Alsalhyah_3 | 61 | Tadahayh_3 |
| 15 | Shuhada_1 | 62 | Zahra |
| 16 | Shuhada_2 | 63 | Beqaa |
| 17 | Shuhada_3 | 64 | Khadrah |
| 18 | Shuhada_4 | 65 | old askan_1 |
| 19 | Shuhada_5 | 67 | Old askan_3 |
| 20 | Rafedeen | 68 | old askan_4 |
| 21 | Arido_1 | 69 | Mutanazah |
| 22 | Arido_2 | 70 | Zauyah_Bs |
| 23 | Arido_3 | 71 | Alaarja |
| 24 | Arido_4 | 72 | Mansuryah_1 |
| 25 | Arido_5 | 73 | Mansuryah_2 |
| 26 | Ind_n_1 | 74 | Mansuryah_3 |
| 27 | Ind_n_2 | 75 | Thura_1 |
| 28 | Sader_1 | 76 | Thura_2 |
| 29 | Sader_2 | 77 | Thura_3 |
| 30 | Sader_3 | 78 | Zaaylat |
| 31 | Sader_4 | 79 | Zaaylat_2 |
| 32 | Ur_1 | 80 | Zaaylat_3 |
| 33 | Ur_2 | 81 | Samood_fayth |
| 34 | Ur_3 | 82 | Samood_2 |
| 35 | Ur_4 | 84 | Shaalah |
| 36 | Sumer_1 | 85 | Sakak |
| 37 | Sumer_2 | 86 | Alaskan_Sanay |
| 38 | Sumer_3 | 87 | Alhbush |
| 39 | Sumer_4 | 88 | Alamarat |
| 40 | Almulmeen_1 | 89 | Shmukh |
| 41 | Almulmeen_2 | 90 | Kanzawy |
| 42 | Almulmeen_3 | 91 | Sader ccomplex |
| 43 | Almulmeen_4 | 92 | University complex |
| 44 | Alaskary_1 | 144 | Khatra-2 |
| 45 | Alaskary_2 |
References
- Rossell, J. Mapping of the Flood Distribution in an Urban Environment: The Case of Palma (Mallorca, Spain) in the First Two Decades of the 21st Century. Earth 2021, 24, 960–971. [Google Scholar] [CrossRef]
- Hanine, M.; Boutkhoum, O.; Barakaz, F.E.; Lachgar, M.; Assad, N. An Intuitionistic Fuzzy Approach for Smart City Development Evaluation for Developing Countries: Moroccan Context. Mathematics 2021, 9, 2668. [Google Scholar] [CrossRef]
- Islam, M.A.S.; Hossain, M.E.; Majed, N. Assessment of Physicochemical Properties and Comparative Pollution Status of the Dhaleshwari River in Bangladesh. Earth 2021, 2, 696–714. [Google Scholar] [CrossRef]
- Olorunfemi, I.E.; Fasinmirin, J.T.; Olufayo, A.A.; Komolafe, A.A. GIS and Remote Sensing-Based Analysis of the Impacts of Land use/Land Cover Change (LULCC) on the Environmental Sustainability of Ekiti State, Southwestern Nigeria; Springer: Berlin/Heidelberg, Germany, 2020; Volume 22, ISBN 0123456789. [Google Scholar]
- Lai, Y. Urban Intelligence for Planetary Health. Earth 2021, 2, 972–979. [Google Scholar] [CrossRef]
- Lyu, H.M.; Wu, Y.X.; Shen, J.S.; Zhou, A.N. Assessment of social-economic risk of Chinese dual land use system using fuzzy AHP. Sustainability 2018, 10, 2451. [Google Scholar] [CrossRef]
- Gerundo, R.; Marra, A.; De Salvatore, V. Construction of a composite vulnerability index to map peripheralization risk in urban and metropolitan areas. Sustainability 2020, 12, 4641. [Google Scholar] [CrossRef]
- Office, D.M.; Pradesh, A. Landslide Science and Practice; Springer: Berlin/Heidelberg, Germany, 2013. [Google Scholar] [CrossRef]
- Rönkkö, E.; Herneoja, A. Working across boundaries in urban land use and services planning—building public sector capabilities for digitalisation. Smart Cities 2021, 4, 767–782. [Google Scholar] [CrossRef]
- Thornton, L.E.; Schroers, R.-D.; Lamb, K.E.; Daniel, M.; Ball, K.; Chaix, B.; Kestens, Y.; Best, K.; Oostenbach, L.; Coffee, N.T. Operationalising the 20-minute neighbourhood. Int. J. Behav. Nutr. Phys. Act. 2022, 19, 15. [Google Scholar] [CrossRef]
- Jorgenson, A.K.; Clark, B.; Givens, J.E. The environmental impacts of militarization in comparative perspective: An overlooked relationship. Nat. Cult. 2012, 7, 314–337. [Google Scholar] [CrossRef]
- Hadeel, A.S.; Jabbar, M.T.; Chen, X. Application of remote sensing and GIS to the study of land use/cover change and urbanization expansion in Basrah province, Southern Iraq. Geo-Spatial Inf. Sci. 2009, 12, 135–141. [Google Scholar] [CrossRef]
- Durakovic, A. Medical effects of a transuranic “dirty bomb”. Mil. Med. 2017, 182, e1591–e1595. [Google Scholar] [CrossRef] [PubMed]
- Adel, M.; Biswajeet, S.; Mojaddadi, H.; Jung, R.H. Land Use Feature Extraction and Sprawl Development Prediction from Quickbird Satellite Imagery Using Dempster-Shafer and Land Transformation Model. Korean J. Remote Sens. 2020, 36, 15–27. [Google Scholar]
- Daniel, S.; Doran, M.A. GeoSmartCity: Geomatics contribution to the Smart City. In Proceedings of the 14th Annual International Conference on Digital Government Research, Quebec City, QC, Canada, 17–20 June 2013; pp. 65–71. [Google Scholar] [CrossRef]
- Stokes, E.C.; Seto, K.C. Characterizing and measuring urban landscapes for sustainability. Environ. Res. Lett. 2019, 14, 45002. [Google Scholar] [CrossRef]
- Fernández-García, M.; Navarro, C.J.; Gómez-Ramirez, I. Evaluating territorial targets of european integrated urban policy. The URBAN and URBANA initiatives in Spain (1994–2013). Land 2021, 10, 956. [Google Scholar] [CrossRef]
- Vinci, G.; Maddaloni, L.; Mancini, L.; Prencipe, S.A.; Ruggeri, M.; Tiradritti, M. The Health of the Water Planet: Challenges and Opportunities in the Mediterranean Area. An Overview. Earth 2021, 2, 894–919. [Google Scholar] [CrossRef]
- Akubia, J.E.K.; Ahmed, A.; Bruns, A. Assessing how land-cover change associated with urbanisation affects ecological sustainability in the greater Accra metropolitan area, Ghana. Land 2020, 9, 182. [Google Scholar] [CrossRef]
- Ruá, M.J.; Huedo, P.; Cordani, L.; Cabeza, M.; Saez, B.; Agost-Felip, R. Strategies of urban regeneration in vulnerable areas: A case study in Castellón, Spain. WIT Trans. Ecol. Environ. 2019, 238, 481–492. [Google Scholar] [CrossRef]
- Hall, J.; Azad Hossain, A.K.M. Mapping urbanization and evaluating its possible impacts on streamwater quality in Chattanooga, Tennessee, using GIS and remote sensing. Sustainability 2020, 12, 1980. [Google Scholar] [CrossRef]
- Hambling, T.; Weinstein, P.; Slaney, D. A review of frameworks for developing environmental health indicators for climate change and health. Int. J. Environ. Res. Public Health 2011, 8, 2854–2875. [Google Scholar] [CrossRef]
- Abascal, A.; Rothwell, N.; Shonowo, A.; Thomson, D.R.; Elias, P.; Elsey, H.; Yeboah, G.; Kuffer, M. “Domains of deprivation framework” for mapping slums, informal settlements, and other deprived areas in LMICs to improve urban planning and policy: A scoping review. Comput. Environ. Urban Syst. 2022, 93, 101770. [Google Scholar] [CrossRef]
- Malekmohammadi, B.; Jahanishakib, F. Vulnerability assessment of wetland landscape ecosystem services using driver-pressure-state-impact-response (DPSIR) model. Ecol. Indic. 2017, 82, 293–303. [Google Scholar] [CrossRef]
- Papathoma-Köhle, M.; Cristofari, G.; Wenk, M.; Fuchs, S. The importance of indicator weights for vulnerability indices and implications for decision making in disaster management. Int. J. Disaster Risk Reduct. 2019, 36, 101103. [Google Scholar] [CrossRef]
- Ministry of Housing Communities and Local Government. National Statistics English Indices of Deprivation 2019. Available online: https://www.gov.uk/government/statistics/english-indices-of-deprivation-2019 (accessed on 20 January 2021).
- Lynch, A.J.; Mosbah, S.M. Improving local measures of sustainability: A study of built-environment indicators in the United States. JCIT 2017, 60, 301–313. [Google Scholar] [CrossRef]
- Hazell, E. Disaggregating Ecosystem Benefits: An Integrated Environmental-Deprivation Index. Sustainability 2020, 12, 7589. [Google Scholar] [CrossRef]
- Ge, Y.; Yang, G.; Chen, Y.; Dou, W. Examining Social Vulnerability and Inequality: A Joint Analysis through a Connectivity Lens in the Urban Agglomerations of China. Sustainability 2019, 11, 1042. [Google Scholar] [CrossRef]
- Ruá, M.J.; Huedo, P.; Cabeza, M.; Saez, B.; Agost-Felip, R. A model to prioritise sustainable urban regeneration in vulnerable areas using SWOT and CAME methodologies. Neth. J. Hous. Built Environ. 2021, 36, 1603–1627. [Google Scholar] [CrossRef]
- Gerundo, R.; Nesticò, A.; Marra, A.; Carotenuto, M. Peripheralization Risk Mitigation: A Decision Support Model to Evaluate Urban Regeneration Programs Effectiveness. Sustainability 2020, 12, 8024. [Google Scholar] [CrossRef]
- Thornton, J.A.; Harding, W.R.; Slawski, T.M.; Lin, H. Monitoring and Evaluation: The Foundation for Lake and Reservoir Management. Earth 2022, 3, 115–124. [Google Scholar] [CrossRef]
- Li, J.; Ouyang, X.; Zhu, X. Land space simulation of urban agglomerations from the perspective of the symbiosis of urban development and ecological protection: A case study of Changsha-Zhuzhou-Xiangtan urban agglomeration. Ecol. Indic. 2021, 126, 107669. [Google Scholar] [CrossRef]
- Josimović, B.D.; Cvjetić, A.; Manić, B. Strategic Environmental Assessment in the Application of Preventive Protection for Wind Farm Noise—Case Study: Maestrale Ring Wind Farm. Energies 2021, 14, 6174. [Google Scholar] [CrossRef]
- George, S.L.; Kantamaneni, K.; V, R.A.; Prasad, K.A.; Shekhar, S.; Panneer, S.; Rice, L.; Balasubramani, K. A Multi-Data Geospatial Approach for Understanding Flood Risk in the Coastal Plains of Tamil Nadu, India. Earth 2022, 3, 383–400. [Google Scholar] [CrossRef]
- Assumma, V.; Bottero, M.; De Angelis, E.; Lourenço, J.M.; Monaco, R.; Soares, A.J. A decision support system for territorial resilience assessment and planning: An application to the Douro Valley (Portugal). Sci. Total Environ. 2021, 756, 143806. [Google Scholar] [CrossRef]
- Ferretti, V. Framing territorial regeneration decisions: Purpose, perspective and scope. Land Use Policy 2021, 102, 105279. [Google Scholar] [CrossRef]
- Billaud, O.; Soubeyrand, M.; Luque, S.; Lenormand, M. Comprehensive decision-strategy space exploration for efficient territorial planning strategies. Comput. Environ. Urban Syst. 2020, 83, 101516. [Google Scholar] [CrossRef]
- Ghorbanzadeh, O.; Feizizadeh, B.; Blaschke, T. Multi-criteria risk evaluation by integrating an analytical network process approach into GIS-based sensitivity and uncertainty analyses. Geomatics Nat. Hazards Risk 2018, 9, 127–151. [Google Scholar] [CrossRef]
- Hanoon, S.K.; Abdullah, A.F.; Shafri, H.Z.M.; Wayayok, A. Using scenario modelling for adapting to urbanization and water scarcity: Towards a sustainable city in semi-arid areas. Period. Eng. Nat. Sci. (PEN) 2021, 10, 518–532. [Google Scholar] [CrossRef]
- Diaz-Balteiro, L.; González-Pachón, J.; Romero, C. Measuring systems sustainability with multi-criteria methods: A critical review. Eur. J. Oper. Res. 2017, 258, 607–616. [Google Scholar] [CrossRef]
- Zolfaghary, P.; Zakerinia, M.; Kazemi, H. A model for the use of urban treated wastewater in agriculture using multiple criteria decision making (MCDM) and geographic information system (GIS). Agric. Water Manag. 2021, 243, 106490. [Google Scholar] [CrossRef]
- Malakar, S. Geospatial modelling of COVID-19 vulnerability using an integrated fuzzy MCDM approach: A case study of West Bengal, India. Model. Earth Syst. Environ. 2021, 2021, 1–14. [Google Scholar] [CrossRef]
- Caprioli, C.; Bottero, M. Addressing complex challenges in transformations and planning: A fuzzy spatial multicriteria analysis for identifying suitable locations for urban infrastructures. Land Use Policy 2021, 102, 105147. [Google Scholar] [CrossRef]
- Perera, K.; Tateishi, R.; Akihiko, K.; Herath, S. A Combined Approach of Remote Sensing, GIS, and Social Media to Create and Disseminate Bushfire Warning Contents to Rural Australia. Earth 2021, 2, 715–730. [Google Scholar] [CrossRef]
- Türk, E.; Zwick, P.D. Optimization of land use decisions using binary integer programming: The case of Hillsborough County, Florida, USA. J. Environ. Manag. 2019, 235, 240–249. [Google Scholar] [CrossRef] [PubMed]
- Parsian, S.; Amani, M.; Moghimi, A.; Ghorbanian, A.; Mahdavi, S. Flood hazard mapping using fuzzy logic, analytical hierarchy process, and multi-source geospatial datasets. Remote Sens. 2021, 13, 4761. [Google Scholar] [CrossRef]
- Alwan, I.A.; Aziz, N.A.; Hamoodi, M.N. Potential water harvesting sites identification using spatial multi-criteria evaluation in Maysan Province, Iraq. ISPRS Int. J. Geo-Inf. 2020, 9, 235. [Google Scholar] [CrossRef]
- Baalousha, H.M.; Tawabini, B.; Seers, T.D. Fuzzy or non-fuzzy? A comparison between fuzzy logic-based vulnerability mapping and DRASTIC approach using a numerical model. a case study from qatar. Water 2021, 13, 1288. [Google Scholar] [CrossRef]
- Sema, H.V.; Guru, B.; Veerappan, R. Fuzzy gamma operator model for preparing landslide susceptibility zonation mapping in parts of Kohima Town, Nagaland, India. Model. Earth Syst. Environ. 2017, 3, 499–514. [Google Scholar] [CrossRef]
- Bianchini, S.; Solari, L.; Del Soldato, M.; Raspini, F.; Montalti, R.; Ciampalini, A.; Casagli, N. Ground Subsidence Susceptibility (GSS) mapping in Grosseto plain (Tuscany, Italy) based on satellite InSAR data using frequency ratio and fuzzy logic. Remote Sens. 2019, 11, 2015. [Google Scholar] [CrossRef]
- Mallick, J.; Talukdar, S.; Kahla, N.B.; Ahmed, M.; Alsubih, M.; Almesfer, M.K.; Islam, A.R.M.T. A novel hybrid model for developing groundwater potentiality model using high resolution digital elevation model (DEM) derived factors. Water 2021, 13, 2632. [Google Scholar] [CrossRef]
- Sekandari, M.; Beiranvand Pour, A. Fuzzy Logic Modeling for Integrating the Thematic Layers Derived from Remote Sensing Imagery: A Mineral Exploration Technique. Environ. Sci. Proc. 2021, 6, 8. [Google Scholar] [CrossRef]
- Vučić, N.; Cetl, V.; Šantek, D.; Mađer, M. Importance of Official Geodata in Disaster Risk Management—Case Study of Croatia. Earth 2021, 2, 943–959. [Google Scholar] [CrossRef]
- United Nations. Report on the World Social Situation, 2003: Social Vulnerability: Sources and Challenges; United Nations Publications: New York, NY, USA, 2003; ISBN 92-1-130231-5. [Google Scholar]
- Huedo, P.; Ruá, M.J.; Florez-Perez, L.; Agost-Felip, R. Inclusion of gender views for the evaluation and mitigation of urban vulnerability: A case study in castellón. Sustainability 2021, 13, 10062. [Google Scholar] [CrossRef]
- Garcia-almirall, P. Residential Vulnerability of Barcelona: Methodology Integrating Multi-Criteria Evaluation Systems and Geographic Information Systems. Sustainability 2021, 13, 13659. [Google Scholar] [CrossRef]
- Galderisi, A.; Limongi, G. A comprehensive assessment of exposure and vulnerabilities in multi-hazard urban environments: A key tool for risk-informed planning strategies. Sustainability 2021, 13, 9055. [Google Scholar] [CrossRef]
- Kang, Y.; Kim, K.; Jung, J.; Son, S.; Kim, E.J. How vulnerable are urban regeneration sites to climate change in Busan, South Korea? Sustainability 2020, 12, 4032. [Google Scholar] [CrossRef]
- Pasi, R.; Viavattene, C.; La Loggia, G.; Musco, F. Assessing urban system vulnerabilities to flooding to improve resilience and adaptation in spatial planning. Green Energy Technol. 2018, 79–94. [Google Scholar] [CrossRef]
- Motalebi Damuchali, A.; Guo, H. Evaluation of odour properties, their relationships, and impact of an oil refinery plant on the surrounding environment using field measurements. Atmos. Environ. 2020, 230, 117480. [Google Scholar] [CrossRef]
- Mahdi, N.N.; Abed, H.T.; Sadik, N.J. The Discriminant Analysis in the Evaluation of Cancers Diseases in Iraq. Int. J. Adv. Sci. Eng. Inf. Technol. 2020, 10, 2170–2176. [Google Scholar] [CrossRef]
- Birchard, K. Does Iraq’s depleted uranium pose a health risk? Lancet 1998, 351, 657. [Google Scholar] [CrossRef]
- Wang, Y.; Von Gunten, K.; Bartova, B.; Meisser, N.; Astner, M.; Burger, M.; Bernier-Latmani, R. Products of in Situ Corrosion of Depleted Uranium Ammunition in Bosnia and Herzegovina Soils. Environ. Sci. Technol. 2016, 50, 12266–12274. [Google Scholar] [CrossRef] [PubMed]
- Faa, A.; Gerosa, C.; Fanni, D.; Floris, G.; Eyken, P.V.; Lachowicz, J.I.; Nurchi, V.M. Depleted Uranium and Human Health. Curr. Med. Chem. 2017, 25, 49–64. [Google Scholar] [CrossRef]
- Al-Ansari, N.; Knutsson, S.; Pusch, R. The environmental implications of depleted uranium in Iraq and the principles of isolating it. WIT Trans. Ecol. Environ. 2014, 180, 367–375. [Google Scholar] [CrossRef]
- Toque, C.; Milodowski, A.E.; Baker, A.C. The corrosion of depleted uranium in terrestrial and marine environments. J. Environ. Radioact. 2014, 128, 97–105. [Google Scholar] [CrossRef] [PubMed]
- Savabieasfahani, M.; Basher Ahamadani, F.; Mahdavi Damghani, A. Living near an active U.S. military base in Iraq is associated with significantly higher hair thorium and increased likelihood of congenital anomalies in infants and children. Environ. Pollut. 2020, 256, 113070. [Google Scholar] [CrossRef] [PubMed]
- Shewale, S.V. Low Dose Nerve Agent Sarin Causes Dilated Cardiomyopathy and Autonomic Imbalance in Mice. Ph.D. Thesis, Wright State University, Dayton, OH, USA, 2011. [Google Scholar]
- Gray, G.C.; Smith, T.C.; Knoke, J.D.; Heller, J.M. The postwar hospitalization experience of Gulf War veterans possibly exposed to chemical munitions destruction at Khamisiyah, Iraq. Am. J. Epidemiol. 1999, 150, 532–540. [Google Scholar] [CrossRef] [PubMed][Green Version]
- Ribeiro, D.F.; Saito, S.M.; Célia dos Santos Alvalá, R. Disaster vulnerability analysis of small towns in Brazil. Int. J. Disaster Risk Reduct. 2022, 68, 102726. [Google Scholar] [CrossRef]
- Nassar, D.M.; Elsayed, H.G. From Informal Settlements to sustainable communities. Alex. Eng. J. 2018, 57, 2367–2376. [Google Scholar] [CrossRef]
- Mouratidis, K.; Yiannakou, A. COVID-19 and urban planning: Built environment, health, and well-being in Greek cities before and during the pandemic. Cities 2022, 121, 103491. [Google Scholar] [CrossRef] [PubMed]
- Goto, E.A.; Suarez, A.M.; Ye, H. Spatial analysis of social vulnerability in São Paulo city, Brazil. Appl. Geogr. 2022, 140, 102653. [Google Scholar] [CrossRef]
- Guan, W.; Liu, Q.; Dong, C. Risk assessment method for industrial accident consequences and human vulnerability in urban areas. J. Loss Prev. Process Ind. 2022, 76, 104745. [Google Scholar] [CrossRef]
- Sarker, M.S.H. Assessing levels of migrant-friendliness in the context of vulnerability to climate variability, change and environmental hazard: A comparison of two different-sized cities. Int. J. Disaster Risk Reduct. 2022, 68, 102525. [Google Scholar] [CrossRef]
- Olivero, M.A.; Bertolino, A.; Dominguez-Mayo, F.J.; Matteucci, I.; Escalona, M.J. A Delphi Study to Recognize and Assess Systems of Systems Vulnerabilities. Inf. Softw. Technol. 2022, 146, 106874. [Google Scholar] [CrossRef]
- Zadeh, L. Zadeh_FuzzySetTheory_1965.pdf. Inf. Control 1965, 8, 338–353. [Google Scholar] [CrossRef]
- Carver, S.J. Integrating multi-criteria evaluation with geographical information systems. Int. J. Geogr. Inf. Syst. 1991, 5, 321–339. [Google Scholar] [CrossRef]
- Wind, Y.; Saaty, T.L. Marketing Applications of the Analytic Hierarchy Process. Manag. Sci. 1980, 26, 641–658. [Google Scholar] [CrossRef]
- He, M.X.; An, X. Information security risk assessment based on analytic hierarchy process. Indones. J. Electr. Eng. Comput. Sci. 2016, 1, 656–664. [Google Scholar] [CrossRef]
- Abu-Bakr, H.A.E.A. Groundwater vulnerability assessment in different types of aquifers. Agric. Water Manag. 2020, 240, 106275. [Google Scholar] [CrossRef]
- Haki, Z.; Akyürek, Z.; Düzgün, Ş. Assessment of Social Vulnerability Using Geographic Information Systems: Pendik, Istanbul Case Study. Master’s Thesis, Middle East Technical University, Ankara, Turkey, 2004; pp. 413–423. [Google Scholar]
- Chen, J.; Yang, S.; Li, H.; Zhang, B.; Lv, J. Research on geographical environment unit division based on the method of natural breaks (Jenks). Int. Arch. Photogramm. Remote Sens. Spat. Inf. Sci. ISPRS Arch. 2013, 40, 47–50. [Google Scholar] [CrossRef]
- Osaragi, T. Classification Methods for Spatial Data Representation. UCL-Centre Adv. Spat. Anal. Pap. Ser. 2002, 44, 1–19. [Google Scholar]
- Alkhodari, M.; Jelinek, H.F.; Saleem, S.; Hadjileontiadis, L.J.; Khandoker, A.H. Revisiting Left Ventricular Ejection Fraction Levels: A Circadian Heart Rate Variability-Based Approach. IEEE Access 2021, 9, 130111–130126. [Google Scholar] [CrossRef]
- Chen, Y.; Santosa, A.E.; Yi, A.M.; Sharma, A.; Sharma, A.; Lo, D. A Machine Learning Approach for Vulnerability Curation. In Proceedings of the 17th International Conference on Mining Software Repositories, Seoul, Korea, 29–30 June 2020; pp. 32–42. [Google Scholar] [CrossRef]
- Ko, Y. How to use negative class information for Naive Bayes classification. Inf. Process. Manag. 2017, 53, 1255–1268. [Google Scholar] [CrossRef]
- David, S.; Saeb, A.; Rubeaan, K. Al Comparative Analysis of Data Mining Tools and Classification Techniques using WEKA in Medical Bioinformatics. Comput. Eng. Intell. 2013, 4, 28–39. Available online: http://iiste.org/Journals/index.php/CEIS/article/view/9348 (accessed on 1 February 2021).
- McHugh, M.L. Interrater reliability: The kappa statistic. Biochemia medica. Biochem. Medica 2012, 22, 276–282. [Google Scholar] [CrossRef]
- Gitinavard, H.; Mousavi, S.M.; Vahdani, B. Soft computing based on hierarchical evaluation approach and criteria interdependencies for energy decision-making problems: A case study. Energy 2017, 118, 556–577. [Google Scholar] [CrossRef]
- Issa, U.; Saeed, F.; Miky, Y.; Alqurashi, M.; Osman, E. Hybrid AHP-Fuzzy TOPSIS Approach for Selecting Deep Excavation Support System. Buildings 2022, 12, 295. [Google Scholar] [CrossRef]
- Saltelli, A.; Aleksankina, K.; Becker, W.; Fennell, P.; Ferretti, F.; Holst, N.; Li, S.; Wu, Q. Why so many published sensitivity analyses are false: A systematic review of sensitivity analysis practices. Environ. Model. Softw. 2019, 114, 29–39. [Google Scholar] [CrossRef]
- Hoops, S.; Hontecillas, R.; Abedi, V.; Leber, A.; Philipson, C.; Carbo, A.; Bassaganya-Riera, J. Ordinary Differential Equations (ODEs) Based Modeling. In Computational Immunology; Academic Press: Cambridge, MA, USA, 2016; pp. 63–78. [Google Scholar] [CrossRef]
- Effat, H.A.; Ramadan, M.S.; Ramadan, R.H. A spatial model for assessment of urban vulnerability in the light of the UN New Urban Agenda guidelines: Case study of Assiut City, Egypt. Model. Earth Syst. Environ. 2021, 2021, 1–20. [Google Scholar] [CrossRef] [PubMed]
- Waly, N.M.; Ayad, H.M.; Saadallah, D.M. Assessment of spatiotemporal patterns of social vulnerability: A tool to resilient urban development Alexandria, Egypt. Ain Shams Eng. J. 2021, 12, 1059–1072. [Google Scholar] [CrossRef]
Publisher’s Note: MDPI stays neutral with regard to jurisdictional claims in published maps and institutional affiliations. |
© 2022 by the authors. Licensee MDPI, Basel, Switzerland. This article is an open access article distributed under the terms and conditions of the Creative Commons Attribution (CC BY) license (https://creativecommons.org/licenses/by/4.0/).