Article

Impact of Disturbances on Species Diversity and Regeneration of Nepalese Sal (Shorea robusta) Forests Managed under Different Management Regimes

1
Department of Forests and Soil Conservation, Government of Nepal, Kathmandu 0977, Nepal
2
Department of Integrative Biology, Oklahoma State University, Stillwater, OK 74078, USA
3
School of Forestry and Wildlife Sciences, Auburn University, Auburn, AL 36849, USA
4
Institute for Botany and Landscape Ecology, University Greifswald, 17489 Greifswald, Germany
*
Author to whom correspondence should be addressed.
Earth 2021, 2(4), 826-844; https://doi.org/10.3390/earth2040049
Submission received: 31 August 2021 / Revised: 15 October 2021 / Accepted: 21 October 2021 / Published: 3 November 2021

Abstract

:
Sal (Shorea robusta) forests, a dominant forest type in Nepal, experience different disturbance intensities depending on management regimes. This study compares the impact of disturbance on Nepalese Sal forests, which are managed on three major management regimes: protected area, state-managed forest, and buffer zone community forest. Using a systematic sampling approach, we sampled 20 plots, each covering 500 square meters, and nested plots within each main plot to measure pole and regeneration for each management regime. We recorded forest characteristics including tree species, counts, diameter, height, crown cover, and disturbance indicators. We compared forest attributes such as diversity indices, species richness, and stand structure by management regime using analysis of variance and regression analysis. The forest management regimes were classified into three disturbance levels based on disturbance factor bundles, and the buffer zone community forest was found to have the highest disturbance while the protected forest had the lowest disturbance. Species richness, diversity, evenness, abundance, density and basal area were higher, but regeneration was lower in protected area and state-managed forest compared to the buffer zone community forests. This suggests positive impacts of moderate disturbance on regeneration. The management plan should prioritize the minimization of excessive disturbance to balance forest conservation and provide forest resources to local users.

1. Introduction

Forest disturbances are events that change the structure and composition of the forest ecosystems, their functions, and resources availability in the ecosystems [1]. Disturbances, both natural and anthropogenic in origin, vary in frequency and intensity in a changing ecosystem [2]. They are ecosystem processes that help to maintain the supply of ecosystem services and conservation of plant and wildlife populations [3]. In particular, they play an important role in maintaining plant diversity, influencing stand structure, and impacting regeneration of forest ecosystems [1,4,5,6]. Furthermore, they regulate forest dynamics and tree diversity at the local and regional scale [7,8].
Structure, composition, and function are the three important attributes of forest ecosystems [9]. Forest disturbance has a strong influence on plant structure and animal communities in many natural ecosystems [10,11]. The ecological characteristics of a forest largely depend on sites, species diversity, and regeneration status of different species [12]. As the frequency and intensity of disturbances increase, plant diversity and other associated vegetation attributes decrease [4,13]. Changes in structural attributes of forests have often been attributed to disturbance gradients [8] involving mostly a single factor that is limited in extent, e.g., selective logging [7,14,15]. Similarly, it has also been argued that species richness and diversity are invariably affected by frequent and fluctuating disturbances of low-intensity e.g., grazing and browsing, firewood and fodder extraction suggesting the importance of combined effect of multiple low-intensity factors [1,5,13].
Disturbance can have positive and negative impacts on forest by altering the environmental condition [4]. Disturbance has a positive influence on diversity, as an intermediate level of disturbance increases forest diversity [15,16]. However, too much disturbance leads to the loss of late successional species, whereas too little leads to the exclusion of species adapted to colonize ecosystems immediately after disturbance [16]. Furthermore, Connell (1978) [17] noticed in tropical rain forests that the higher tree diversity occurs either at intermediate stage after large disturbances or with smaller disturbances that are neither frequent nor infrequent. In addition, an intermediate disturbance supports community co-existence [16,18].
In Nepal, large-scale catastrophic natural disturbances due to hurricanes or tornadoes do not occur, but disturbances due to flooding, river scouring, or landslides are common. The major portion of energy comes directly from forests in the country, with forest-based woody biomass consisting of 70% of total energy consumption [19]. Most of the Nepalese forests turned to open access after the nationalization of all forests in 1957, resulting in higher deforestation rates on the national level [20]. With more than two-thirds of the population living in rural areas, high dependence of rural people on forest resources leads to an anthropogenic disturbance, such as tree harvesting, fire, grazing and non-timber forest product collection. In addition, bush cutting, sapling cutting, lopping and forest fire are also common. Although forest disturbance is the highest in the Churia region, the disturbance due to tree cutting and lopping is a major concern in Terai forest [21]. Historically, forest area covered almost 75% of the Terai region in central and western Nepal [22,23]. With the establishment of democracy and the eradication of malaria in the 1950s, the government launched the resettlement program in the lower belt of Nepal, which therefore triggered the deforestation and forest degradation in this region. The forest area in the region is continuously decreasing, with an annual deforestation rate of 0.44% between 2001 and 2010 [24].
Sal (Shorea robusta) is one of the most important tree species with economic and cultural importance in the country [25]. The species is used for multiple purposes including timber, wood for tools and furniture, carvings for historical, religious and architectural structures, utensils, firewood, plates, bowls, gum, green manure, medicines, resin, and fodder. Thus, Sal forests are subjected to extensive logging, grazing, and logging. The higher population growth has resulted in heavy pressure on the forest resources of the region as livelihoods and economic well-being are closely linked to forest resources [24]. Illicit felling of commercially valuable trees such as Sal and the trans-boundary timber trade are major problems in the Terai region [26]. In addition, the length of monsoon, total rainfall, seasonal flooding and soil conditions have been considered as factors that are modifying vegetation composition and succession in these forests [27]. Sal forests are one of the most disturbed forest types in the whole South Asia region [15].
Given the immense pressure from decade-long frequent and fluctuating anthropogenic disturbances and the high conservation value as wildlife habitat and biological corridor in Terai [23], the Sal forests need immediate management attentions. They are managed in different regimes, depending on management objectives and location of forests with respective to distance from human inhabitants. These forests are commonly managed as protected forests, participatory managed forests (such as community forests, buffer zone community forests, leasehold forests, and collaborative forests), and state-managed forests. While the major aim of the protected forests is biodiversity conservation, participatory managed forests are focused on supplying forest products for local demand. The state-managed forests are managed by government, under the Department of Forests, to protect forests from illegal logging and harvesting. Similar to participatory forests, they are also susceptible to human disturbances due to lower restrictions for public use and lack of strict protection. The level of disturbances also varies in these management regimes due to differences in access and rights to use resources. For example, selective felling, which can lead to serious forest degradation, is mostly practiced in community-based and government-owned Sal forests [28].
As Sal forests experience continuous disturbances, understanding of their impacts on diversity, stand structure, and regeneration establishment is essential. A limited number of studies has been published to examine the impact of interactive disturbances on stand dynamics and regeneration of these forests in Nepal [13,15]. Furthermore, there is a study gap to elucidate how the forest attributes can be maintained under the disturbances. In particular, it is important to understand and compare the level of disturbance in the three major management regimes and effect of disturbance on forest attributes because identifying the disturbance effects help formulating management plans to balance forest protection along with providing forest products need of the local people. Therefore, the main objective of this study was to assess the disturbance level in three different forest management regimes and compare the effect of disturbance in tree species diversity, composition, and regeneration in Nepalese Sal forests. The specific objectives were to elucidate the forest management regimes and level of disturbance for each regime, assess status of species diversity, species richness, and stand structure in each management regime, and assess effect of regeneration due to disturbance in each management regime.

2. Materials and Methods
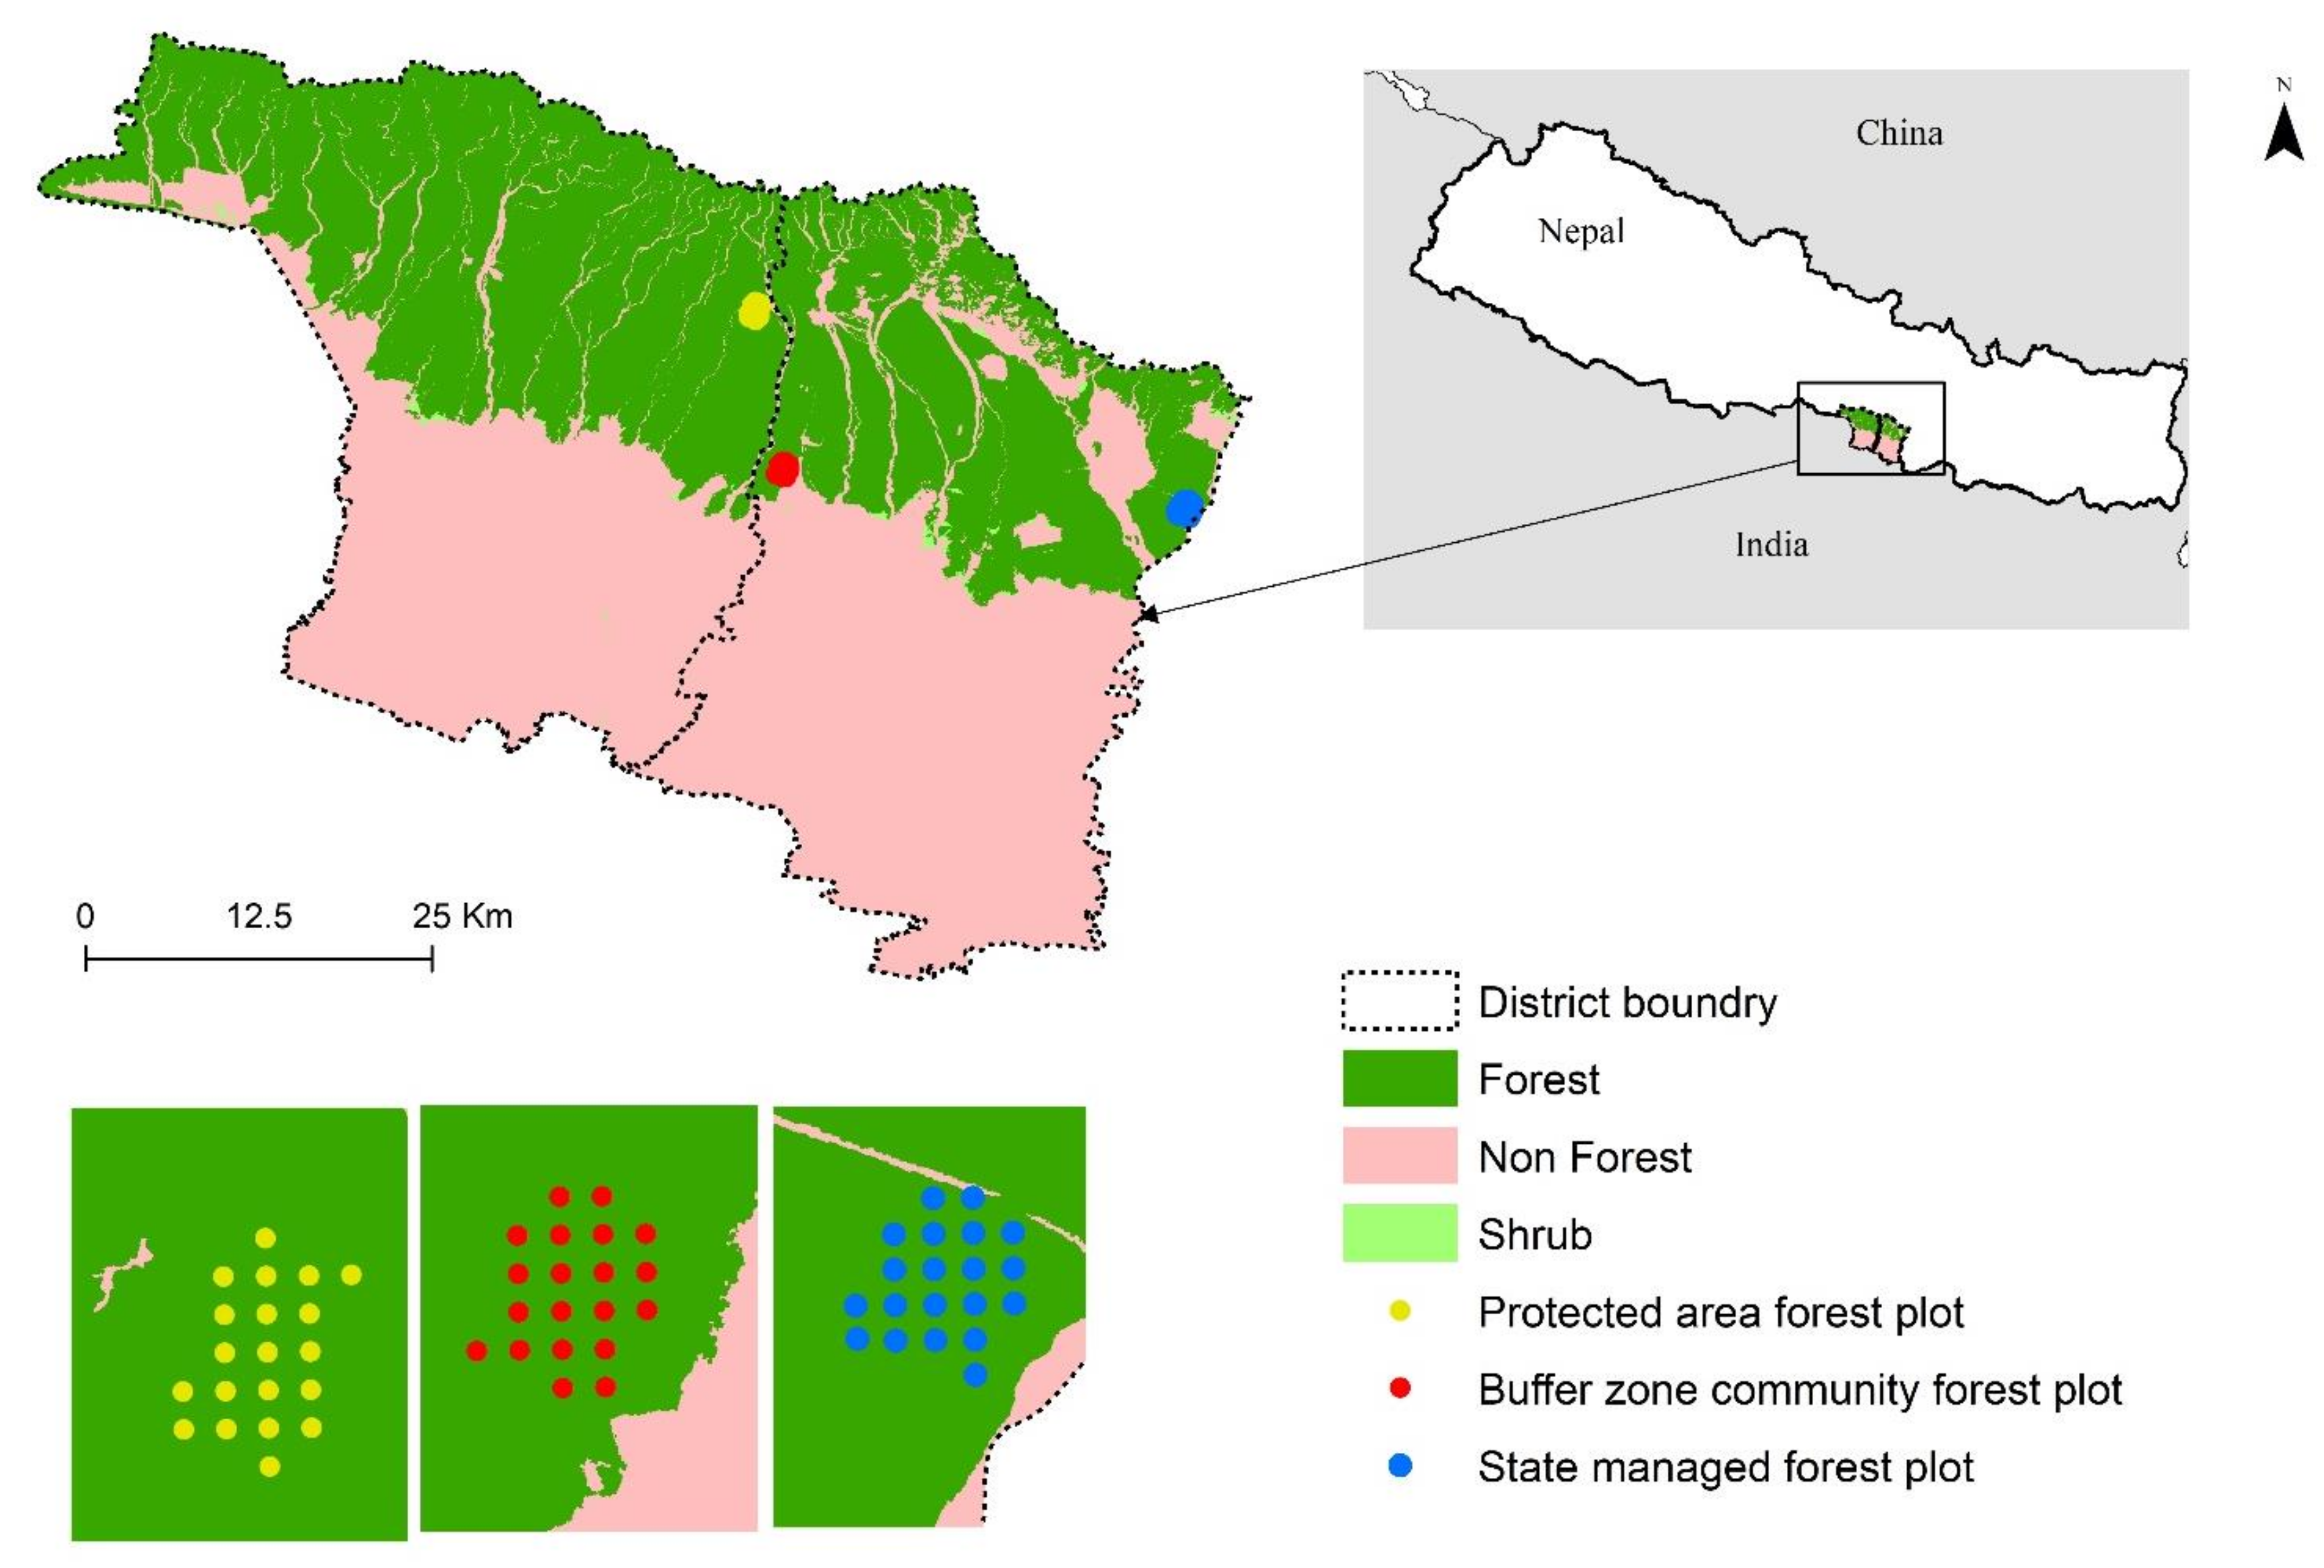
2.1. Study Area

The study area included three forest management regimes, selected as representative regimes of the region, in seasonally dry deciduous Sal forests located in the central lowland of Nepal (Figure 1). The management regimes consisted of buffer zone community forest (BZCF), state-managed forest (SMF), and protected area forest (PAF). The study area was located between 27°24′–27°52′ N and 84°51′–85°16′ E and elevation ranges between 132–146 m above the mean sea level for BZCF and SMF, and 300–320 m for PAF. The study area belongs to the humid sub-tropical climatic zone and has four distinct seasons (i.e., summer, autumn, winter and spring). The mean annual precipitation was above 1000 mm, with precipitation mostly expected between June and September [29].
Among the management regimes, Radhakrishna BZCF was established in 2005 as the flagship participatory forestry management program of the country. The BZCF has an area of 621.56 ha and 7813 users [30]. The users have direct impact on forest resources by means of grazing and fodder for animal husbandry, firewood for cooking, and using leaves of Sal tree for making disposable plates for household and commercial purposes. The management plan of the buffer zone user group allows up to 9600 cubic feet of timber, which is lower than their actual demand of 12,000 cubic feet, which results in illegal harvesting to fulfill their timber demand [30].
Similarly, land tenure is solely under the government without any public involvement in SMF. As management of surroundings forest was handed over to the community and collaborative forest management user groups, there was limited human pressure in SMF from inhabitants living in nearby areas. Compared to the BZCF, this regime lacks active management activities such as thinning, harvesting, bush cutting, planting, and fire management, but it is relatively protected due to regular patrolling by forest officials and less human pressure [31]. However, illegal harvesting of tree, in particular, valuable species such as Sal, and natural disturbances such as wind-thrown, stag-headed and pests, have been reported. The PAF selected for this study was inside the Parsa National Park, which is protected and managed by the Government of Nepal since 1984. As a strictly protected area, it represents the management regime with the least disturbance. Overall, the selected management regimes differ in many aspects, including rights to access, use of resources, right to govern, sell product, and management objectives (Table 1) [31].

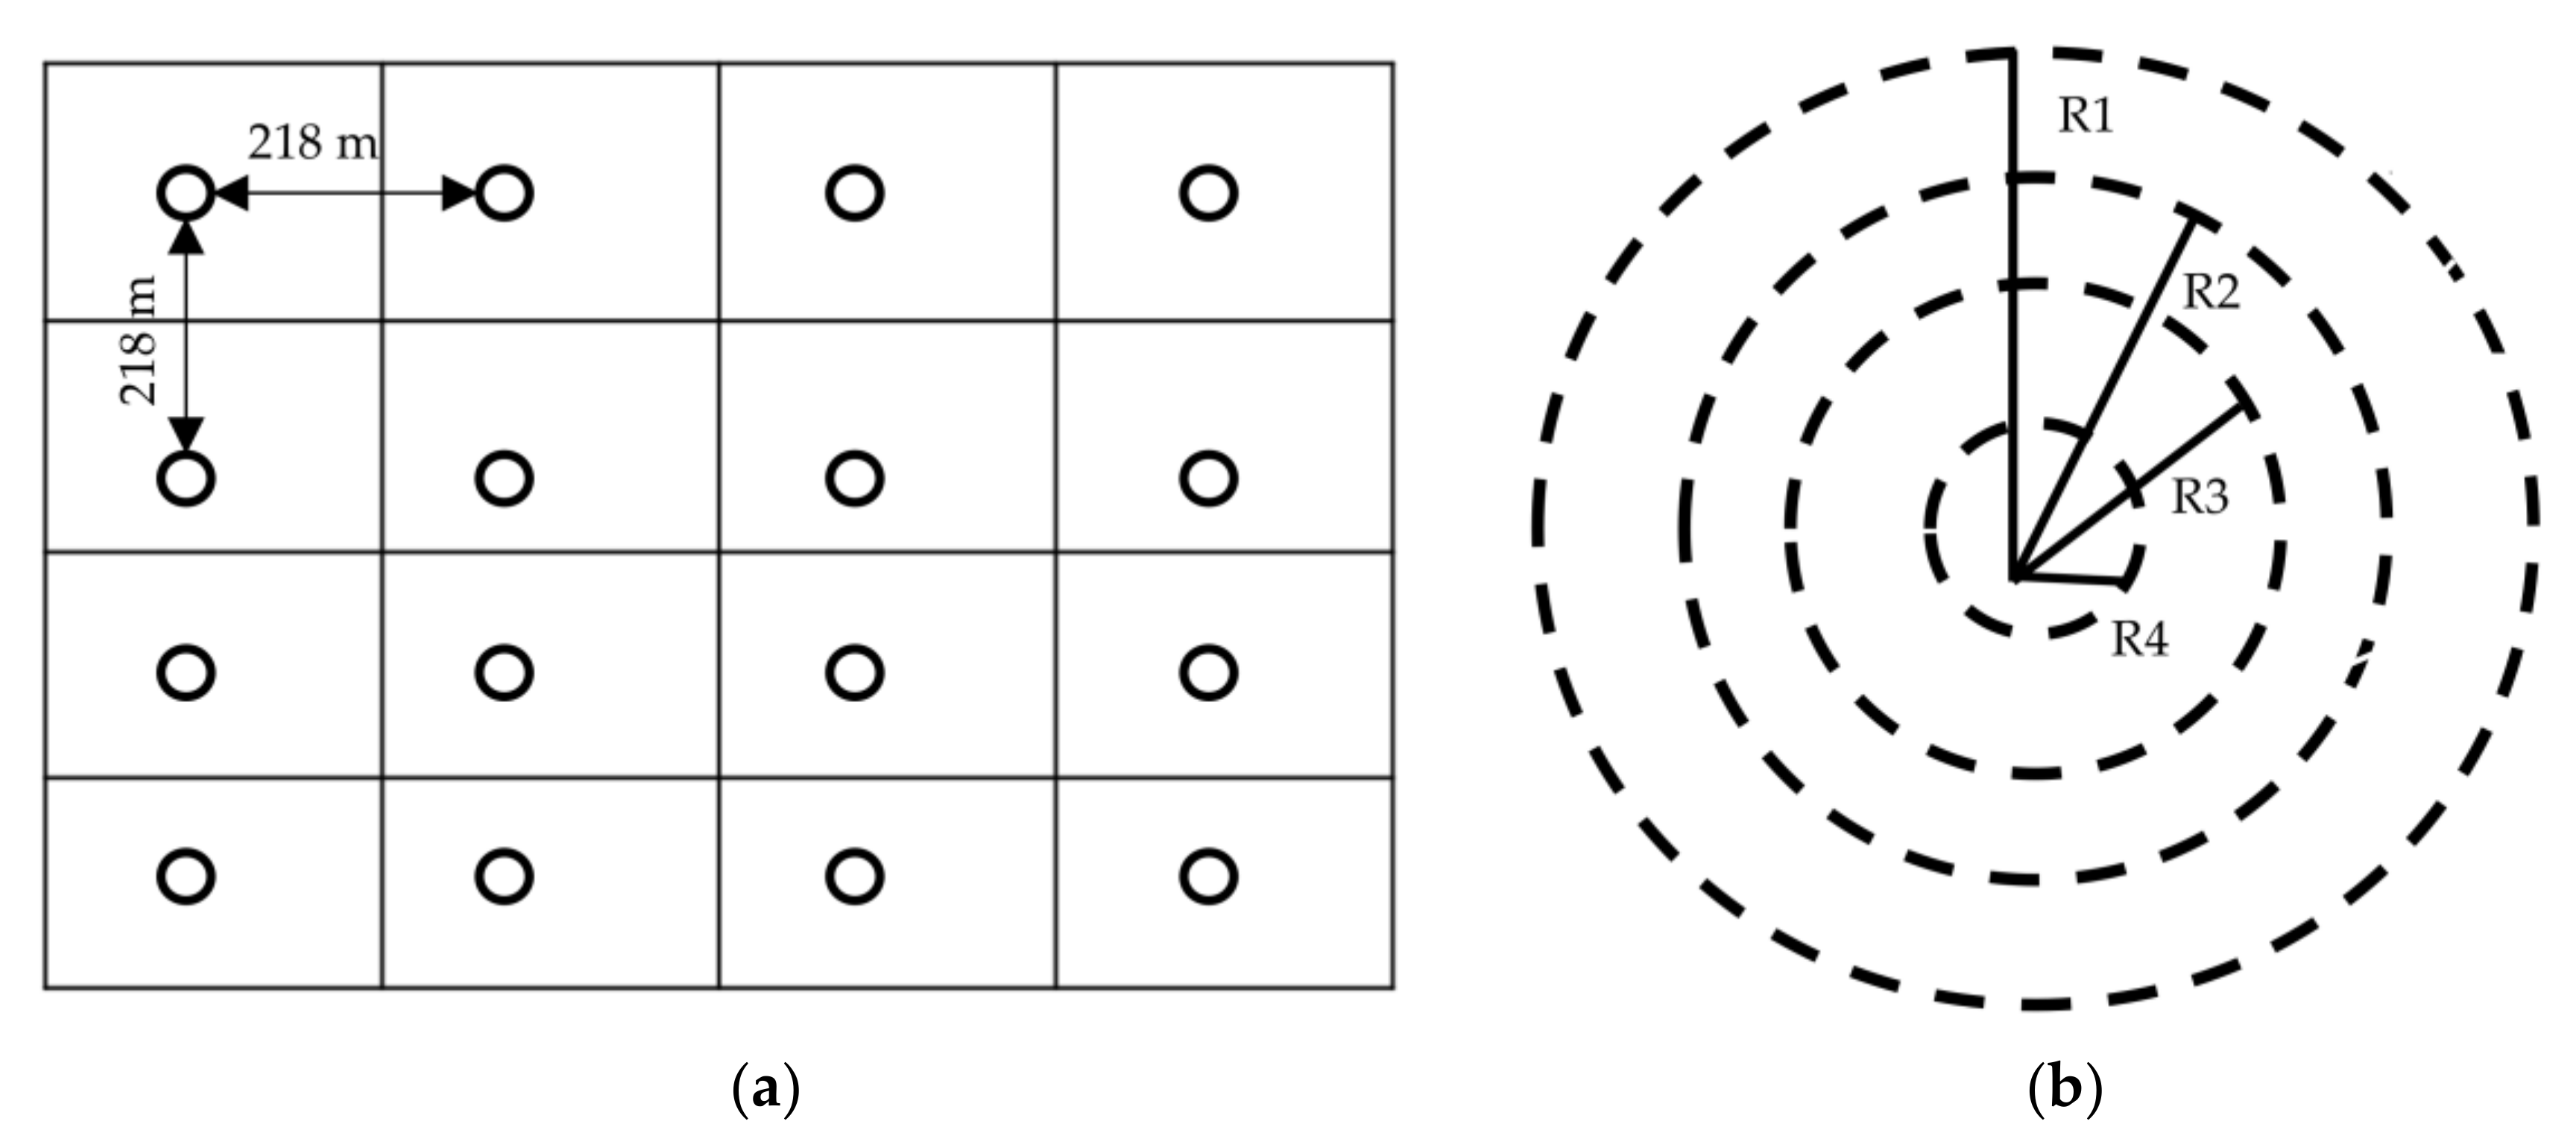
2.2. Sampling and Inventory

The field survey was conducted in Summer 2018. The sampling areas representing the three management regimes were selected using satellite images, google earth images, and field observations. Before the inventory, the major disturbances, their frequency, and intensity were outlined through consultation with local residents, key informants, user group committee members, and park and forest management officials. In each management regime, a total sampling area of 100 hectares was established. This sampling area was further divided into a regular grid of 20 plots (i.e., 500 m2 area for each plot) (Figure 2). Diameter at breast height (DBH) of trees>30 cm were measured in 12.61 m radius circular plot. Number of stems for smaller trees and DBH of poles were measured in nested plot design with the following characteristics: a radius of 5.65 m (100 m2 area) was used for poles (DBH = 5–29.9 cm), a radius of 2.82 m (25 m2 area) for saplings (DBH = 1.3–4.99 cm), and radius of 1.78 m (10 m2 area) for seedlings (DBH < 1.3 cm). Similarly, crown cover was determined by estimating the area of ground covered by tree canopies using a spherical densiometer for each plot. The densiometer was used to measure the horizontal projection of the tree crowns covering the area of the plot. The crown cover was measured at five points in a plot, i.e., four directions (north, south, east, and west) and at the center of the plot. The number of stems per ha for Sal and other species were computed by DBH classes with each class being 10 cm. The physical and chemical properties of the soil were also evaluated. The soil samples were collected from three different spots (plots for trees, poles, and regeneration) for each sample plot. The collected samples were subjected to drying for a week and were dried at 105 °C and allowed to cool at room temperature. The cooled samples were crushed and sieved; samples of 2 and 0.5 mm were collected in different bins. The 2 mm samples were used to analyze pH, using potentiometric methods and the 0.5 mm samples were used for measuring chemical properties such as nitrogen (N), potassium (K), and phosphorus (P) using Kjeldhal distillation method, ammonium acetate method, and Olsen’s method, respectively.

2.3. Assessment of Disturbances

Different disturbance indicators to represent past and present disturbance were recorded in each plot. Since there is not a commonly accepted approach to estimate disturbance intensity [30], we used visual inspection of the bark, stem and leaf, stump freshness and color, termite mounds and cracks to categorize disturbance. Furthermore, both common and fluctuating forest disturbances including wind-thrown, harvesting, cutting, lopping, breakage, browsing, uprooting, bark scratching, damage associated with crown openness, clearance of footpaths and cart trails, animal feces and soil disturbed by several animal activities (e.g., wallowing, rooting, and digging etc.), and their severity were observed and recorded. Potential disturbances from fire were not considered because major fire incidents were not recently reported in the study area.
We followed different approaches to measure disturbance parameters: (a) crown openness was recorded using a densiometer, (b) wildlife disturbances were recorded by counting number of spots disturbed by wallowing, rooting, debarking or digging, (c) presence of animal feces, and (d) footpaths and trails were measured using a linear tape.

2.4. Data Analysis

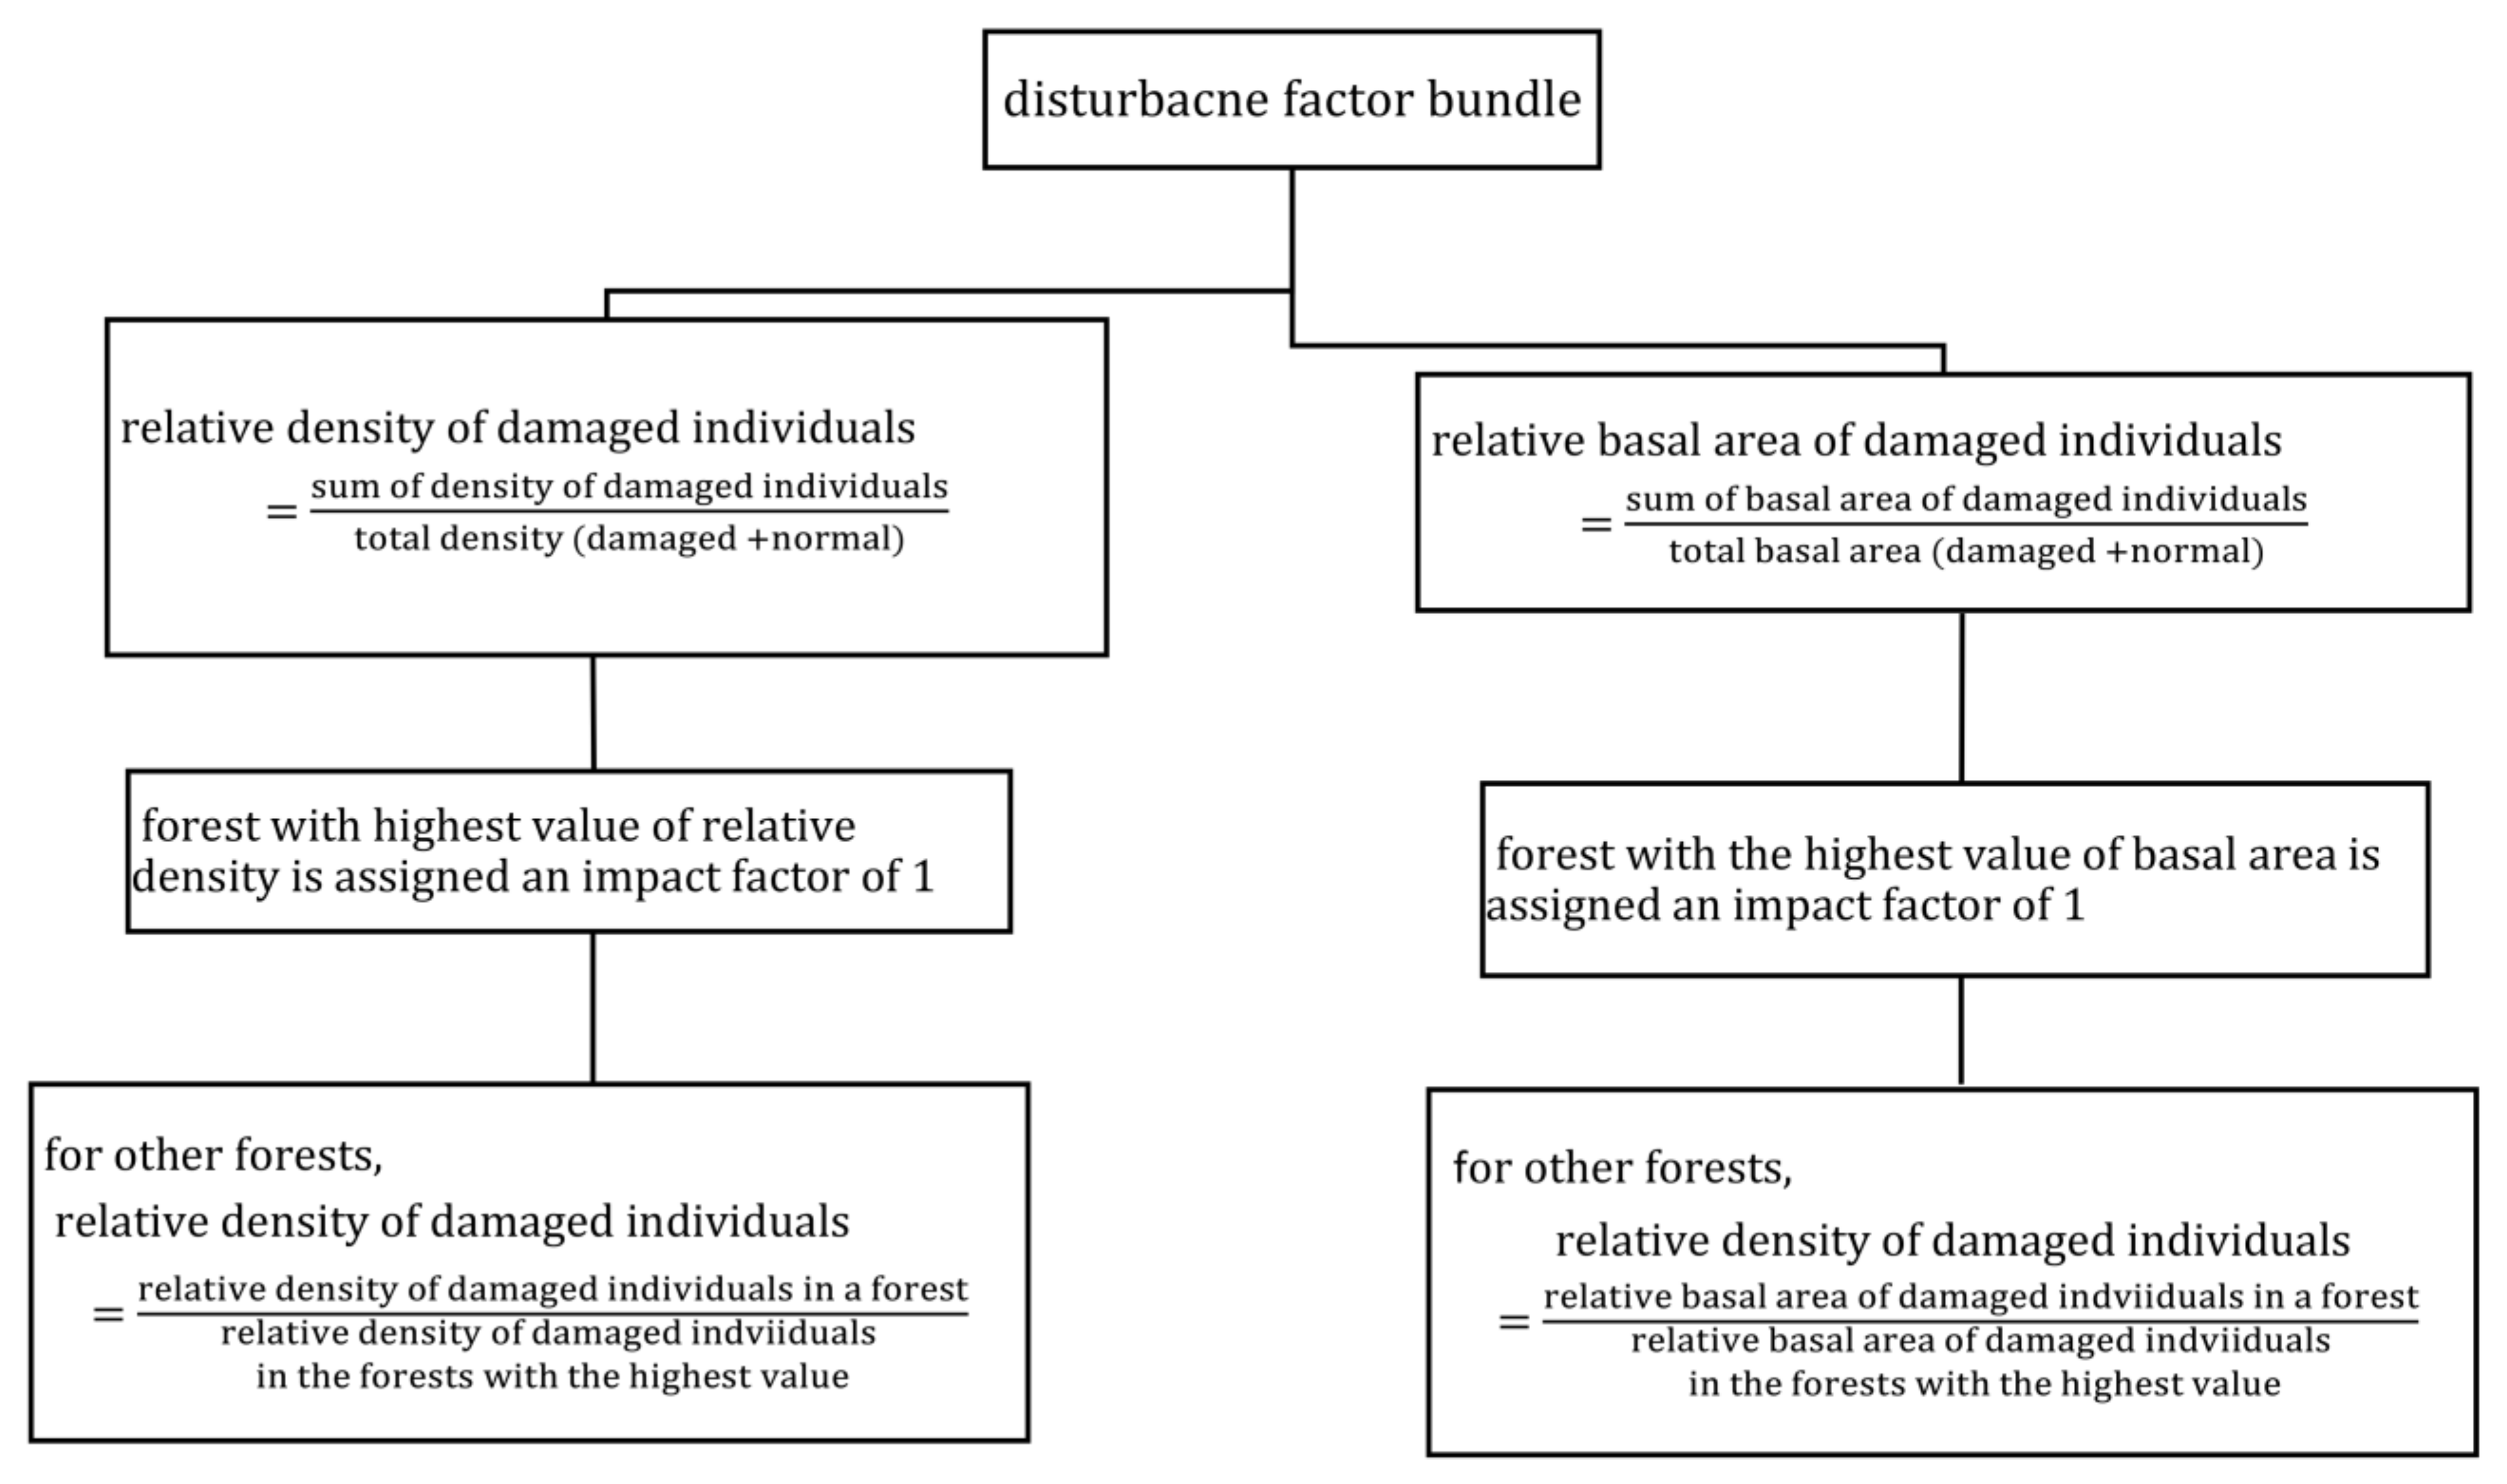
2.4.1. Disturbance Factor Estimation

Many studies ranked disturbance intensity subjectively [32,33,34,35] because there are no universally agreed methods to estimate disturbance intensity [36]. To estimate disturbance factors bundle, disturbance factor value was calculated first, and then relative impact factor was assigned for each disturbance indicator (such as frequency of disturbed individual, pest or climber, grazing or grass cutting area) for each management regime (Figure 3). Using the protocol used in previous studies [1,13], disturbance factor value was based on relative density and basal area of the damaged individuals (seedling, sapling, poles, and trees). Therefore, the relative density of damaged individuals was a ratio of sum of the density of damaged individuals and density of total individuals. Similarly, relative basal area of damaged individuals was a ratio of sum of basal area of damaged individuals and basal area of total individuals. The use of the formula for density or basal area was based on data recorded in the field as density for pest/climber frequency and basal area for stump felled area. For each disturbance indicator, the forest regime with the highest value of relative density or basal area was assigned a relative impact factor one.
For the other remaining two management regimes, the relative impact factor for density was calculated as a ratio of relative density of damaged individuals and relative density of damaged individuals in the forest with the highest density. Similarly, the relative impact factor for basal area was calculated as a ratio of basal area of damaged individuals and basal area of damaged individuals in the forest with the highest density. The relative impact factor for all disturbance types in each forest type were accumulated to estimate values of the disturbance bundles. Finally, forests were classified into three disturbance levels: low, moderate, and high based on the values of disturbance bundles.
For plot level disturbance factors, the plot with the highest value of relative disturbance among all the forests was assigned an impact factor of 1 for each disturbance indicator, and proportional values to the other plots were identified in the process described above. All elements of the present and past disturbances were weighed equally because of the absence of studies on the comparative impacts of those disturbances. Plot level disturbance bundles were also calculated by adding all relative disturbances indices associated with the individual plots. One-way ANOVA was performed to observe the differences on the plot level disturbances among the three disturbance levels.

2.4.2. Species Richness

Species richness was calculated to study the relationships between disturbance and species diversity for management regimes and size classes. Furthermore, unique species, i.e., species only found in a particular disturbance level and species with single individuals for each level were estimated. Similarly, the overlapping species in different disturbance levels were calculated.

2.4.3. Biodiversity Indices

We used four diversity indices per plot: Jaccard similarity index, Shannon–Wiener index, Simpson index, and the Pielou’s evenness. The Jaccard similarity index [37] was measured to find out the species overlapping, similarity, and contrarily dissimilarity between different disturbance levels. Similarly, Shannon–Wiener diversity index [38] was calculated to measure the species diversity and community composition in different disturbance levels. The species richness and evenness of the community increase when this index increases.
The concentration of dominance is often used to quantify the biodiversity of a habitat. It considers the number of species present and the abundance of each species. Simpson’s index was used to measure the concentration of dominance (CD) using the proportion of all individuals in the sample that belongs to a species [39]. The CD index is an indirect measure of diversity and weighted toward the abundance of the most common species. Numerically, the values are between 0 and 1 with values near 0 corresponding to highly diverse or heterogeneous community, and values near 1 correspond to the more homogeneous community. Equitability or evenness index (E) refers to the degree of relative dominance of each species. Shannon–Wiener’s diversity index of a disturbance level and number of species found in the level is used to calculate the evenness index [40]. The value of e ranges from 0 (not even) to 1 (completely even). Furthermore, diversity indices per plot were subjected to one-way ANOVA in accordance with disturbance level. Similarly, Tukey’s multiple comparison test was used to compare the mean difference at 5% of significance level.

2.4.4. Species Dominance

Species dominance in each disturbance level was identified based on the importance value index (IVI). The species having highest importance value was identified as dominant, and that having the second highest importance value was defined as co-dominant species. To calculate this index, the percentage values of the relative frequency, relative density and relative dominance were summed up together and total value was designated as IVI of the species. Following Mishra [41] and Curtis and McIntosh [42], the relative values of frequency, density and basal area for each species in different size classes were used to calculate the IVI in disturbance levels. The IVI for tree, pole, and sapling was the sum of relative density, relative frequency, and relative basal area while IVI for seedling was the sum of relative density and relative frequency.
The effect of disturbance on sapling and seedling of Sal were analyzed by examining their densities per plot. We used vegan [43], and BiodiversityR [44] packages available in R-statistical computing software [45].

3. Results

3.1. Physical and Chemical Properties of Soils

The soil pH was neutral to slightly basic (6.50–8.47). The soil nitrogen (N) varied from 0.90% to 0.18% per kg, the phosphorus (P) ranged from 16.18 to 78.76 kg/ha, and potassium (K) ranged from 150.70 to 288.60 kg/ha. There was significant difference in P (F (2, 57) = 18.44, p < 0.001) and K (F (2, 57) = 44.54, p < 0.001) among different forest types (Table 2). Furthermore, pairwise comparison with Tukey’s test revealed significant higher P and K values in PAF compared to the other two forests (p < 0.05). The soil texture was mostly sandy loam and sandy clay in PAF (15 plots) and BZCF (17 plots), but sandy clay loam in SMF (8 plots).

3.2. Disturbance Factor (DF)

We quantified a total of 20 different types of relative disturbance indices based on present and past disturbances in all three forests (Table 3). The highest sum of disturbance indices was found in the BZCF, moderate values were observed in SMF, and lowest values in PAF, suggesting the highest to lowest disturbance in these forest types, respectively.
We found a significant difference in plot level disturbance bundles among different disturbance levels (p < 0.001). Furthermore, pairwise comparison with Tukey’s test revealed a significantly higher disturbance level in BZCF, with mean relative disturbance bundle per plot of 4.504 (±0.459), compared to other forest types (p < 0.05). Mean relative disturbance bundle per plot was 3.09 (±0.313), and 2.27 (±0.384), respectively for SMF and PAF, but the bundle between these two forest types was not significantly different.

3.3. Species Richness and Diversity

A total of 38 tree species were recorded representing 21 families in all three forest types. With 33 species, the highest number was recorded in SMF, followed by 30 species in PAF and 16 species in BZCF (Table 4). The highest species richness was observed in moderately disturbed forest and lowest in highly disturbed forest. Thirteen species were found in all forest types. Similarly, the common species shared by PAF and SMF was the highest while the lowest species was shared by PAF and BZCF. The PAF and SMF represented more than 85% of species recorded in all disturbance levels. The Jaccard Index of similarity shows highest similarity between PAF and SMF, but the lowest similarity between PAF and BZCF.
The SMF had the highest species count for tree, pole and seedling, and PAF had the highest for the sapling (Table 5). In contrast, BZCF experienced the lowest species count for all size classes in comparison to other disturbance levels. We found a significant difference in mean species richness in plot level for tree among the disturbance levels (F (2, 57) = 6.95, p < 0.001). Furthermore, pairwise comparison with Tukey’s test revealed that SMF had significant higher species richness compared to PAF and BZCF (p < 0.05). Similarly, mean species richness for pole was significantly different among the disturbance level (F (2, 57) = 4.23, p = 0.019), and PAF had significant higher species richness than BZCF (p < 0.05) for pole size class. We did not find a difference in species richness for sapling, but there was significant difference in seedlings between the disturbance levels (F (2, 57) = 4.86, p = 0.011). In particularly, SMF forest had a significantly higher richness value of regeneration compared to BZCF (p < 0.05).
Different biodiversity indices were estimated for plot level data. Shannon–Wiener index (F (2, 57) = 7.90, p < 0.001), Simpson’ index of dominance (F (2, 57) = 10.17, p < 0.0001) and abundance (F (2, 57) = 8.94, p < 0.001) were significantly different for tree size class among the disturbance categories. Furthermore, pairwise comparison with Tukey’s test revealed that SMF had a significantly higher Shannon–Wiener index value compared to PAF and BZCF (p < 0.05), and higher concentration of dominance i.e., Simpson’ index in PAF compared to SMF and BZCF (p < 0.05) and higher abundance in PAF compared to BZCF (p < 0.05). Similarly, Shannon–Wiener index was significantly different for pole among the disturbance categories (F (2, 57) = 3.74, p = 0.029) and PAF had a significantly higher value compared to BZCF (p < 0.05). In general, Shannon’s diversity, Pielou’s evenness and abundance were higher in PAF and SMF within the plot level, but the abundance of seedling was highest in BZCF. In contrast, Simpson’s index was lowest in SMF in all size classes except for pole in PAF.

3.4. Stand Structure

Density of individual size class revealed that the PAF had the highest density for tree, pole, and sapling, while highest seedling density was observed in BZCF (Table 6). Seedling accounted for the highest percentage of stem density across all management regimes. Similarly, the tree density was lowest followed by pole in all management regimes; with less than 1% and 3% tree and pole density of total density, respectively. The percentage of sapling was highest in PAF and about the same in BZCF and SMF. Total basal area per ha was higher in PAF for pole and sapling compared to other two disturbance categories. Overall, PAF had the highest BA of all size classes and BZCF had the lowest. The BA of tree size in PAF and SMF were almost double than in the BZCF. The maximum diameter of trees in PAF and SMF did not exceed 95 cm, whereas it exceeded 100 cm in BZCF. The abundance of trees in higher diameter class increased with decreasing disturbance level.
Tree density above 1.3 cm DBH, varied from 2870 to 4013 stems/ha and basal area from 25.49 to 39.47 m2/ha among the management regimes (Table 5). Density was highest in PAF forest and lowest in BZCF. We found that there was a significant difference in mean density among management regimes (F (2, 57) = 3.61, p = 0.0332). Furthermore, pairwise comparison with Tukey’s test revealed that the difference was limited only between PAF and BZCF (p < 0.05). Similarly, we found that SMF forest had the highest BA for stems above 1.3 cm. There was also a significant difference in mean basal area among management regimes (F (2, 57) = 10.79, p = 0.0001). Furthermore, pairwise comparison with Tukey’s test shows that PAF and SMF were significantly higher compared to BZCF (p < 0.05).

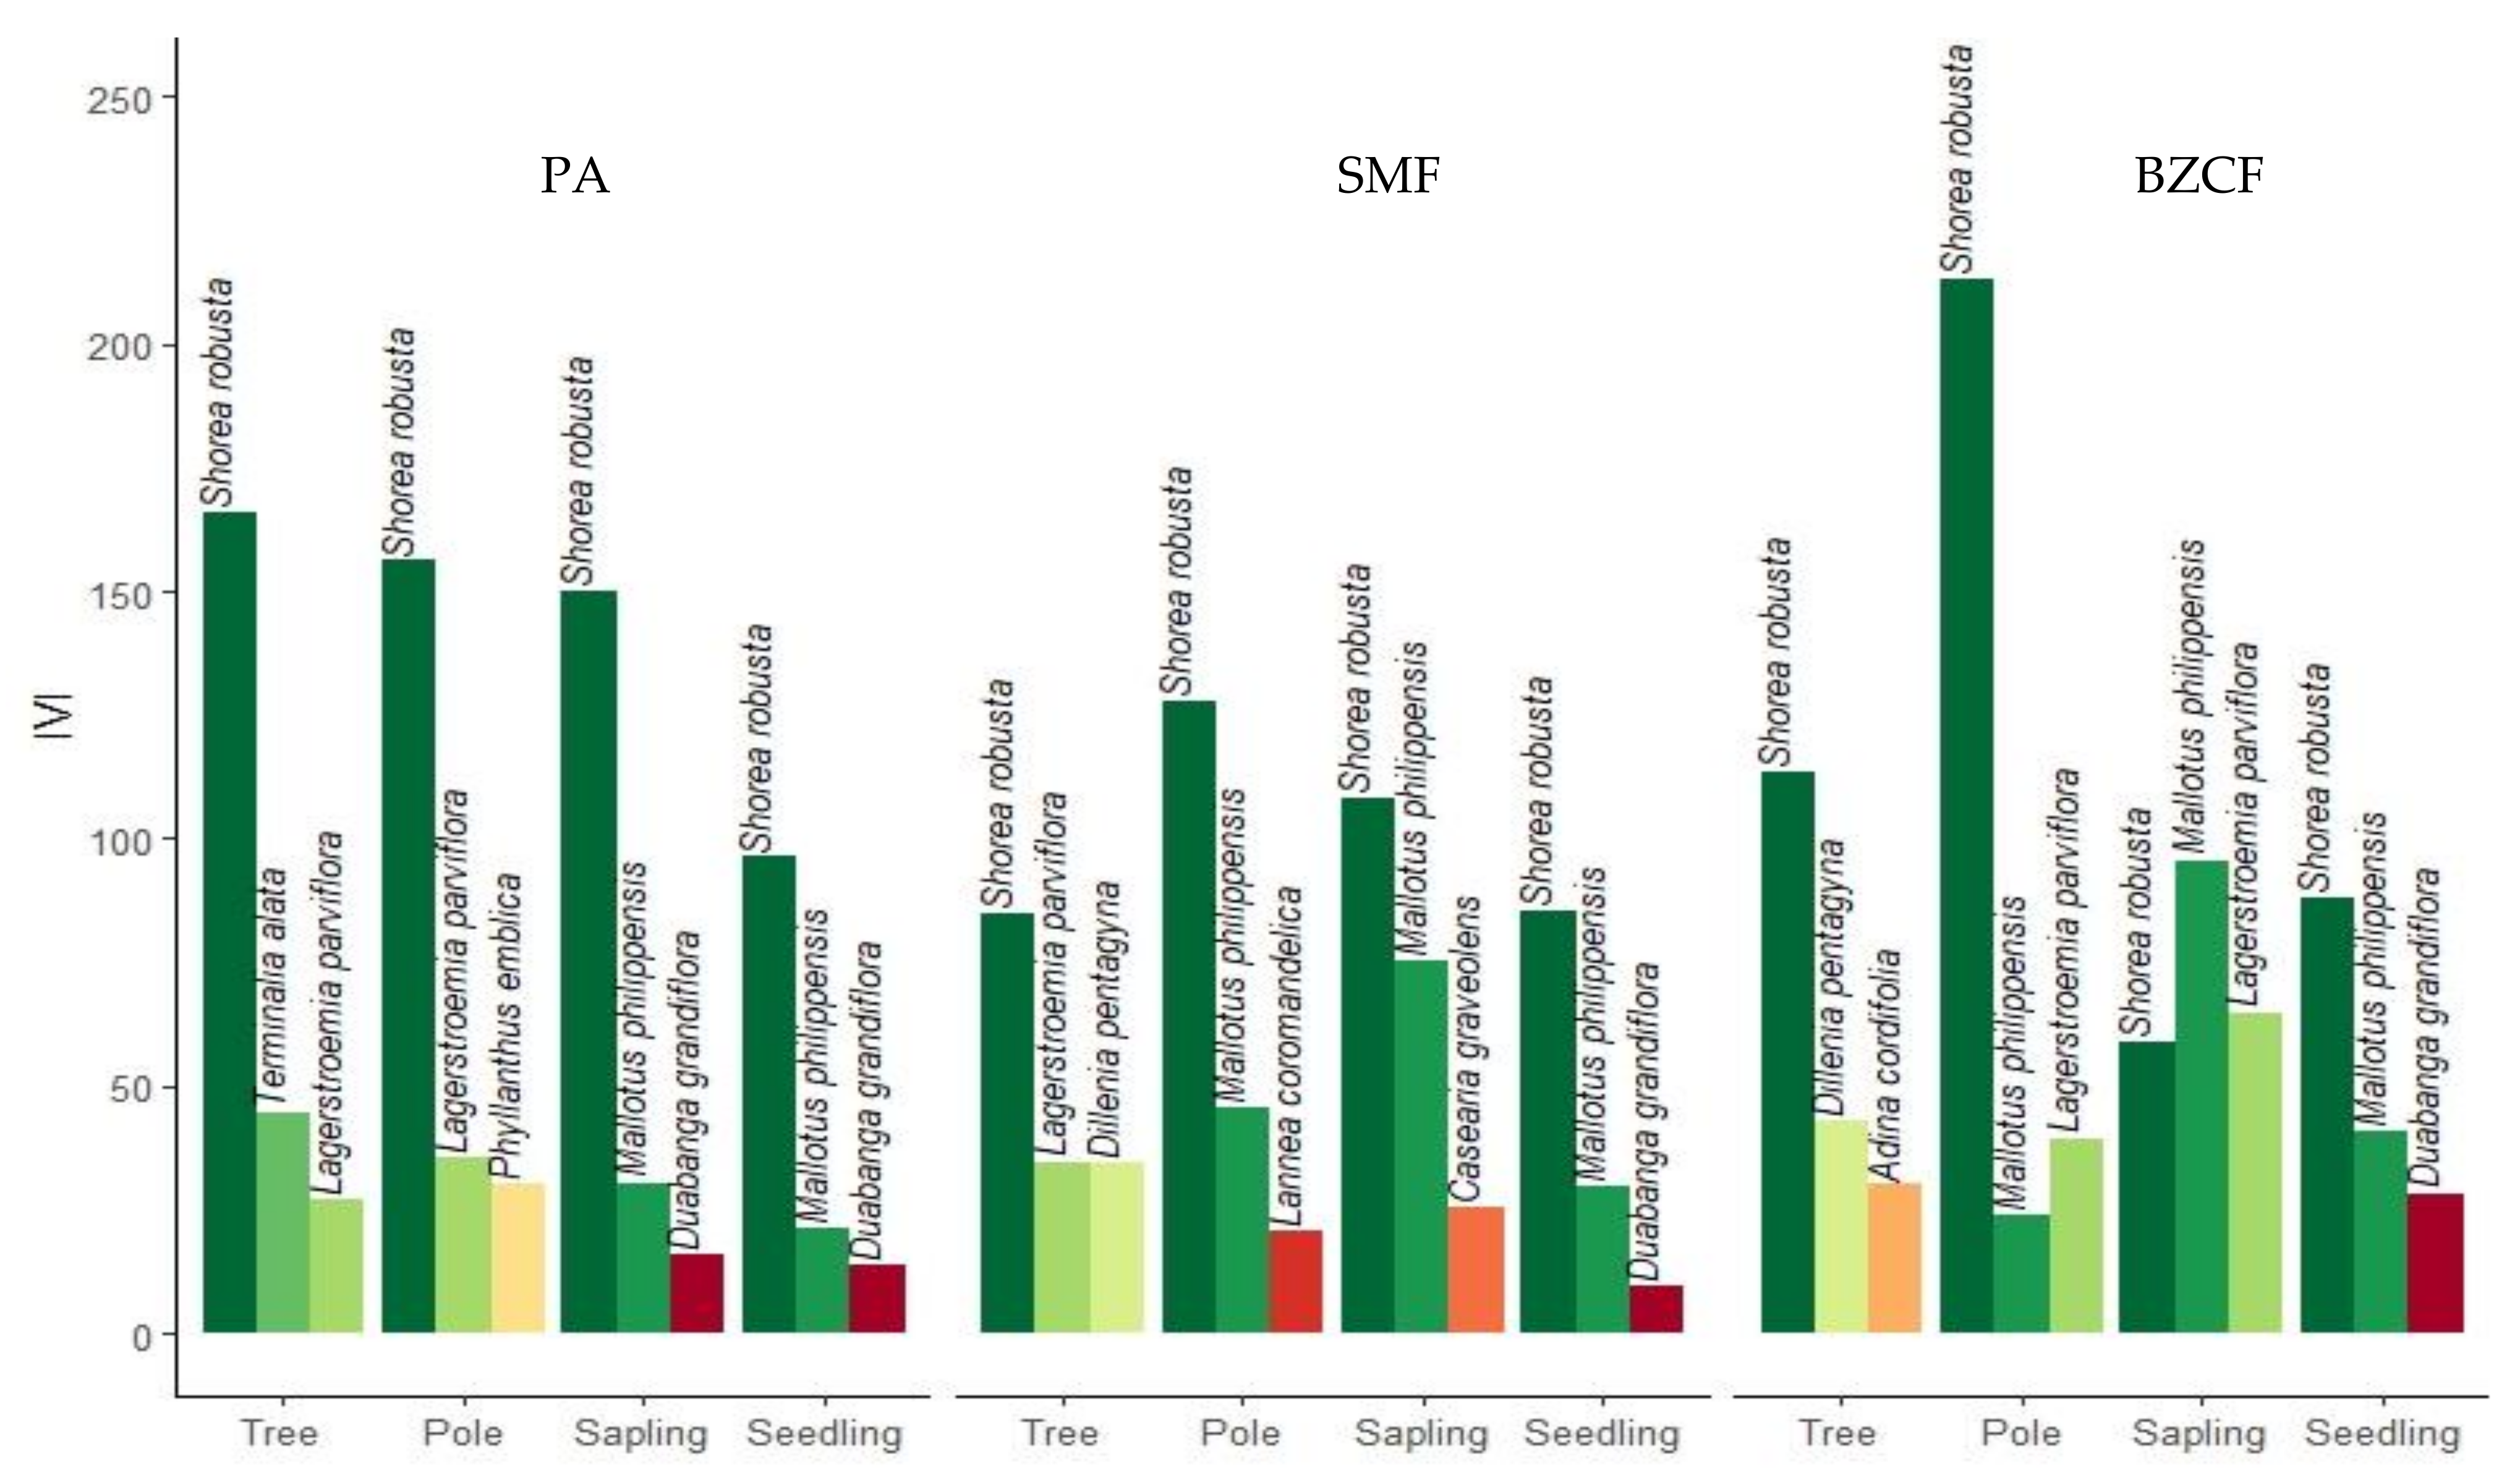
3.5. Dominance of the Species

Shorea robusta was the most dominant species across all disturbance regimes in all size classes except the sapling class in the BZCF (Figure 4). Only the top three dominant species on each class are reported in the figure. In tree size class, the second most dominant species was Terminalia alata in the PAF and Dillenia pentagyna in SMF and BZCF, respectively. For pole size, the second most dominant species was Lagerstroemia parviflora in PAF and BZCF, but Dillenia pentagyna in SMF.
For sapling, Mallotus philippensis was the most dominant species in BZCF followed by Lagerstroemia parviflora and Shorea robust. Shorea robusta was the most dominant species in PAF and SMF followed by Mallotus philippensis. For seedling, the second most dominant species was Mallotus philippensis across all disturbance regimes. The IVI gives a total picture of the social structure of species in a community and can be used to form an association of dominant species [46]. Sal is dominant in all size classes, except in sapling of BZCF forest. The extent of Sal dominance differed considerably among the forests. PAF had the highest IVI of the Sal compared to other disturbance regimes in all but pole size classin BZCF.

3.6. Status of Regeneration

In the sapling class, we found a total of 15, 12 and 10 distinct species in PAF, SMF and BZCF, respectively (Figure 5). Sal was the most dominant sapling species, which comprised 62.13% and 42.37% of sapling counts in PAF and SMF disturbance regimes, respectively. Meanwhile, in BZCF regime, Sal contributed only 18.12% of total sapling counts. It can be noticed that the highly disturbed regime was mostly inhabited by undesirable species. Regeneration was examined separately. A total of 17, 20 and 8 species were recorded in PAF, SMF, and BZCF, respectively. Sal was the most dominant regeneration species in all disturbance regimes; it accounted for 66.92%, 60.50%, and 57.97% of all regeneration in PAF, SMF, and BZCF, respectively.

3.7. Disturbance Bundles

We examined how disturbance impacts Sal ingrowth by calculating disturbance bundle as a proxy index to estimate disturbance on each plot across all regimes. We found a negative relation between Sal’s sapling density and disturbance bundle; with increasing disturbance, we found less sapling counts (b0 = 1919.3, b1 = −216.7, R2 = 0.1098, adj. R2 = 0.09446, p < 0.009). We also found negative relation between Sal’s regeneration and disturbance; however, the relationship was not significant (b0 = 13503.9 b1 = −134.6, R2 = 0.001457, adj. R2 = −0.01567, p = 0.7654). Sal had the highest sapling count compared to all other species in PAF (62.13%) and SMF (42.37%) but was only third highest in BZCF (18.12%). In contrast, Sal regeneration accounted for the highest in number compared to all other species regeneration in PAF (66.92%), SMF (60.50%) and BZCF (57.97%).

4. Discussion

We examined three different forest management regimes, namely, PAF, SMF and BZCF, and categorized them into three levels based on respective disturbance bundles. These are most common forest management modalities in Nepal [47,48]. The difference in disturbance levels was a result of variation in management modalities ranging from complete exclusion of public use in PAF with zero anthropogenic disturbances, to moderate level of use in SMF, and to intensively use by the local communities in BZCF. The PAF is strictly restricted for public use, except for scientific study purpose, and the forests are well protected with protection responsibilities enforced by Nepal Army [49], and they have a mild level of disturbances from natural factors such as wildlife and wind. Due to the restriction of use in the protected area, tremendous pressure from the neighboring village is directed toward the nearest buffer zone community forests. Furthermore, BZCF also provides extended habitat to the wildlife of nearby PAF. The moderate disturbance in SMF may be the reflection of limited use of the resources (removal of dead trees only) by the authorities and limited public pressure from the nearby villagers.

4.1. Soil Properties

In general, Sal forests prefer acidic soils [4,15,50], but the chemical properties of the study area showed neutral to basic soils types. We found the highest value of N, P, and K in the least disturbed forest, which is consistent with Sapkota et al. (2009) [15]. The soil pH, and primary nutrients greatly influence the growth of Sal and other major associate species in Sal forests [51]. The forests under this study were growing on the alluvial plain, which consists of well-drained loamy soils belonging to Inceptisols and Alfisols [52].

4.2. Species Richness, Diversity, and Stand Structure

Our study showed that species richness and unique species were lowest in the highly disturbed forest. Species richness was high in SMF followed by PAF while unique species was highest in PAF followed by SMF. Reinhardt and Nagel (2017) [53] found that management practice had a significant impact on species richness, with lower species count observed in disturbed sites. Furthermore, human disturbances can result in fragmentation of natural habitats, which leads to the dropping of species richness, and various factors can cause loss of species among the disturbance level [54]. Sagar et al. (2003) [1] and Gautam et al. (2016) [4] found a decrease in species number and unique species as disturbance level increases in dry tropical forests and Siwalik hills of India, respectively. Past studies concluded similar findings in Sal forests of Central Nepal, Western Nepal, Bangladesh, Northern India, tropical semi-evergreen forests in north-east India, wet evergreen forest of eastern India, and Myanmar [13,23,26,35,36,55,56]. These studies found fewer tree species in highly disturbed Sal and other forests in comparison to moderate and least disturbed forests. In contrast, Rabha (2014) [57] reported less species richness in undisturbed Sal forests of northeast India and suggested that anthropogenic disturbances may favor arrival and establishment of new species.
The BZCF is managed by local communities with minimal restrictions in resource use (such as lopping, grazing, cutting, extraction of timbers), therefore, it has the highest level of disturbance among three management regimes. The decrease in species richness and presence of few unique species in higher disturbance regime may be due to overexploitation of forest resources by human and grazing effect on regeneration. Sagar et al. (2003) [1] concluded similar reasonings to explain lower species richness and unique species count with increasing disturbance in tropical forest of India. Onaindia et al. (2004) [58] found that grazing pressure often leads to the disappearance of some sensitive woody species especially at the recruitment stage. Furthermore, the presence of large number of species with only one individual in the mildly-disturbed Sal forests compared to other forests might be due to recruitment limitations [13].
The results of diversity indices and abundance showed an uneven effect of disturbance on different size classes. For instance, Shannon diversity and evenness were highest in moderately disturbed forest with inverse trend due to increasing disturbance intensity in bigger size classes. For tree size class, our finding is consistent with Gautam et al. (2016) [4], but different from Peltzer et al. (2000) [59], who found an increasing trend in Shannon diversity and evenness with increasing disturbance level. In contrast, we found the lowest Simpsons index (concentration of dominance) in SMF for tree, sapling and seedling, but lower index was found for pole size class in PAF, which is consistent with Gautam et al. (2016) [4]. Our results suggested that the intense disturbance pushes overstory toward homogeneity.
Similarly, the lowest evenness value at PAF suggests that the forests with lower disturbance would lead to monodominance of the forests excluding the non-competitive species, and highest evenness in SMF reflects the high diversity in a moderate disturbance level. However, there was less evenness in pole size class at BZCF, which can eventually lead to monodominance forests in the future. The higher abundance in tree, pole and saplings layers in PAF may be due to management rules of the national park, while the highest abundance of regeneration in BZCF may be due to suitability of conditions for regeneration. Sagar et al. (2003) [1] also suggested similar types of findings, i.e., that forests with lower disturbance would experience low exploitation, which results in higher abundance. The diversity indices followed an inverse trend with respect to disturbance level i.e., increasing diversity in bigger size classes in lower disturbance level, consistent with findings of previous study [13].
The population structure of forests is often depicted from the diameter distribution of trees [32,60], and the type of curves are used to interpret the vegetation characteristics [60]. In all three disturbance regimes, the population structure showed reverse J-shaped curves, indicating healthy population structures [46,61]. The total stem density in tree, pole and sapling size class was highest in least disturbed forest, with seedling was highest in highly disturbed forest. Similar results were observed in unmanaged moist deciduous forests in Siwalik Himalayas, India [4]. There was a gradual decrease in stem density with increasing DBH, which is a typical characteristic of dry tropical forests [15,23]. In all disturbance regimes, sapling accounted for the highest in mildly disturbed forest regime, which is consistent with the research findings from Nepalese Sal Forests [15,23].
The density of bigger size class trees was lower in highly disturbed forests. This can be related to the management activities of BZCF, i.e., harvesting of timber every year according to the management plan. The less density of size class in 40–50 cm DBH class in moderately disturbed forests is mainly due to a concentration of illegal harvesting of medium sized timbers by axe and easy transportation. Similar observations are report in other Sal forests in Nepal [15].
The mean density of the stems above 1.3 cm DBH decreased significantly (p < 0.001) along the increase of disturbance level, consistent with the findings of the study from unmanaged moist deciduous forests in India [4], in other tropical forests [18] and in China [5]. The protected area forests have restrictions in use of any tree products, while BZCF is a participatory forest management model with continuous use and harvest of forest products. Therefore, there was a significant reduction in density of diameter class above 1.3–10 cm in heavily disturbed forests. This may be due to protection and management modalities of three forests ranging from strict protection to limited use and frequently use. There was a significant difference in mean basal area of stems above 1.3 cm DBH (p < 0.001) among the disturbance levels. Frequent removal of timber and poles from the buffer zone community forest may be the main reason to have low basal area in comparison to moderately used and highly protected forests.

4.3. Dominance of the Species

Sal was the dominant species in mildly disturbed forest, suggesting that the low level of disturbance in forest ecosystem favors the classical monodominance theory of adaptation of a competitive superior species against all others in certain environmental condition [62]. Furthermore, the dominance of Sal in BZCF in all size classes except sapling can be explained by human disturbance, which may alter the course of forest succession by giving advantage to some species or selectively removing others [36]. Such domination of a few species in highly disturbed sites was also reported in past studies [13,35]. These phenomena could be related to the ability of Sal to regenerate aggressively by suckers [63], which is strongly related to the level of regeneration cutting, browsing and lopping. It has been argued that disturbance increases light availability, which speeds up seedling recruitment and establishment of Sal [28], largely due to its high light demanding nature [63]. We found a high grazing pressure in BZCF compared to the other two management regimes. Grazing was the major source of disturbance in smaller size classes. The dominance of Mallotus philippensis in sapling stage in BZCF can be the result of overgrazing and high level of disturbance.
The findings of this study revealed that the presence of opportunistic species such as Mallotus Philippensis in forests are taking the advantage of canopy opening (disturbance) and changing the environmental conditions from moist to mesic and further to xeric [64]. Similarly, the species that compete out all others is best adapted to those environmental conditions [62]. The IVI value was higher in BZCF in pole size class compared to moderately disturbed forest, confirming its ability to tolerate disturbance [13].

4.4. Status of Regeneration

A high Sal regeneration was recorded in BZCF forest, and the number declined sharply in the sapling stage. Mallotus philippensis was the highest in number for sapling in BZCF regime and second in SMF regime. This may be due to the disturbance and opportunistic characteristics of the species [64]. There is a huge grazing pressure in the BZCF category, which eventually leads to the deprivation of plant and soil resources [65] and the loss of species richness, while favoring the abundance of unpalatable species [4,66] such as Mallotus philippensis. Although regeneration of Mallotus philippensis may be impacted by grazing, browsing and/or resource competition, the species is still dominant because of its higher reproductively capacity through sprout [4].
Impact of disturbance on Sal regeneration is well studied in Nepal [4,15,32,67,68]. For instance, Gautam et al. (2016) [2] observed a negative relation between disturbance and regeneration (both seedling and sapling), while Sapkota et al. (2009) [15] argued that the moderate disturbances favor the regeneration. Present regeneration in forests help to predict future species composition [32]. A Sal tree can produce thousands of seedlings in a good seed year, but only few seedlings can survive and establish. Therefore, we mainly focused on Sal’s sapling. Our results related to regeneration could be attributed to the management modalities and the disturbance level. There was a negative relationship with disturbance level while observing the density in the size class of seedling and sapling of Sal species. This result is consistent with the findings of Gautam et al. (2016) [4], but Sapkota et al. (2009) [15] argued that moderate disturbances favor regeneration. Considering the regeneration status of mild and moderate disturbed forest type, highly disturbed forest can be possibly restored toward a Sal Forest if the disturbances can be minimized. This is also important from economic perspective because revenue generated less-disturbed forest in protected areas are less compared to actively managed community and state-managed forests [69]. Therefore, special attention is needed while formulating and implementing a management plan.

5. Conclusions

This study found that structure, composition, regeneration, and diversity varied at different levels of disturbance, with higher values of forest attributes in mild and moderately disturbed forests compared to heavily disturbed forests. This suggests that a moderate level of disturbance can facilitate positive forest attributes more effectively than higher disturbance. The stem density (dbh > 1.3 cm) of all age classes decreased as the intensity of disturbance factors increased. There was also a significant difference in the stem density within mild and heavily disturbed forests. However, regeneration was favored in less disturbed forests.
With protected area forests providing a baseline of plant diversity in a natural state due to no anthropogenic disturbances for decades, the findings of this study can provide important information to managers about role of planned anthropogenic disturbance on Sal management under state-managed and buffer zone community forests. As evidenced from state-managed forest, moderate disturbance with limited access and use to the forest does not negatively affect the forest attributes (hinder the overall stand structure, regeneration establishment and species diversity) but may favor those attributes. Special attention should be given to minimize disturbance, as heavy disturbance is found to be detrimental to Sal regeneration and diversity of the forest. There is lack of weighing the disturbances and finding life stages of trees in which it is more susceptible to disturbances. Extensive studies focusing on such questions will help to provide important information for comprehensive forest management and to understand ecological reactions to the level of disturbances in Sal forests.

Author Contributions

Conceptualization, U.C., S.N., and M.M.; methodology, U.C., B.P.C., S.N., and M.M.; software, U.C. and S.N.; validation, U.C., B.P.C., S.N., and M.M.; formal analysis, U.C., B.P.C., S.N., and M.M.; investigation, U.C., B.P.C., S.N., and M.M.; data curation, U.C.; writing—original draft preparation, U.C.; writing—review and editing, U.C., B.P.C., S.N., and M.M.; visualization, U.C., B.P.C., S.N., and M.M.; supervision, U.C., B.P.C., S.N., and M.M.; project administration, U.C.; funding acquisition, U.C. All authors have read and agreed to the published version of the manuscript.

Funding

This research was funded by the German Academic Exchange Service (DAAD) scholarship.

Institutional Review Board Statement

Not applicable.

Informed Consent Statement

Not applicable.

Data Availability Statement

Most of the used data are compiled from various publicly available sources or from author analysis.

Acknowledgments

The authors are thankful to DAAD scholarship for funding support to carry out the research work and to Milan Dhungana, Rajan Paudyal, Hem Pathak, and Nabaraj Pudasaini for their help at various stages of this research project.

Conflicts of Interest

The authors declare no conflict of interest.

References

  1. Sagar, R.; Raghubanshi, A.S.; Singh, J.S. Tree Species Composition, Dispersion and Diversity along a Disturbance Gradient in a Dry Tropical Forest Region of India. For. Ecol. Manag. 2003, 186, 61–71. [Google Scholar] [CrossRef]
  2. White, P.S.; Jentsch, A. The Search for Generality in Studies of Disturbance and Ecosystem Dynamics. In Progress in Botany; Springer: Berlin/Heidelberg, Germany, 2001; pp. 399–450. [Google Scholar]
  3. Siebert, S.F.; Belsky, J.M. Historic Livelihoods and Land Uses as Ecological Disturbances and Their Role in Enhancing Biodiversity: An Example from Bhutan. Biol. Conserv. 2014, 177, 82–89. [Google Scholar] [CrossRef]
  4. Gautam, M.K.; Manhas, R.K.; Tripathi, A.K. Patterns of Diversity and Regeneration in Unmanaged Moist Deciduous Forests in Response to Disturbance in Shiwalik Himalayas, India. J. Asia Pac. Biodivers. 2016, 9, 144–151. [Google Scholar] [CrossRef] [Green Version]
  5. Zhu, J.; Mao, Z.; Hu, L.; Zhang, J. Plant Diversity of Secondary Forests in Response to Anthropogenic Disturbance Levels in Montane Regions of Northeastern China. J. For. Res. 2007, 12, 403–416. [Google Scholar] [CrossRef]
  6. Sapkota, R.P.; Stahl, P.D.; Norton, U. Anthropogenic Disturbances Shift Diameter Distribution of Woody Plant Species in Shorea Robusta Gaertn. (Sal) Mixed Forests of Nepal. J. Asia Pac. Biodivers. 2019, 12, 115–128. [Google Scholar] [CrossRef]
  7. Ramírez-Marcial, N.; González-Espinosa, M.; Williams-Linera, G. Anthropogenic Disturbance and Tree Diversity in Montane Rain Forests in Chiapas, Mexico. For. Ecol. Manag. 2001, 154, 311–326. [Google Scholar] [CrossRef]
  8. Kennard, D.K.; Gould, K.; Putz, F.E.; Fredericksen, T.S.; Morales, F. Effect of Disturbance Intensity on Regeneration Mechanisms in a Tropical Dry Forest. For. Ecol. Manag. 2002, 162, 197–208. [Google Scholar] [CrossRef] [Green Version]
  9. Franklin, J.F. Ecological Characteristics of Old-Growth Douglas-Fir Forests; United States Department of Agriculture, Forest Service, Pacific Northwest Forest and Range Experiment Statation: Corvallis, Oregon, USA, 1981; Volume 118. [Google Scholar]
  10. Bennett, L.T.; Adams, M.A. Assessment of Ecological Effects Due to Forest Harvesting: Approaches and Statistical Issues. J. Appl. Ecol. 2004, 41, 585–598. [Google Scholar] [CrossRef]
  11. Elderd, B.D.; Doak, D.F. Comparing the Direct and Community-Mediated Effects of Disturbance on Plant Population Dynamics: Flooding, Herbivory and Mimulus Guttatus. J. Ecol. 2006, 94, 656–669. [Google Scholar] [CrossRef]
  12. Khumbongmayum, A.D.; Khan, M.L.; Tripathi, R.S. Biodiversity Conservation in Sacred Groves of Manipur, Northeast India: Population Structure and Regeneration Status of Woody Species. In Human Exploitation and Biodiversity Conservation; Springer: Berlin/Heidelberg, Germany, 2006; pp. 99–116. [Google Scholar]
  13. Sapkota, I.P.; Tigabu, M.; Odén, P.C. Changes in Tree Species Diversity and Dominance across a Disturbance Gradient in Nepalese Sal (Shorea Robusta Gaertn. f.) Forests. J. For. Res. 2010, 21, 25–32. [Google Scholar] [CrossRef]
  14. Nagaike, T.; Kamitani, T.; Nakashizuka, T. The Effect of Shelterwood Logging on the Diversity of Plant Species in a Beech (Fagus Crenata) Forest in Japan. For. Ecol. Manag. 1999, 118, 161–171. [Google Scholar] [CrossRef]
  15. Sapkota, I.P.; Tigabu, M.; Odén, P.C. Spatial Distribution, Advanced Regeneration and Stand Structure of Nepalese Sal (Shorea Robusta) Forests Subject to Disturbances of Different Intensities. For. Ecol. Manag. 2009, 257, 1966–1975. [Google Scholar] [CrossRef]
  16. Sheil, D.; Burslem, D.F.R.P. Disturbing Hypotheses in Tropical Forests. Trends Ecol. Evol. 2003, 18, 18–26. [Google Scholar] [CrossRef]
  17. Connell, J.H. Diversity in Tropical Rain Forests and Coral Reefs. Science 1978, 199, 1302–1310. [Google Scholar] [CrossRef] [PubMed] [Green Version]
  18. Molino, J.; Sabatier, D. Tree Diversity in Tropical Rain Forests: A Validation of the Intermediate Disturbance Hypothesis. Science 2001, 294, 1702–1704. [Google Scholar] [CrossRef] [PubMed] [Green Version]
  19. Kandel, P.; Chapagain, P.S.; Sharma, L.N.; Vetaas, O.R. Consumption Patterns of Fuelwood in Rural Households of Dolakha District, Nepal: Reflections from Community Forest User Groups. Small Scale For. 2016, 15, 481–495. [Google Scholar] [CrossRef]
  20. Hardin, G. The Tragedy of the Commons. J. Nat. Resour. Policy Res. 2009, 1, 243–253. [Google Scholar] [CrossRef]
  21. Forest Resource Assessment (FRA) Nepal, Department of Forest Research and Survey (DFRS). State of Nepal’s Forests; Department of Forest Research and Survey: Kathmandu, Nepal, 2015. [Google Scholar]
  22. Joshi, A.R. Establishing Biological Monitoring System for Terai Arc Landscape; A report submitted to World Wildlife Fund (WWF) Nepal Program; WWF Nepal: Kathmandu, Nepal, 2002. [Google Scholar]
  23. Timilsina, N.; Ross, M.S.; Heinen, J.T. A Community Analysis of Sal (Shorea Robusta) Forests in the Western Terai of Nepal. For. Ecol. Manag. 2007, 241, 223–234. [Google Scholar] [CrossRef]
  24. DFRS/FRA. Terai Forests of Nepal; DFRS/FRA: Kathmandu, Nepal, 2014. [Google Scholar]
  25. Ghimire, B.R.; Nagai, M.; Tripathi, N.K.; Witayangkurn, A.; Mishara, B.; Sasaki, N. Mapping of Shorea Robusta Forest Using Time Series MODIS Data. Forests 2017, 8, 384. [Google Scholar] [CrossRef]
  26. Lalfakawma; Sahoo, U.K.; Roy, S.; Vanlalhriatpuia, K.; Vanalalhluna, P.C. Community Composition and Tree Population Semi-Evergreen Forest Stands of North-East India. Appl. Ecol. Environ. Res. 2009, 7, 303–318. [Google Scholar] [CrossRef]
  27. Dinerstein, E. An Ecological Survey of the Royal Karnali-Bardia Wildlife Reserve, Nepal. Part I: Vegetation, Modifying Factors, and Successional Relationships. Biol. Conserv. 1979, 15, 127–150. [Google Scholar] [CrossRef]
  28. Webb, E.L.; Sah, R.N. Structure and Diversity of Natural and Managed Sal (Shorea Robusta Gaertn.f.) Forest in the Terai of Nepal. For. Ecol. Manag. 2003, 176, 337–353. [Google Scholar] [CrossRef]
  29. Acharya, H.; Ram, A.; Shtestha, S. Parsa National Park and Its Buffer Zone Management Plan (2075/76-2079/80); Parsa National Park: Aadhavar, Bara, Nepal, 2018. [Google Scholar]
  30. Radhakrishna Buffer Zone Management Plan. Management Plan of Radhakrishna Bufferzone Community Forest; Radhakrishna Bufffer Zone Management Committee: Simara, Bara, Nepal, 2018. [Google Scholar]
  31. Poudyal, B.H.; Maraseni, T.; Cockfield, G. Impacts of Forest Management on Tree Species Richness and Composition: Assessment of Forest Management Regimes in Tarai Landscape Nepal. Appl. Geogr. 2019, 111, 102078. [Google Scholar] [CrossRef]
  32. Bhuyan, P.; Khan, M.L.; Tripathi, R.S. Tree Diversity and Population Structure in Undisturbed and Human-Impacted Stands of Tropical Wet Evergreen Forest in Arunachal Pradesh, Eastern Himalayas, India. Biodivers. Conserv. 2003, 12, 1753–1773. [Google Scholar] [CrossRef]
  33. Thapa, S.; Chapman, D.S. Impacts of Resource Extraction on Forest Structure and Diversity in Bardia National Park, Nepal. For. Ecol. Manag. 2010, 259, 641–649. [Google Scholar] [CrossRef]
  34. Sahu, P.K.; Sagar, R.; Singh, J.S. Tropical Forest Structure and Diversity in Relation to Altitude and Disturbance in a Biosphere Reserve in Central India. Appl. Veg. Sci. 2008, 11, 461–470. [Google Scholar] [CrossRef]
  35. Mishra, B.P.; Tripathi, O.P.; Tripathi, R.S.; Pandey, H.N. Effects of Anthropogenic Disturbance on Plant Diversity and Community Structure of a Sacred Grove in Meghalaya, Northeast India. Biodivers. Conserv. 2004, 13, 421–436. [Google Scholar] [CrossRef]
  36. Htun, N.Z.; Mizoue, N.; Yoshida, S. Tree Species Composition and Diversity at Different Levels of Disturbance in Popa Mountain Park, Myanmar. Biotropica 2011, 43, 597–603. [Google Scholar] [CrossRef]
  37. Jaccard, P. The Distribution of the Flora in the Alpine Zone. New Phytol. 1912, 11, 37–50. [Google Scholar] [CrossRef]
  38. Magurran, A.E. Ecological Diversity and Its Measurement; Princeton University Press: Princeton, NJ, USA, 1988. [Google Scholar]
  39. Simpson, E.H. Measurment of Diversity. Nature 1949, 163, 688. [Google Scholar] [CrossRef]
  40. Pielou, E.C. Species-Diversity and Pattern-Diversity in the Study of Ecological Succession. J. Theor. Biol. 1966, 10, 370–383. [Google Scholar] [CrossRef]
  41. Misra, R. Ecology Workbook; Oxford & IBH Publishing Company: New Delhi, India, 1968. [Google Scholar]
  42. Curtis, J.T.; McIntosh, R.P. An Upland Forest Continuum in the Prairie-Forest Border Region of Wisconsin. Ecology 1951, 32, 476–496. [Google Scholar] [CrossRef]
  43. Oksanen, J.; Blanchet, F.G.; Kindt, R.; Legendre, P.; Minchin, P.R.; O’hara, R.B.; Simpson, G.L.; Solymos, P.; Stevens, M.H.H.; Wagner, H. Vegan: Community Ecology Package. R Package Vegan version 2.2-1. 2018, pp. 2–5. Available online: https://www.worldagroforestry.org/publication/vegan-community-ecology-package-r-package-vegan-vers-22-1 (accessed on 10 October 2020).
  44. Kindt, R.; Coe, R. Tree Diversity Analysis: A Manual and Software for Common Statistical Methods for Ecological and Biodiversity Studies; World Agroforestry Centre: Nairobi, Kenya, 2005. [Google Scholar]
  45. R Core Team. R: A Language and Environment for Statistical Computing; R Core Team: Vienna, Austria, 2013. [Google Scholar]
  46. Parthasarathy, N.; Karthikeyan, R. Plant Biodiversity Inventory and Conservation of Two Tropical Dry Evergreen Forests on the Coromandel Coast, South India. Biodivers. Conserv. 1997, 6, 1063–1083. [Google Scholar] [CrossRef]
  47. Nurse, M.; Malla, Y. Advances in Community Forestry in Asia. Capital. Shar. Exp. Interact. For. Policies L. Use Patterns Asia 2006, 2, 25–31. [Google Scholar]
  48. Gilmour, D.; Malla, Y.; Nurse, M. Linkages between Community Forestry and Poverty. Bangkok: Regional Community Forestry Center for Asia and the Pacific. 2004. Available online: http://citeseerx.ist.psu.edu/viewdoc/download?doi=10.1.1.514.3609&rep=rep1&type=pdf (accessed on 10 October 2020).
  49. Shrestha, U.B.; Shrestha, S.; Chaudhary, P.; Chaudhary, R.P. How Representative Is the Protected Areas System of Nepal? Mt. Res. Dev. 2010, 30, 282–294. [Google Scholar] [CrossRef]
  50. Paudel, S.; Sah, J.P. Physiochemical Characteristics of Soil in Tropical Sal (Shorea Robusta Gaertn.) Forests in Eastern Nepal. Himal. J. Sci. 2003, 1, 107–110. [Google Scholar] [CrossRef] [Green Version]
  51. Bhatnagar, H.P. Soils from Different Quality Sal (Shorea Robusta) Forests of Uttar Pradesh. Trop. Ecol. 1965, 6, 56–62. [Google Scholar]
  52. Jackson, J.K. Manual of Afforestation in Nepal: Forest Research and Survey Center; Forest Survey and Research Office, Department of Forest: Kathmandu, Nepal, 1994. [Google Scholar]
  53. Reinhardt, J.R. Community-Level Impacts of Management and Disturbance in Western Michigan Oak Savannas. Am. Midl. Nat. 2017, 177, 112–125. [Google Scholar] [CrossRef]
  54. McKinney, M.L. Urbanization, Biodiversity, and ConservationThe Impacts of Urbanization on Native Species Are Poorly Studied, but Educating a Highly Urbanized Human Population about These Impacts Can Greatly Improve Species Conservation in All Ecosystems. Bioscience 2002, 52, 883–890. [Google Scholar] [CrossRef]
  55. Rahman, M.D.M.; Nishat, A.; Vacik, H. Anthropogenic Disturbances and Plant Diversity of the Madhupur Sal Forests (Shorea Robusta, C.F. Gaertn) of Bangladesh. Int. J. Biodivers. Sci. Manag. 2009, 5, 162–173. [Google Scholar] [CrossRef]
  56. Pandey, S.K.; Shukla, R.P. Plant Diversity in Managed Sal (Shorea Robusta Gaertn.) Forests of Gorakhpur, India: Species Composition, Regeneration and Conservation. Biodivers. Conserv. 2003, 12, 2295–2319. [Google Scholar] [CrossRef]
  57. Rabha, D. Species Composition and Structure of Sal (Shorea Robusta Gaertn. f.) Forests along Disturbance Gradients of Western Assam, Northeast India. Trop. Plant Res. 2014, 1, 16–21. [Google Scholar]
  58. Onaindia, M.; Dominguez, I.; Albizu, I.; Garbisu, C.; Amezaga, I. Vegetation Diversity and Vertical Structure as Indicators of Forest Disturbance. For. Ecol. Manag. 2004, 195, 341–354. [Google Scholar] [CrossRef]
  59. Peltzer, D.A.; Bast, M.L.; Wilson, S.D.; Gerry, A.K. Plant Diversity and Tree Responses Following Contrasting Disturbances in Boreal Forest. For. Ecol. Manag. 2000, 127, 191–203. [Google Scholar] [CrossRef]
  60. Rao, P.; Barik, S.K.; Pandey, H.N.; Tripathi, R.S. Community Composition and Tree Population Structure in a Sub-Tropical Broad-Leaved Forest along a Disturbance Gradient. Vegetatio 1990, 88, 151–162. [Google Scholar] [CrossRef]
  61. Banda, T.; Schwartz, M.W.; Caro, T. Woody Vegetation Structure and Composition along a Protection Gradient in a Miombo Ecosystem of Western Tanzania. For. Ecol. Manag. 2006, 230, 179–185. [Google Scholar] [CrossRef]
  62. Connell, J.H.; Lowman, M.D. Low-Diversity Tropical Rain Forests: Some Possible Mechanisms for Their Existence. Am. Nat. 1989, 134, 88–119. [Google Scholar] [CrossRef]
  63. Gautam, K.H.; Devoe, N.N. Ecological and Anthropogenic Niches of Sal (Shorea Robusta Gaertn. f.) Forest and Prospects for Multiple-Product Forest Management—A Review. Forestry 2006, 79, 81–101. [Google Scholar] [CrossRef]
  64. Mandal, G.; Joshi, S.P. Analysis of Vegetation Dynamics and Phytodiversity from Three Dry Deciduous Forests of Doon Valley, Western Himalaya, India. J. Asia Pac. Biodivers. 2014, 7, 292–304. [Google Scholar] [CrossRef] [Green Version]
  65. Keya, G.A. Herbaceous Layer Production and Utilization by Herbivores under Different Ecological Conditions in an Arid Savanna of Kenya. Agric. Ecosyst. Environ. 1998, 69, 55–67. [Google Scholar] [CrossRef]
  66. Beguin, J.; Pothier, D.; Prévost, M. Can the Impact of Deer Browsing on Tree Regeneration Be Mitigated by Shelterwood Cutting and Strip Clearcutting? For. Ecol. Manag. 2009, 257, 38–45. [Google Scholar] [CrossRef]
  67. Gautam, T.P.; Mandal, T.N. Effect of Disturbance on Plant Species Diversity in Moist Tropical Forest of Eastern Nepal. Our Nat. 2018, 16, 1–7. [Google Scholar] [CrossRef]
  68. Belbase, K.; Poudel, A.S.; Chhetri, S.G. Comparison of forest stand condition between thinned and unthinned blocks under collaborative forest management of western lowlands of Nepal. 2020; Preprint available at Research Square. [Google Scholar] [CrossRef]
  69. Bhatta, B.P.; Chhetri, S.G.; Silwal, T.; Poudel, M. Economic contribution of forestry sector to national economy in Nepal. J. Res. Eco. 2021, 12, 620–627. [Google Scholar] [CrossRef]
Figure 1. Map of sampling plots in the forests managed under three different regimes in Nepal. Yellow, red, and blue dots in the map represent sample plots for PAF, BZCF, and, respectively.
Earth 02 00049 g001
Figure 2. (a) Schematic layout of nested plot design from sampling in 100 ha forest area for each management regime with plot to plot distance of 218 m. (b) Schematic nested circular plot design with radius of 12.61 m for tree (R1), 5.65 m for pole (R2), 2.82 m for sapling (R3), and 1.78 m for seedling (R4).
Earth 02 00049 g002
Figure 3. Flowchart showing method of estimating relative disturbance in different forest regime.
Earth 02 00049 g003
Figure 4. Importance value indices (IVI) of the three most dominant species for tree, pole, sapling, and seedling for each management regime.
Earth 02 00049 g004
Figure 5. Counts of saplings (a) and seedlings (b) by species in each forest management regime.
Earth 02 00049 g005
Table 1. Key differences in three forest management regimes selected for the study.
CharacteristicsManagement Regime
PAFSMFBZCF
ObjectiveProtection of range and endangered wild animals and plants and their habitat, promotion of biodiversity and ecotourismSupply of forest products including timber and fuelwood at the national levelFulfill the forest products’ needs of local communities and maintain biodiversity
Rights to govern on forest use and conservationPark administrationDistrict and local level forest officials under the Department of ForestBZCF users and protected area authority collectively make the decision
Rights to sell forest productsProhibited use of most of the forest productsGovernment of NepalThere is restriction on sale of forest products outside the user group except to sell non-timber forest products
Rights to manage forestOfficials under the Department of National Parks and Wildlife Conservation and Nepal ArmyDistrict and local level forest officials under the Department of ForestsBZCF users group manage and conserve the forest, but the park officials also have authority to involve in conservation
Local communities’ participation in forest management and conservationLow LowHigh
Timber harvestingAlmost nil except for habitat management works and construction of roads and firelinesPlanned forest harvesting is minimal despite having a forest management planRegular silvicultural operation and harvesting as provision in forest management plan
Frequency and extend of forest harvestingClose to nilMinimalDepending on the resource condition and user group dynamics
Table 2. Chemical properties of soil in the study forests under different management regimes (mean ± SE). Mean values followed by the different letter are significantly different.
Chemical PropertiesManagement Regime
BZCSMFPAF
pH7.43 ± 0.12 a7.57 ± 0.15 a7.64 ± 0.13 a
N (%)0.131 ± 0.0052 a0.131 ± 0.0069 a0.148 ± 0.070 a
P (Kg/Ha)37.92 ± 2.2 a31.83 ± 2.69 a56.17 ± 3.74 b
K (Kg/Ha)176.94 ± 4 a181.71 ± 3.41 a240.49 ± 7.53 b
Table 3. Relative impact factor for a bundle of disturbances and estimated disturbance factors for each management regime.
Disturbance IndexManagement Regime
BZCFSMFPAF
Disturbed seedling frequency1.000.430.07
Disturbed saplings frequency1.000.360.06
Disturbed sapling BA0.291.000.16
Lopping/Branch cutting frequency +1.000.140.00
Lopping/Branch cutting BA +1.000.080.00
Cutting/chopping/girdling/bark removal frequency +1.000.400.81
Cutting/chopping/girdling/bark removal BA +1.000.530.83
Pest/Climber frequency +1.000.810.40
Pest/Climber BA +1.000.890.30
Stagheaded frequency +0.001.000.44
Stagheaded BA +0.001.000.37
Crown open (%)1.000.920.95
Distance from settlements (m)1.000.210.19
Footpath area (m2)1.000.000.00
Wild boar/bison wallowing/mouse mound (m2)1.000.660.82
Grazing/Grass cutting (m2)1.000.000.00
Stump felled (BA)0.861.000.00
Stump Small frequency1.000.780.00
W/L spots/termites (no.)0.170.171.00
Wind-thrown frequency0.000.371.00
Total15.3210.757.40
+ Indices only measured for pole and tree size classes.
Table 4. Species composition and similarity in three forest types along disturbance level.
Species CompositionManagement RegimeJaccard Index
PAFSMFBZCF
Total Species303316-
No. of unique species451-
No. of species with single individual651-
Common species in all forest types13-
Overlapping species between PAF and SMF260.70
No. of overlapping species between PAF and BZCF130.39
No. of overlapping species between SMF and BZCF150.44
Table 5. Species diversity and composition from different diversity indices for each disturbance level (mean ± SE). Mean values followed by a different letter are significantly different.
Management RegimeSize ClassTotal SpeciesMean Species RichnessShannon-Weiner IndexSimpson’s IndexEvenness IndexAbundance
BZCFTree112.3 ± 0.26 a0.74 ± 0.11 a0.44 ± 0.06 a0.44 ± 0.05 a3 ± 0.36 a
SMF184 ± 0.40 b1.24 ± 0.10 b0.29 ± 0.02 a0.50 ± 0.032 a5.5 ± 0.58 b
PAF132.6 ± 0.35 a0.65 ± 0.12 a0.63 ± 0.06 b0.35 ± 0.052 a5.9 ± 0.60 b
BZCFPole61.6 ± 0.18 a0.33 ± 0.072 a0.74 ± 0.05 a0.28 ± 0.06 a4.9 ± 0.68 a
SMF142.05 ± 0.28 ab0.52 ± 0.11 ab0.63 ± 0.06 a0.33 ± 0.06 a4.45 ± 0.79 a
PAF132.8 ± 0.39 b0.77 ± 0.15 b0.58 ± 0.07 a0.32 ± 0.05 a5.15 ± 0.54 a
BZCFSapling102.45 ± 0.23 a0.71 ± 0.10 a0.58 ± 0.06 a0.41 ± 0.05 a5.8 ± 0.71 a
SMF122.45 ± 0.28 a0.73 ± 0.10 a0.46 ± 0.05 a0.44 ± 0.05 a5.9 ± 1.09 a
PAF153.1 ± 0.33 a0.82 ± 0.11 a0.51 ± 0.06 a0.34 ± 0.03 a8.45 ± 0.73 a
BZCFSeedling82.8 ± 0.24 a0.76 ± 0.08 a0.55 ± 0.04 a0.41 ± 0.04 a22.25 ± 2.13 a
SMF203.85 ± 0.26 b0.95 ± 0.07 a0.48 ± 0.03 a0.41 ± 0.02 a21.9 ± 1.48 a
PAF173.6 ± 0.24 ab0.88 ± 0.061 a0.51 ± 0.03 a0.41 ± 0.03 a19.5 ± 1.69 a
Table 6. Estimated tree density (trees/ha) and basal area (m2/ha) by size class across the management regimes. Mean (±SE) values followed by a different letter for aggregate value for all size classes are significantly different.
Stand StructureSize Class at DBH (cm)Disturbance Levels
BZCFSMFPAF
Density>3060110118
10–29.9490445515
1.3–4.9232023603380
<1.322,25021,90019,500
Aggregate4013 ± 283.06 b2915 ± 440.39 ab2870 ± 270.84 a
Tree basal area>3013.6124.6923.14
10–29.910.2512.113.35
1.3–4.92.132.262.98
Aggregate39.47 ± 1.78 b39.05 ± 3.20 b25.49 ± 2.03 a
Publisher’s Note: MDPI stays neutral with regard to jurisdictional claims in published maps and institutional affiliations.

