
Feeding the New Zealand Family of Five Million, 5+ a Day of Vegetables?


Abstract

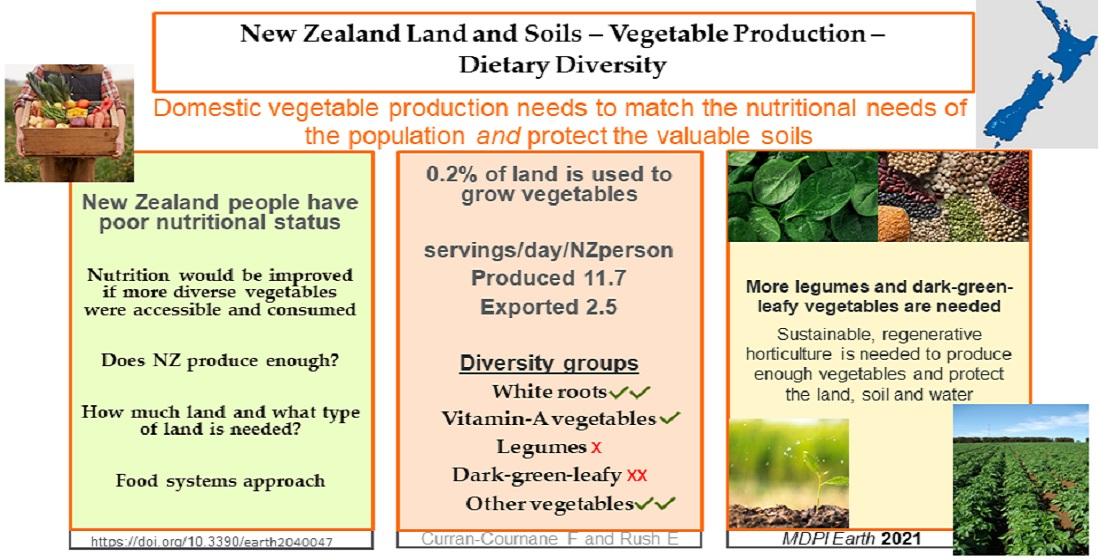
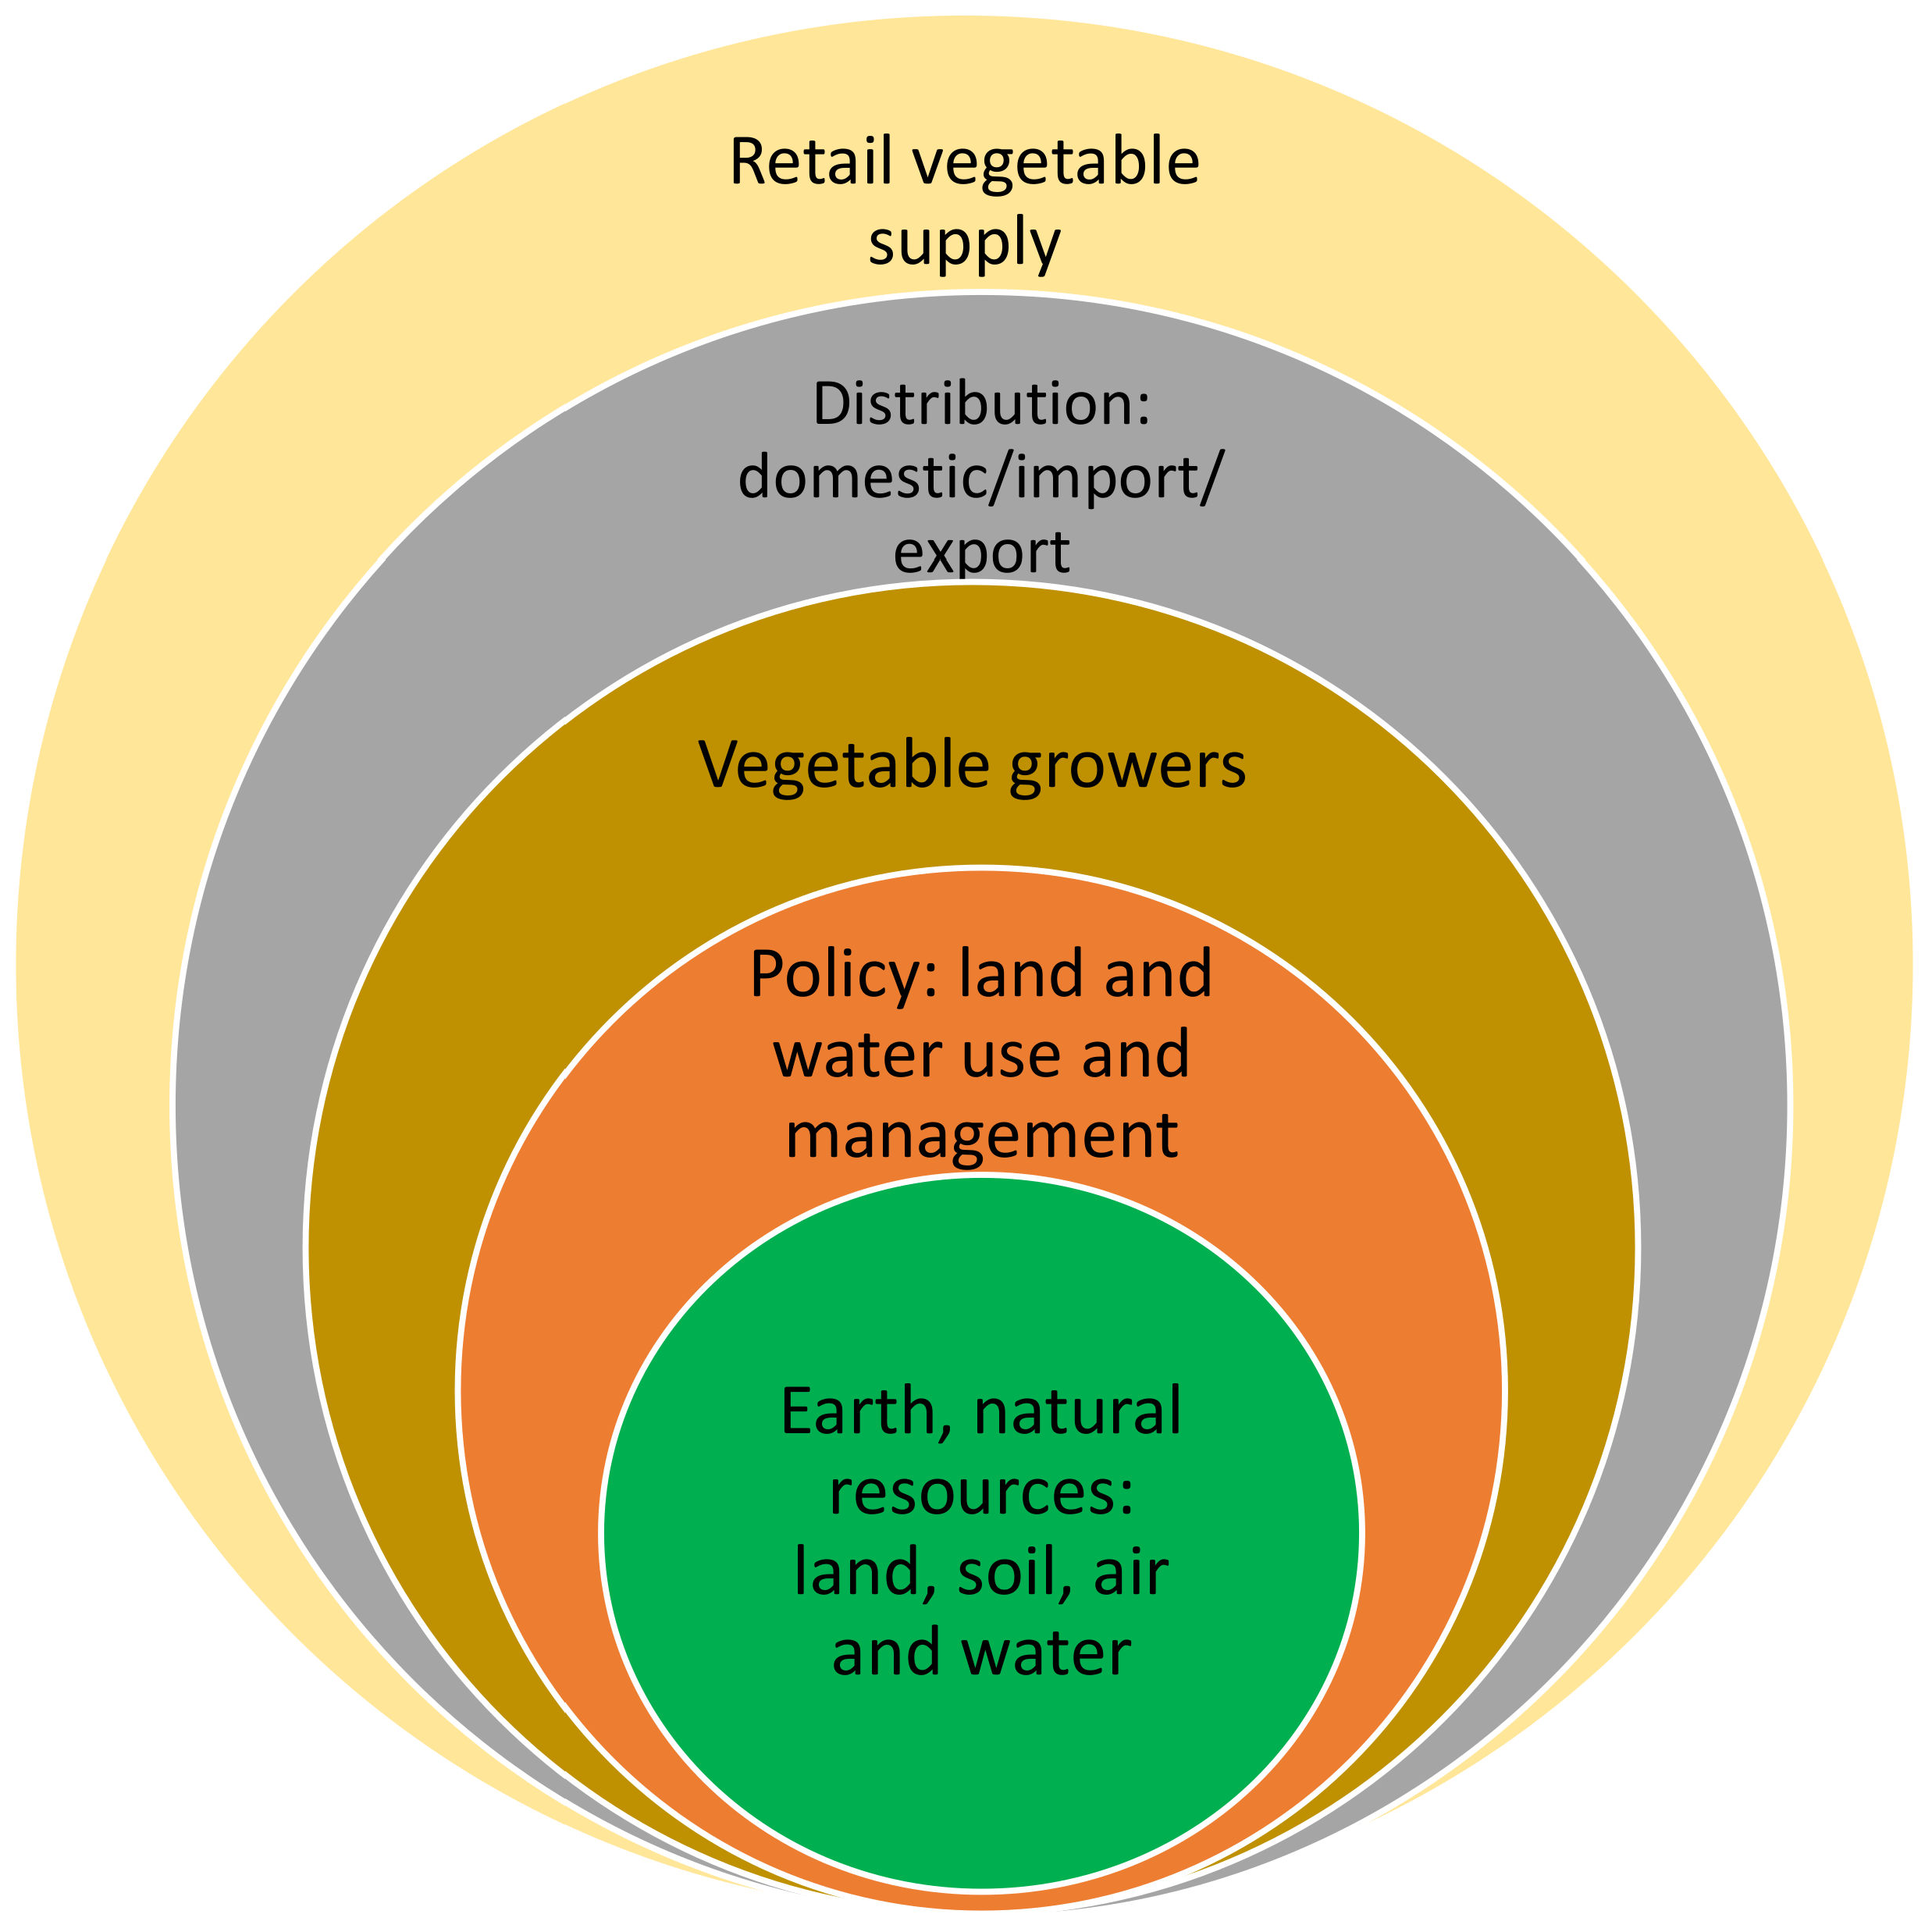
1. Introduction
2. Materials and Methods
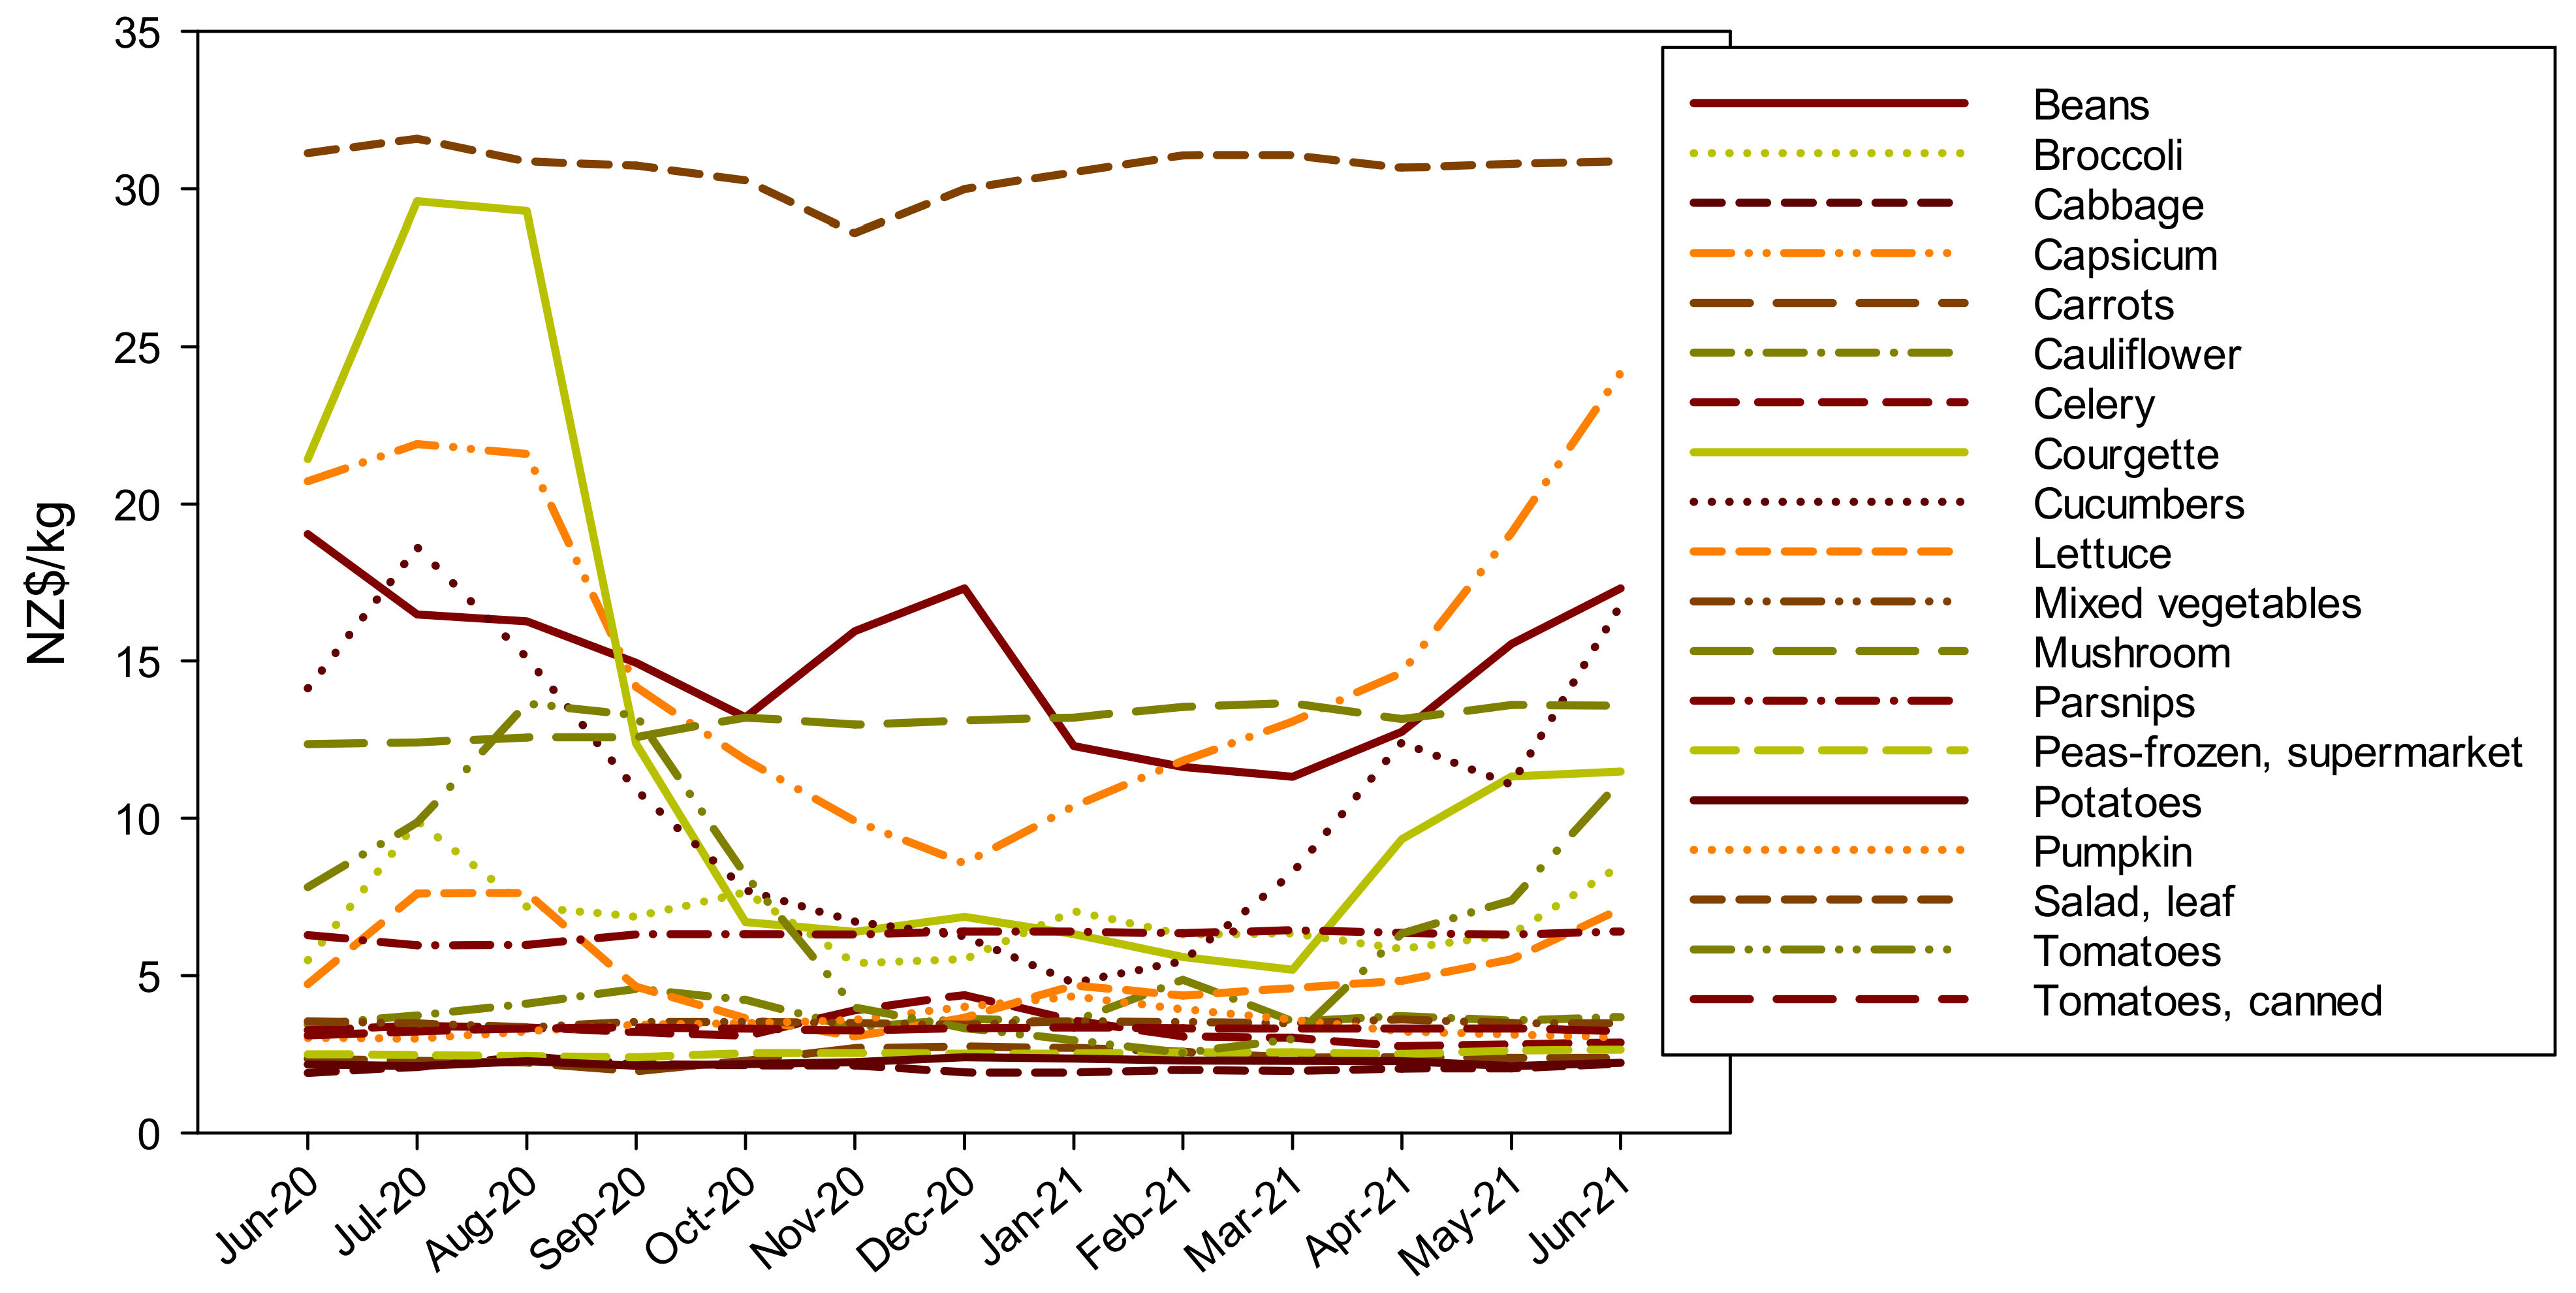
3. Results
4. Discussion
4.1. Tensions Associated with Expanding Outdoor Vegetable Production Land Use
4.2. Limitations and Strengths
4.3. Implications and Future Research
5. Conclusions
Author Contributions
Funding
Data Availability Statement
Acknowledgments
Conflicts of Interest
References
- World Health Organization. Healthy diet Fact Sheet #394. 2018. Available online: http://www.who.int/mediacentre/factsheets/fs394/en (accessed on 21 October 2021).
- Food and Agricultural Organisation of the United Nations; USAID’s Food and Nutrition Technical Assistance III Project (FANTA). Minimum Dietary Diversity for Women: A Guide for Measurement. Available online: http://www.fao.org/3/a-i5486e.pdf (accessed on 21 October 2021).
- Adubra, L.; Savy, M.; Fortin, S.; Kameli, Y.; Kodjo, N.E.; Fainke, K.; Mahamadou, T.; Le Port, A.; Martin-Prevel, Y. The Minimum Dietary Diversity for Women of Reproductive Age (MDD-W) Indicator Is Related to Household Food Insecurity and Farm Production Diversity: Evidence from Rural Mali. Curr. Dev. Nutr. 2019, 3, nzz002. [Google Scholar] [CrossRef]
- Willett, W.; Rockstrom, J.; Loken, B.; Springmann, M.; Lang, T.; Vermeulen, S.; Garnett, T.; Tilman, D.; DeClerck, F.; Wood, A.; et al. Food in the Anthropocene: The EAT-Lancet Commission on healthy diets from sustainable food systems. Lancet 2019, 393, 447–492. [Google Scholar] [CrossRef]
- Rush, E.; Fa’asisila Savila, S.J.-M.; Amoah, I. Vegetables: New Zealand children are not eating enough. Front. Nutr. 2018, 5, 134. [Google Scholar] [CrossRef] [PubMed]
- Gussow, J.D. Reflections on nutritional health and the environment: The journey to sustainability. J. Hunger Environ. Nutr. 2006, 1, 3–25. [Google Scholar] [CrossRef]
- Kc, K.B.; Dias, G.M.; Veeramani, A.; Swanton, C.J.; Fraser, D.; Steinke, D.; Lee, E.; Wittman, H.; Farber, J.M.; Dunfield, K.; et al. When too much isn’t enough: Does current food production meet global nutritional needs? PLoS ONE 2018, 13, e0205683. [Google Scholar] [CrossRef]
- Swinburn, B.A.; Kraak, V.I.; Allender, S.; Atkins, V.J.; Baker, P.I.; Bogard, J.R.; Brinsden, H.; Calvillo, A.; De Schutter, O.; Devarajan, R.; et al. The Global Syndemic of Obesity, Undernutrition, and Climate Change: The Lancet Commission report. Lancet 2019, 393, 791–846. [Google Scholar] [CrossRef]
- United Nations. The Sustainable Development Goals 2030 Agenda. Available online: https://sdgs.un.org/2030agenda (accessed on 21 October 2021).
- Ministry of Health. New Zealand Health Survey. Available online: https://minhealthnz.shinyapps.io/nz-health-survey-2019-20-annual-data-explorer (accessed on 22 August 2021).
- Lynn, I.; Manderson, A.; Page, M.; Harmsworth, G.; Eyles, G.; Douglas, G.; Mackay, A.; Newsome, P. Updating and Producing the Land use Capability Survey Handbook, 3rd ed.; AgResearch Ltd.: Lincoln, New Zealand, 2009; Available online: https://wwwuat.landcareresearch.co.nz/__data/assets/pdf_file/0017/50048/luc_handbook.pdf (accessed on 31 August 2021).
- Vogeler, I.; Vibart, R.; Mackay, A.; Dennis, S.; Burggraaf, V.; Beautrais, J. Modelling pastoral farm systems—Scaling from farm to region. Sci. Total Environ. 2014, 482, 305–317. [Google Scholar] [CrossRef]
- Hutchings, J.; Smith, J. (Eds.) Te Mahi Oneone Hua Parakore: A Māori Soil Sovereignty and Wellbeing Handbook; Harvest: Fresh Scholarship from the Field: Freerange Press Imprint: Christchurch, New Zealand, 2020. [Google Scholar]
- Steenson, S.; Buttriss, J.L. Healthier and more sustainable diets: What changes are needed in high-income countries? Nutr. Bull. 2021, 46, 279–309. [Google Scholar] [CrossRef]
- Sheridan, J.; Larsen, K.; Carey, R. Melbourne’s Food Bowl: Now and at Seven Million; University of Melbourne: Melbourne, VIC, Australia, 2015. Available online: https://fvas.unimelb.edu.au/__data/assets/pdf_file/0008/2355155/Melbournes-Foodbowl-Now-and-at-seven-million.pdf (accessed on 21 October 2021).
- Siegel, K.R.; Ali, M.K.; Srinivasiah, A.; Nugent, R.A.; Narayan, K.M. Do we produce enough fruits and vegetables to meet global health need? PLoS ONE 2014, 9, e104059. [Google Scholar] [CrossRef]
- Mason-D’Croz, D.; Bogard, J.R.; Sulser, T.B.; Cenacchi, N.; Dunston, S.; Herrero, M.; Wiebe, K. Gaps between fruit and vegetable production, demand, and recommended consumption at global and national levels: An integrated modelling study. Lancet Planet Health 2019, 3, e318–e329. [Google Scholar] [CrossRef]
- Rush, E.; Obolonkin, V. Food exports and imports of New Zealand in relation to the food-based dietary guidelines. Eur. J. Clin. Nutr. 2020, 74, 307–313. [Google Scholar] [CrossRef]
- New Zealand Horticulture. Plant and Food Research. Fresh Facts. Available online: https://www.freshfacts.co.nz/files/freshfacts-2017.pdf (accessed on 22 August 2021).
- New Zealand Horticulture. Plant and Food Research. Fresh Facts. Available online: https://www.freshfacts.co.nz/files/freshfacts-2018.pdf (accessed on 20 August 2021).
- New Zealand Horticulture. Plant and Food Research. Fresh Facts. Available online: https://www.freshfacts.co.nz/files/freshfacts-2019.pdf (accessed on 20 August 2021).
- New Zealand Horticulture. Plant and Food Research. Fresh Facts. Available online: https://www.freshfacts.co.nz/files/freshfacts-2020.pdf (accessed on 20 August 2021).
- New Zealand Ministry of Health. Eating and Activity Guidelines for New Zealand Adults. Available online: https://www.health.govt.nz/publication/eating-and-activity-guidelines-new-zealand-adults (accessed on 21 October 2021).
- Statistics New Zealand. Population Clock. Available online: https://www.stats.govt.nz/indicators/population-of-nz (accessed on 21 October 2021).
- Statistics New Zealand. Consumer Price Index. 2021. Available online: https://www.stats.govt.nz/indicators/consumers-price-index-cpi (accessed on 21 October 2021).
- University of Otago; Ministry of Health. A Focus on Nutrition: Key Findings of the 2008/09 New Zealand Adult Nutrition Survey; Ministry of Health: Wellington, New Zealand, 2011. Available online: https://www.health.govt.nz/system/files/documents/publications/a-focus-on-nutrition-v2.pdf (accessed on 21 October 2021).
- Ministry of Health. NZ Food, NZ Children. Key Results of the 2002 National Children’s Nutrition Survey; Ministry of Health: Wellington, New Zealand, 2003. Available online: https://www.health.govt.nz/system/files/documents/publications/nzfoodnzchildren.pdf (accessed on 21 October 2021).
- Rush, E.; Amoah, I.; Diep, T.; Jalili-Moghaddam, S. Determinants and Suitability of Carotenoid Reflection Score as a Measure of Carotenoid Status. Nutrients 2020, 12, 113. [Google Scholar] [CrossRef]
- Donaldson, M.S. A carotenoid health index based on plasma carotenoids and health outcomes. Nutrients 2011, 3, 1003–1022. [Google Scholar] [CrossRef] [PubMed]
- Ministry of Health. Household Food Insecurity among Children in New Zealand; Ministry of Health: Wellington, New Zealand, 2019. Available online: https://www.health.govt.nz/system/files/documents/publications/household-food-insecurity-among-children-new-zealand-health-survey-jun19.pdf (accessed on 21 October 2021).
- Mackay, S.; Buch, T.; Vandevijvere, S.; Goodwin, R.; Korohina, E.; Funaki-Tahifote, M.; Lee, A.; Swinburn, B. Cost and Affordability of Diets Modelled on Current Eating Patterns and on Dietary Guidelines, for New Zealand Total Population, Maori and Pacific Households. Int. J. Environ. Res. Public Health 2018, 15, 1255. [Google Scholar] [CrossRef] [PubMed]
- Mackay, S.; Sing, F.; Gerritsen, S.; Swinburn, B. Benchmarking Food Environments 2020: Progress by the New Zealand Government on Implementing Recommended Food Environment Policies & Priority Recommendations; University of Auckland: Auckland, New Zealand, 2020; Available online: https://auckland.figshare.com/articles/report/Benchmarking_Food_Environments/12502283 (accessed on 21 October 2021).
- Messner, R.; Johnson, H.; Richards, C. From surplus-to-waste: A study of systemic overproduction, surplus and food waste in horticultural supply chains. J. Clean. Prod. 2021, 278, 123952. [Google Scholar] [CrossRef]
- FAO. The State of Food and Agriculture 2019. Moving Forward on Food Loss and Waste Reduction; FAO: Rome, Italy, 2019; p. 182. [Google Scholar]
- Verma, M.; de Vreede, L.; Achterbosch, T.; Rutten, M.M. Consumers discard a lot more food than widely believed: Estimates of global food waste using an energy gap approach and affluence elasticity of food waste. PLoS ONE 2020, 15, e0228369. [Google Scholar] [CrossRef]
- Sunshine Yates Consulting. New Zealand Food Waste Audits; WasteMINZ: Auckland, New Zealand, 2018; Available online: https://lovefoodhatewaste.co.nz/wp-content/uploads/2019/02/Final-New-Zealand-Food-Waste-Audits-2018.pdf (accessed on 21 October 2021).
- Statistics New Zealand. Agricultural and Horticultural Land Use. 2021. Available online: https://www.stats.govt.nz/indicators/agricultural-and-horticultural-land-use (accessed on 21 October 2021).
- Ministry for Primary Industries. Situation and Outlook for Primary Industries, June 2021; Ministry for Primary Industries: Wellington, New Zealand, 2021. Available online: https://www.mpi.govt.nz/dmsdocument/45451-Situation-and-Outlook-for-Primary-Industries-SOPI-June-2021 (accessed on 21 October 2021).
- Ministry for the Environment. New Zealand’s Greenhouse Gas Inventory Snapshot 1990–2019 April 2021; Ministry for the Environment: Wellington, New Zealand, 2021. Available online: https://environment.govt.nz/publications/new-zealands-greenhouse-gas-inventory-1990-2019-snapshot/ (accessed on 21 October 2021).
- McDowell, R.W.; Monaghan, R.M.; Smith, C.; Manderson, A.; Basher, L.; Burger, D.F.; Laurenson, S.; Pletnyakov, P.; Spiekermann, R.; Depree, C. Quantifying contaminant losses to water from pastoral land uses in New Zealand III. What could be achieved by 2035? New Zealand J. Agric Res. 2020, 64, 390–410. [Google Scholar] [CrossRef]
- Basher, L.; Cathcart, S.; Crush, J.; Hart, B.; Clark, S.; Ross, C.; Williams, P. Soil and water management for sustainable vegetable production in a peri-urban area, Pukekohe, New Zealand. In Proceedings of the 24th Hydrology and Water Resources symposium, Auckland, New Zealand, 25–27 November 1997; pp. 321–326. [Google Scholar]
- Basher, L.; Ross, C.; Dando, J. Effects of carrot growing on volcanic ash soils in the Ohakune area, New Zealand. Soil Res. 2004, 42, 259–272. [Google Scholar] [CrossRef]
- Curran-Cournane, F. Differences in Soil Quality and Trace Elements across Land Uses in Auckland and Changes in Soil Parameters from 1995–2017; Auckland Council; Te Kaunihera o Tamaki Makaurau: Auckland, New Zealand, 2020.
- Francis, G.; Trimmer, L.; Tregurtha, C.; Williams, P.; Butler, R. Winter nitrate leaching losses from three land uses in the Pukekohe area of New Zealand. New Zealand J. Ag. Res. 2003, 46, 215–224. [Google Scholar] [CrossRef]
- Haynes, R.; Tregurtha, R. Effects of increasing periods under intensive arable vegetable production on biological, chemical and physical indices of soil quality. Biol. Fertil. Soils 1999, 28, 259–266. [Google Scholar] [CrossRef]
- Ministry for the Environment; Ministry of Agriculture and Fisheries. Finding the Balance: Managing Fresh Water in New Zealand; Ministry for the Environment; Ministry of Agriculture and Fisheries: Wellington, New Zealand, 2021. Available online: https://environment.govt.nz/assets/Publications/Files/finding-balance-fresh-water-new-zealand.pdf (accessed on 21 October 2021).
- Komatsuzaki, M.; Wagger, M. Nitrogen recovery by cover crops in relation to time of planting and growth termination. J. Soil Water Conserv. 2015, 70, 385–398. [Google Scholar] [CrossRef]
- Myers, R.; Watts, C. Progress and perspectives with cover crops: Interpreting three years of farmer surveys on cover crops. J. Soil Water Conserv. 2015, 70, 125A–129A. [Google Scholar] [CrossRef]
- Ledgard, S.F.; Boyes, M.; Brentrup, F. Life Cycle Assessment of Local and Imported Fertilisers Used on New Zealand Farms; Technical Paper 2011/10; Prepared for the Ministry of Agriculture and Forestry (MAF); Ministry of Agriculture and Forestry: Wellington, New Zealand, 2011.
- Ministry for the Environment; Statistics New Zealand. Our Land 2021. Ministry for the Environment and Statistics New Zealand 2021; Ministry for the Environment: Wellington, New Zealand, 2021. Available online: https://environment.govt.nz/assets/Publications/our-land-2021.pdf (accessed on 21 October 2021).
- Grelet, G.; Lang, S.; Merfield, C.; Calhoun, N.; Robson-Williams, M.; Horrocks, A.; Dewes, A.; Clifford, A.; Stevenson, B.; Saunders, C.M. Regenerative Agriculture in Aotearoa New Zealand–Research Pathways to Build Science-Based Evidence and National Narratives. 2021. Available online: https://ourlandandwater.nz/wp-content/uploads/2021/03/Grelet_Lang_2021_Regen_Ag_NZ_White_ePaper.pdf (accessed on 21 October 2021).
- Curran-Cournane, F.; Carrick, S.; Barnes, M.G.; Ausseil, A.-G.; Drewry, J.J.; Bain, I.A.; Golubiewski, N.E.; Jones, H.S.; Barringer, J.; Morell, L. Cumulative effects of fragmentation and development on highly productive land in New Zealand. New Zealand J. Agric. Res. 2021, 1–24, Epub ahead of print. [Google Scholar] [CrossRef]
- Richardson, B.F. The price we pay for land: The political economy of Pukekohe’s development. J. New Zealand Pac. Stud. 2021, 9, 7–23. [Google Scholar] [CrossRef]
- Gradwell, M.W.; Arlidge, E.Z. Deterioration of soil structure in the market gardens of the Pukekohe district, New Zealand. New Zealand J. Agric. Res. 1971, 14, 288–306. [Google Scholar] [CrossRef][Green Version]
- Meijer, K.; Buckthought, L.; Curran-Cournane, F.; Martindale, M.; Prebble, N.; Long, L. Elevated Nitrate Concentrations in Franklin Surface and Groundwater: A Review. 2016. Available online: https://knowledgeauckland.org.nz/media/1278/tr2016-015-elevated-nitrate-concentrations-in-franklin-surface-and-groundwater.pdf (accessed on 21 October 2021).
- Hewitt, A.E.; Balks, M.R.; Lowe, D.J. The Soils of Aotearoa New Zealand; Springer Nature: London, UK, 2021. [Google Scholar]
- Deloitte. New Zealand’s Food Story: The Pukekohe Hub 2018. Prepared for Horticulture New Zealand. Available online: https://www2.deloitte.com/nz/en/pages/primary/articles/pukekohe-hub.html (accessed on 21 October 2021).
- Proudfoot, I. KPMG Agribusiness Agenda; KPMG: Amstelveen, The Netherlands, 2017; Available online: https://home.kpmg/nz/en/home/insights/2017/06/agribusiness-agenda-2017-the-recipe-for-action.html (accessed on 21 October 2021).


| Vegetable Type (Alphabetical Order) | Diversity Group | Average Annual Production Ton (2017–2020) | 1 Servings/Day/2 NZ Person | Hectares Planted |
|---|---|---|---|---|
| Asian Greens incl Kale | DGLV | 57 | ||
| Asparagus | Other | 1875 | 0.014 | 520 |
| Beans (f) | Legumes | 3000 | 0.022 | 300 |
| Beans (p) | Legumes | 14,725 | 0.108 | 500 |
| Beetroot (f) | Other | 7000 | 0.051 | 199 |
| Beetroot (p) | Other | 20,550 | 0.150 | 260 |
| Broccoli | Other | 24,700 | 0.180 | 956 |
| Cabbage | Other | 58,000 | 0.424 | 956 |
| Capsicums | Vitamin-A | 21,440 | 0.157 | 103 |
| Carrots (f) | Vitamin-A | 88,000 | 0.643 | 916 |
| Carrots (p) | Vitamin-A | 70,350 | 0.514 | 800 |
| Cauliflower | Other | 33,000 | 0.241 | 956 |
| Cucumbers | Other | 6388 | 0.047 | 71 |
| Eggplant/aubergines | Other | 925 | 0.007 | 9 |
| Garlic | Other | 1200 | 0.009 | 178 |
| Herbs | 8070 | |||
| Kumara | Other | 24,000 | 0.175 | 1600 |
| Lettuce outdoor | Other | 1532 | ||
| Lettuce greenhouse | Other | 50 | ||
| Melons | Other | 4800 | 0.035 | 222 |
| Mushrooms | Other | 8500 | 0.062 | 25 |
| Onions | Other | 211,452 | 1.545 | 5296 |
| Peas (f) | Legumes | 16 | ||
| Peas (p) | Legumes | 59,850 | 0.437 | 4075 |
| Potatoes (f) | White roots-and-tubers | 244,597 | 1.787 | 10,417 |
| Potatoes (p) | White roots-and-tubers | 366,588 | 2.678 | |
| Pumpkins | Vitamin-A | 38,000 | 0.278 | 603 |
| Shallots | Other | 1200 | 0.009 | 30 |
| Silverbeet/Spinach | DGLV | 3500 | 0.026 | 3 100 |
| Squash | Vitamin-A | 87,884 | 0.642 | 6530 |
| Sweetcorn (f) | Other | 22,000 | 0.161 | |
| Sweetcorn (p) | Other | 77,700 | 0.568 | 3871 |
| Tomatoes indoor | Other | 42,200 | 0.308 | 120 |
| Tomatoes outdoor | Other | 53,000 | 0.387 | 408 |
| Truffles | Other | 0.2 | 0.000 | 0.2 |
| Total | 1,604,493 | 11.7 | 41,676 |
| Vegetable | Hectares in 2020 [22] | Tons/Year [19,20,21,22] | 1 Servings/Day/ 2 NZperson | Dietary Diversity Group [2] | 1 $/kg | $/Serving |
|---|---|---|---|---|---|---|
| Potato (f + p) | 10,417 | 611,185 | 4.5 | White roots-and-tubers | 2.20 | 0.17 |
| Onions | 5296 | 211,452 | 1.5 | Other veg | 0.99 | 0.07 |
| Carrots (f + p) | 1716 | 158,350 | 1.1 | Vitamin-A | 2.24 | 0.17 |
| Sweetcorn (f + p) | 3871 | 99,700 | 0.7 | Other veg | 2.00 | 0.15 |
| Tomatoes indoor + outdoor | 528 | 95,267 | 0.7 | Other veg | 14.99 | 1.12 |
| Squash | 6530 | 88,179 | 0.6 | Vitamin-A | 4.00 | 0.30 |
| Peas -processed | 4075 | 59,850 | 0.4 | Legumes | 2.66 | 0.20 |
| Cabbage | 956 | 58,000 | 0.4 | Other veg | 2.89 | 0.22 |
| Pumpkins | 603 | 38,000 | 0.3 | Vitamin-A | 1.00 | 0.08 |
| Cauliflower | 956 | 33,000 | 0.2 | Other veg | 4.00 | 0.30 |
| Broccoli | 956 | 24,700 | 0.2 | Vitamin-A | 11.79 | 0.88 |
| Capsicum | 103 | 21,440 | 0.1 | Vitamin-A | 12.00 | 0.90 |
| Silverbeet/spinach | 100 | 3500 | 0 | Dark-green-leafy veg | 5.00 | 0.38 |
| Diversity Group | Servings/Day/ NZperson | 1 Hectares | Hectares/Serving | Import Servings/Day/ 2 NZperson | Export Servings/Day/ 2 NZperson |
|---|---|---|---|---|---|
| 3 White roots-and-tubers | 4.465 | 10,417 | 2333 | 0.13 | 0.5 |
| Vitamin-A | 2.233 | 8952 | 4009 | ||
| Other vegetables | 4.373 | 17,259 | 3947 | 1.4 (onions) 0.6 (squash) | |
| Legumes | 0.567 | 4875 | 8598 | 4 0.15 | |
| Dark-green-leafy vegetables | 0.026 | 5 100 | 3911 |
Publisher’s Note: MDPI stays neutral with regard to jurisdictional claims in published maps and institutional affiliations. |
© 2021 by the authors. Licensee MDPI, Basel, Switzerland. This article is an open access article distributed under the terms and conditions of the Creative Commons Attribution (CC BY) license (https://creativecommons.org/licenses/by/4.0/).
Share and Cite
Curran-Cournane, F.; Rush, E. Feeding the New Zealand Family of Five Million, 5+ a Day of Vegetables? Earth 2021, 2, 797-808. https://doi.org/10.3390/earth2040047
Curran-Cournane F, Rush E. Feeding the New Zealand Family of Five Million, 5+ a Day of Vegetables? Earth. 2021; 2(4):797-808. https://doi.org/10.3390/earth2040047
Chicago/Turabian StyleCurran-Cournane, Fiona, and Elaine Rush. 2021. "Feeding the New Zealand Family of Five Million, 5+ a Day of Vegetables?" Earth 2, no. 4: 797-808. https://doi.org/10.3390/earth2040047
APA StyleCurran-Cournane, F., & Rush, E. (2021). Feeding the New Zealand Family of Five Million, 5+ a Day of Vegetables? Earth, 2(4), 797-808. https://doi.org/10.3390/earth2040047