4.1. Impact of EVFCF Utilization
This subsection discusses the implementation of the proposed solution that incorporates alternative fuel grades over a 30-day billing period across three
EVFCFs situated in different United States metropolitan areas: Austin, Seattle, and Boston. Each
EVFCF is equipped with
chargers, each with a charging capability of 350 kW. The operational data for these multi-charger
EVFCFs are derived from aggregating metropolitan area-specific, single-charger facility utilization data following the methodology described in
Section 3.6.
The selection of
EVFCFs operating in the three metropolitan areas captures a diverse range of real-world
EVFCF utilization scenarios across the United States.
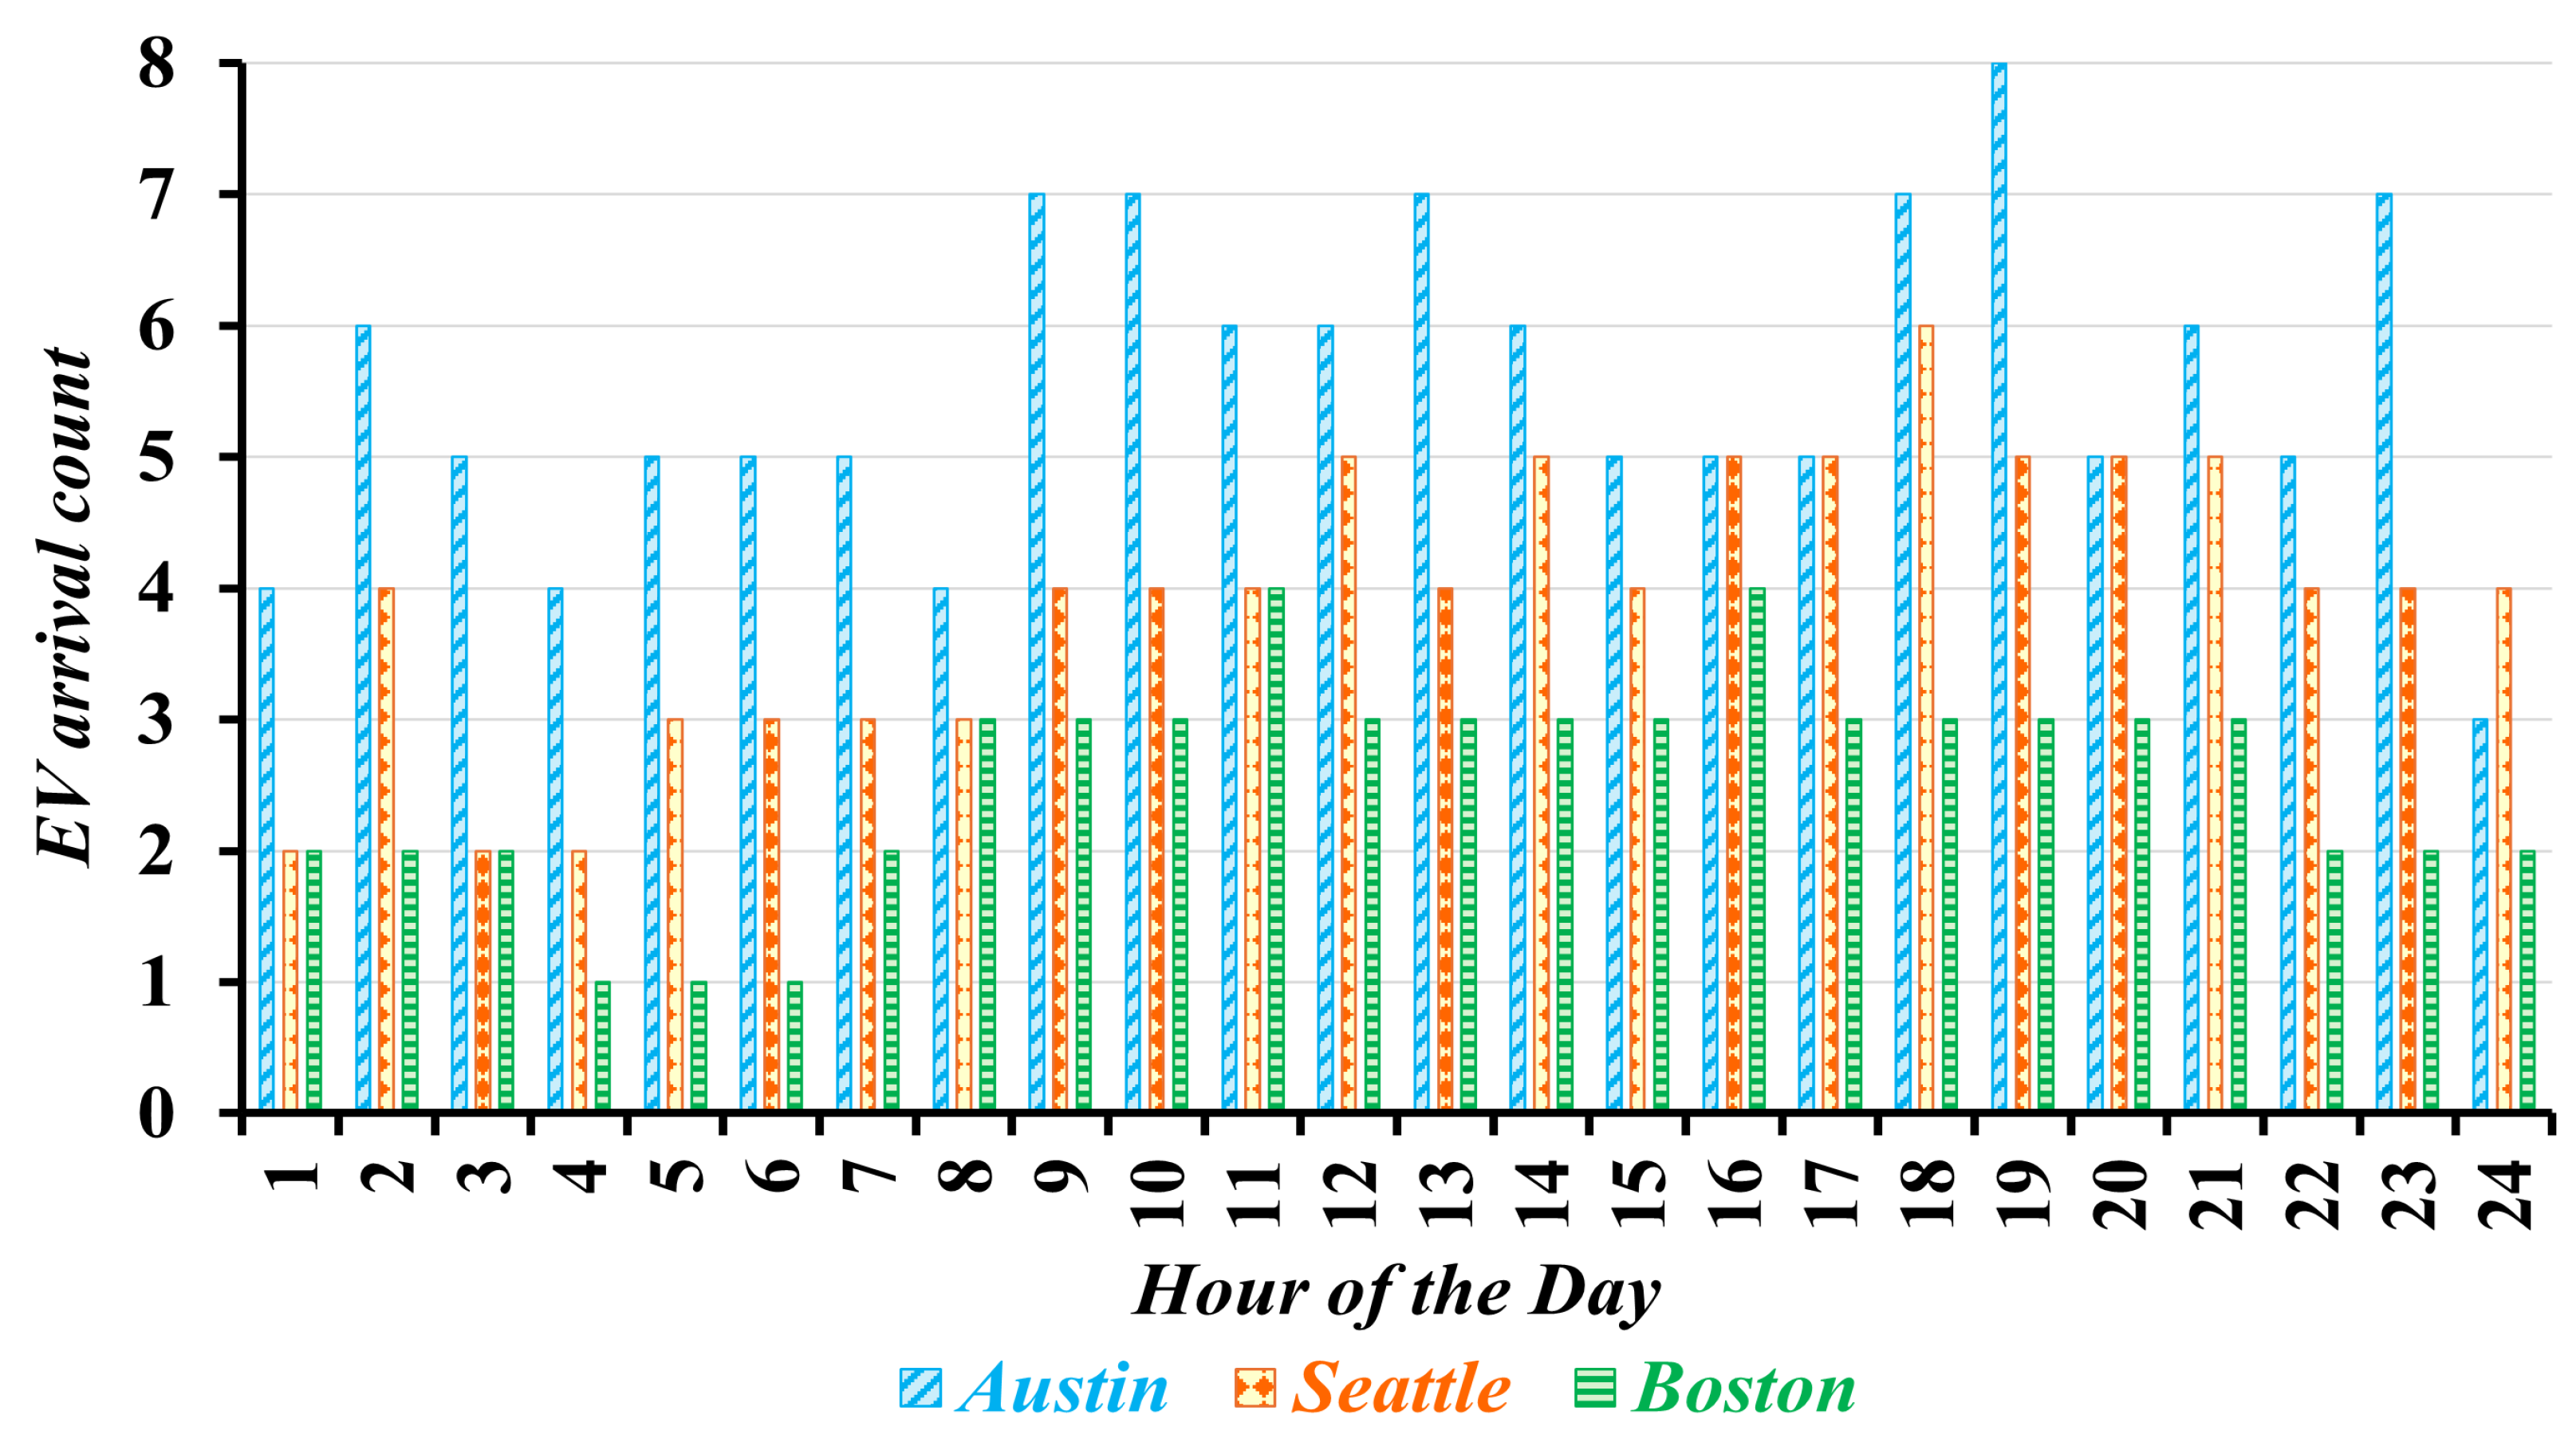
Figure 2 displays the maximum number of hourly
EV arrivals at three
EVFCFs. It shows that the
EVFCF in Boston represents a low utilization scenario, with a maximum of 61 daily
EV arrivals. In contrast, the
EVFCF in Austin experiences a significantly higher number of daily arrivals, reaching up to 133, indicating a high utilization scenario. The
EVFCF in Seattle, with a maximum of 95 daily
EV arrivals, falls into a medium utilization scenario.
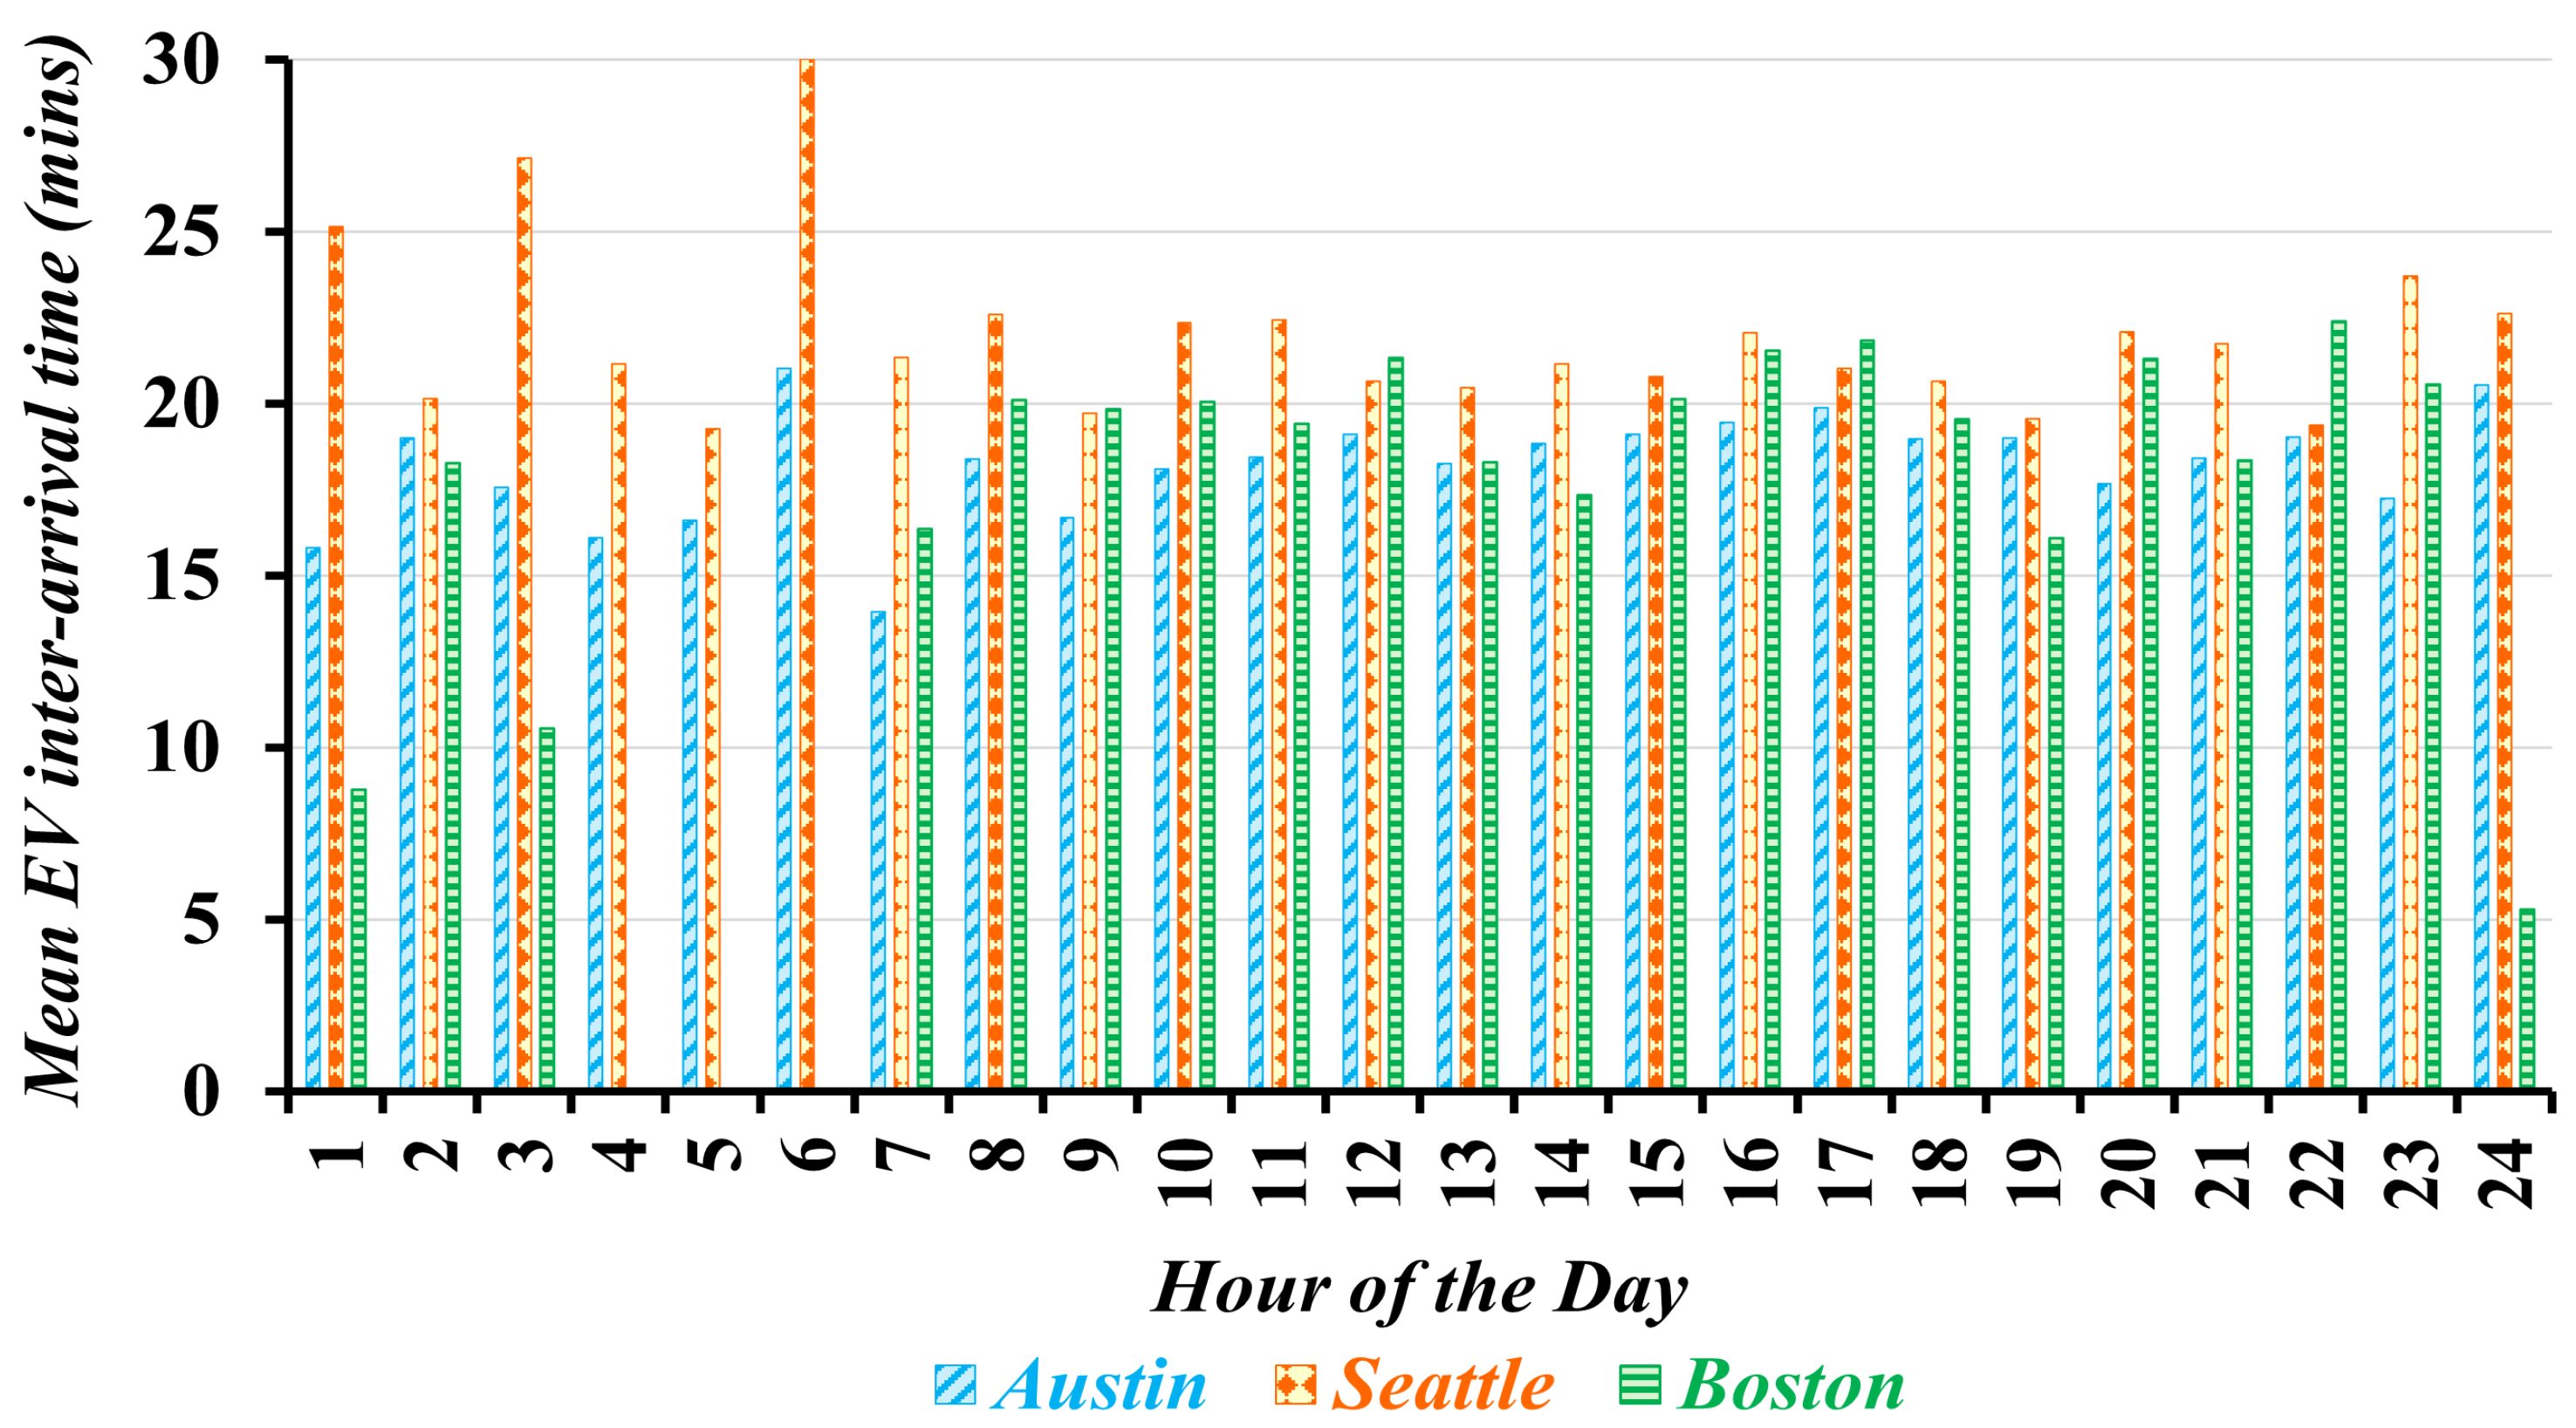
The mean time between consecutive
EV arrivals throughout the day at the three
EVFCFs is presented in
Figure 3. As such, at the charging facilities in Austin and Boston, the
EV inter-arrival times are shorter compared with those at the Seattle
EVFCF, resulting in a higher number of simultaneous
EV arrivals at these facilities. Notice that the occurrence of 0 min inter-arrival times for certain
EVFCFs during specific hours highlights instances where no more than one
EV is expected to arrive at the charging station during those hours.
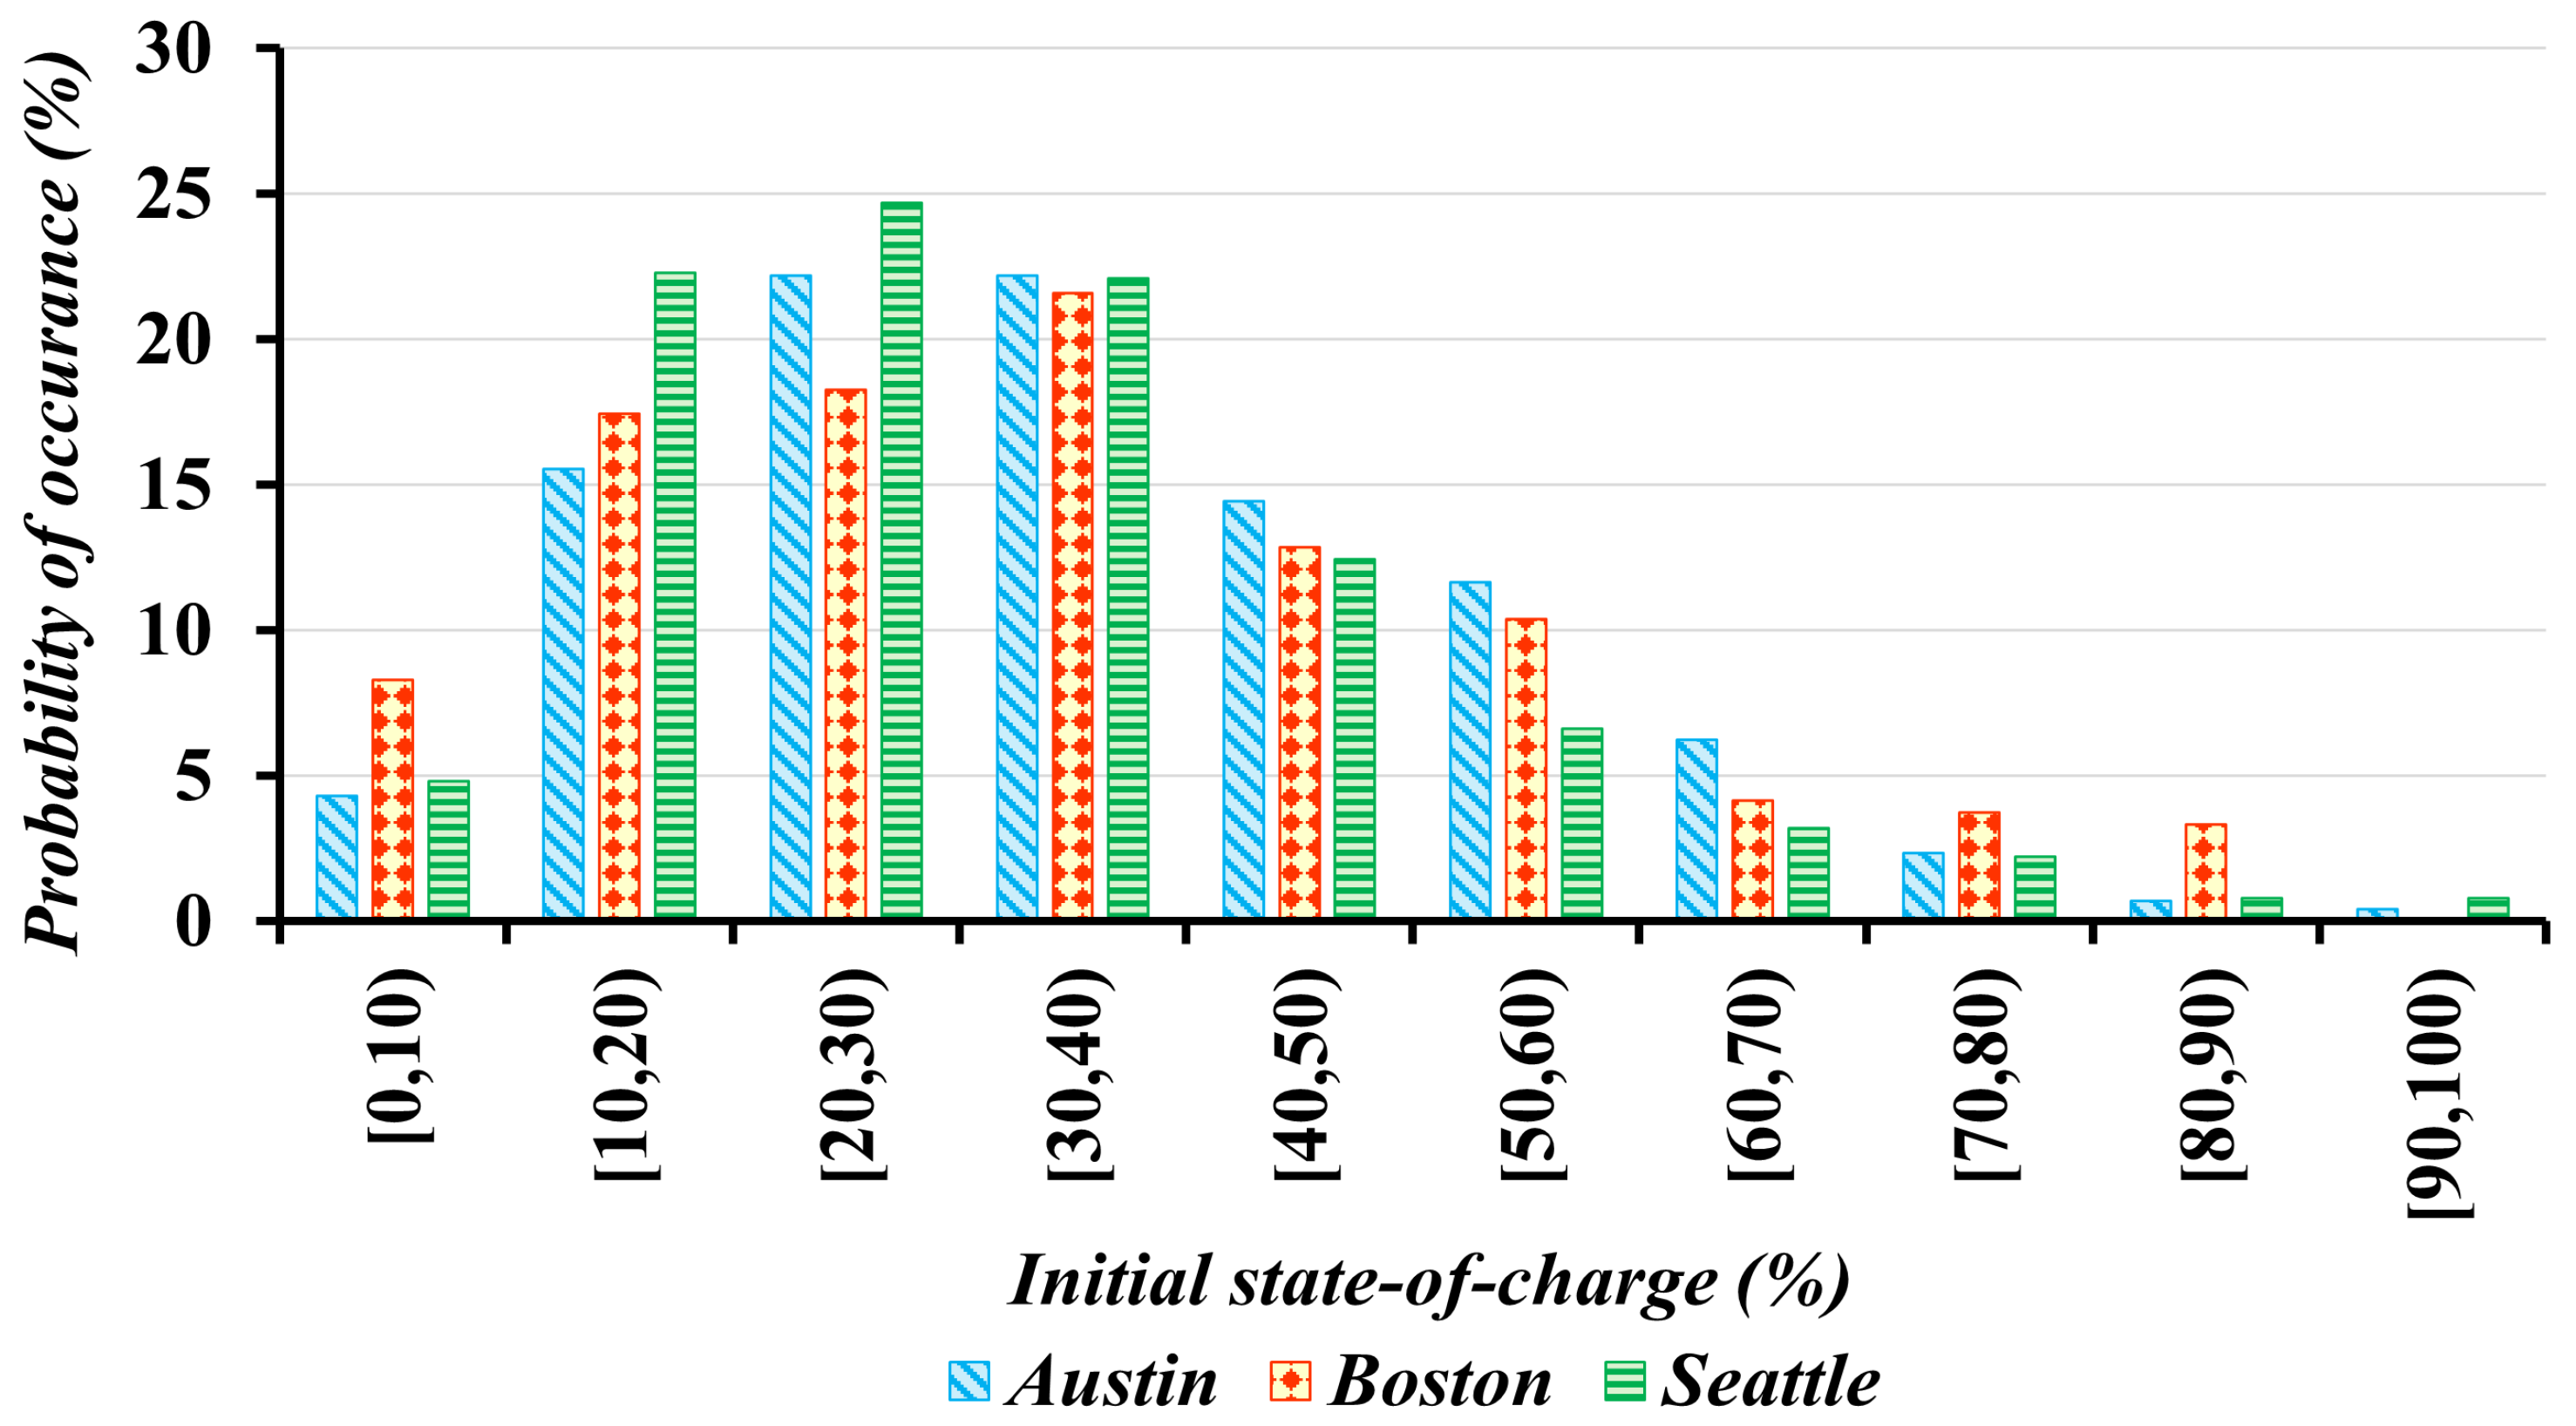
The initial and desired states of charge of the visiting
EVs during each hour of the day exhibit similar patterns across all simulated
EVFCFs. For instance,
Figure 4 shows the distribution of initial states of charge of
EVs visiting the three representative
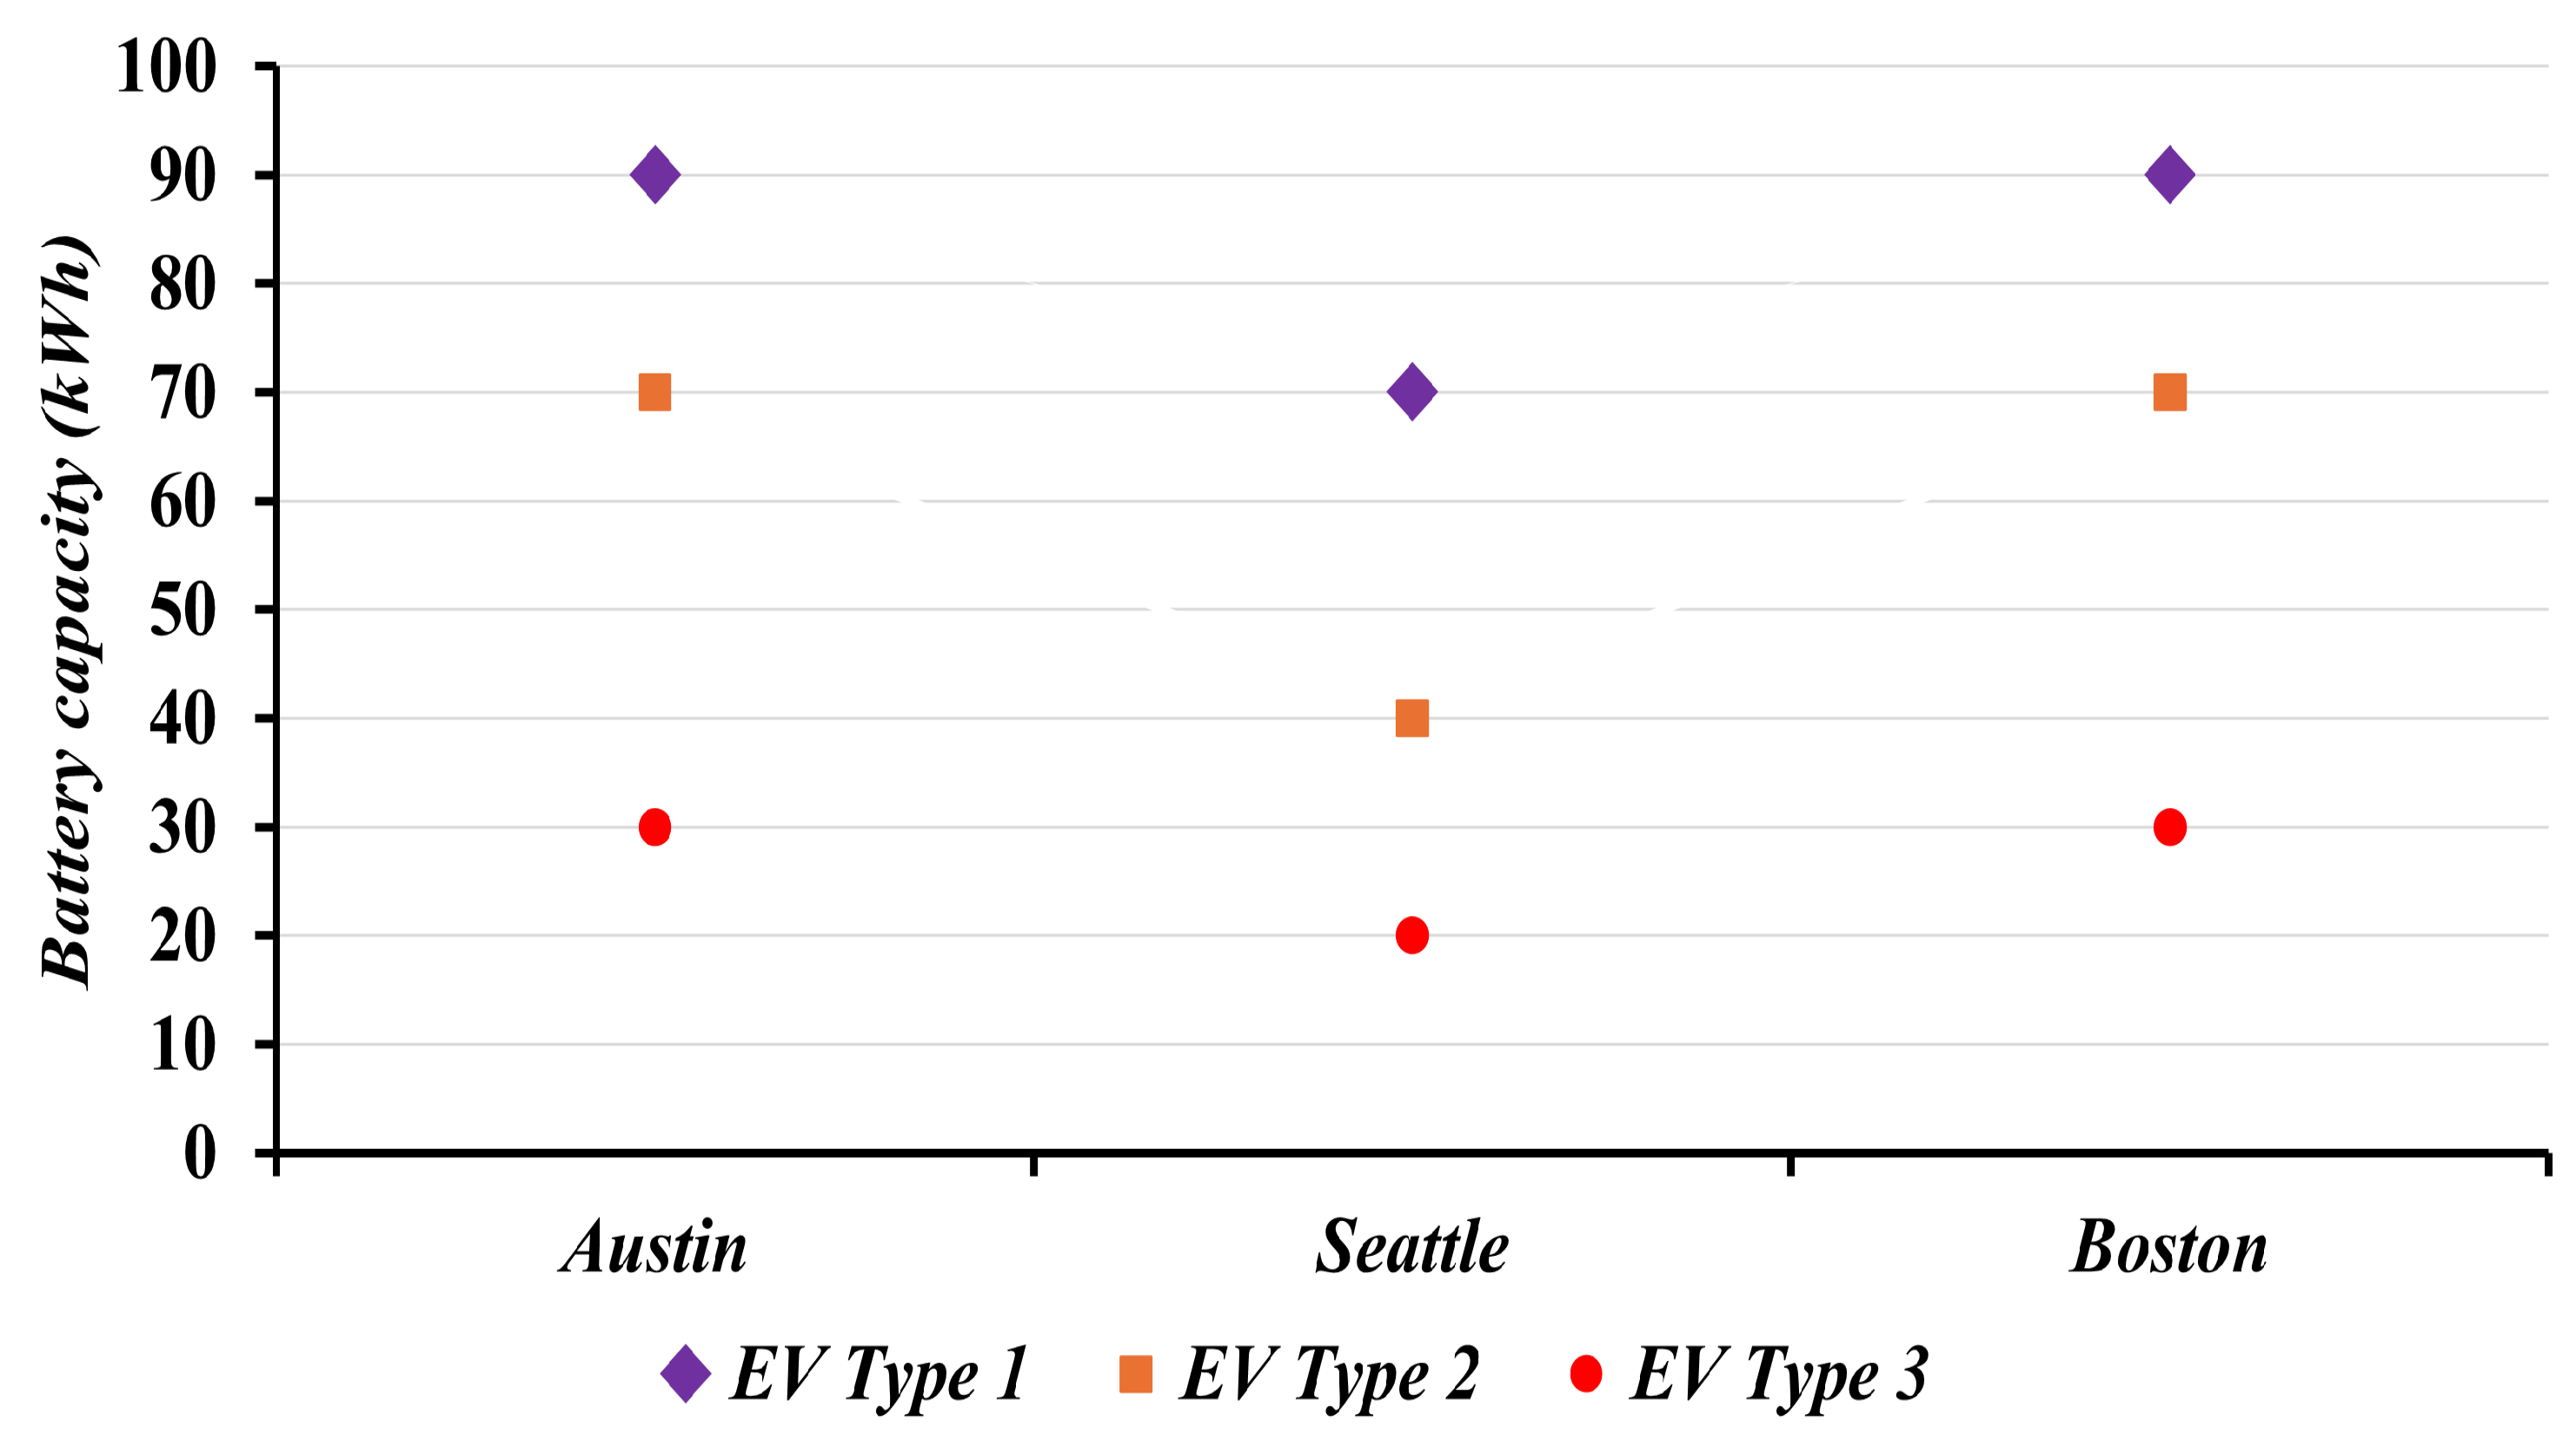
EVFCFs between 6:00 and 7:00 p.m. In addition, the three different types of
EVs, characterized by their battery capacities, that are likely to visit each
EVFCF are presented in
Figure 5.
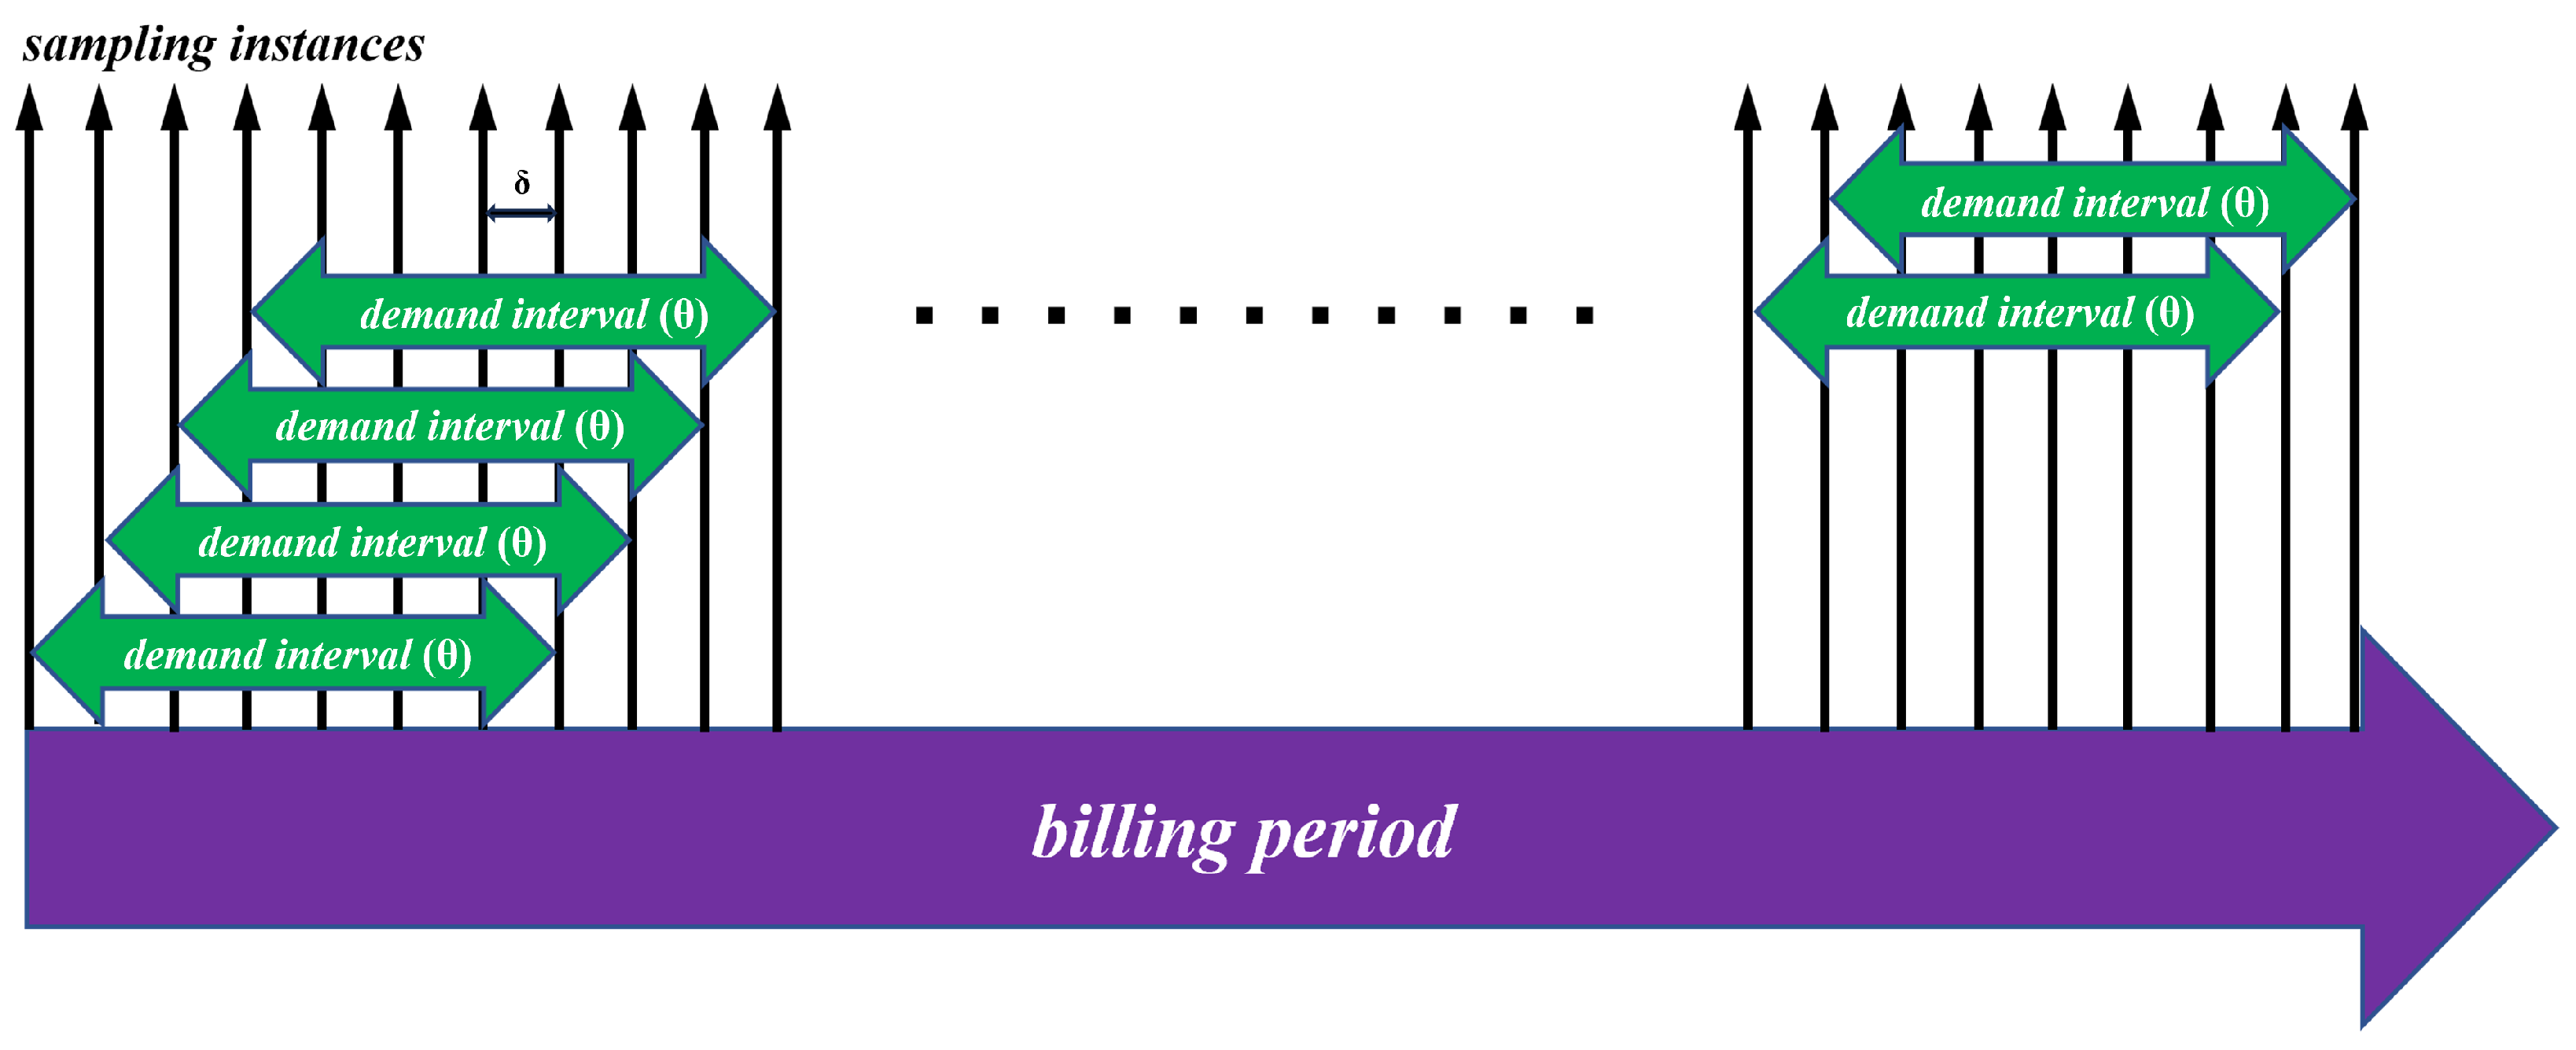
For simulation purposes, each day in the billing period is considered independent and identical, with the day divided into 24 1-h sub-intervals. The time duration between two sampling instances (
) is set to 1 min, and the demand interval duration (
) is 30 min, which is typical for utilities across the United States [
45]. Moreover, following [
46], it is assumed that if an
EV arrives at the
EVFCF and finds no available charging spot, it waits for up to 5 min for a spot to open. If no spot is available after this waiting period, the
EV leaves the
EVFCF.
Since the focus is on the impact of the proposed solution across different
EVFCF utilization scenarios, the prices for the three components of the
EVFCFs’ electricity bill are held constant. These prices are specified according to the electric service rate schedule outlined in [
47] for a large commercial customer in Boston (Schedule G-3), and are summarized in
Table 1.
The three alternative fuel grade options offered at each
EVFCF, along with their respective power supply levels, are presented in
Table 2. Since the impact of user selection of an alternative fuel grade option is not studied in this subsection, it assumes that
(constant) for all
, and consequently, the selection of each alternative fuel grade is equally probable, i.e.,
for all
.
With
CC, when no alternative fuel grade option is available, the charging service price
USD/kWh, which represents the average charging service price offered by
EVFCFs in the United States [
48]. When alternative fuel grades are offered, with
MC, the charging service price is linearly discounted for grades corresponding to lower power supply levels.
To evaluate the effectiveness of the proposed solution in these varied environments, the benefits-to-cost ratio (
BCR) and the percentage change in operational profits (%
) due the deployment of the proposed solution for each simulation run are calculated. To that end, the reduction in
EVFCF’s operational revenue compared with its revenue under
CC, due to offering charging service at a reduced per-unit price for alternative fuel grades with lower power supply levels, constitutes the net costs of implementing the proposed solution. On the other hand, the reduction in
EVFCF’s operational costs caused by the reduction in its maximum mean power demand indicates the net benefits of the proposed managed charging solution. The benefits-to-costs ratio (
BCR) is then the ratio of the reduction in operational costs to the reduction in operational revenue of an
EVFCF in a given billing period. The percentage change in operational profits (%
) is the ratio of the difference between the operational profits with
MC and
CC to the
EVFCF’s absolute operational profits with
CC. Mathematically, for each simulation run, the
BCR and
are calculated as follows:
A total of 500 simulations are performed at each
EVFCF, with each simulation representing 1 month
EVFCF operations. For a simulation run, the number and attributes of visiting
EVs—including their arrival time, battery capacity, initial and desired states of charge, and selected alternative fuel grade—are randomly generated following the methodology outlined in
Section 3.6. The energy required to uplift
EV j’s state of charge from its initial (
) to the desired value (
) is then furnished by the
EVFCF within the time constraints defined by the mathematical expressions presented in
Section 3.4.
To initiate the analysis, the first simulation run at the three
EVFCFs is comprehensively discussed. A total of 2031, 1384, and 969
EVs were generated in this simulation run at the Austin, Seattle, Boston
EVFCFs, respectively. Statistics on proportion of
EVs that requested different values of energy demand, their type defined by the battery capacity, and their selected alternative fuel grades are presented in
Table 3.
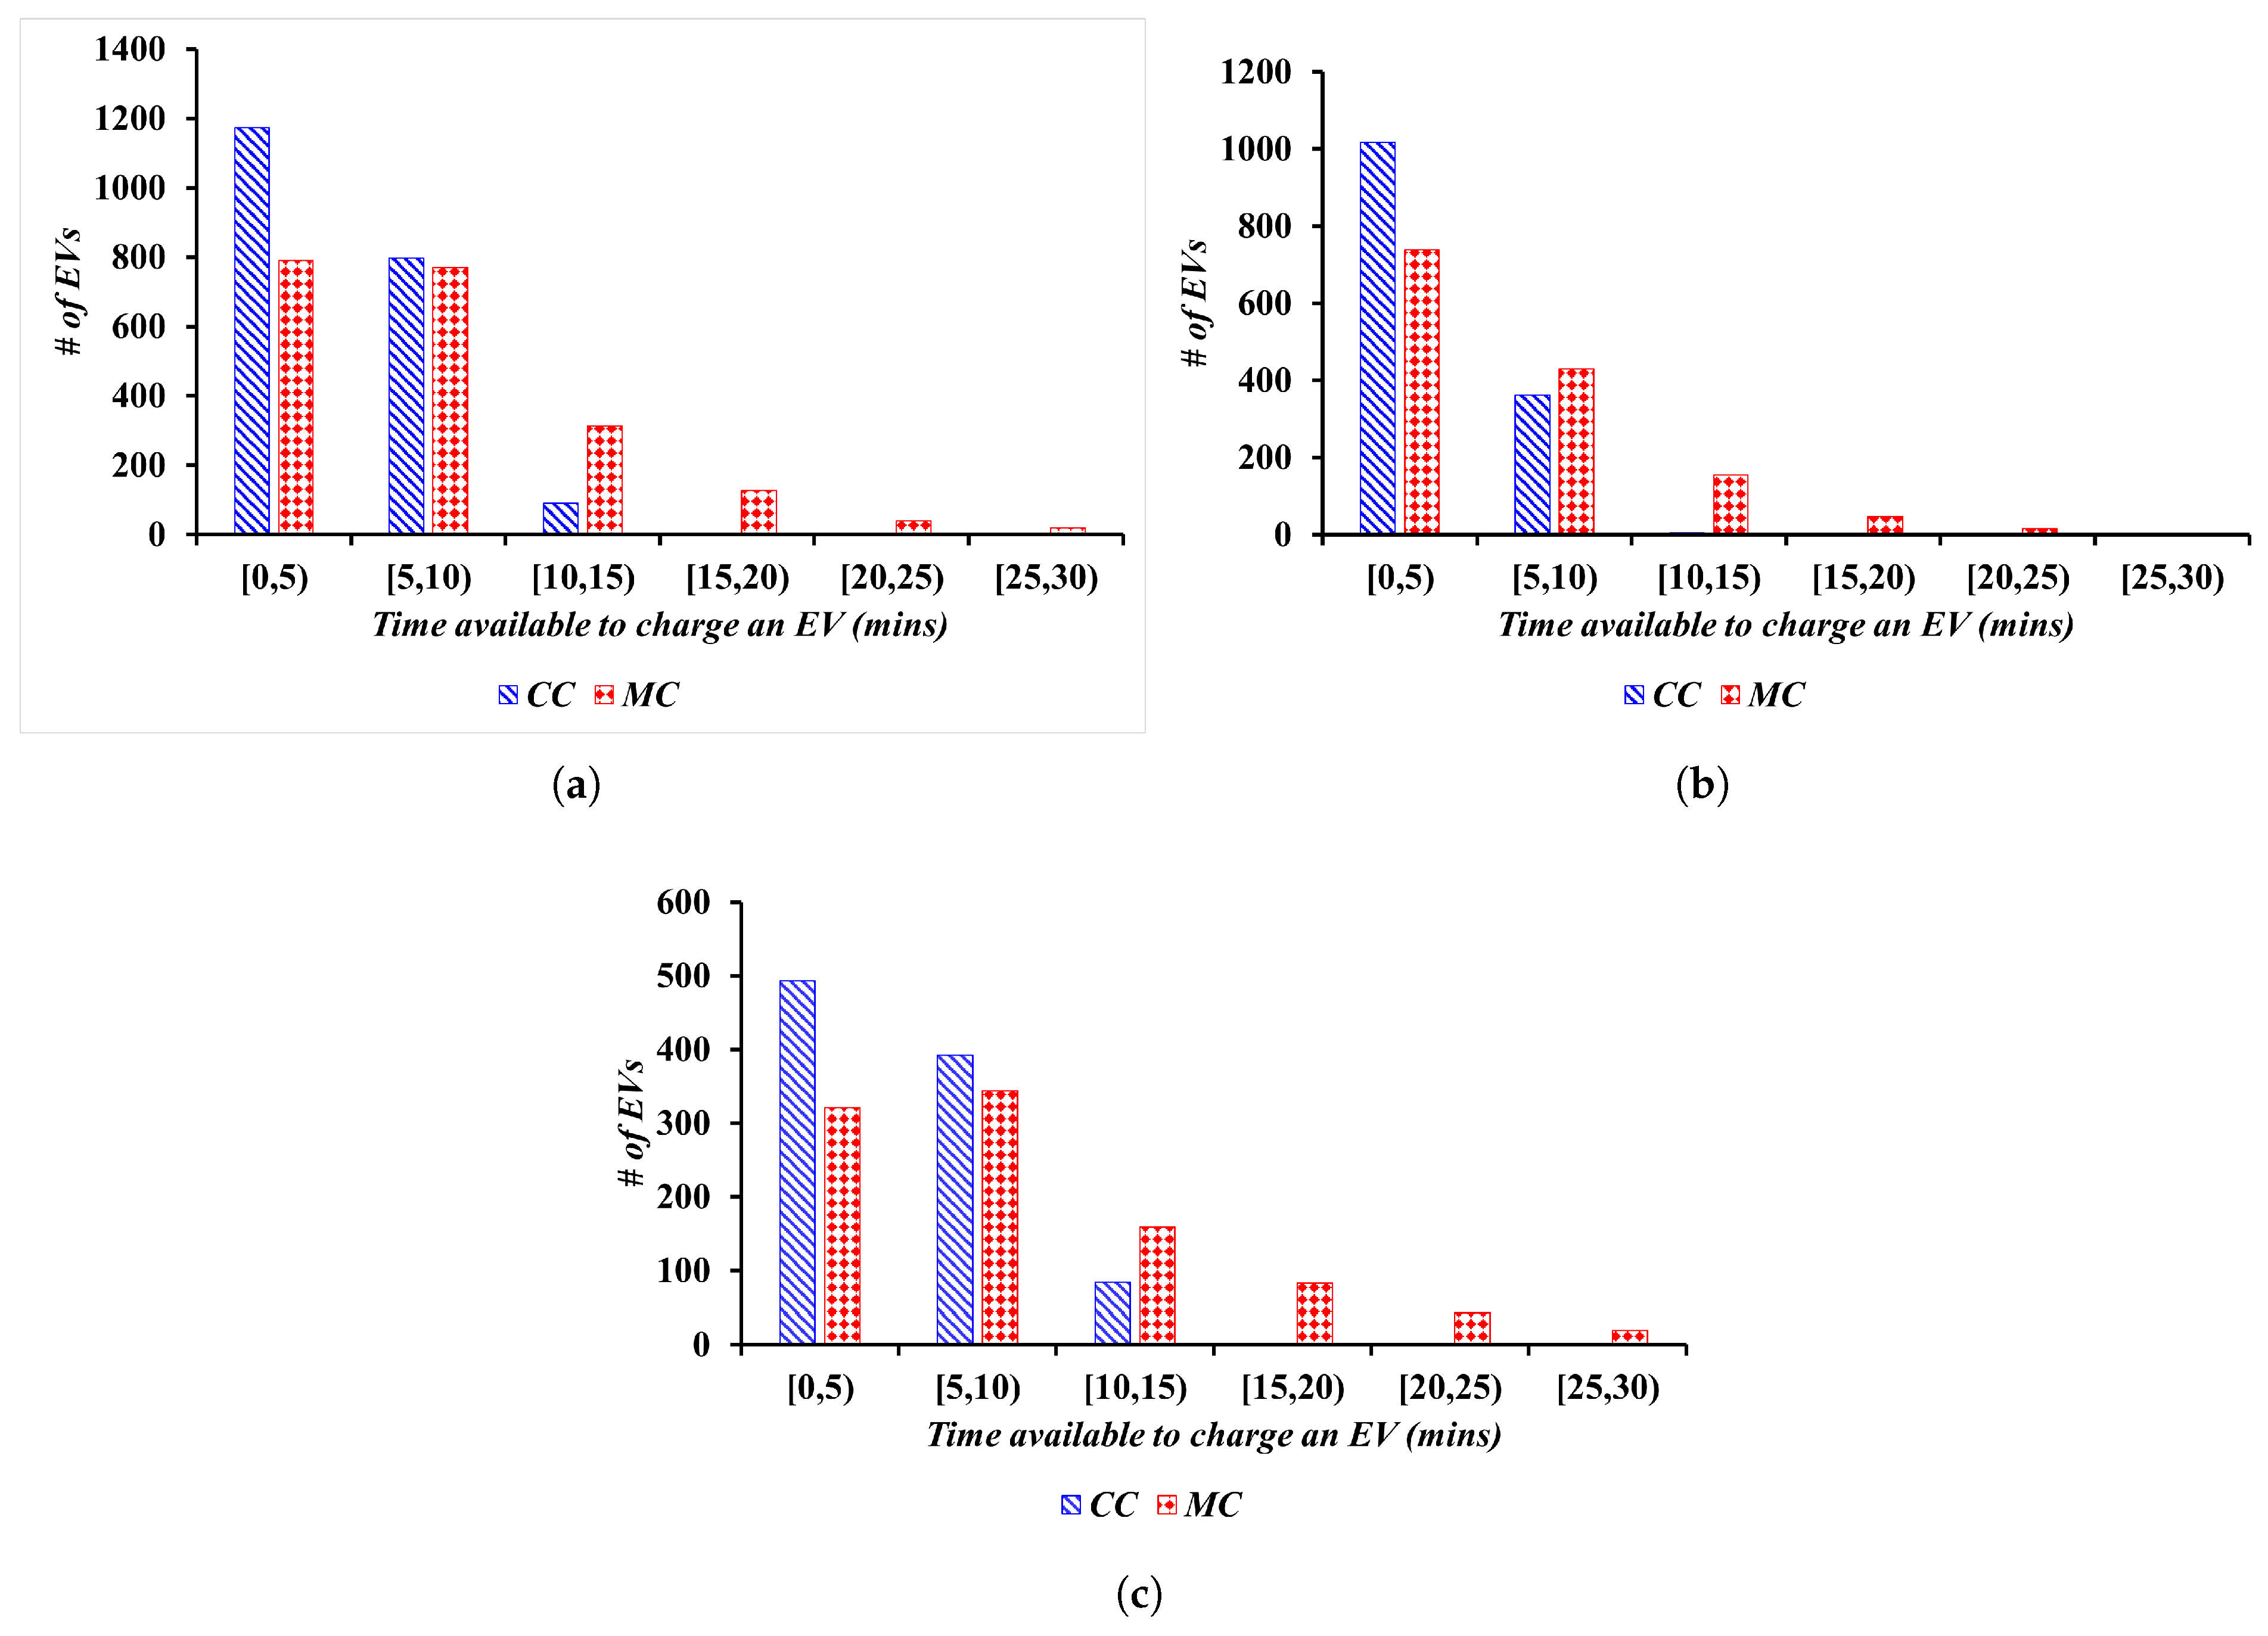
Figure 6 compares the time available to the
EVFCF under
CC and
MC to charge the visiting vehicles. On average, with
MC, each
EV provides approximately 5 min additional time to uplift their state of charge from its initial to desired value, compared with
CC at the three
EVFCFs.
The
EVFCFs’ maximum mean power demand, the operational revenue, the cost and profit with
CC and
MC, the benefit-to-cost ratio, and the percentage change in operational profit for the first simulation run are reported in
Table 4. Although the
EVFCFs experience a reduction in operational revenue due to offering the charging service at a lower per-unit price, the implementation of the proposed solution results in significant operational cost savings. This results in
BCR values greater than one across all the three
EVFCFs. In this simulation, the
EVFCFs operating in Austin, Seattle, and Boston achieve operational profit increases of 1.5%, 14.3%, and 79.8%, respectively, by adopting the proposed solution. While
and the consequent
are substantial at both the Austin and Boston
EVFCFs, their contribution to
is notably lower in Austin. This is due to a higher number of
EVs visiting the Austin facility, resulting in a greater
. These findings suggest that managing
EV charging at
EVFCFs is a promising solution in all facility utilization scenarios, but its impact will be particularly greater at facilities with lower
EV arrivals—a scenario that is more prevalent at most
EVFCFs in the United States particularly during the early stages of
EV adoption.
Ninety-five percent confidence limits around the means for the 500 simulations are presented in
Table 5. These results indicate that
exceeds
by 31 ± 5%, 51 ± 6%, and 131 ± 10%, and
equals 5.3 ± 3.145%, 20.3 ± 8.38%, and 25.9 ± 8.64% at the three facilities, respectively, demonstrating the effectiveness of the proposed solution under all utilization scenarios. In addition, it is observed that the increase in profits is inversely related to the facility utilization rates. As facility utilization increases, the relative impact of cost savings from reducing demand peaks diminishes. This occurs because, at higher utilization levels, the reduction in operational revenues outweighs the cost savings. These findings suggest that, at
EVFCFs that experience a low utilization, higher charging service price discounts can be offered to the visiting
EVs while still being able to generate additional operational profits with
MC.
Figure 7 displays the reduction in maximum mean power demand (
) at the three
EVFCFs. On average,
is higher in Austin and Boston compared with Seattle, indicating that, in addition to the number of daily
EV visits, the time between consecutive
EV arrivals is another key factor influencing the outcomes. At the Austin and Boston facilities, the time between consecutive
EV arrivals is shorter, as shown in
Figure 3, resulting in a higher number of simultaneous
EV visits. Effectively managing charging profiles at these
EVFCFs leads to a greater reduction in the maximum mean power demand. This in turn yields a correspondingly higher improvement in operational profits, indicating that the proposed solution offers more promising results at such
EVFCFs.
4.2. Impact of Maximum Demand Prices
As described by the mathematical expressions in
Section 3.3, an
EVFCF’s operational cost—and consequently its operational profit—is directly proportional to the maximum demand price. To assess how variations in maximum demand prices affect the feasibility of the proposed solution, this subsection expands on the operations of
EVFCFs discussed in the previous subsection. Specifically for simulation purposes, maximum demand prices are varied between USD 5 and USD 45 per kW, based on the range of these prices reported in the State of Massachusetts (as outlined in [
49]), with price steps of USD 2.5 per kW. For each maximum demand price, 500 simulations are conducted to evaluate the impact on the
EVFCF’s performance.
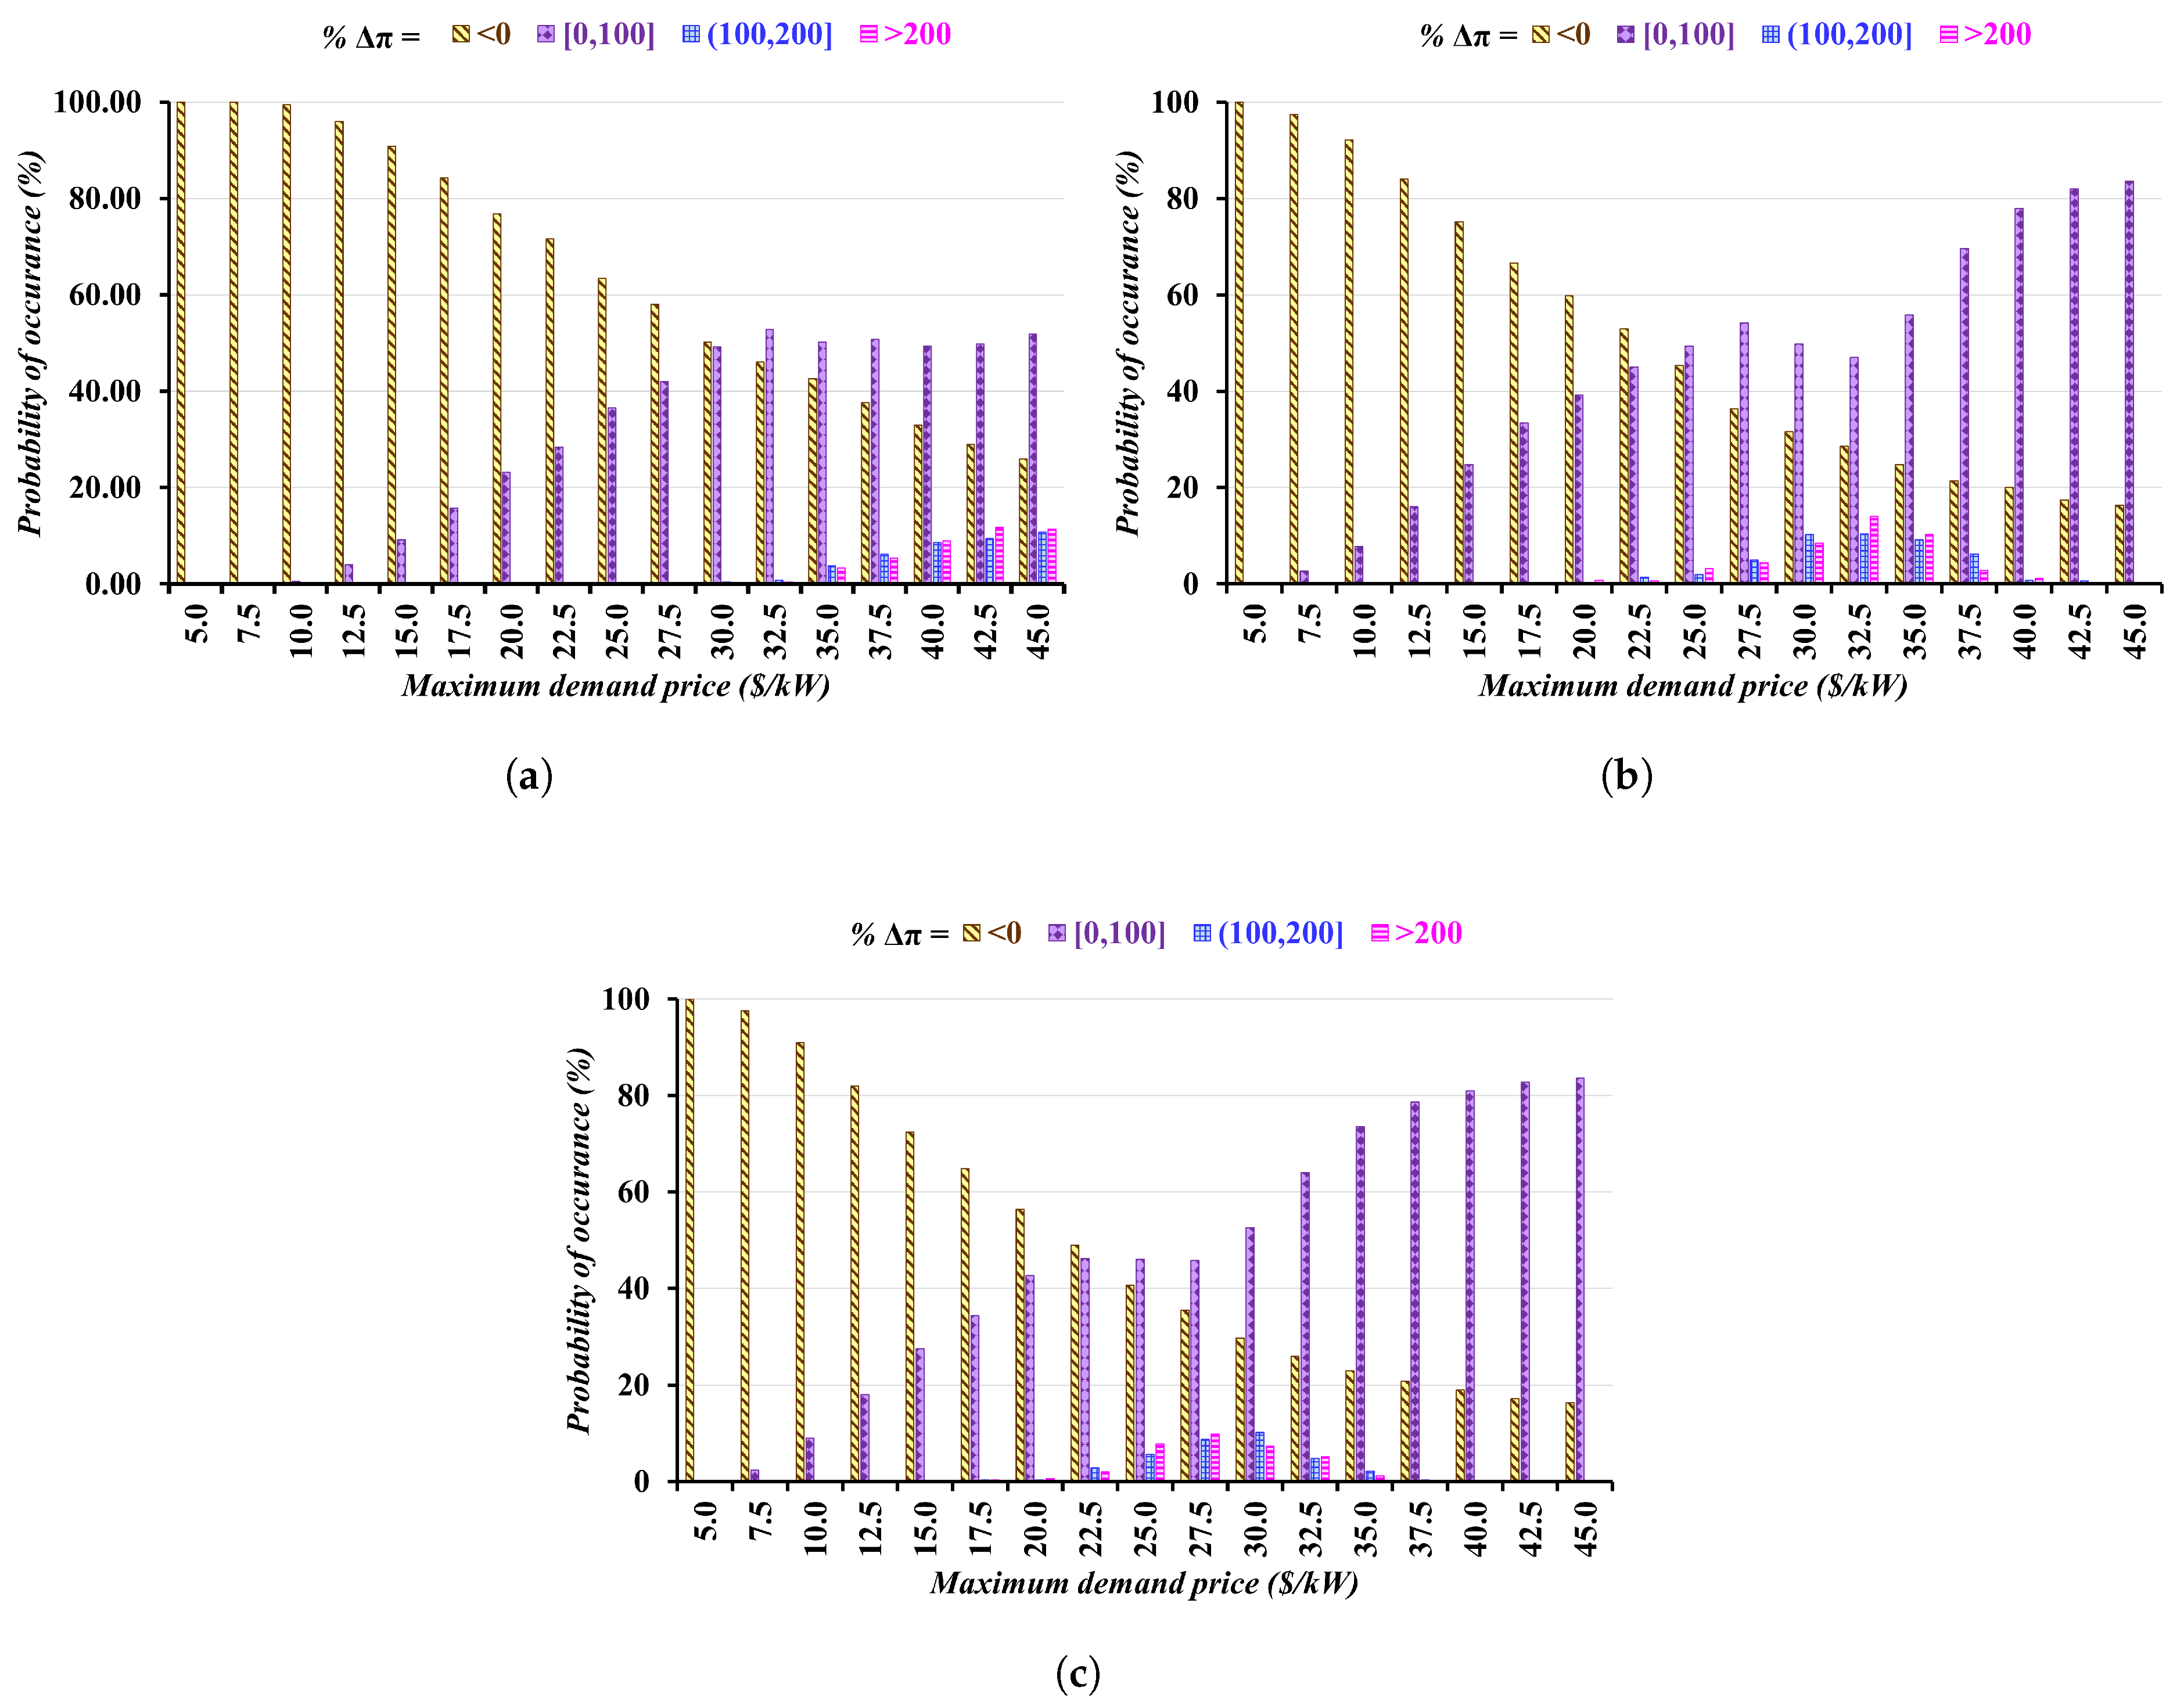
The results from these simulations show that the feasibility of the proposed solution increases proportionally with higher maximum demand prices, regardless of the facility utilization scenario. As illustrated in
Figure 8, at low maximum demand prices, 100% of the simulations conducted report a decrease in operational profits when deploying the proposed solution at all three
EVFCFs. However, this infeasibility changes significantly as maximum demand prices rise. When these prices reach USD 45 per kW, 84% of the simulations at the
EVFCFs operating in Boston and Seattle and 74% of the simulations at the Austin
EVFCF render an increase in operational profits.
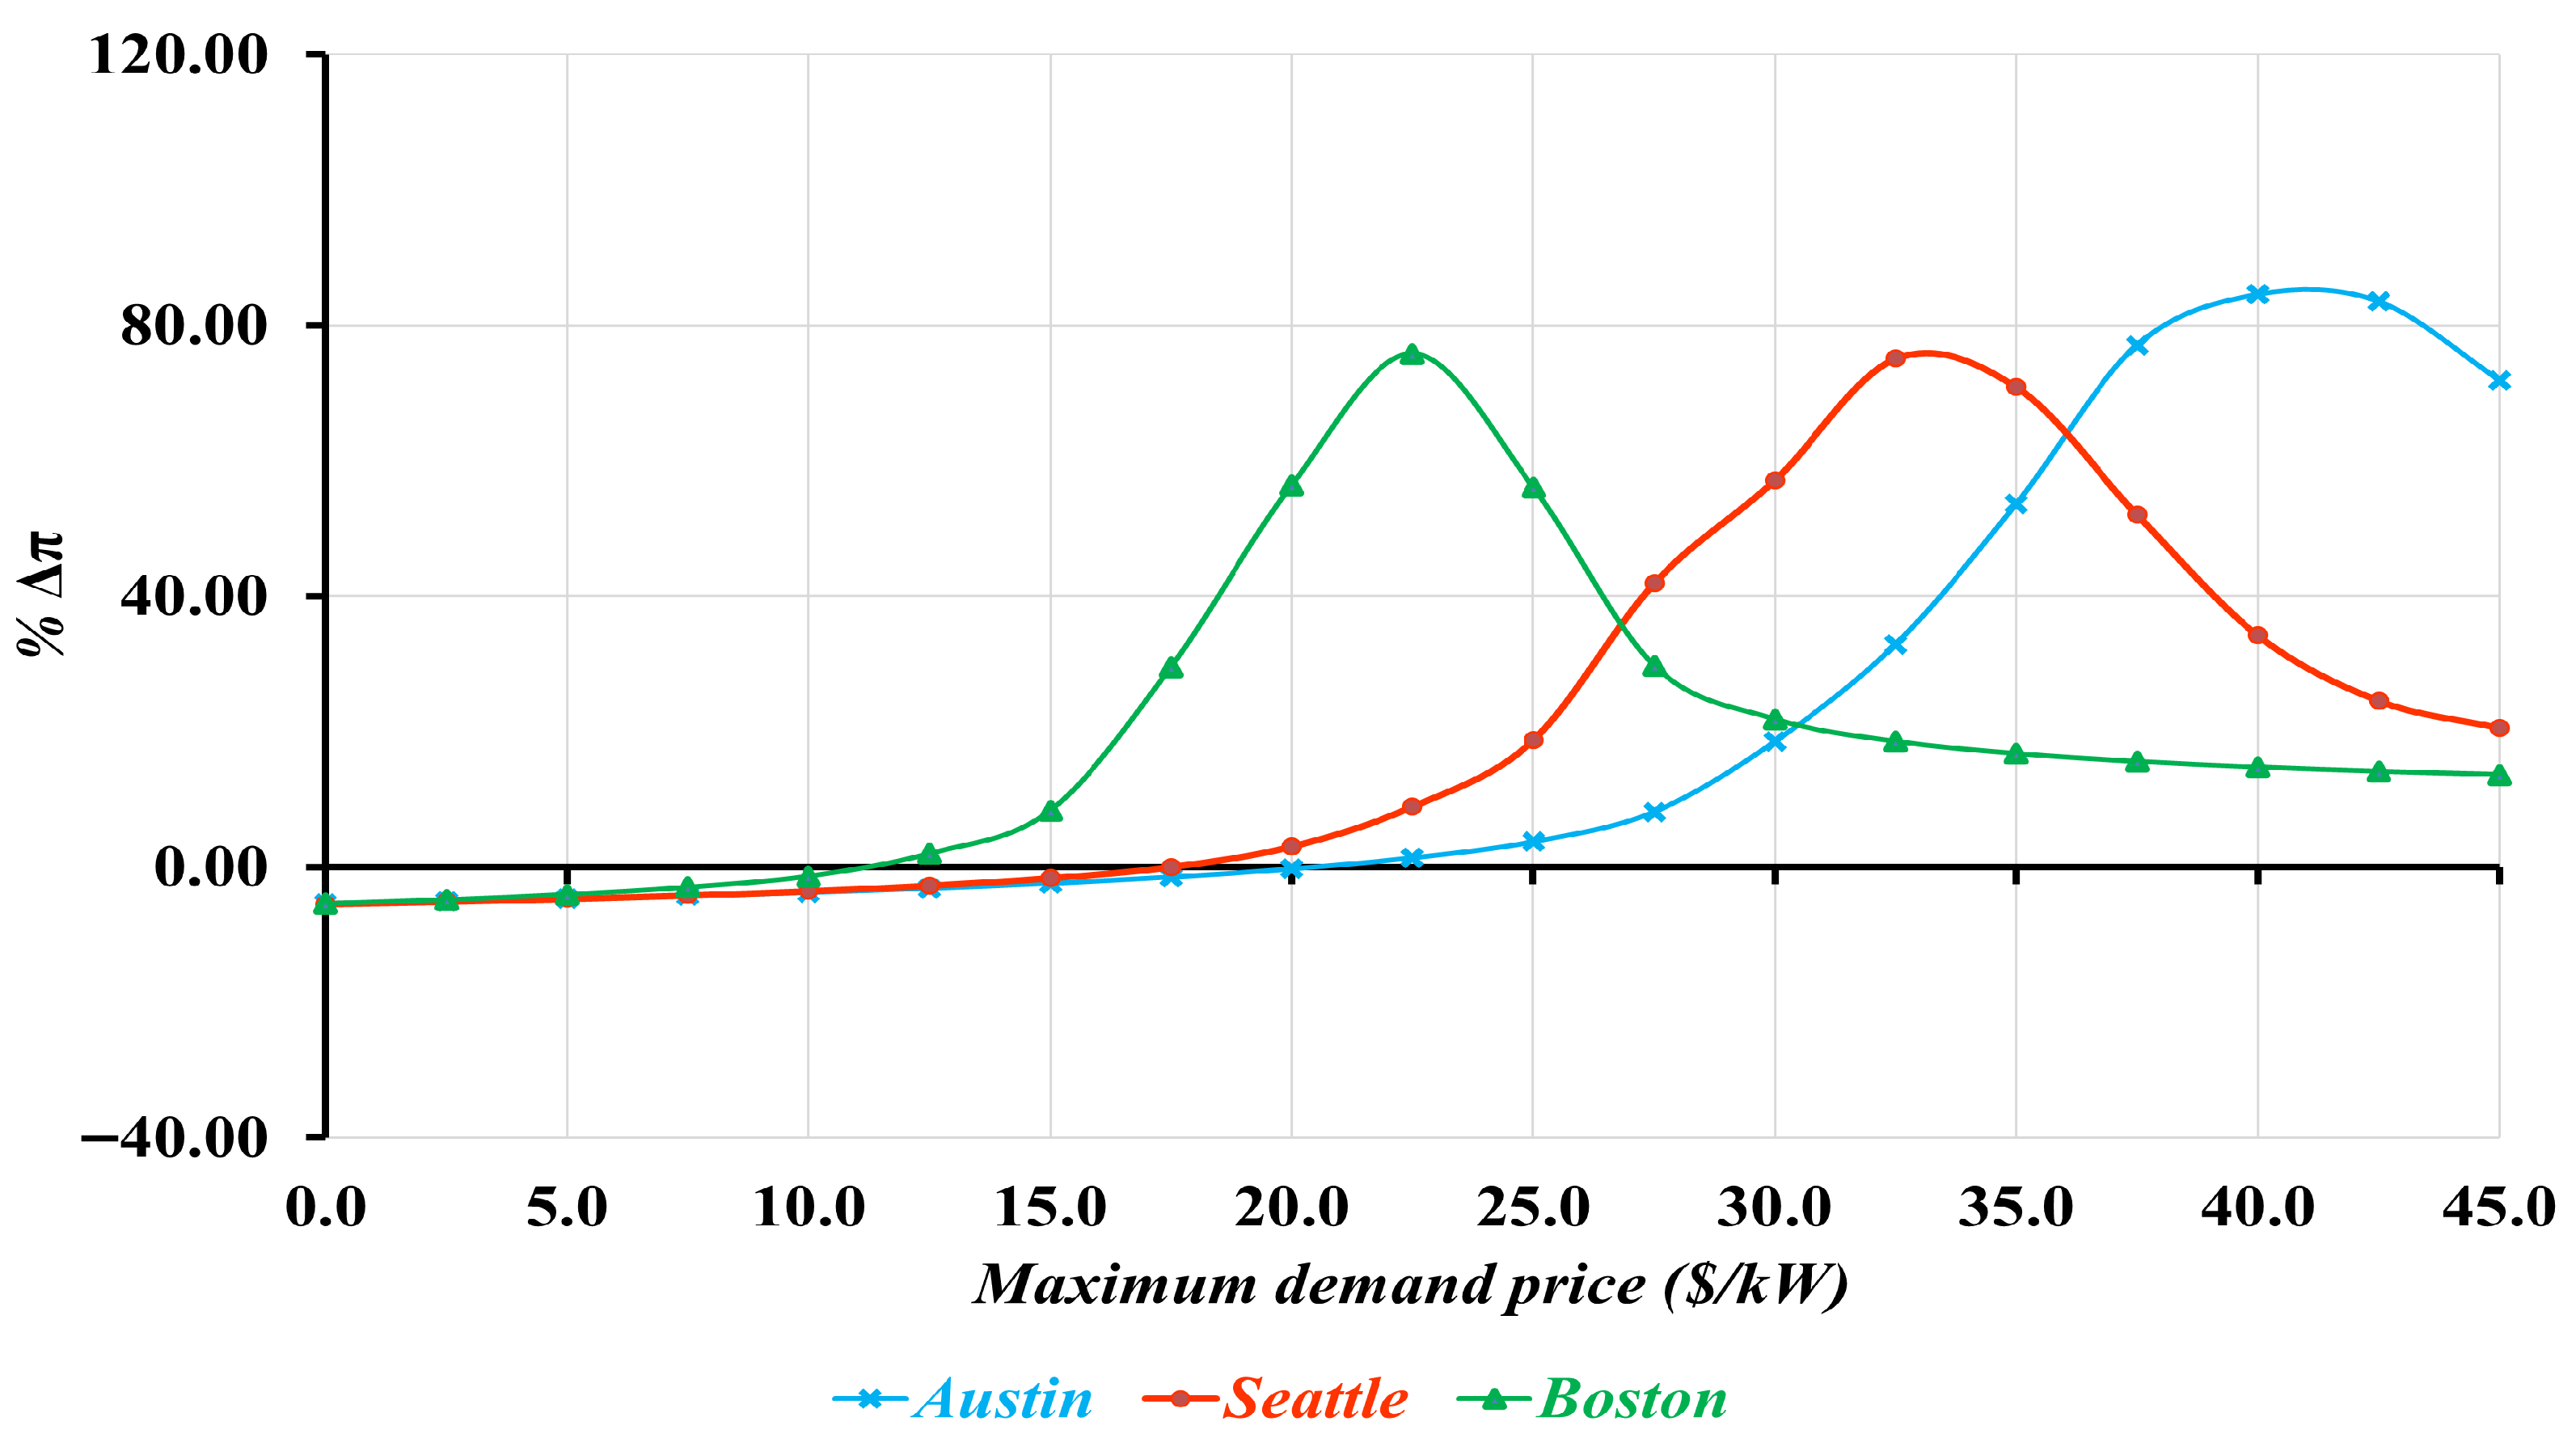
Additionally,
Figure 9 presents the average
of deploying the proposed solution at the three
EVFCFs, calculated over the 500 simulations. While the feasibility of the proposed solution generally increases with rising maximum demand prices,
decreases after reaching its optimal values, which occur at maximum demand prices of USD 22.5, USD 32.5, and USD 40 per kW for
EVFCFs in Boston, Seattle, and Austin, respectively. Although
remains positive beyond these points, it declines to approximately 10% as maximum demand prices are further increased. This is because, at higher maximum demand prices, the operational costs of the
EVFCFs become so significant that reduction in maximum mean power demand contributes only a small amount to recovering these costs. This trend suggests that, while the proposed solution will be effective as maximum demand prices increase, at excessively high maximum demand prices, the
EVFCFs incur such significant losses that clipping demand peaks results in only minimal recovery of those losses. Consequently, it can be argued that the implementation of managed charging solutions that aim to reduce
EVFCF demand peaks may only be applicable in communities where maximum demand prices offered by incumbent electric utilities are not outrageous. When that is the case, commercial EV rate schedules that offer reduced maximum demand prices [
50] may be a more promising alternative to address the
MDPC issue.
4.3. Impact of User Preferences
This subsection analyzes the effectiveness of implementing the proposed solution when user preferences of selecting the various alternative fuel grades, i.e., their selection probabilities, vary. Indeed, users prefer alternative fuel grade options that offer them the most utility, as discussed in
Section 3.5. Thus far, it is assumed that
for all
, resulting in an equal probability of selecting any option.
Two different alternative fuel grade selection cases are considered (see Table 7). Case 1 assumes that the EVFCF is located at sites where users highly prefer cost saving compared with the additional time they would have to spend to replenish the depleted charge of their vehicles. This reflects a case where the EVFCF is located at a grocery store, for example, where users may be running errands while charging and are therefore more willing to allow for longer charging times. In such a setting, will be the highest upon selecting the cheapest alternative fuel-grade option, corresponding to the lowest power supply level, and will scale downwards as the per-unit cost to charge their vehicle increases, i.e., .
In contrast, Case 2 assumes that the EVFCF is located, for instance, along highway corridors, where users are likely to prioritize rapid charging. In this case, will be highest upon selecting the fuel grade with the highest power supply level, resulting in the least time to charge their vehicle, and will decrease as the time required to charge their vehicles increases, i.e., .
This subsection assumes that
is a linear function of the per-unit bill saving
, i.e.,
In the above equation,
and
are explanatory coefficients, and
is calculated as follows:
The explanatory coefficients used to simulate the two cases are provided in
Table 6, while the resulting probabilities for selecting alternative fuel grades are outlined in
Table 7. For both cases, 500 simulations are conducted for the Austin, Seattle, and Boston
EVFCFs, with all other
EV attributes held constant and the probability of selecting different fuel grades varied. The simulation results, reported in
Table 8,
Table 9 and
Table 10, show that the effectiveness of the proposed solution is consistently and considerably higher when implemented at
EVFCFs where users are more likely to prioritize rapid charging. As such, while the reduction in maximum mean power demand is generally greater in Case 1 across regions, leading to a higher
, the
EVFCF also faces a higher
as more users opt for the cheaper fuel-grade options, which outpaces the cost reduction. Hence, the
BCR significantly increases when transitioning from Case 1 to Case 2 and the simulation results show that the proposed solution will render higher benefits to
EVFCFs where a higher share of
EV users will select alternative fuel-grade option corresponding to the higher power demand levels.
