Article

An Introduction to “Alternative Fuel Grades” for Electric Vehicle Fast Charging

by
Muhammad Talal Khalid
1,*,
Marisol Velapatiño Benito
2,
Arin Rzonca
1 and
Ann-Perry Witmer
1,*
1
Department of Electrical and Computer Engineering, University of Illinois Urbana Champaign, 306 N Wright St, Urbana, IL 61801, USA
2
Department of Physics, University of Illinois Urbana Champaign, 1110 W Green St Loomis Laboratory, Urbana, IL 61801, USA
*
Authors to whom correspondence should be addressed.
Electricity 2025, 6(4), 62; https://doi.org/10.3390/electricity6040062
Submission received: 24 September 2025 / Revised: 20 October 2025 / Accepted: 28 October 2025 / Published: 2 November 2025

Abstract

The maximum demand payment component (MDPC) of the electricity bill, which reflects the highest level of power demand during a billing period, is a well-recognized barrier to the feasibility of electric vehicle fast-charging facilities (EVFCFs). While several studies have explored control strategies to mitigate demand peaks, they primarily focus on slow-charging facilities and fail to account for maximum demand prices. On the other hand, the few existing EVFCF-particular strategies overlook the diminished user-desired quality of service caused by the additional charging time needed for demand management. Moreover, their implementations under real-world conditions also remain unexplored. To address these issues, this work proposes a managed charging solution that explicitly considers the impact of maximum demand prices while maintaining user-desired quality of service, and implements it under real-world conditions in three different metropolitan areas in the United States. Simulation results indicate that the proposed solution can increase an EVFCF’s operational profits by 5–26% compared with conventional charging methods. The findings also highlight that the outcomes of the proposed solution are significantly influenced by the EVFCF utilization rate, the time between consecutive EV arrivals, the incumbent electric utility-specified maximum demand prices, and the user preferences of selecting the various “alternative fuel-grade options” offered at an EVFCF. These findings could pave the way for a more informed deployment of managed charging solutions at EVFCFs, thereby accelerating equitable transition to transportation electrification.

1. Introduction

The adverse impacts of climate change due to greenhouse gas (GHG) emissions have led federal, state, and local governments in the United States to effectively consider alternatives with a lower carbon footprint [1]. According to the United States Department of Energy, in 2022, the transportation sector contributed 28% to the total United States GHG emissions, surpassing the 25% contribution of the electricity generation sector [2]. Among the most promising initiatives to reduce GHG emissions from the transportation sector is its electrification by the deployment of electric vehicles (EVs) to displace internal combustion engine vehicles (ICVs) [3]. A key requirement to promote EV adoption is the implementation of sustainable electric vehicle fast-charging facilities (EVFCFs) in every community [4,5]. Such build-out is needed to overcome range anxiety of would-be EV owners, whose concerns over lack of charging facilities along desired trajectories deter them from making EV purchases [6].
The design and implementation of EVFCFs will play a key role in increasing EV adoption [5,7]. The 2021 Bipartisan Infrastructure Law (BIL) envisions 500,000 EV charging facilities—including slow- and fast-charging facilities (slow-charging facilities are installed with chargers with a power supply capability of 22 kW or less; fast-charging facilities are equipped with chargers with a power supply capability of at least 50 kW [8])—across the United States. BIL dedicates a transformative USD 7.5 billion to achieve this goal by 2030 [9]. A critical component of the dedicated investment is to implement EVFCFs throughout the United States to make EV charging available and affordable to all.
However, multiple researchers have questioned the sustainability of existing EVFCFs [10,11]. Issues related to the long-term operational feasibility of these facilities raise concerns in the vehicle electrification community and among investors. The increased stress on the incumbent electric utility’s grid due to high charging load at EVFCFs necessitates multiple grid upgrades. A part of these induced upgrade costs is recovered by the imposition of the maximum demand payment component (MDPC) of the electricity bill. The MDPC—reflective of the highest level of power demand peaks at EVFCFs during a billing period—is a widely recognized barrier to the economic and financial feasibility of commercial EVFCFs [12,13]. Under this structure, massive peaks in power demand due to multiple EVs charging simultaneously and the correspondingly high MDPC pose a significant challenge to the viability of an EVFCF [14].
To compensate for these costs, facility operators must specify a higher charging service price and/or abandon their business in communities where cost recovery becomes a challenge. These location-specific reactions of EVFCF operators, induced by the MDPC issue, challenge notions of equitable availability and affordability of a fast-charging system in communities across U.S. The burden of the issue will be higher on EV users residing in economically under-served areas and/or multi-unit dwellings who are forced to use commercial EVFCFs to replenish the depleted charge of their EV batteries due to lack of dedicated, private charging facilities. Issues related to range anxiety, low penetration of public charging facilities, and long waiting time at slow-charging facilities can potentially discourage even those with access to private charging from making their EV purchases. Certainly, if not addressed effectively, the MDPC issue can potentially deter multiple communities from equitably transitioning to electrified transportation.
The technical solutions discussed in the literature to address the MDPC issue at commercial EVFCFs include the integration of energy storage systems (ESSs) [15,16], the application of vehicle-to-grid (V2G) technology [17,18], and the implementation of renewable energy generation systems (REGSs) [19,20]. Another option investigated by researchers to mitigate power demand peaks is the formulation and deployment of various power supply control strategies [21,22]. However, such endeavors are mostly restricted to slow-charging facilities where EV users park their vehicles for an extended duration, usually in the order of several hours, allowing facility operators to effectively manage EV charging profiles. On the other hand, the few literature-proposed control strategies at EVFCFs (e.g., [23,24]) rely on facility operators to furnish time flexibility to manage EV charging. Without any compensation scheme, such additional flexibility comes at the expense of a diminished quality of service provided to EV users.
This work extends the existing literature on charge control strategies to mitigate demand peaks at EVFCFs by introducing a managed charging solution, according to which, EVFCFs present visiting EVs with a list of options—the so-called alternative fuel grades—to choose from. Each option corresponds to a power supply level (e.g., 150 kW, 250 kW, 350 kW) and an associated per kWh charging service price. Options with lower power supply levels provide more charging time and are therefore more heavily discounted. The EVFCF then utilizes this additional time to optimally generate a charging profile for each visiting EV with the objective of reducing power demand peaks and the resulting MDPC of its electricity bill.
For example, consider an EVFCF equipped with 300 kW chargers. Suppose that a visiting EV user selects Option “A” that corresponds to a 150 kW power supply level, priced at USD 0.5 per kWh, and demands 50 kWh energy. Accordingly, the time available to the EVFCF to provide the requested amount of energy is 50 · 60 150 = 20 min, and the total cost for the user is USD 25. In contrast, under conventional charging, the time required to fulfill the energy demand at the maximum charger capability is 50 · 60 300 = 10 min, and the total cost to recharge given a service price of USD 0.6 per kWh for the user will be USD 30. By offering price discounts, the EVFCF effectively purchases time flexibility, which is then utilized in a managed charging algorithm to reduce power demand peaks, resulting in operational cost savings for the EVFCF.
Since the choice made and the additional flexibility are dependent on the alternative fuel grade option chosen by the EV user, who receives a price discount in exchange, the proposed solution does not impact the user-desired quality of service. In fact, the proposed solution is similar to the familiar “fuel grades” available at gas stations where ICV users select an option that primarily reflects the quality of injected fuel. Similarly, according to the proposed mechanism, the alternative fuel grade option reflects the quality of electric charge injected into the EV battery, determined by the associated power supply level.
The remainder of this paper is organized as follows: In Section 2, a review of the state of the art is presented. Section 3 provides an explanation to the proposed managed charging solution. Section 4 describes numerical simulations to reflect on the effectiveness of the proposed model, and the paper is discussed and concluded in Section 5.

2. Related Work

Although deployments of ESS, V2G, and REGS to curtail demand peaks is rigorously studied, the cost savings to EVFCFs are reduced due to high capital investment and generation variability that underlie these solutions [18,25]. Consequently, the widely accepted recognition of EVs as highly flexible and controllable electric loads led researchers to formulate and implement various charge management strategies to level load curves and reduce power demand peaks at EV charging facilities by coordinating/managing power supply to the visiting EVs (e.g., [11]). Refs. [26,27] categorize these strategies as “centralized control” and “decentralized control” schemes. In centralized control, a central operator decides and dictates the rate and time to charge an EV based on the information on its energy and power supply requirements and the constraints on the incumbent electric utility’s distribution system. The decentralized control, on the other hand, allows EVs, usually in collaboration with an aggregator or a charging facility operator, to decide their charging schedule irrespective of the system-level consideration or the charging schedule of other EVs. Since the spatial and temporal decision to charge at an EVFCF is made by the individual EV user, this study focuses on the research proposed and industry-deployed decentralized EV charging control schemes.
Many researchers have considered the implementation of decentralized control schemes to shave demand peaks [21,22,28,29,30]. Of particular interest are those applied to commercial charging facilities. Ref. [21] developed and deployed an adaptive charging system at Caltech’s Parking garage. Using a mobile application, EVs visiting the facility report on their energy demand and their expected departure time. A real-time charging algorithm then allocates power supply to each EV such that the facility’s power demand peaks are reduced and the EV’s requested energy demand is fulfilled within its reported departure deadline. Similarly, ref. [29] proposes a schedule-guided heuristic approach to manage and co-ordinate EV charging at a facility. The approach takes precomputed schedules for EV charging from available day-ahead information and adapts in real time as new information on realized energy demand and reported departure time of an EV becomes available. Ref. [30] utilizes a scheduling algorithm to minimize charging costs of EVs in response to time-of-use electricity prices. Upon plugging in, the EV user sets the required energy and expected departure time as inputs to the system, and the scheduling algorithm defines an optimal charging profile to minimize total charging cost. Indeed, information on EV departure time that is input by EVs provides latent flexibility to the facility operator to control, manage, and optimize the charging profile of each visiting EV. However, the outlined control schemes are particularly applicable at slow-charging facilities where the EV sojourn time is typically in the order of several hours.
Some recent studies have also discussed hybrid control schemes in which EV users make spatial and temporal decision on charging at a particular facility, and the facility operator then decides how to manage power supply to each connected EV with the objective of mitigating a facility’s power demand peaks. Notice that neither distribution system level impacts of EV charging are considered in this approach, nor do EV users decide their charging profiles. Ref. [23] proposed a power cap policy in which the facility operator pre-specifies a power budget that must not be exceeded at any time. The visiting EVs input their energy demands, and an online charging algorithm distributes the available power budget among EVs to fulfill their respective energy demand. According to the managed charging solution proposed in [24], the EVFCF adds equal or proportional flexibility to the charging time of each EV that visits the EVFCF. This additional flexibility is then utilized by a real-time smart charging algorithm to manage and optimize power supply to EVs. Both [23,24] show that substantial cost savings can be achieved by the implementation of these proposed approaches. However, such cost savings come at the expense of diminished user-desired quality of service, and the two mentioned studies do not discuss any incentive available to the EV users to extend their charging duration and receive a (possibly) diminished quality of service. When the goal is to provide high-quality service at EVFCFs, EV users will only be willing to provide any time flexibility to EVFCF when incentivized.
Several empirical and simulation studies confirm that EV users are willing to provide time flexibility when appropriately incentivized. In [31], researchers offered EV users a menu of charging deadlines paired with lower prices for later completion times, enabling load shifting to off-peak periods. In a randomized controlled trial, ref. [32] found that monetary incentives significantly shifted charging behavior, whereas non-price behavioral nudges had no measurable effect; when incentives were withdrawn, charging patterns reverted, highlighting the necessity of ongoing compensation. Complementing these field results, ref. [33] demonstrated via simulation that hybrid incentive programs that compensate EV users for selling their charging flexibility can reduce users’ charging costs by over 20% while achieving high utilization of available flexibility at slow EV charging facilities.
Hence, the solution proposed in this work allows EVFCFs to purchase time flexibility from EV users, which is then utilized in a control scheme to address the MDPC issue. The general concept of flexibility-differentiated pricing is not new [31,34,35,36]. In [31], the authors discuss a deadline-differentiated pricing strategy in which EV users select the amount of energy they will consume at different times and are incentivized to increase their sojourn time at a charging facility. Ref. [37] proposes an approach for setting price discounts for different deadlines using stochastic optimization that accounts for uncertainties in users’ charging requirements over the planning horizon. Ref. [38] presents an online approach to setting price offers, employing evolutionary optimization to deal with uncertainties in user demand. Similarly, ref. [39] describes a discount mechanism offered to users to defer their (uncontrolled) charging sessions by one time interval. The discount is set using an online approach based on queueing theory, with the twin objectives of maximizing the charging provider’s profit and maintaining the probability of blocking users (due to a shortage of charging points) below an acceptable threshold. Ref. [40] developed a pricing scheme with different charging price profiles for various buses of a power distribution system. They assume that, based on these prices, users choose between different charging power levels (and consequently different charging durations). Their proposed pricing strategy aims to minimize power distribution losses. In addition, ref. [36] formulates an online pricing mechanism in which the EVFCF decides the per-unit energy price depending on the energy requirements and expected deadlines of visiting EVs.
However, the solutions discussed above only consider the (marginal) energy payment component of an EVFCF’s electricity bill. The MDPC contribution, which, at times, exceeds 76% of the EVFCF’s electricity bill [41], remains unaccounted for. Furthermore, the implementation benefits of these solutions under real-world operating conditions have yet to be comprehensively discussed. These issues are explicitly considered and analyzed in detail in this work.
As such, this paper formulates and implements a managed charging solution that incorporates alternative fuel grades. This solution differs from the existing literature in three key ways: (i) it incentivizes EV users to delay charging at EVFCFs while preserving the user-desired quality of service, (ii) it explicitly accounts for the impact of maximum demand prices on EVFCF operations, and (iii) it uses real-world EVFCF data to simulate and analyze the benefits of the proposed managed charging solution.

3. Methodology

This section describes the managed charging solution proposed in this study. After reviewing the various components of a typical electricity bill, a managed charging algorithm is proposed and extensively outlined. The implementation of this algorithm enables the EVFCF operator to utilize time flexibility defined by the EV user-selected alternative fuel grade option and optimize power supply to the visiting EVs, thereby enabling the management of the facility’s maximum power demand, and consequently mitigating the adverse impacts of MDPC on the EVFCF’s operational feasibility.

3.1. EVFCF’s Electricity Bill

The monthly electricity bill of a commercial EVFCF typically comprises three components: the fixed payment component (FPC), the energy payment component (EPC), and the maximum demand payment component (MDPC). Whereas the FPC is a monthly subscription fee, ζ 0 (unit: USD), the EPC depends on the total energy consumed (unit: kWh) over a billing period and a fixed or time-of-use energy price, ζ 1 (unit: USD/kWh). In addition to EPC, the MDPC reflects the highest level of mean power (unit: kW) that the EVFCF demands over a billing period. Mean power demand is calculated as the average value of power supplied to the visiting EVs over a fixed, integer-valued interval, the so-called demand interval, whose duration is electric utility specific, typically, 15, 30, or 60 min [18]. The highest value of mean power demand over any demand interval in the billing period is called the maximum mean power demand of the EVFCF. The maximum mean power demand, multiplied by the maximum demand price, ζ 2 (unit: USD/kW), makes up the MDPC of an EVFCF’s electricity bill.

3.2. EVFCF Setup and Operation

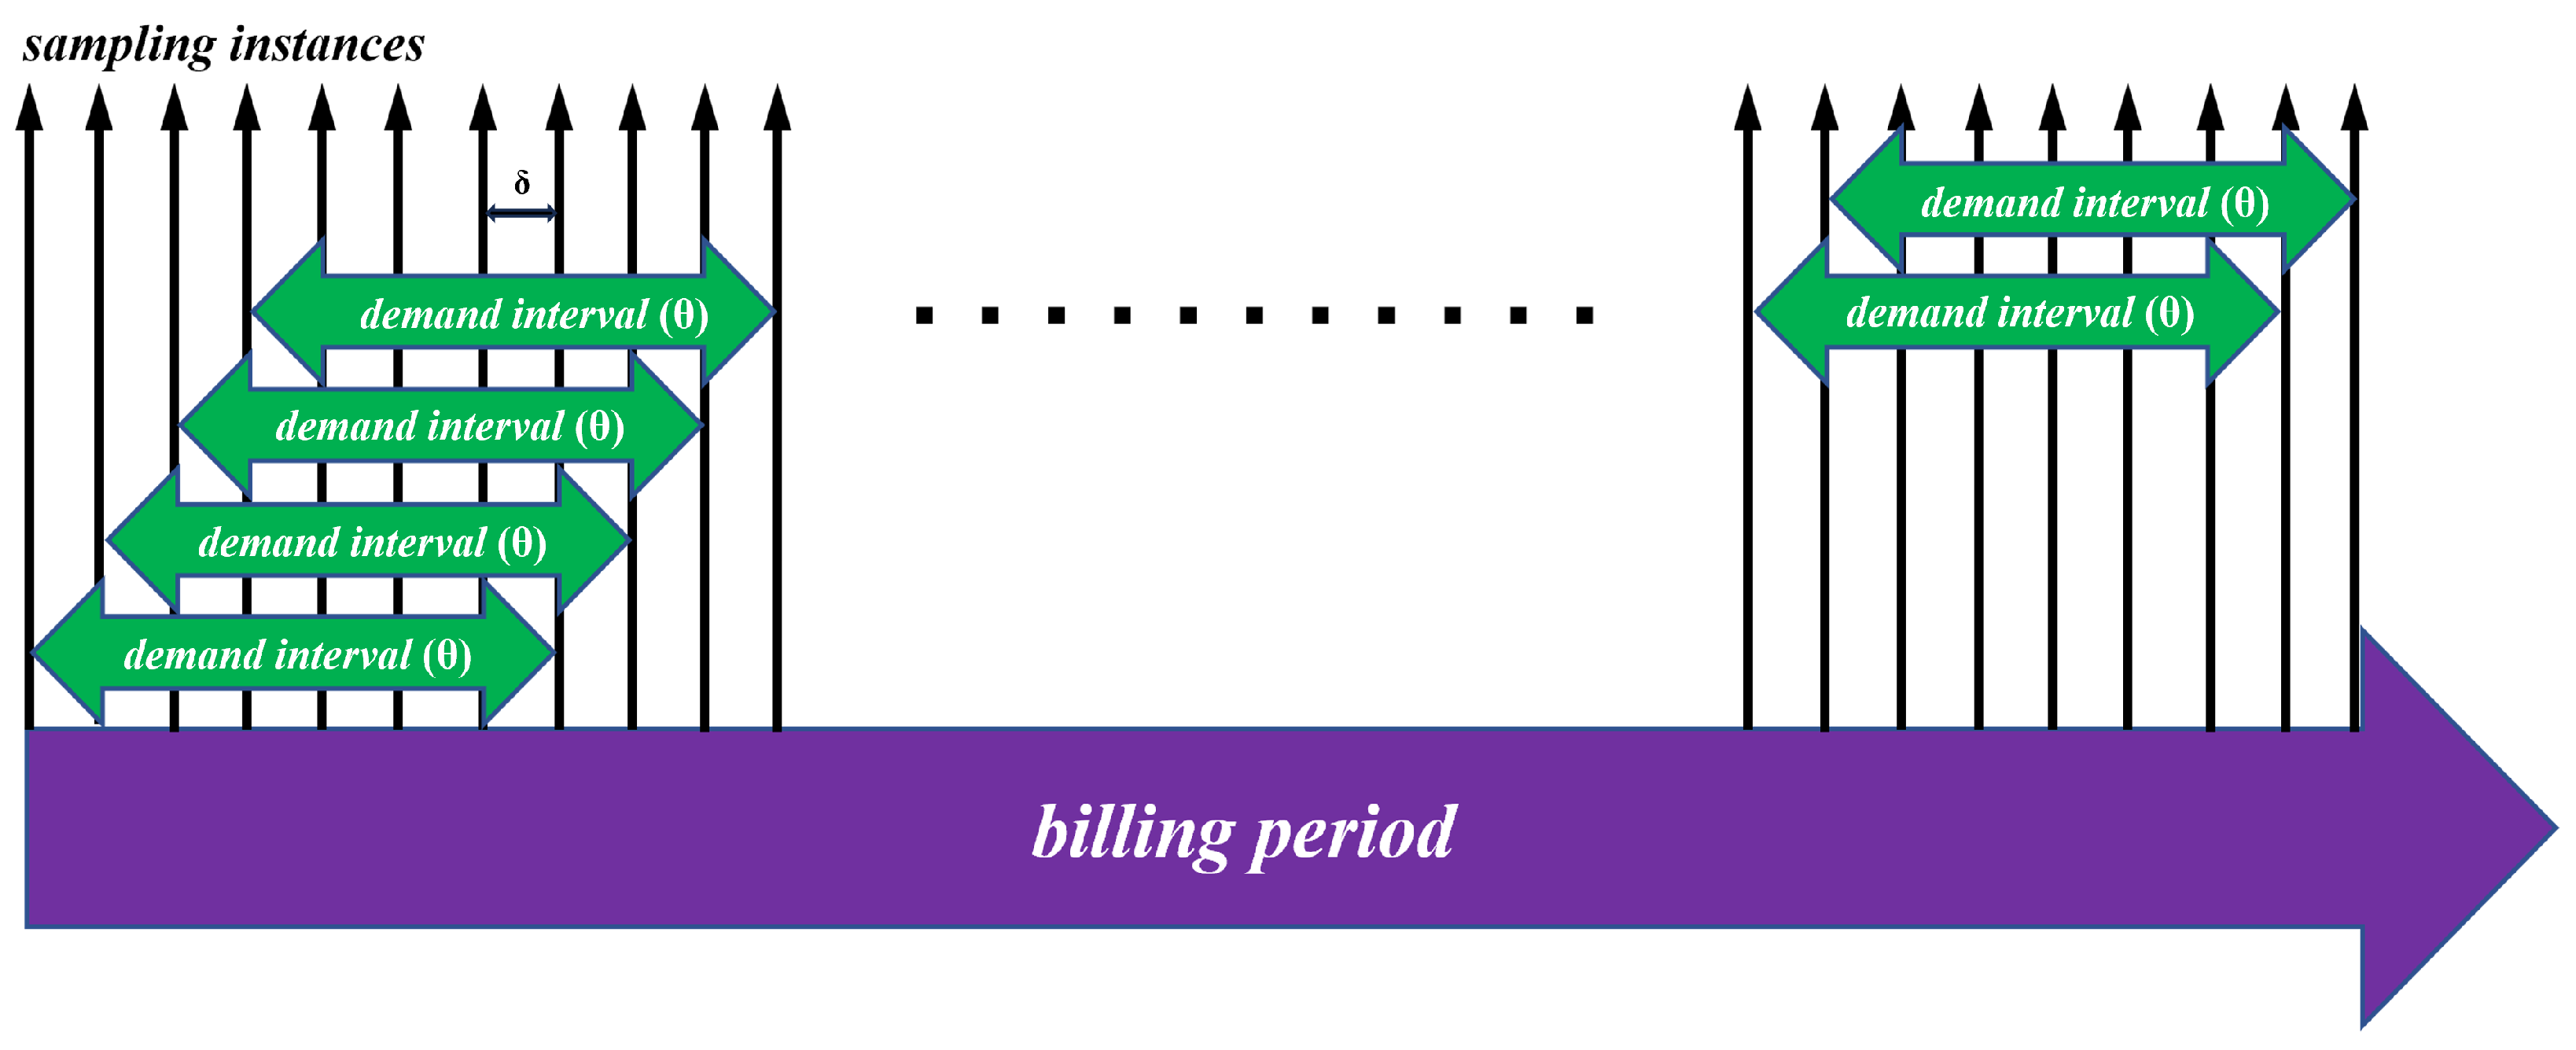
Consider the operation of an EVFCF equipped with n chargers, each with a power supply capability of [ 0 , η ] kWs. In this work, a discrete-time model with time indexed by t T = { 1 , , T } is formulated, where T is the total number of sampling instances in a billing period. The duration between two consecutive sampling instances is δ , and the duration of a demand interval is θ (see Figure 1). At time t, J t : | J t | n —the so-called active set—is the set of EVs  j J t connected to a charger at the EVFCF. At its time of arrival ( a j T ), the EVFCF presents EV j with a set of options S = { 1 , 2 , S } —the so-called alternative fuel grades. Each option s S is associated with a power supply level, ψ s (unit: kW), and the corresponding per-unit charging service price, γ s (unit: USD/kWh). The power supply level and the per-unit price to EV j when it selects option s S are denoted by ψ j s and γ j s , respectively. The charging service price corresponding to alternative fuel grades is linearly discounted as the user selects options with lower power supply levels. This approach aligns with the price discounts applied by managed charging solutions implemented at slow-charging facilities (e.g., [22]), i.e.,
γ j s = γ + β · ( ψ j s ψ )
In the above equation, γ and ψ denote the per-unit charging service price and the power supply level, respectively, when no alternative fuel grade is offered at the EVFCF, and β represents the linear discount rate. The battery capacity, battery capability, desired state of charge, and power supplied to EV j at time t are represented by b j , κ j , μ j ¯ , and p j [ t ] , respectively. The state of an EV  j J t at time t is described by its remaining duration to departure ( d j [ t ] ) and its state of charge ( μ j [ t ] ) .
The choice made by EV j from the set of alternative fuel grades is used to calculate the allowed time flexibility to uplift its state of charge to the desired value. This flexibility provides the EVFCF with an opportunity to optimally allocate power supply to each connected EV so that the EVFCF can mitigate its power demand peaks and upgrade its operational profits. To that end, this work develops and deploys an online managed charging algorithm (Algorithm 1).
In line 2 of Algorithm 1, a criterion is set to verify that the EVFCF’s operations at the maximum power supply capability (maximum power supply capability to EV  j J t is determined by its battery capability ( κ j ) and the capability of chargers ( η ) installed at the EVFCF; as such, the EVFCF cannot supply power to an EV higher than the minimum of its battery capability and the charger capability) to each EV  j J t do not exceed the facility’s heretofore maximum mean power demand. Otherwise, a linear optimization program (OP) is called upon in line 5 that takes the following form:
min p j 1 θ · τ = t t + θ j J t p j [ τ ] subject to : δ · τ = t d j [ t ] p j [ τ ] = ( μ ¯ j μ j [ t 1 ] ) · b j j J t , 0 p j [ τ ] min { κ j , η } j J t , τ = t , , t + θ
At occasional instances, when line 3 criterion is not satisfied, the OP seeks to allocate optimal power supply to EV  j J t and ensures that its remaining energy demand is met within its remaining time to departure. Additionally, the OP ensures that upper and lower limits on power supply to EV j are respected. Consequently, the OP returns an optimal charging profile ( p j * [ t ] , p j * [ t + 1 ] , p j * [ t + 2 ] , , p j * [ t + θ ] ) as a θ -dimensional vector for each active EV  j J t . The algorithm implements the optimal outcome p j * [ t ] in line 8 and updates the state variables in lines 9 and 10. The EVFCF’s power demand at time t, the mean power demand for the current demand interval, and the facility’s heretofore maximum power demand are then evaluated in lines 12, 13, and 14 of the algorithm, respectively. Subsequently, the result of line 14 is used to verify the criterion set in line 3 for the next sampling instance, i.e., t + 1 .
Algorithm 1 Managed Charging Algorithm.
  1:
for  t = 1 , , T  do
  2:
      if  j J t min { κ j , η } P ¯ f M [ t 1 ]  then
  3:
             p j * [ t ] = min { κ j , η } , j J t
  4:
      else
  5:
            solve OP to compute ( p j * [ t ] , p j * [ t + 1 ] , p j * [ t + 2 ] , , p j * [ t + θ ] ) , j J t
  6:
      end if
  7:
      for  j J t  do
  8:
            implement p j * [ t ]
  9:
             d j [ t + 1 ] = d j [ t ] 1
10:
             μ j [ t + 1 ] = μ j [ t ] + δ p j * [ t ] b j
11:
       end for
12:
        P f [ t ] = j J t p j * [ t ]
13:
        P ¯ f [ t ] = 1 θ τ = t ( θ 1 ) t P f [ τ ]
14:
        P ¯ f M [ t ] = max { P ¯ f M [ t 1 ] , P ¯ f [ t ] }
15:
end for

3.3. EVFCF’s Operational Profit

The EVFCF’s operational cost for a billing period is the sum of the three components of its electricity bill, calculated as follows:
  • FPC is a fixed subscription fee ( ζ 0 ) defined by the incumbent electric utility.
  • EPC is obtained by multiplying the total energy consumed by ζ 1 . The total energy consumed is the sum of the product of the EVFCF’s power demand ( P f [ t ] ) over and the duration ( δ ) between any two consecutive sampling instances in the billing period.
  • The average of instantaneous power demand measurements at sampling instances within a demand interval is called the EVFCF’s mean power demand ( P ¯ f [ t ] ) over that demand interval. The highest value of mean power demand for any demand interval in the billing period ( P ¯ f M [ T ] ) is multiplied with ζ 1 to calculate the MDPC.
The mathematical expressions for P f [ t ] , P ¯ f [ t ] , and P ¯ f M [ T ] are given below:
P f [ t ] = j J t p j * [ t ]
P ¯ f [ t ] = 1 θ · τ = t ( θ 1 ) t P f [ τ ]
P ¯ f M [ T ] = max t T P ¯ f [ t ]
The EVFCF’s operational costs (c) due to electricity procurement are the sum of three components of the its electricity bill, i.e.,
c = ζ 0 + δ · t T ζ 1 [ t ] · P f [ t ] + ζ 2 · P ¯ f M [ T ]
The per-unit charging service price corresponding to the selection s multiplied by the energy delivered determines the generated revenue by EV j, and the summation over all EVs visiting the facility gives the operational revenue ( r ) generated by the EVFCF during the billing period, i.e.,
r = δ · t T j J t γ j s · p j [ t ]
The operational profit ( π ) for the EVFCF over a billing period is then the difference between revenue generated by selling fast-charging service to the EV users and the cost of electricity purchased from the incumbent electric utility, i.e.,
π = r c

3.4. Charging Methods

To manage power demand peaks at the EVFCF, the duration of a charging session is a key metric and depends on the time flexibility offered by the visiting EVs. This subsection explains two distinct charging methods. In the business-as-usual practice—referred to as the conventional charging (CC)—the EVFCF is not provided with any additional time. This implies that an EV is always supplied power at the maximum power supply capability and the deadline; i.e., the remaining duration to departure for EV j at the time of its arrival ( d j [ a j ] ) can be calculated as
d j [ a j ] = ( μ j ¯ μ j [ a j ] ) · b j δ · min ( κ j , η )
Since no alternative fuel grade options are available under the CC, the per-unit energy price is the same for all visiting EVs, i.e., γ j s = γ .
On the other hand, according to the solution proposed in this work, the EVFCF purchases additional flexibility from the visiting EV users by offering price discounts, allowing the EVFCF to implement managed charging (MC). This implies that d j s [ a j ] , i.e., the time available to charge the EV j when it selects options s under the MC can be calculated using the following expression:
d j s [ a j ] = ( μ j ¯ μ j [ a j ] ) · b j δ · min ( κ j , ψ j s , η )

3.5. Alternative Fuel Grade Selection

The selection of an alternative fuel grade is described by the utility ( U j s ) that EV user j will receive upon selecting the alternative fuel grade s. To evaluate the selection probability of an alternative fuel grade s for EV j  ( α j s ) , this work employs a multinomial logit-based model that is widely used to represent discrete choice behavior where individuals select one option from a finite set of mutually exclusive alternatives [42], making it well suited for modeling EV users’ selection of alternative fuel grades. This model has been extensively used in transportation and energy research to analyze choices related to vehicle type, fueling options, and charging behavior (e.g., [43]). It relates the utility derived from each option to the probability of its selection through a closed-form expression that takes the following form. Subsequent subsections will explore the different utility functions.
α j σ = e x p ( U j σ ) s = 1 S e x p ( U j s ) , σ S

3.6. EVFCF Utilization Data

This study utilizes the EV Watts database [44] to simulate the operations of EVFCFs equipped with multiple chargers. This database contains real-world information on the operations of 4827 single-charger (i.e., n = 1) EVFCFs operating in various United States metropolitan areas between 2019 and 2022. It includes data on arrival and departure times, initial and desired states of charge, and battery capacities of EVs visiting a charging facility. As such, the utilization data for a randomly selected group of single-charger EVFCFs that operate within a metropolitan area are aggregated to construct and simulate the behavior of a real-world EVFCF equipped with multiple chargers (i.e., n > 1). The data for this select set of chargers that constitute an EVFCF are further processed to remove any anomalies and unrealistic data, including duplicates and entries corresponding to negative charging duration values.
Subsequently, descriptive statistics, including the mean, standard deviation, and range, are calculated for several key variables: the hourly EV arrival count, inter-arrival times, initial and desired states of charge, and battery capacity. These statistics are then used to simulate the operations of the multi-charger EVFCF.
The simulations use the data-defined range of hourly EV arrival counts to randomly select the number of EVs that will visit the EVFCF during a specific hour on a given day. In addition, the data indicate that EV inter-arrival times follow an exponential distribution; the mean inter-arrival times for each hour are used to define these distributions, which are then applied to randomly generate the time between consecutive EV arrivals within a specific hour. The data on the initial and desired states-of-charge values show a skewed normal behavior. Consequently, these distributions are constructed and applied at the time of each vehicle’s arrival to determine its initial and desired state of charge. Furthermore, since different types of EVs, each characterized by varying battery capacities, may visit different EVFCFs, k-means clustering is used to identify three distinct EV types likely to visit a facility. Once these types are identified, the specific EV type is randomly assigned from the three battery capacities whenever an EV arrives at the EVFCF.

4. Results

4.1. Impact of EVFCF Utilization

This subsection discusses the implementation of the proposed solution that incorporates alternative fuel grades over a 30-day billing period across three EVFCFs situated in different United States metropolitan areas: Austin, Seattle, and Boston. Each EVFCF is equipped with n = 6 chargers, each with a charging capability of 350 kW. The operational data for these multi-charger EVFCFs are derived from aggregating metropolitan area-specific, single-charger facility utilization data following the methodology described in Section 3.6.
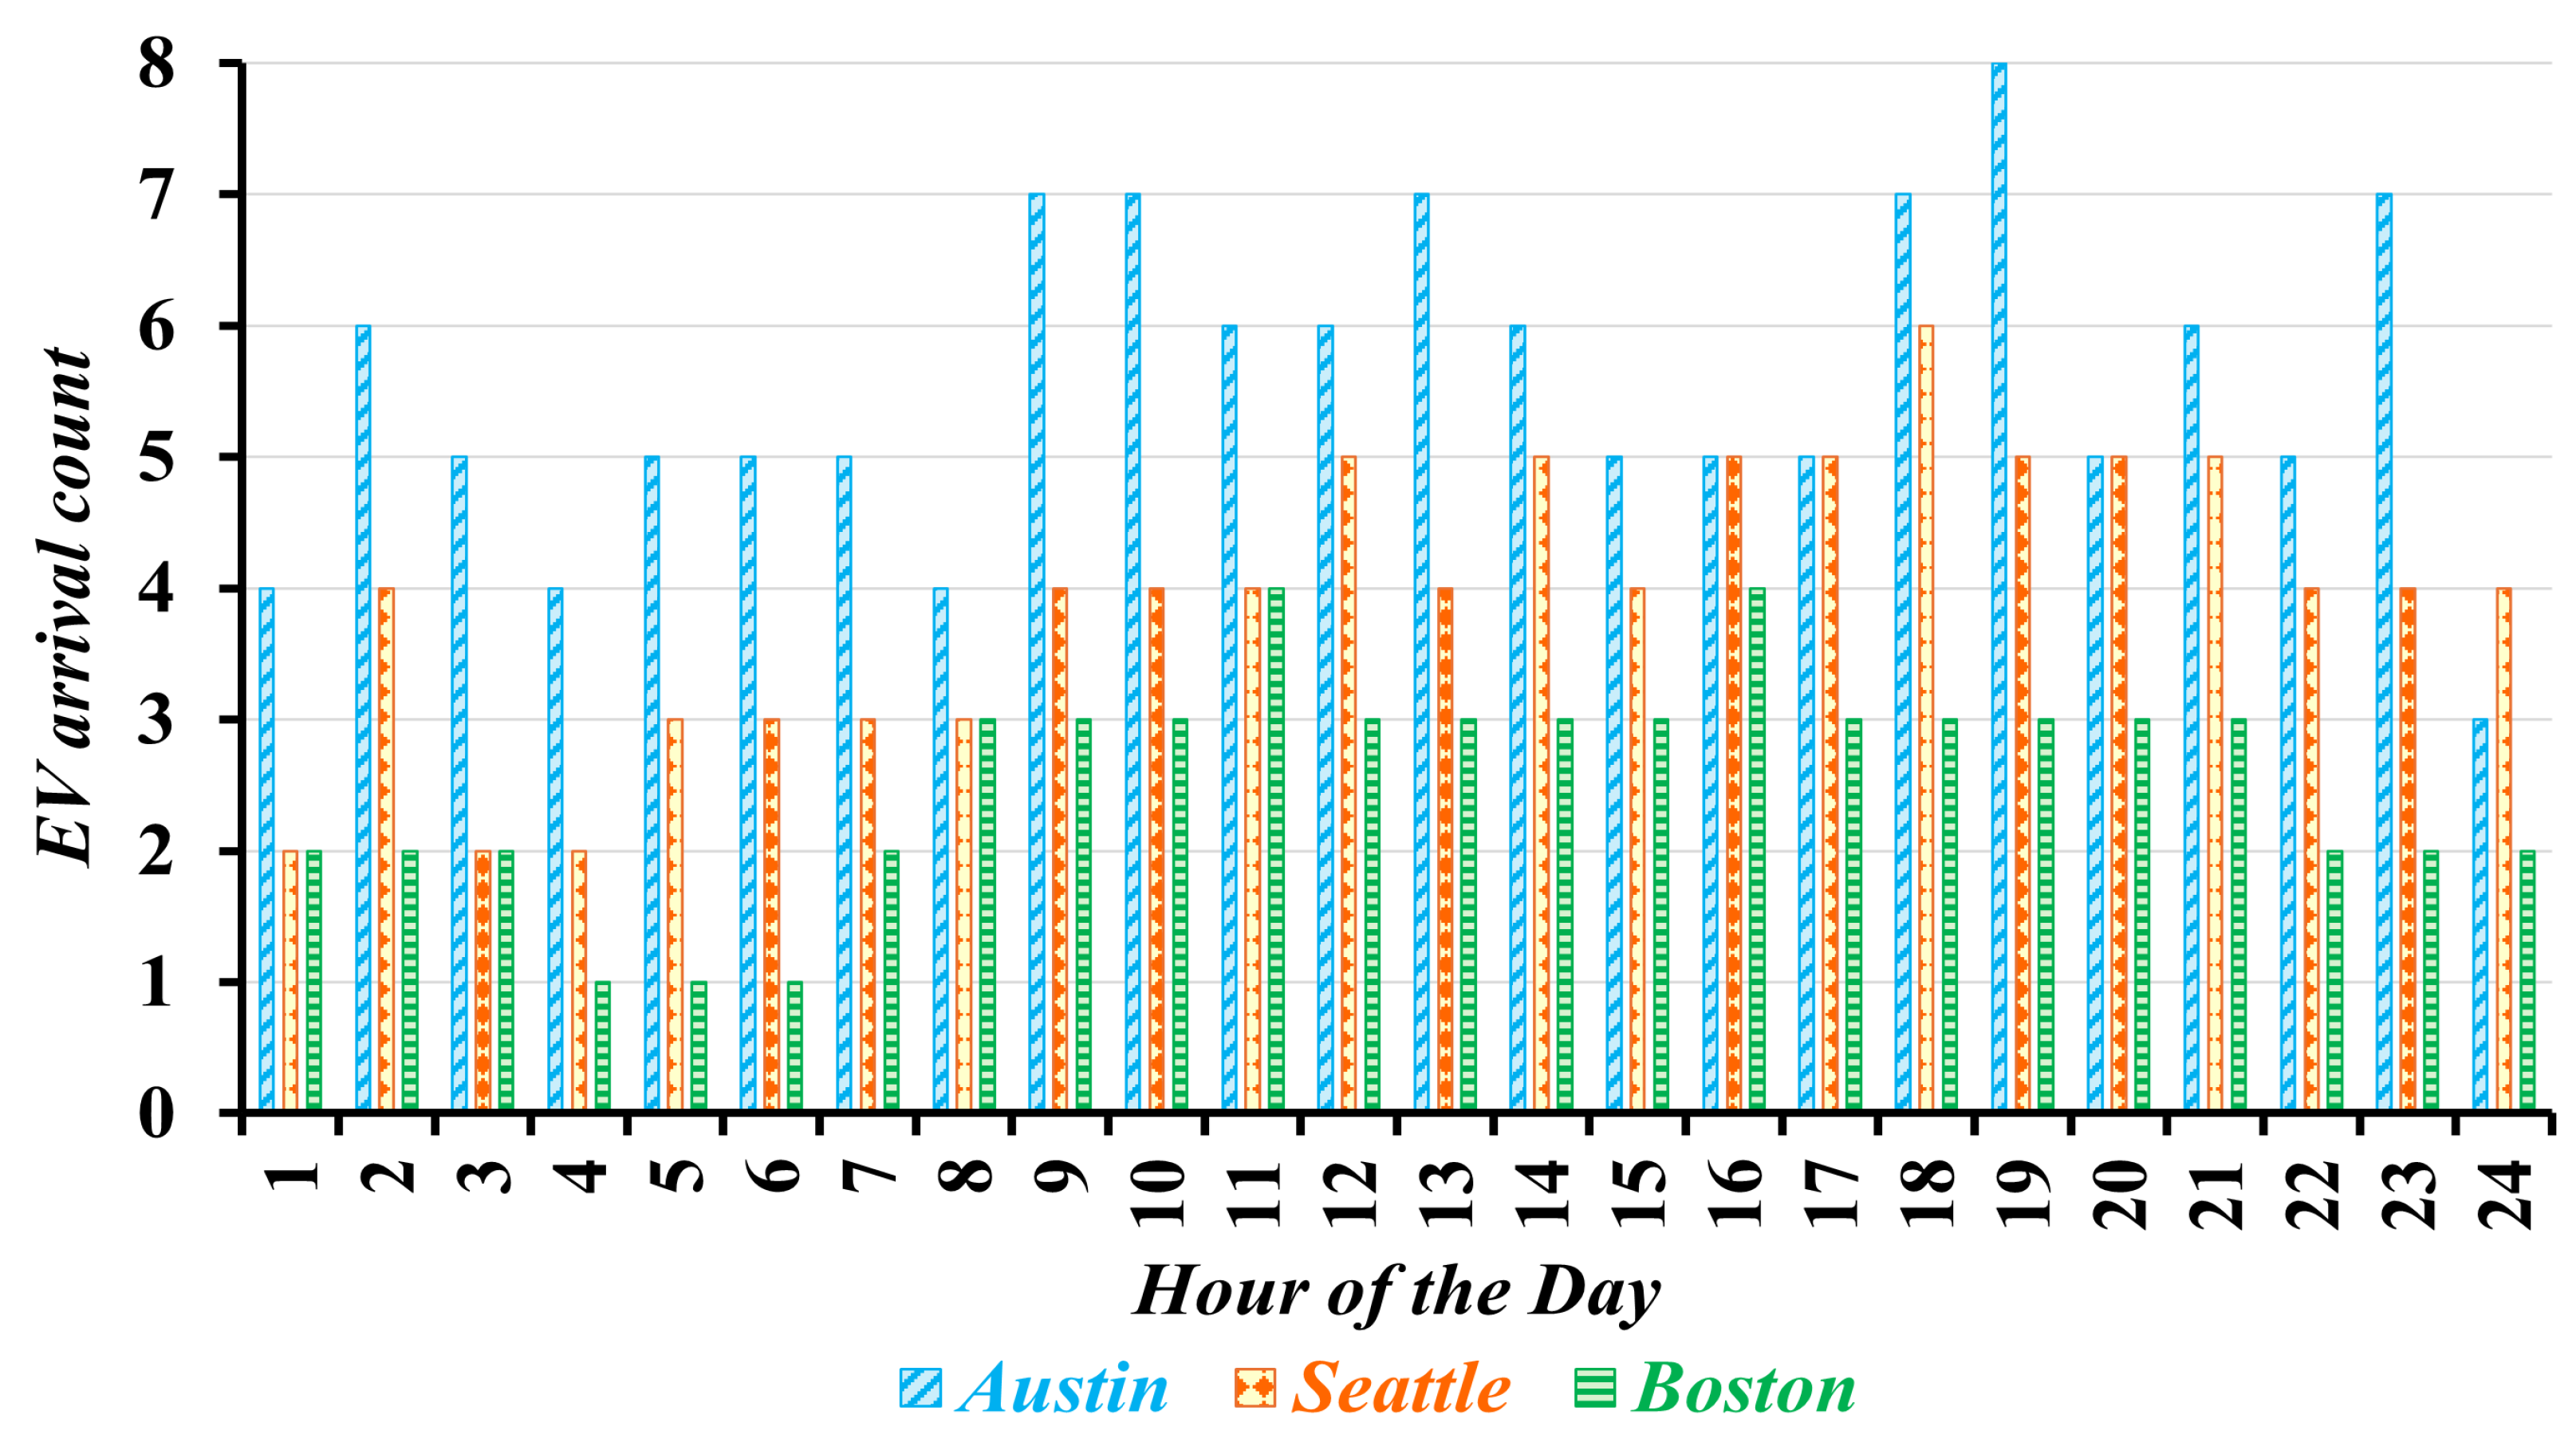
The selection of EVFCFs operating in the three metropolitan areas captures a diverse range of real-world EVFCF utilization scenarios across the United States. Figure 2 displays the maximum number of hourly EV arrivals at three EVFCFs. It shows that the EVFCF in Boston represents a low utilization scenario, with a maximum of 61 daily EV arrivals. In contrast, the EVFCF in Austin experiences a significantly higher number of daily arrivals, reaching up to 133, indicating a high utilization scenario. The EVFCF in Seattle, with a maximum of 95 daily EV arrivals, falls into a medium utilization scenario.
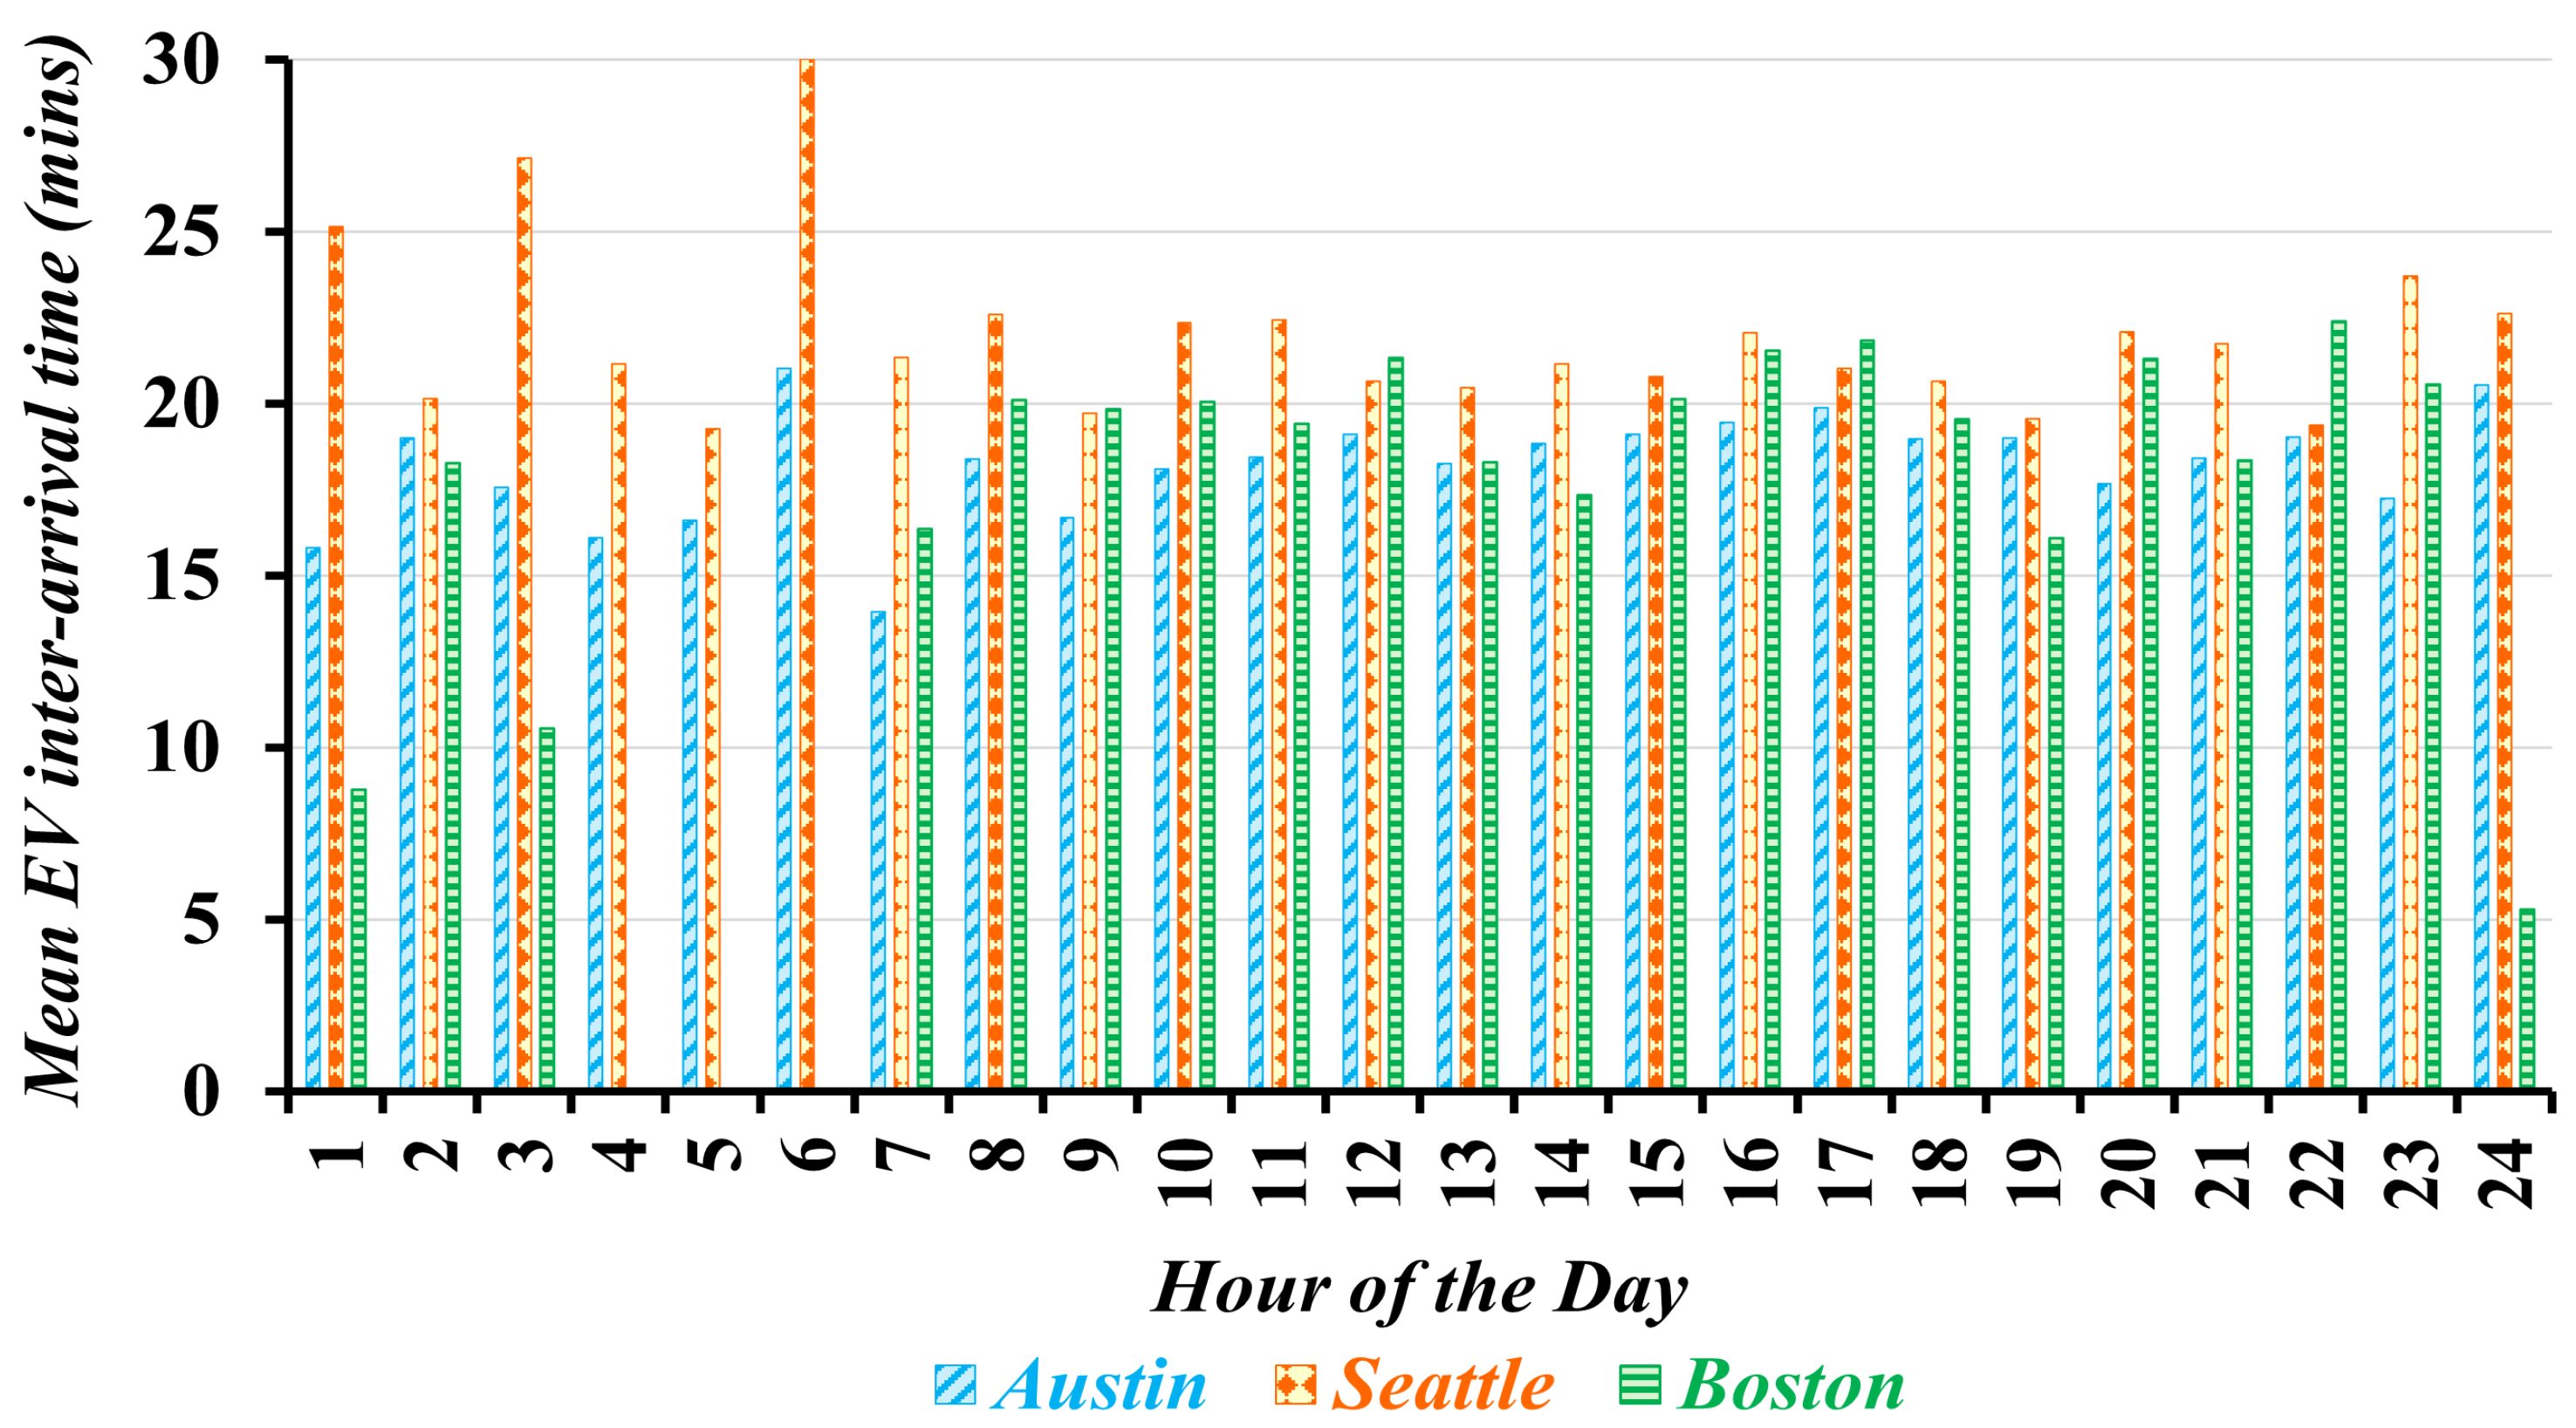
The mean time between consecutive EV arrivals throughout the day at the three EVFCFs is presented in Figure 3. As such, at the charging facilities in Austin and Boston, the EV inter-arrival times are shorter compared with those at the Seattle EVFCF, resulting in a higher number of simultaneous EV arrivals at these facilities. Notice that the occurrence of 0 min inter-arrival times for certain EVFCFs during specific hours highlights instances where no more than one EV is expected to arrive at the charging station during those hours.
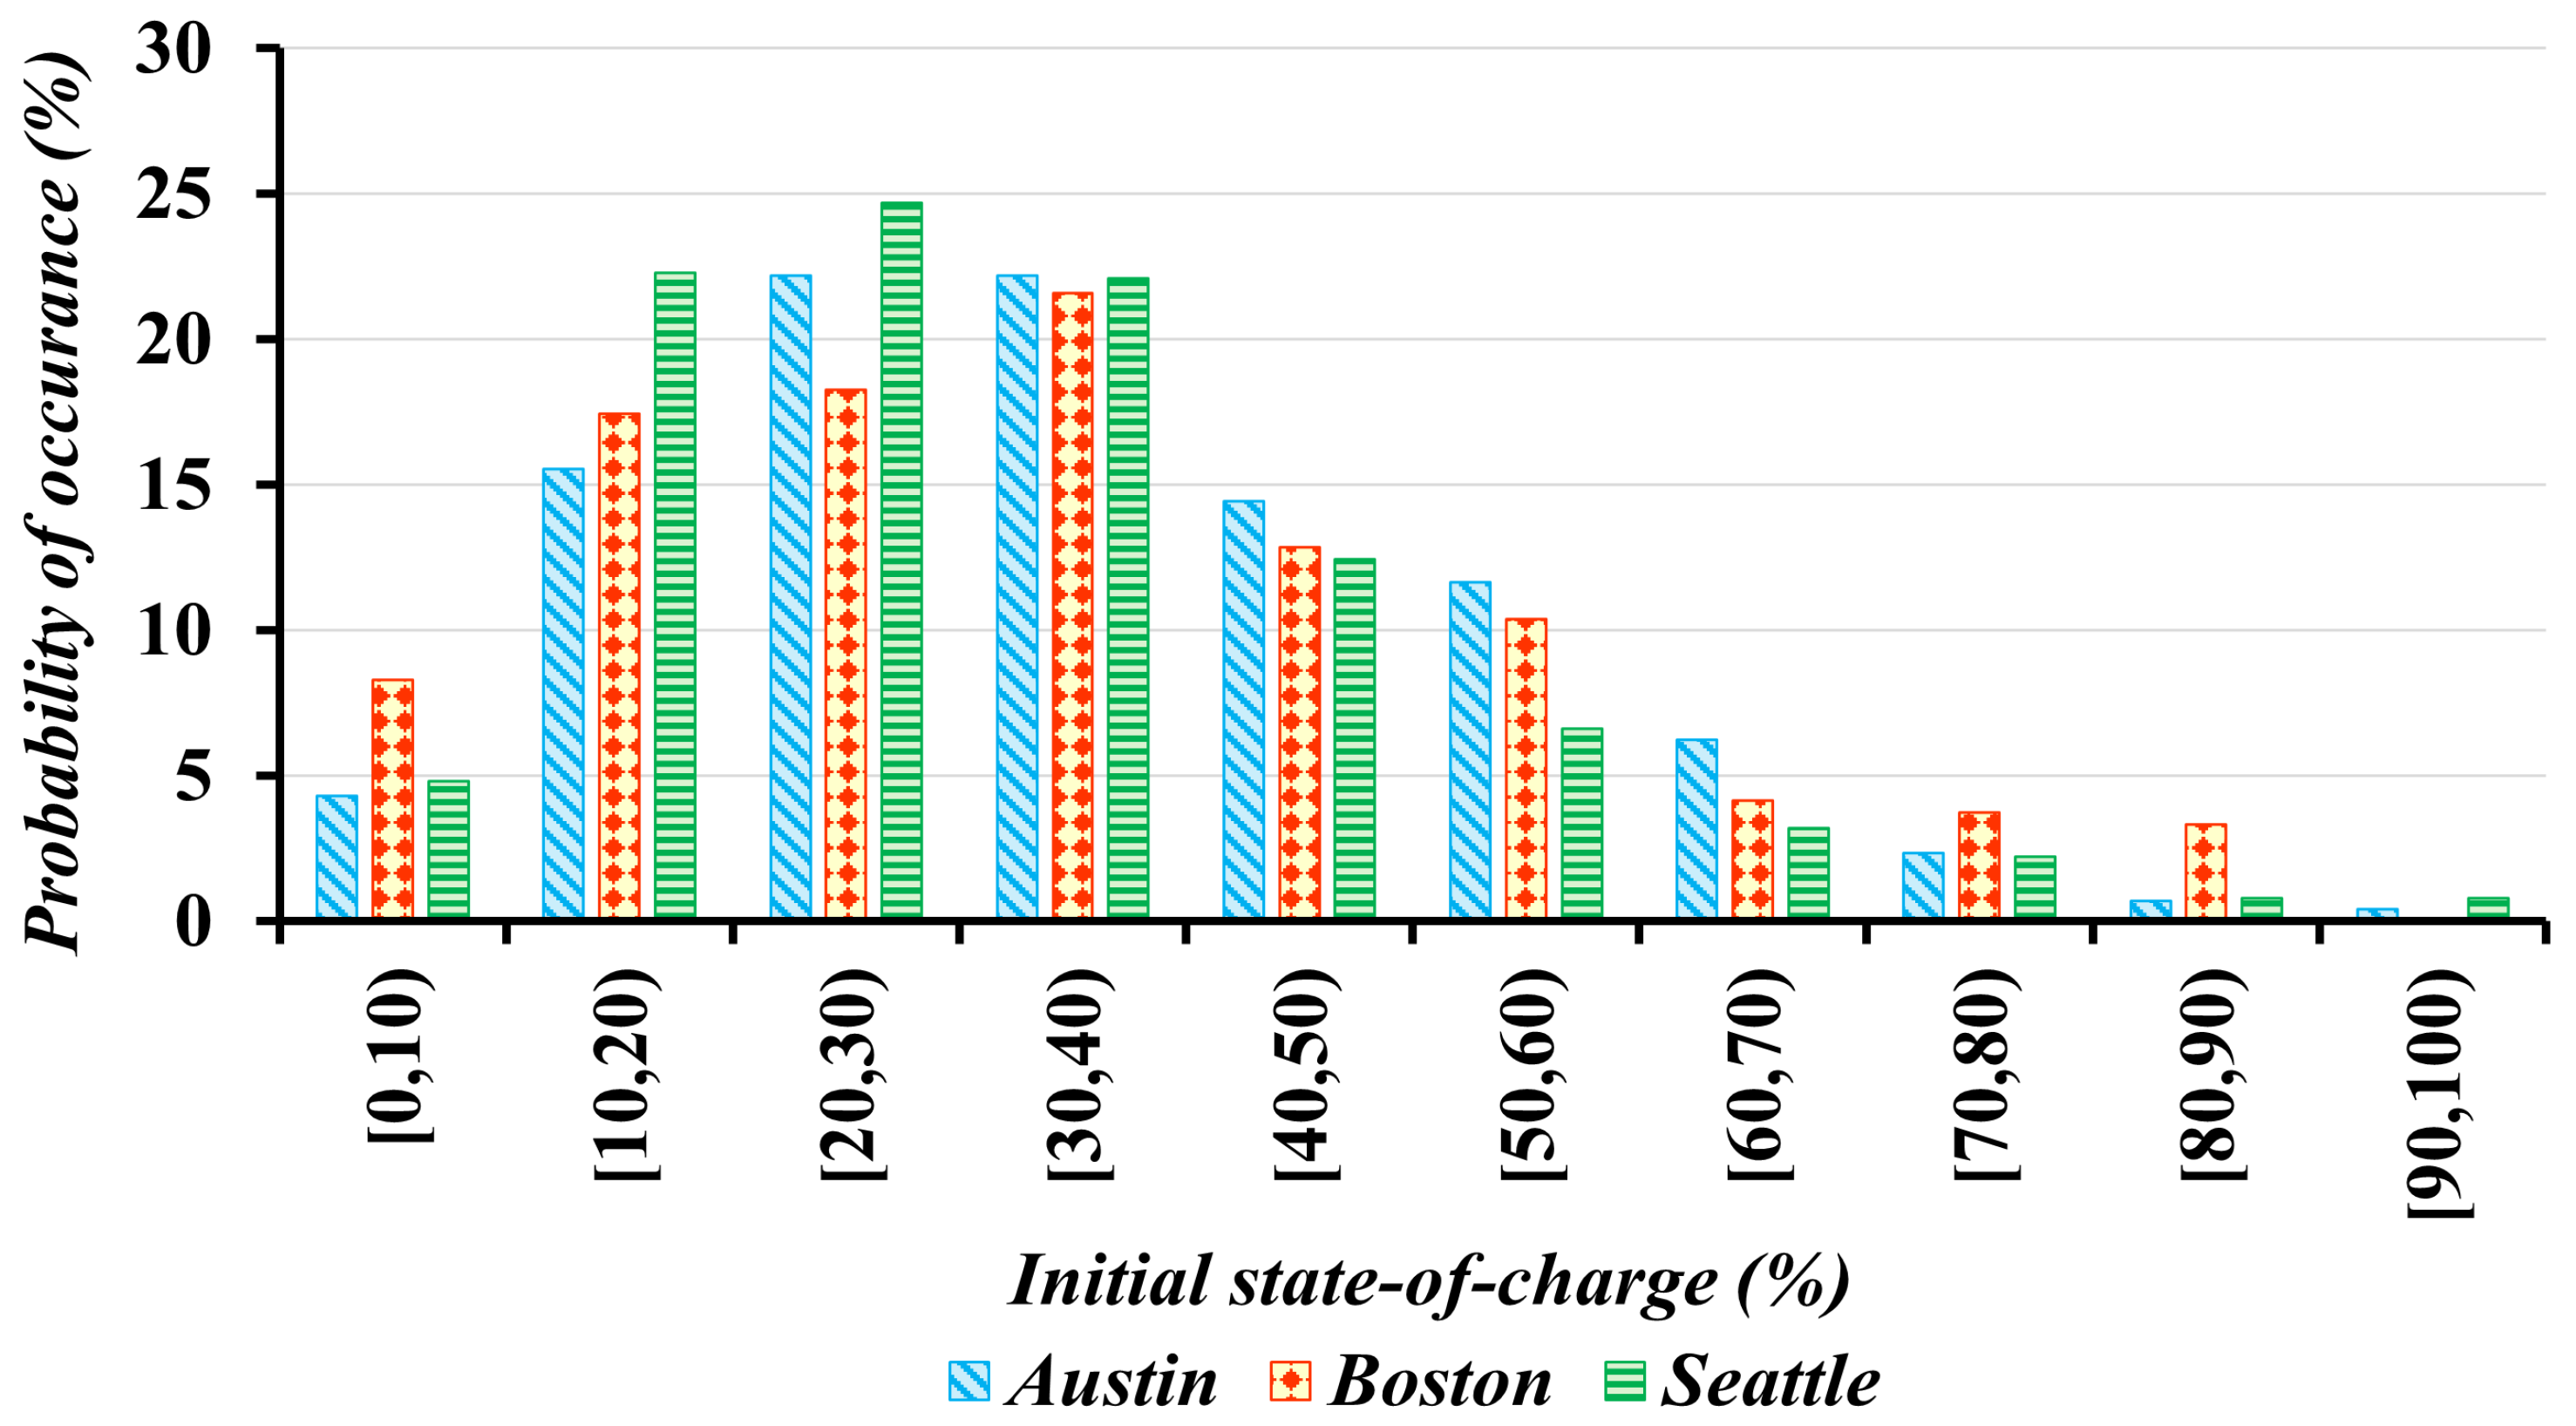
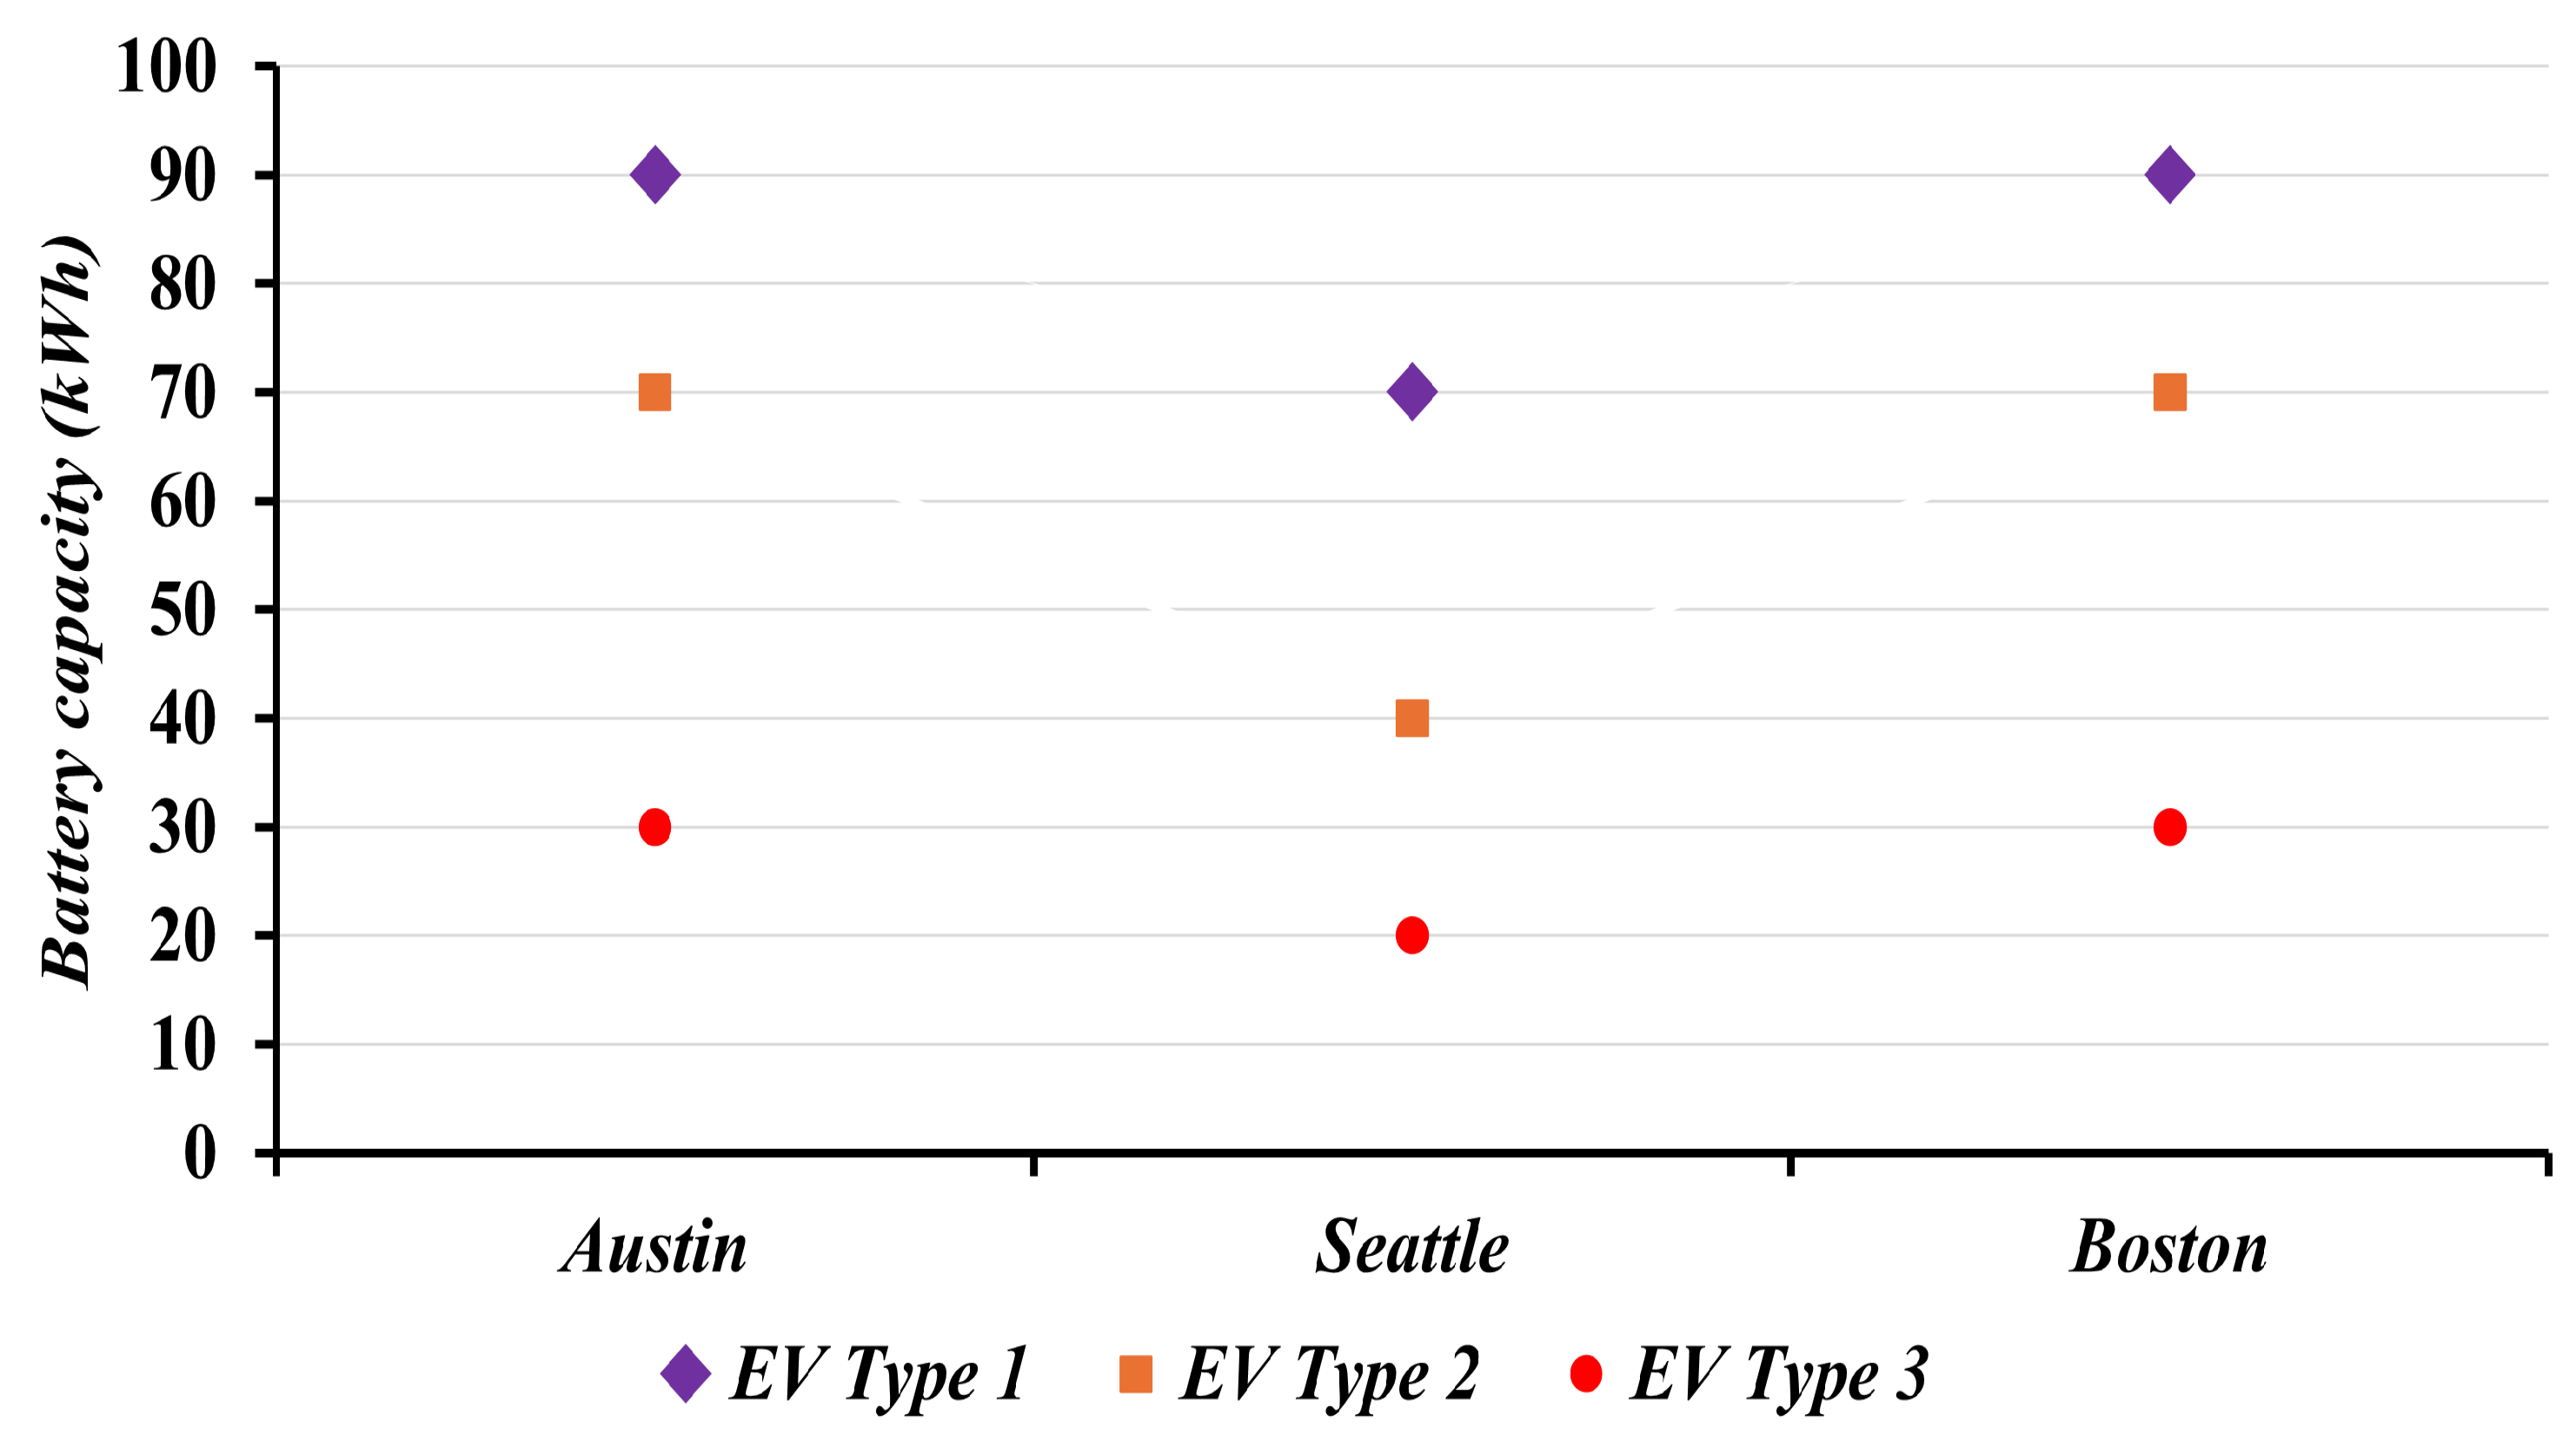
The initial and desired states of charge of the visiting EVs during each hour of the day exhibit similar patterns across all simulated EVFCFs. For instance, Figure 4 shows the distribution of initial states of charge of EVs visiting the three representative EVFCFs between 6:00 and 7:00 p.m. In addition, the three different types of EVs, characterized by their battery capacities, that are likely to visit each EVFCF are presented in Figure 5.
For simulation purposes, each day in the billing period is considered independent and identical, with the day divided into 24 1-h sub-intervals. The time duration between two sampling instances ( δ ) is set to 1 min, and the demand interval duration ( θ ) is 30 min, which is typical for utilities across the United States [45]. Moreover, following [46], it is assumed that if an EV arrives at the EVFCF and finds no available charging spot, it waits for up to 5 min for a spot to open. If no spot is available after this waiting period, the EV leaves the EVFCF.
Since the focus is on the impact of the proposed solution across different EVFCF utilization scenarios, the prices for the three components of the EVFCFs’ electricity bill are held constant. These prices are specified according to the electric service rate schedule outlined in [47] for a large commercial customer in Boston (Schedule G-3), and are summarized in Table 1.
The three alternative fuel grade options offered at each EVFCF, along with their respective power supply levels, are presented in Table 2. Since the impact of user selection of an alternative fuel grade option is not studied in this subsection, it assumes that U j s = ρ 0 (constant) for all s S , and consequently, the selection of each alternative fuel grade is equally probable, i.e., α j s = 1 3 for all s S .
With CC, when no alternative fuel grade option is available, the charging service price γ = 0.55 USD/kWh, which represents the average charging service price offered by EVFCFs in the United States [48]. When alternative fuel grades are offered, with MC, the charging service price is linearly discounted for grades corresponding to lower power supply levels.
To evaluate the effectiveness of the proposed solution in these varied environments, the benefits-to-cost ratio (BCR) and the percentage change in operational profits (% Δ π ) due the deployment of the proposed solution for each simulation run are calculated. To that end, the reduction in EVFCF’s operational revenue compared with its revenue under CC, due to offering charging service at a reduced per-unit price for alternative fuel grades with lower power supply levels, constitutes the net costs of implementing the proposed solution. On the other hand, the reduction in EVFCF’s operational costs caused by the reduction in its maximum mean power demand indicates the net benefits of the proposed managed charging solution. The benefits-to-costs ratio (BCR) is then the ratio of the reduction in operational costs to the reduction in operational revenue of an EVFCF in a given billing period. The percentage change in operational profits (% Δ π ) is the ratio of the difference between the operational profits with MC and CC to the EVFCF’s absolute operational profits with CC. Mathematically, for each simulation run, the BCR and % Δ π are calculated as follows:
B C R = Δ c Δ r = c C C c M C r C C r M C
% Δ π = π M C π C C | π C C | × 100
A total of 500 simulations are performed at each EVFCF, with each simulation representing 1 month EVFCF operations. For a simulation run, the number and attributes of visiting EVs—including their arrival time, battery capacity, initial and desired states of charge, and selected alternative fuel grade—are randomly generated following the methodology outlined in Section 3.6. The energy required to uplift EV j’s state of charge from its initial ( μ j [ a j ] ) to the desired value ( μ j ¯ ) is then furnished by the EVFCF within the time constraints defined by the mathematical expressions presented in Section 3.4.
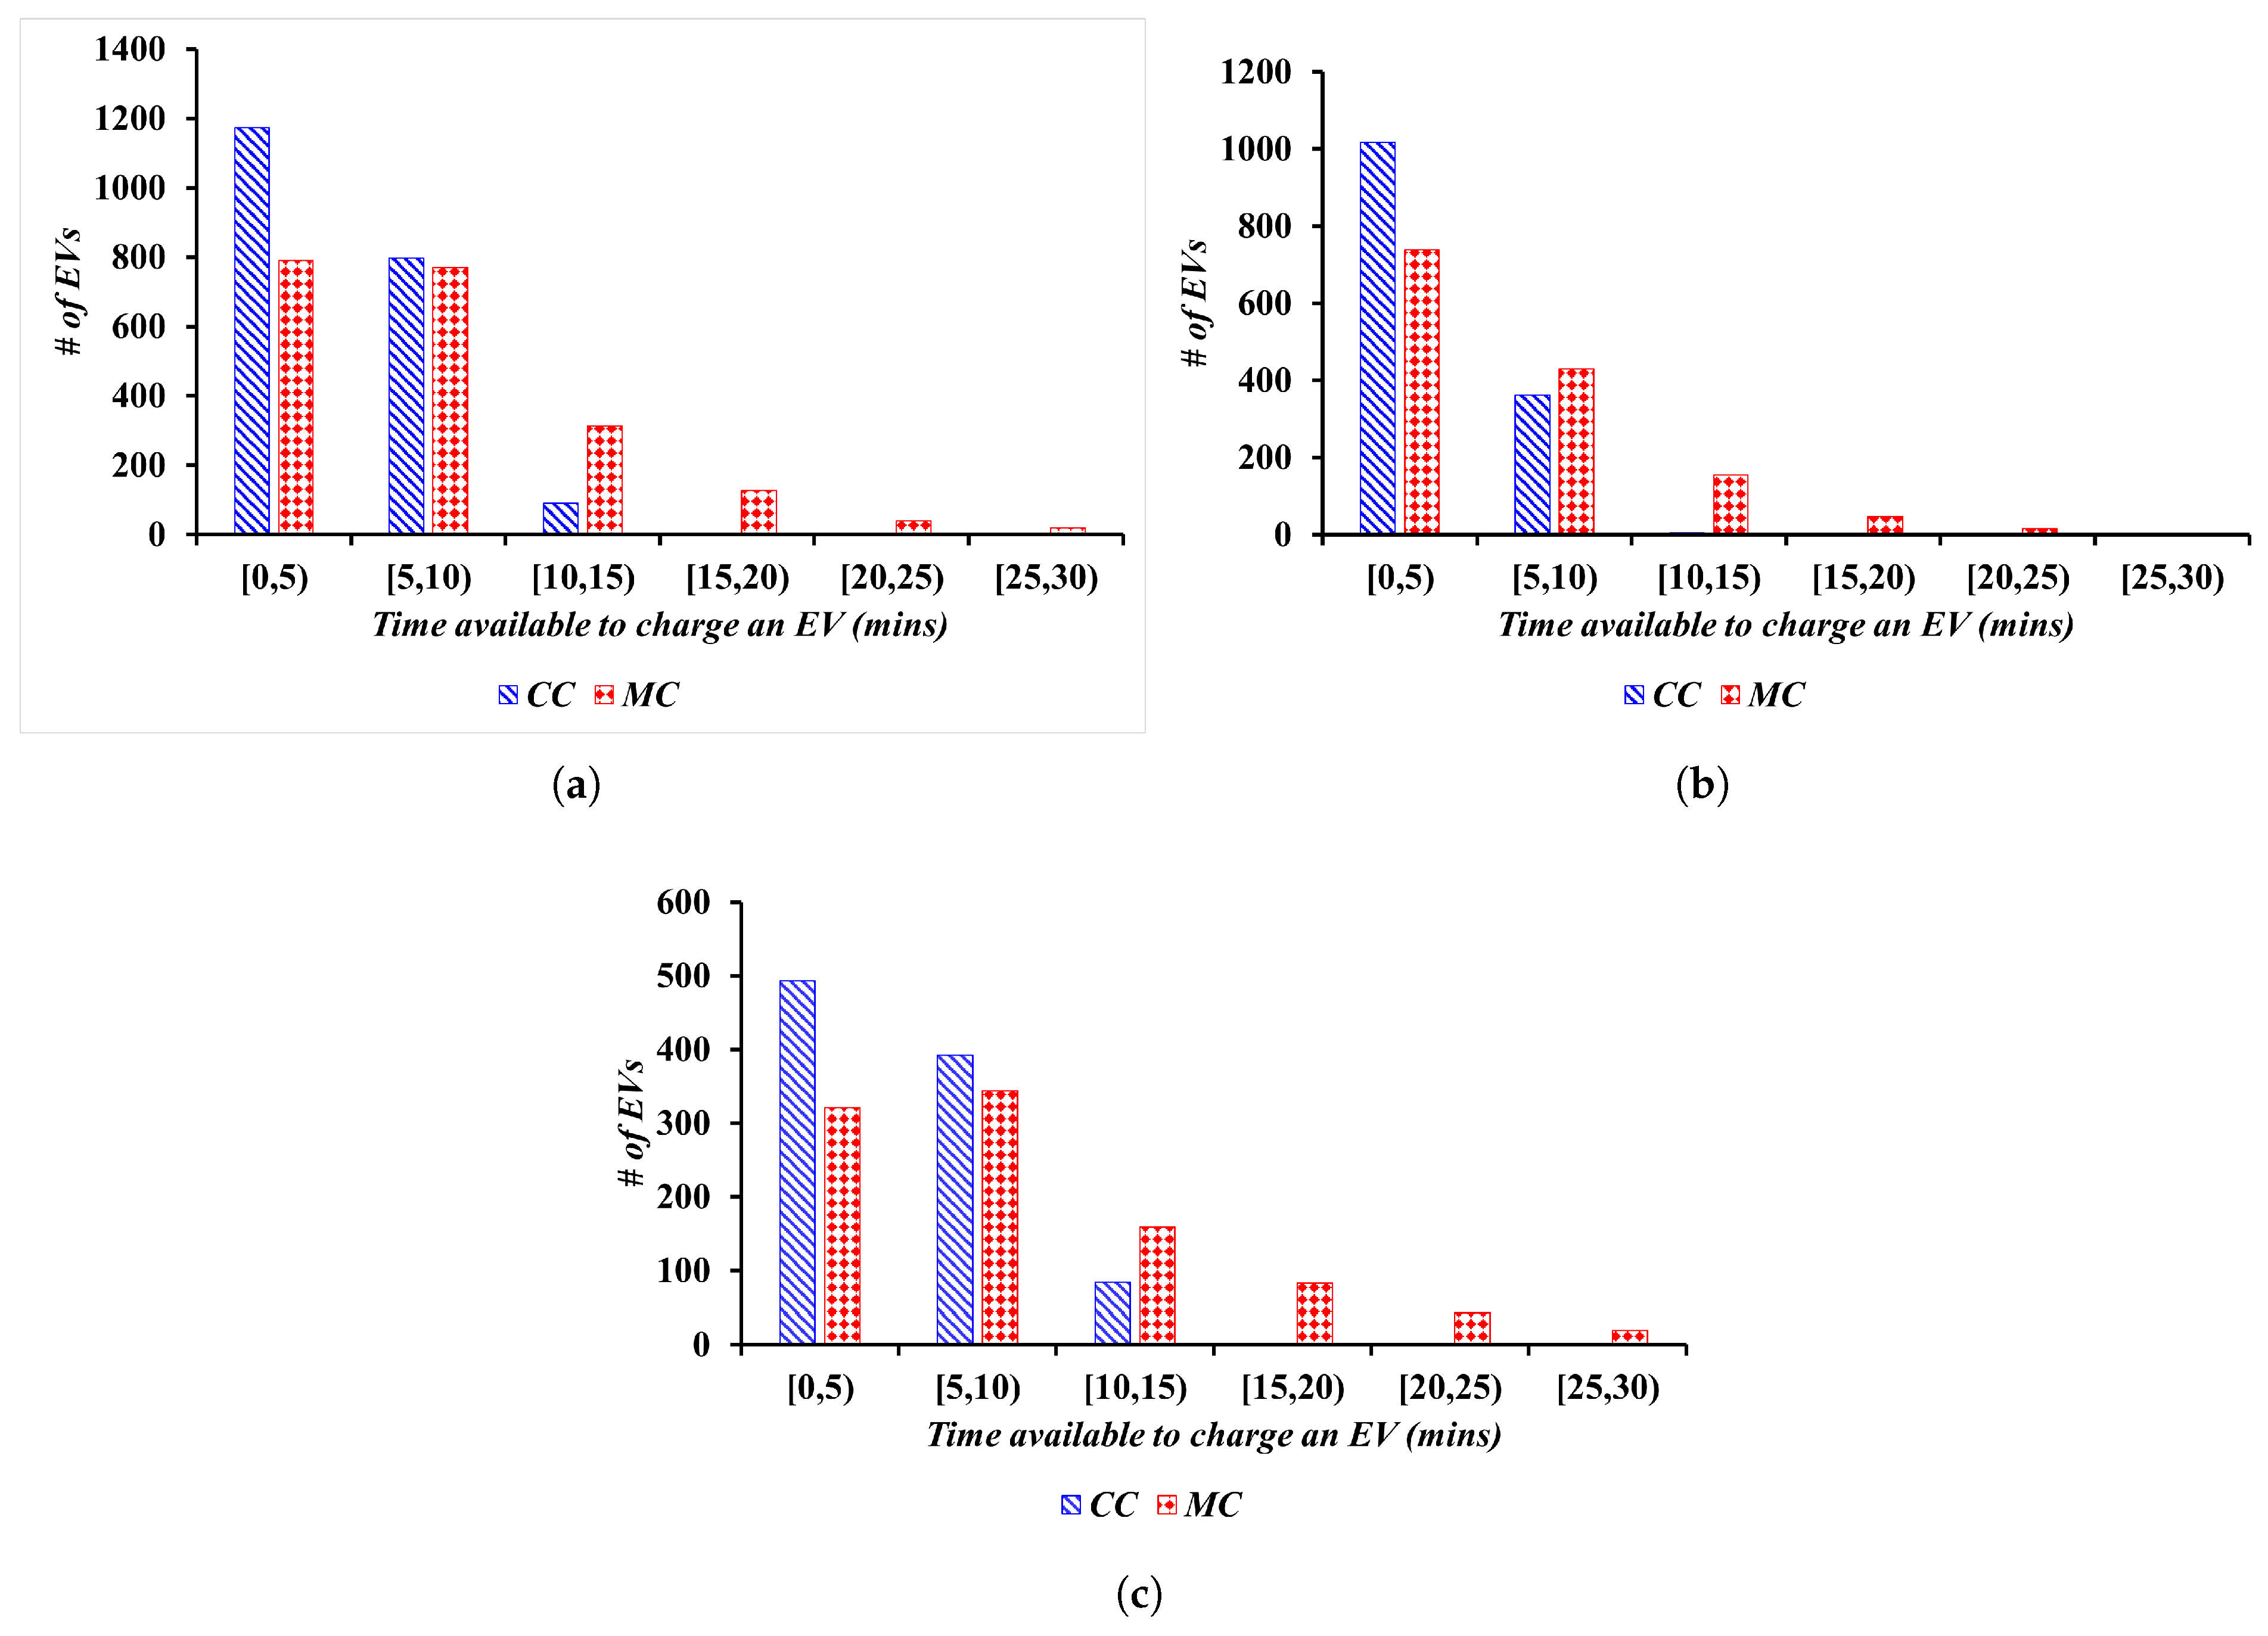
To initiate the analysis, the first simulation run at the three EVFCFs is comprehensively discussed. A total of 2031, 1384, and 969 EVs were generated in this simulation run at the Austin, Seattle, Boston EVFCFs, respectively. Statistics on proportion of EVs that requested different values of energy demand, their type defined by the battery capacity, and their selected alternative fuel grades are presented in Table 3. Figure 6 compares the time available to the EVFCF under CC and MC to charge the visiting vehicles. On average, with MC, each EV provides approximately 5 min additional time to uplift their state of charge from its initial to desired value, compared with CC at the three EVFCFs.
The EVFCFs’ maximum mean power demand, the operational revenue, the cost and profit with CC and MC, the benefit-to-cost ratio, and the percentage change in operational profit for the first simulation run are reported in Table 4. Although the EVFCFs experience a reduction in operational revenue due to offering the charging service at a lower per-unit price, the implementation of the proposed solution results in significant operational cost savings. This results in BCR values greater than one across all the three EVFCFs. In this simulation, the EVFCFs operating in Austin, Seattle, and Boston achieve operational profit increases of 1.5%, 14.3%, and 79.8%, respectively, by adopting the proposed solution. While Δ P ¯ f M and the consequent Δ c are substantial at both the Austin and Boston EVFCFs, their contribution to % Δ π is notably lower in Austin. This is due to a higher number of EVs visiting the Austin facility, resulting in a greater Δ r . These findings suggest that managing EV charging at EVFCFs is a promising solution in all facility utilization scenarios, but its impact will be particularly greater at facilities with lower EV arrivals—a scenario that is more prevalent at most EVFCFs in the United States particularly during the early stages of EV adoption.
Ninety-five percent confidence limits around the means for the 500 simulations are presented in Table 5. These results indicate that Δ c exceeds Δ r by 31 ± 5%, 51 ± 6%, and 131 ± 10%, and % Δ π equals 5.3 ± 3.145%, 20.3 ± 8.38%, and 25.9 ± 8.64% at the three facilities, respectively, demonstrating the effectiveness of the proposed solution under all utilization scenarios. In addition, it is observed that the increase in profits is inversely related to the facility utilization rates. As facility utilization increases, the relative impact of cost savings from reducing demand peaks diminishes. This occurs because, at higher utilization levels, the reduction in operational revenues outweighs the cost savings. These findings suggest that, at EVFCFs that experience a low utilization, higher charging service price discounts can be offered to the visiting EVs while still being able to generate additional operational profits with MC.
Figure 7 displays the reduction in maximum mean power demand ( Δ P ¯ f M [ T ] ) at the three EVFCFs. On average, Δ P ¯ f M [ T ] is higher in Austin and Boston compared with Seattle, indicating that, in addition to the number of daily EV visits, the time between consecutive EV arrivals is another key factor influencing the outcomes. At the Austin and Boston facilities, the time between consecutive EV arrivals is shorter, as shown in Figure 3, resulting in a higher number of simultaneous EV visits. Effectively managing charging profiles at these EVFCFs leads to a greater reduction in the maximum mean power demand. This in turn yields a correspondingly higher improvement in operational profits, indicating that the proposed solution offers more promising results at such EVFCFs.

4.2. Impact of Maximum Demand Prices

As described by the mathematical expressions in Section 3.3, an EVFCF’s operational cost—and consequently its operational profit—is directly proportional to the maximum demand price. To assess how variations in maximum demand prices affect the feasibility of the proposed solution, this subsection expands on the operations of EVFCFs discussed in the previous subsection. Specifically for simulation purposes, maximum demand prices are varied between USD 5 and USD 45 per kW, based on the range of these prices reported in the State of Massachusetts (as outlined in [49]), with price steps of USD 2.5 per kW. For each maximum demand price, 500 simulations are conducted to evaluate the impact on the EVFCF’s performance.
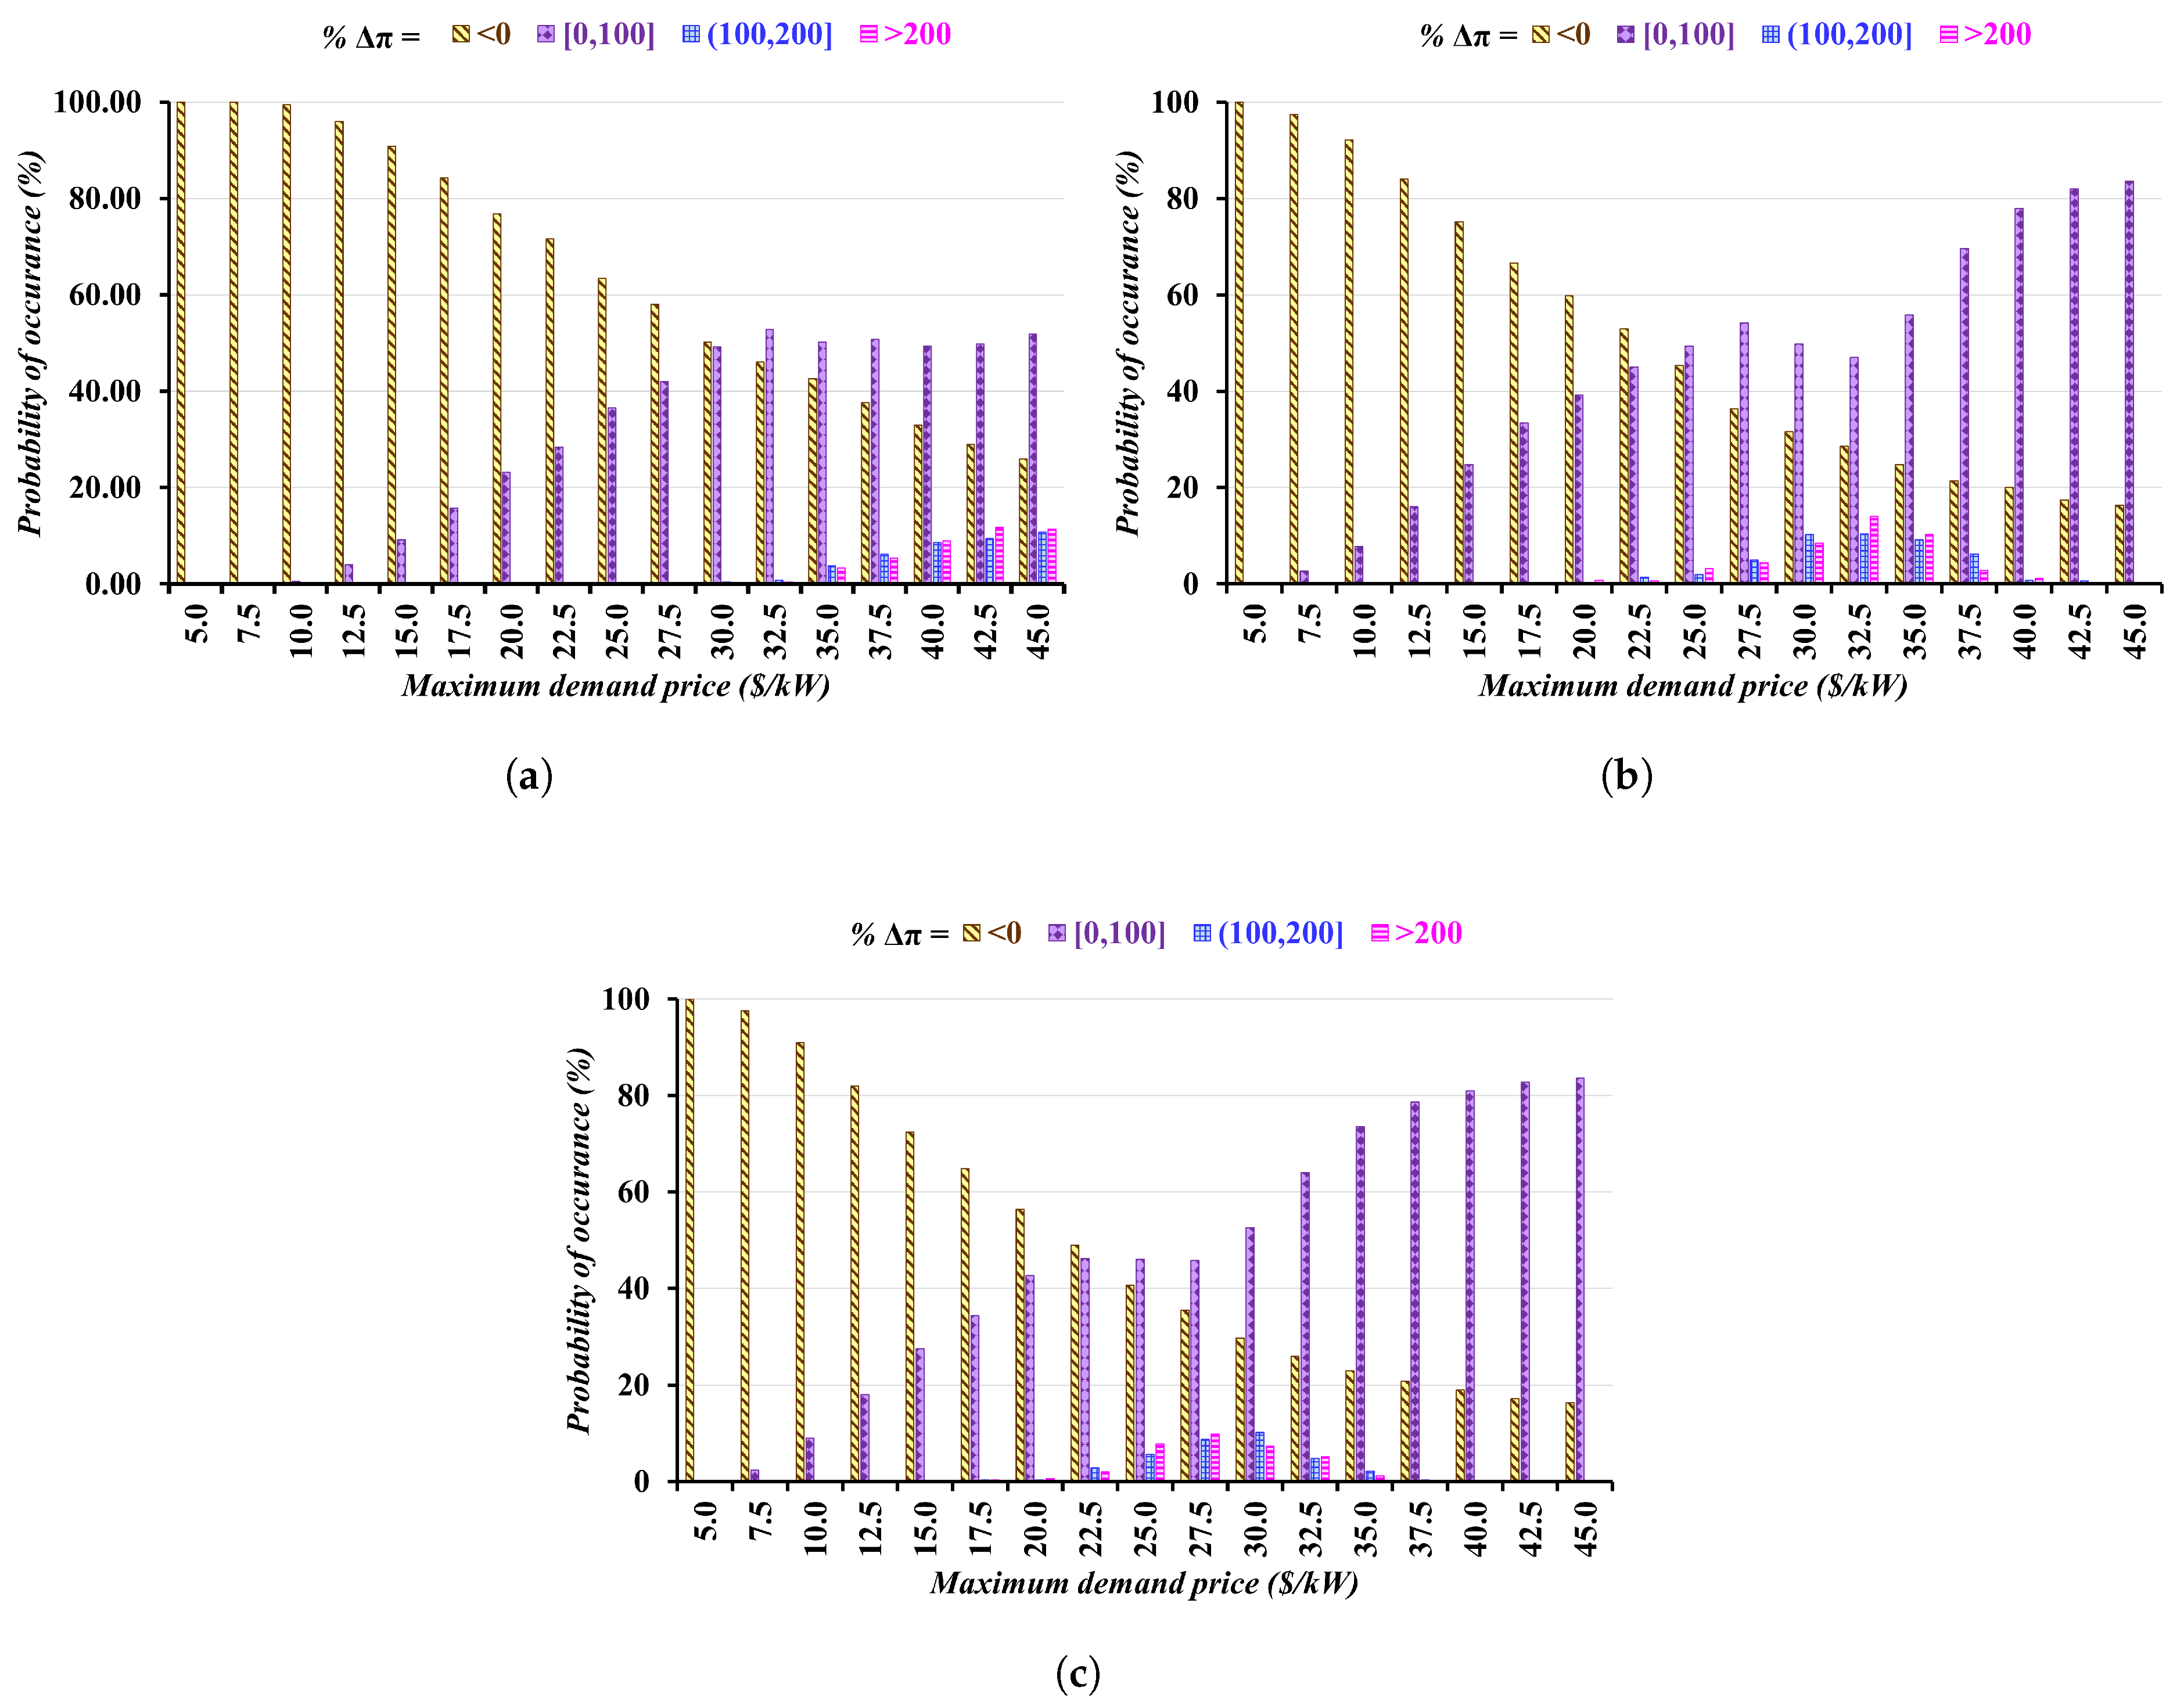
The results from these simulations show that the feasibility of the proposed solution increases proportionally with higher maximum demand prices, regardless of the facility utilization scenario. As illustrated in Figure 8, at low maximum demand prices, 100% of the simulations conducted report a decrease in operational profits when deploying the proposed solution at all three EVFCFs. However, this infeasibility changes significantly as maximum demand prices rise. When these prices reach USD 45 per kW, 84% of the simulations at the EVFCFs operating in Boston and Seattle and 74% of the simulations at the Austin EVFCF render an increase in operational profits.
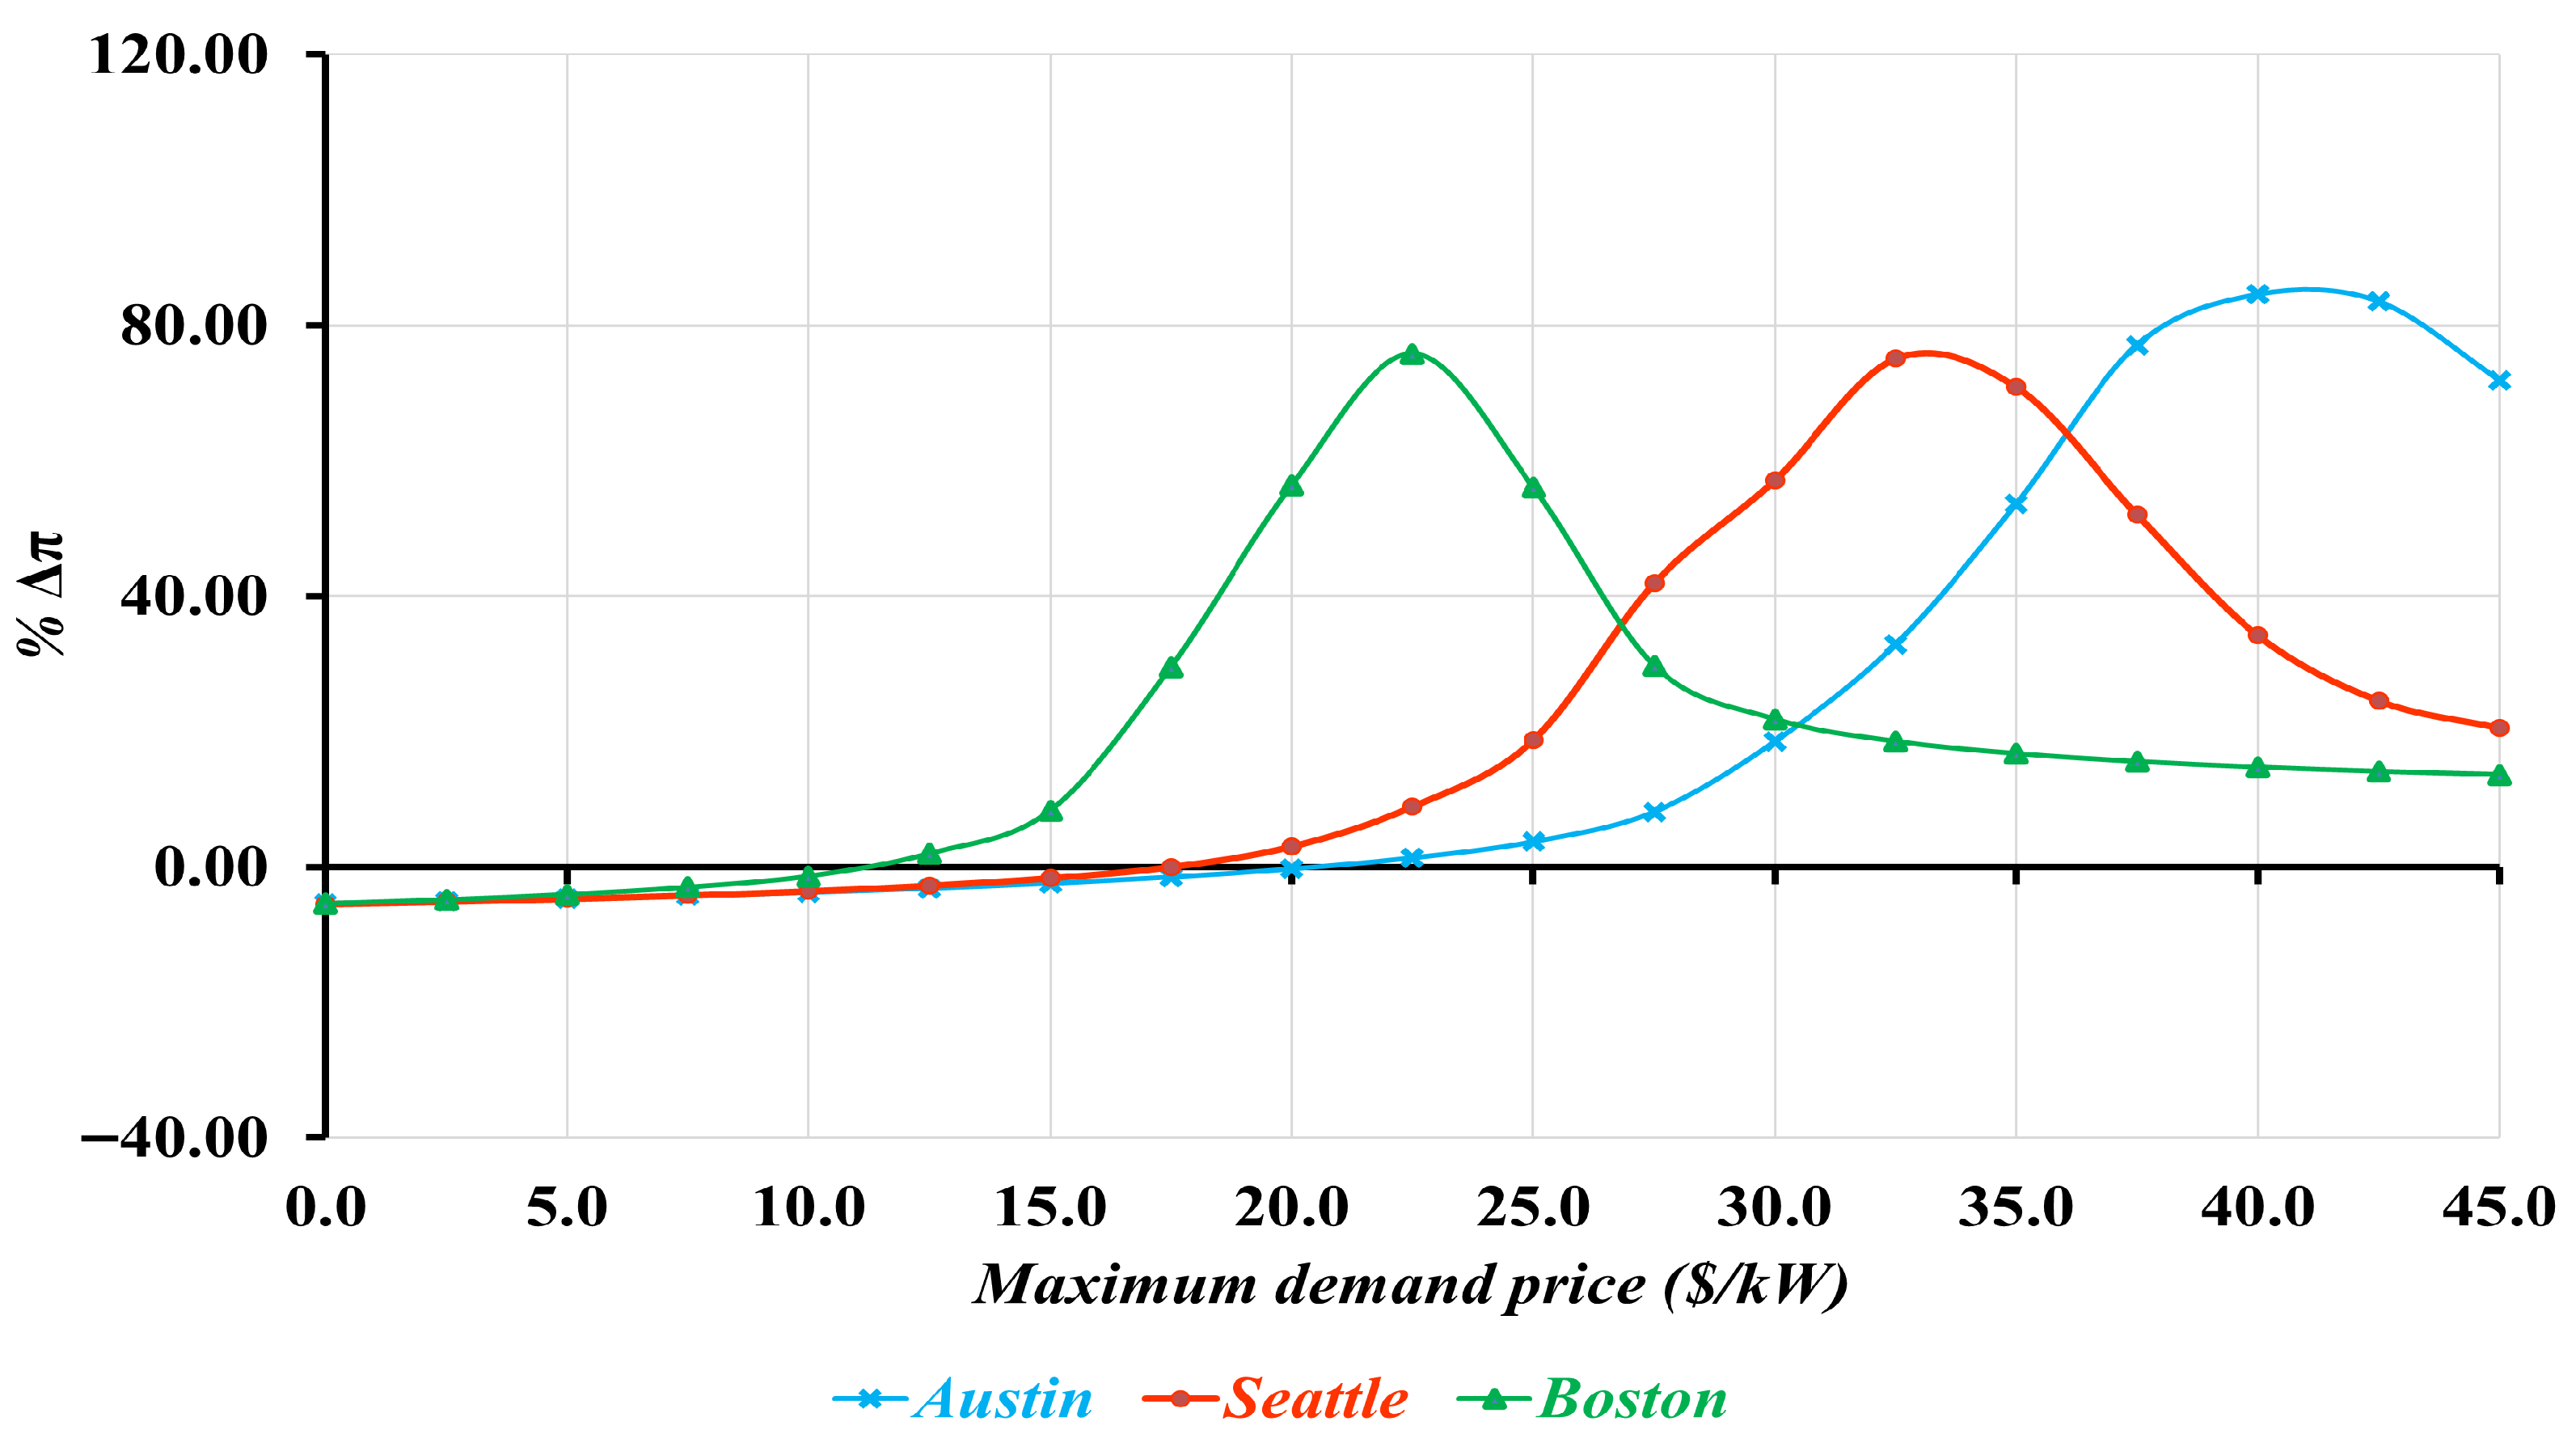
Additionally, Figure 9 presents the average % Δ π of deploying the proposed solution at the three EVFCFs, calculated over the 500 simulations. While the feasibility of the proposed solution generally increases with rising maximum demand prices, % Δ π decreases after reaching its optimal values, which occur at maximum demand prices of USD 22.5, USD 32.5, and USD 40 per kW for EVFCFs in Boston, Seattle, and Austin, respectively. Although % Δ π remains positive beyond these points, it declines to approximately 10% as maximum demand prices are further increased. This is because, at higher maximum demand prices, the operational costs of the EVFCFs become so significant that reduction in maximum mean power demand contributes only a small amount to recovering these costs. This trend suggests that, while the proposed solution will be effective as maximum demand prices increase, at excessively high maximum demand prices, the EVFCFs incur such significant losses that clipping demand peaks results in only minimal recovery of those losses. Consequently, it can be argued that the implementation of managed charging solutions that aim to reduce EVFCF demand peaks may only be applicable in communities where maximum demand prices offered by incumbent electric utilities are not outrageous. When that is the case, commercial EV rate schedules that offer reduced maximum demand prices [50] may be a more promising alternative to address the MDPC issue.

4.3. Impact of User Preferences

This subsection analyzes the effectiveness of implementing the proposed solution when user preferences of selecting the various alternative fuel grades, i.e., their selection probabilities, vary. Indeed, users prefer alternative fuel grade options that offer them the most utility, as discussed in Section 3.5. Thus far, it is assumed that U j s = ρ 0 for all s S , resulting in an equal probability of selecting any option.
Two different alternative fuel grade selection cases are considered (see Table 7). Case 1 assumes that the EVFCF is located at sites where users highly prefer cost saving compared with the additional time they would have to spend to replenish the depleted charge of their vehicles. This reflects a case where the EVFCF is located at a grocery store, for example, where users may be running errands while charging and are therefore more willing to allow for longer charging times. In such a setting, U j s will be the highest upon selecting the cheapest alternative fuel-grade option, corresponding to the lowest power supply level, and will scale downwards as the per-unit cost to charge their vehicle increases, i.e., U j 1 > U j 2 > > U j S .
In contrast, Case 2 assumes that the EVFCF is located, for instance, along highway corridors, where users are likely to prioritize rapid charging. In this case, U j s will be highest upon selecting the fuel grade with the highest power supply level, resulting in the least time to charge their vehicle, and will decrease as the time required to charge their vehicles increases, i.e., U j S > U j S 1 > > U j 1 .
This subsection assumes that U j s is a linear function of the per-unit bill saving ( Δ γ j s ) , i.e.,
U j s = ρ 0 + ρ 1 · Δ γ j s
In the above equation, ρ 0 and ρ 1 are explanatory coefficients, and Δ γ j s is calculated as follows:
Δ γ j s = γ j s γ
The explanatory coefficients used to simulate the two cases are provided in Table 6, while the resulting probabilities for selecting alternative fuel grades are outlined in Table 7. For both cases, 500 simulations are conducted for the Austin, Seattle, and Boston EVFCFs, with all other EV attributes held constant and the probability of selecting different fuel grades varied. The simulation results, reported in Table 8, Table 9 and Table 10, show that the effectiveness of the proposed solution is consistently and considerably higher when implemented at EVFCFs where users are more likely to prioritize rapid charging. As such, while the reduction in maximum mean power demand is generally greater in Case 1 across regions, leading to a higher Δ c , the EVFCF also faces a higher Δ r as more users opt for the cheaper fuel-grade options, which outpaces the cost reduction. Hence, the BCR significantly increases when transitioning from Case 1 to Case 2 and the simulation results show that the proposed solution will render higher benefits to EVFCFs where a higher share of EV users will select alternative fuel-grade option corresponding to the higher power demand levels.
5. Discussions and Conclusions

The adverse impacts of the MDPC are widely recognized as a key barrier to the deeper and equitable penetration of EVFCFs. To address this issue, this study proposes a managed charging solution that provides the visiting EVs with a list of options, the so-called alternative fuel grades, upon arrival at an EVFCF. Each option corresponds to a specific power supply level and an associated per-unit charging service price. As such, options corresponding to a lower power supply level allow more time to charge the EV and are more heavily discounted. The EVFCF then uses this additional time to manage the EV’s charging profile with the objective of reducing the facility’s power demand peaks and, consequently, lower the MDPC of its electricity bill.
Using real-world data from the EV Watts database, the solution is implemented under high, medium, and low EVFCF utilization scenarios. Simulation results indicate that the proposed solution can improve the EVFCFs’ operational profits, on average, by 5–26%, under the three scenarios. These increases in operational profits across all scenarios demonstrate the feasibility of the solution.
The simulation results also highlight the key importance of EVFCF utilization characteristics, particularly the time between consecutive EV arrivals at an EVFCF. It is concluded that the EVFCFs that observe low numbers of daily EV arrivals but where these arrivals are concentrated during specific hours of a day can benefit significantly from managing EV charging profiles.
Moreover, the role of the incumbent electric utility-specified maximum demand prices is comprehensively studied, and it is shown that, at extremely high maximum demand prices, managing EV charging results in only a minimal recovery of an EVFCF’s costs. In such cases, EV-specific tariffs that offer reduced maximum demand prices may be a more promising option to address the MDPC issue.
Furthermore, the impact of user preferences on the successful implementation of the proposed managed charging solution is explored. The results emphasize that the outcomes of implementing the proposed solution, i.e., the change in EVFCF’s operational profits, are higher for EVFCFs where more users are likely to prefer rapid charging.
Overall, the findings underscore the complexities and dynamic nature of managing EV charging load at EVFCFs. The proposed managed charging solution, combined with a thorough understanding of EVFCF utilization characteristics, the electric utility’s specified maximum demand prices, and the EV users’ preferences, can assist EVFCF operators in making more informed decisions. This research, however, has some limitations where further investigations should be made. For instance, in this work, the prices corresponding to the different levels of power demands were fixed. This could be further expanded by developing and integrating different pricing models that account for the impact of maximum mean power demand, where the set of alternative fuel grade options and their prices are not fixed but vary at each sampling instance, based on the facility’s maximum mean power demand at that instance. Additionally, while the proposed solution has been simulated under real-world conditions, its application at an existing EVFCF is yet to be tested, which could provide further insights into its effectiveness. For instance, EV users may respond to the price discounts differently at EVFCFs located at different locations. However, real-world information on the EV user’s charging habits and charging preferences was not contained in the EV Watts dataset. These data can further inform the deployment of the proposed solution. In addition, to address the MDPC issue, several utilities across the US have also offered commercial EV rate schedules that provide alternatives to the maximum demand prices (for a comprehensive discussion on commercial EV rate schedules, see [50]), for instance, by integrating these prices into the time-of-use EPC. Comparing benefits of the proposed solution with the implementation of these rate schedules would shed light on its comparative effectiveness.

Author Contributions

Conceptualization, M.T.K. and A.R.; methodology, M.T.K.; software, M.T.K., A.R., and M.V.B.; validation, M.T.K. and M.V.B.; formal analysis, M.T.K. and M.V.B.; investigation, M.T.K. and M.V.B.; resources, M.T.K. and M.V.B.; data curation, M.T.K. and M.V.B.; writing—original draft preparation, M.T.K.; writing—review and editing, M.T.K. and A.-P.W.; visualization, M.T.K. and M.V.B.; supervision, A.-P.W.; project administration, M.T.K. and A.-P.W. All authors have read and agreed to the published version of the manuscript.

Funding

This research received no external funding.

Institutional Review Board Statement

Not applicable.

Informed Consent Statement

Not applicable.

Data Availability Statement

Data are available upon request.

Conflicts of Interest

The authors declare no conflicts of interest.

Abbreviations

SymbolDescription
Sets
T set of sampling instances in a billing period
J t set of EVs connected to a charger at time t—the so-called active set
S set of alternative fuel-grade options
Parameters
nnumber of chargers installed at the EVFCF
δ duration between two consecutive sampling instances
θ duration of a demand interval
η capability of each charger installed at the EVFCF
β linear discount rate
ζ 0 monthly fixed price
ζ 1 per-unit energy price
ζ 2 per-unit maximum demand price
ρ 0 , ρ 1 explanatory coefficients
Variables
t T index for a sampling instance
s S index for each alternative fuel grade option
j J t index for an EV in the active set
P ¯ f mean power supply to the EVFCF over a demand interval
P ¯ f M highest value of mean power supply to the EVFCF
P f instantaneous power supply to the EVFCF
p j instantaneous power supply to EV j
a j arrival time of EV j
κ j battery capability of EV j
μ j state of charge of EV j
μ ¯ j desired state of charge by EV j
b j battery capacity of EV j
d j remaining duration to charge EV j
π EVFCF’s operational profits over a billing period
cEVFCF’s operational cost over a billing period
rEVFCF’s operational revenue over a billing period
r j                 revenue collected by EVFCF from EV j
α j s probability of selection of option s by EV j
γ j s per-unit charging price for EV j corresponding to the selected option s
ψ j s power supply level corresponding to option s selected by EV j
U j s utility received by EV j when it selects option s

References

  1. Colombo, C.G.; Borghetti, F.; Longo, M.; Yaici, W.; Miraftazadeh, S.M. Decarbonizing transportation: A data-driven examination of ICE vehicle to EV transition. Clean. Eng. Technol. 2024, 21, 100782. [Google Scholar] [CrossRef]
  2. United States Environmental Protection Agency. Inventory of US Greenhouse Gas Emissions and Sinks. 2022. Available online: https://www.epa.gov/ghgemissions/inventory-us-greenhouse-gas-emissions-and-sinks (accessed on 31 December 2024).
  3. Needell, Z.A.; McNernery, J.; Chang, M.T.; Tranick, J.E. Potential for widespread electrification of personal vehicle travel in the United States. Nat. Energy 2016, 1, 16112. [Google Scholar] [CrossRef]
  4. Biresselioglu, M.E.; Kaplan, M.D.; Yilmaz, B.K. Electric mobility in Europe: A comprehensive review of motivators and barriers in decision making process. Transp. Res. Part A Policy Pract. 2018, 109, 1–13. [Google Scholar] [CrossRef]
  5. Hardman, S.; Tal, G. Understanding discontinuance among California’s electric vehicle owners. Nat. Energy 2021, 6, 538–545. [Google Scholar] [CrossRef]
  6. Kempton, W. Electric vehicles driving range. Nat. Energy 2016, 1, 16131. [Google Scholar] [CrossRef]
  7. Kontou, E.; Liu, C.; Xie, F.; Wu, X.; Lin, X. Understanding the linkage between electric vehicle charging network coverage and charging opportunity using GPS travel data. Transp. Res. Part C 2018, 98, 1–13. [Google Scholar] [CrossRef]
  8. Lee, H.; Clark, A. Charging the Future: Challenges and Opportunities for Electric Vehicle Adoption; Belfer Center for Science and International Affairs, Harvard University: Cambridge, MA, USA, 2018. [Google Scholar]
  9. U.S. Department of Transportation. President Biden, U.S. Department of Transportation Releases Toolkit to Help Rural Communities Build out Electric Vehicle Charging Infrastructure. 2 February 2022. Available online: https://www.transportation.gov/briefing-room/president-biden-us-department-transportation-releases-toolkit-help-rural-communities (accessed on 31 December 2024).
  10. Wei, W.; Ramakrishnan, S.; Needell, Z.A.; Trancik, J.E. Personal vehicle electrification and charging solutions for high-energy days. Nat. Energy 2021, 6, 105–114. [Google Scholar] [CrossRef]
  11. Lee, Z.J.; Pang, J.Z.; Low, S.H. Pricing EV charging service with demand charge. Electr. Power Syst. Res. 2020, 189, 106694. [Google Scholar] [CrossRef]
  12. McFarlane, D.; Prorok, M.; Jordan, B.; Kemabonta, T. Analytical White Paper: Overcoming Barriers to Expanding Fast Charging Infrastructure in the Midcontinent Region; Great Plains Institute: Minneapolis, MN, USA, 2019. [Google Scholar]
  13. Tucker, D. Demand Charges & Electric Vehicle Fast-Charging—An Inter-Mountain West Assessment; National Association of State Energy Officials: Arlington, VA, USA, 2021. [Google Scholar]
  14. Muratori, M.; Kontou, E.; Eichman, J. Electricity rates for electric vehicle direct current fast charging in the United States. Renew. Sustain. Energy Rev. 2019, 113, 109235. [Google Scholar] [CrossRef]
  15. Hussain, A.; Bui, V.-H.; Baek, J.-W.; Kim, H.-M. Stationary energy storage system for fast EV charging stations: Simultaneous sizing of battery and converter. Energies 2019, 12, 4516. [Google Scholar] [CrossRef]
  16. Hussain, A.; Bui, V.-H.; Baek, J.-W.; Kim, H.-M. Stationary energy storage system for fast EV charging stations: Optimality analysis and results validation. Energies 2020, 428, 230. [Google Scholar] [CrossRef]
  17. Zhou, G.; Zhao, Y.; Lai, C.S.; Jia, Y. A profitability assessment of fast-charging stations under vehicle-to-grid smart charging operation. J. Clean. Prod. 2023, 13, 139014. [Google Scholar] [CrossRef]
  18. Qin, J.; Poolla, K.; Varaiya, P. Mobile storage for demand charge reduction. IEEE Trans. Intell. Transp. Syst. 2021, 23, 7952–7962. [Google Scholar] [CrossRef]
  19. Ghofrani, M.; Majidi, M. A comprehensive optimization framework for EV-renewable DG coordination. Electr. Power Syst. Res. 2021, 194, 107086. [Google Scholar] [CrossRef]
  20. Peinado-Guerrero, M.A.; Villalobos, J.R.; Phelan, P.E.; Campbell, N.A. Stochastic framework for peak demand reduction opportunities with solar energy for manufacturing facilities. J. Clean. Prod. 2021, 313, 127891. [Google Scholar] [CrossRef]
  21. Lee, Z.J.; Lee, G.; Lee, T.; Jin, C.; Lee, R.; Low, Z.; Chang, D.; Ortega, C.; Low, S.H. Adaptive charging networks: A framework for smart electric vehicle charging. IEEE Trans. Smart Grid 2021, 12, 4339–4350. [Google Scholar] [CrossRef]
  22. Alexeenko, P.; Bitar, E. Achieving reliable coordination of residential plug-in electric vehicle charging: A pilot study. arXiv 2021, arXiv:2112.04559. [Google Scholar] [CrossRef]
  23. Buckreus, R.; Aksu, R.; Kisacikoglu, M.; Yavuz, M.; Balasubramanian, B. Optimization of multiport DC fast charging stations operating with power cap policy. IEEE Trans. Transp. Electrif. 2021, 7, 2402–2413. [Google Scholar] [CrossRef]
  24. Khalid, M.T.; Rzonca, A.; Sauer, P.; Witmer, A.-P. Managed charging solution to mitigate adverse impact of the maximum demand payment component of a commercial electric vehicle fast-charging facility’s electricity bill. In Proceedings of the CIGRE U.S. National Committee 2022 Grid of the Future Symposium, Chicago, IL, USA, 7 November 2022; pp. 1–9. [Google Scholar]
  25. Calearo, L.; Ziras, C.; Sevdari, K.; Marinelli, M. Comparison of smart charging and battery energy storage system for a PV prosumer with an EV. In Proceedings of the IEEE PES Innovative Smart Grid Technologies Europe, Espoo, Finland, 18–21 October 2021; pp. 1–6. [Google Scholar]
  26. Das, H.S.; Rahman, M.M.; Li, S.; Tan, C.W. Electric vehicles standards, charging infrastructure, and impact on grid integration: A technological review. Renew. Sustain. Energy Rev. 2020, 120, 109618. [Google Scholar] [CrossRef]
  27. Mukherjee, J.C.; Gupta, A. A review of charge scheduling of electric vehicles in smart grid. IEEE Syst. J. 2015, 9, 1541–1553. [Google Scholar] [CrossRef]
  28. Ma, Z.; Callaway, D.S.; Hiskens, I.A. Decentralized charging control of large populations of plug-in electric vehicles. IEEE Trans. Control Syst. Technol. 2013, 21, 67–78. [Google Scholar] [CrossRef]
  29. Frendo, O.; Gaertner, N.; Stuckenschmidt, H. Real-time smart charging based on precomputed schedules. IEEE Trans. Smart Grid 2019, 10, 6921–6932. [Google Scholar] [CrossRef]
  30. Saner, C.B.; Trivedi, A.; Srinivasan, D. A cooperative hierarchical multi-agent system for EV charging scheduling in presence of multiple charging stations. IEEE Trans. Smart Grid 2022, 13, 2218–2233. [Google Scholar] [CrossRef]
  31. Bitar, E.; Xu, Y. Deadline differentiated pricing of deferrable electric loads. IEEE Trans. Smart Grid 2017, 8, 13–25. [Google Scholar] [CrossRef]
  32. Bailey, M.; Brown, D.; Shaffer, B.; Wolak, F. Show Me the Money! Incentives and Nudges to Shift Electric Vehicle Charging Time; National Bureau of Economic Research Working Papers; National Bureau of Economic Research: Cambridge, MA, USA, 2021. [Google Scholar]
  33. Wang, H.; Jia, Y.; Shi, M.; Xie, P.; Lai, C.S.; Li, K. A Hybrid Incentive Program for Managing Electric Vehicle Charging Flexibility. IEEE Trans. Smart Grid 2023, 14, 476–488. [Google Scholar] [CrossRef]
  34. Bitar, E.; Low, S. Deadline differentiated pricing of deferrable electric power service. In Proceedings of the 51st IEEE Conference on Decision and Control, Maui, HI, USA, 10–13 December 2012; pp. 4491–4497. [Google Scholar]
  35. Nayyar, A.; Negrete-Pincetic, M.; Poolla, K.; Varaiya, P. Duration-differentiated energy service with continuum of loads. In Proceedings of the 53rd IEEE Conference on Decision and Control, Los Angeles, CA, USA, 15–17 December 2014; pp. 1714–1719. [Google Scholar]
  36. Ghosh, A.; Aggarwal, V. Control of charging of electric vehicles through menu-based pricing. IEEE Trans. Smart Grid 2018, 9, 5918–5929. [Google Scholar] [CrossRef]
  37. Salah, F.; Flath, C.M. Deadline differentiated pricing in practice: Marketing EV charging in car parks. Comput. Sci.-Res. Dev. 2016, 31, 33–40. [Google Scholar] [CrossRef]
  38. Limmer, S.; Rodemann, T. Multi-objective optimization of plug-in electric vehicle charging prices. In Proceedings of the 2017 IEEE Symposium Series on Computational Intelligence, Honolulu, HI, USA, 27 November–1 December 2017; pp. 1–8. [Google Scholar]
  39. Baryam, I.S.; Ismail, M.; Abdallah, M.; Qaraqe, M.; Serpedin, K. A pricing-based load shifting framework for EV fast charging stations. In Proceedings of the 2014 IEEE International Conference on Smart Grid Communications, Venice, Italy, 3–6 November 2014; pp. 3–6. [Google Scholar]
  40. Liu, Y.; Deng, R. A stochastic game approach for PEV charging station operation in smart grid. IEEE Trans. Ind. Inform. 2018, 14, 969–979. [Google Scholar] [CrossRef]
  41. EVgo. DCFC Cost Components: Much More than Electricity! August 2021. Available online: https://www.evgo.com/blog/dcfc-cost-components-much-more-than-electricity/ (accessed on 31 December 2024).
  42. Train, K.E. Discrete Choice Methods with Simulation; Cambridge University Press: Cambridge, UK, 2009. [Google Scholar]
  43. Sica, L.; Carboni, A.; Deflorio, F.; Botta, C. Electric vehicle recharging options in urban areas: Discrete choice modeling to estimate user preference. Sustain. Cities Soc. 2025, 121, 106175. [Google Scholar] [CrossRef]
  44. U.S. Department of Energy. EV Watts Public Database. January 2024. Available online: https://livewire.energy.gov/ds/evwatts/evwatts.public (accessed on 31 December 2024).
  45. United States Forest Service. Saving Money by Understanding Demand Charges on Your Electric Bill. December 2000. Available online: https://www.fs.usda.gov/t-d/pubs/htmlpubs/htm00712373/index.htm (accessed on 31 December 2024).
  46. Ucer, E.; Koyuncu, I.; Kisacikoglu, M.C.; Yavuz, M.; Meintz, A.; Rames, C. Modelling and analysis of a fast charging station and evaluation of service quality for electric vehicles. IEEE Trans. Transp. Electrif. 2019, 5, 215–225. [Google Scholar] [CrossRef]
  47. Eversource Energy. Summary of Electric Service Delivery Rates. August 2024. Available online: https://www.eversource.com/content/docs/default-source/rates-tariffs/ma-electric/1-tariff-ma.pdf?sfvrsn=2c5b9f03_11 (accessed on 31 December 2024).
  48. O‘Dell, J. How Much Does DC Fast Charging for EVs Really Cost? November 2023. Available online: https://www.forbes.com/home-improvement/garage/car-accessories/ev-fast-charging-cost/ (accessed on 31 December 2024).
  49. National Renewable Energy Laboratory. Identifying Potential Markets for Behind-the-Meter Battery Energy Storage: A Survey of U.S. Demand Charges. August 2017. Available online: https://www.nrel.gov/docs/fy17osti/68963.pdf (accessed on 31 December 2024).
  50. Khalid, M.T.; Teckchandani, P.; Witmer, A.P. Alternatives to non-coincident maximum-demand charges for electric vehicle fast-charging in the United States. Electr. Veh. 2024; under review. [Google Scholar]
Figure 1. Time characterization of a billing period.
Electricity 06 00062 g001
Figure 2. Range of number of hourly EV arrivals at EVFCFs operating in different metropolitan areas.
Electricity 06 00062 g002
Figure 3. Mean time between consecutive EV arrivals during each hour of the day at EVFCFs operating in different metropolitan areas.
Electricity 06 00062 g003
Figure 4. Initial state of charge of EVs visiting the three EVFCFs between 06:00 and 07:00 p.m.
Electricity 06 00062 g004
Figure 5. Different types of EVs, defined by their battery capacities, visiting the three EVFCFs.
Electricity 06 00062 g005
Figure 6. Time available to charge an EV under CC and MC: (a) EVFCF operating in Austin, (b) EVFCF operating in Seattle, and (c) EVFCF operating in Boston.
Electricity 06 00062 g006
Figure 7. Reduction in EVFCFs’ maximum mean power demand due to implementing the proposed solution.
Electricity 06 00062 g007
Figure 8. Impact of varying maximum demand prices on the feasibility of the proposed managed charging solution: (a) EVFCF operating in Austin, (b) EVFCF operating in Seattle, and (c) EVFCF operating in Boston.
Electricity 06 00062 g008
Figure 9. Average percentage increase in EVFCFs’ operational profits upon varying maximum demand prices.
Electricity 06 00062 g009
Table 1. Electricity prices.
θ (minutes) ζ 0 (USD) ζ 1 (USD/kWh) ζ 2 (USD/kW)
303700.081427.51
Table 2. Alternative fuel grade options.
OptionABC
ψ j s (kW)150250350
γ j s (USD/kWh)0.50.5250.55
Table 3. Vehicle attribute statistics (%).
AttributeAustinSeattleBoston
EV Type
134.632.335.1
232.434.831.9
332.832.832.8
Alternative Fuel Grade
A32.234.534.1
B34.933.333.0
C32.732.132.8
Energy Demand (kWh)
0–2039.251.533.0
20–4037.936.833.7
40–6019.311.226.2
60–803.30.47.0
Table 4. Simulation # 1 results.
EVFCFAustinSeattleBoston
Charging MethodCCMC Δ CCMC Δ CCMC Δ
P ¯ f M [ T ] (kW)63052210839735443630504126
r (USD)31,59028,745284516,79816,05973816,80716,033774
c (USD)22,37619,394298313,76812,597117120,18916,7163473
π (USD)9213935013830293462433−3381−6822699
B C R 1.051.594.49
% Δ π 1.514.379.8
Table 5. Results of the 500 simulations.
EVFCFAustinSeattleBoston
Charging MethodCCMC Δ CCMC Δ CCMC Δ
P ¯ f M [ T ] (kW)633 ± 7569 ± 664 ± 9447 ± 5405 ± 4.543 ± 6.5606 ± 7545 ± 6.560 ± 9.5
r (USD)30,060 ± 7628,698 ± 731363 ± 105.516,176 ± 846.516,295 ± 46.5776 ± 6715,731 ± 4815,033 ± 36698 ± 68.5
c (USD)22,256 ± 184.520,474 ± 1651782 ± 24715,192 ± 13714,023 ± 1261169 ± 186.519,365 ± 195.517,729 ± 178.51636 ± 264
π (USD)7804 ± 1908223 ± 171420 ± 255.51879 ± 135.52281 ± 117393 ± 185−3633 ± 195−2705 ± 177.5930 ± 264
B C R 1.31 ± 0.051.51 ± 0.0652.31 ± 0.105
% Δ π 5.3 ± 3.14520.3 ± 8.3825.9 ± 8.645
Table 6. Explanatory coefficients used in Case 1 and Case 2.
Explanatory CoefficientCase 1Case 2
ρ 0 340
ρ 1 1−40
Table 7. Alternative fuel-grade options under the two cases.
OptionABC
Power supply level in kW ( ψ s )150250350
Case 1: Selection probability0.660.240.10
Case 2: Selection probability0.100.240.66
Table 8. Impact of user preferences at the Austin EVFCF.
Charging MethodCCMC Case 1MC Case 2
Value Δ Value Δ
P ¯ f M (kW)629 ± 6547 ± 5.583 ± 8.5579 ± 5.551 ± 8.5
r (USD)29,940 ± 7727,820 ± 712120 ± 10529,335 ± 75605 ± 107.5
c (USD)22,107 ± 173.519,834 ± 150.52274 ± 23020,714 ± 161.51394 ± 237
π (USD)7833 ± 171.57987 ± 153155 ± 229.58622 ± 161789 ± 235
BCR1.07 ± 0.042.31 ± 0.08
Table 9. Impact of user preferences at the Seattle EVFCF.
Charging MethodCCMC Case 1MC Case 2
Value Δ Value Δ
P ¯ f M (kW)452 ± 5400 ± 552 ± 6.5414 ± 538 ± 7
r (USD)17,047 ± 48.515,838 ± 45.51210 ± 66.516,706 ± 47.5342 ± 68.5
c (USD)15,316 ± 139.513,896 ± 1271420 ± 18814,277 ± 1301039 ± 190.5
π (USD)1731 ± 1421942 ± 130211 ± 192.52429 ± 134.5698 ± 195.5
BCR1.18 ± 0.0453.04 ± 0.115
Table 10. Impact of user preferences at the Boston EVFCF.
Charging MethodCCMC Case 1MC Case 2
Value Δ Value Δ
P ¯ f M (kW)590 ± 6.5516 ± 5.575 ± 8.5547 ± 643 ± 9
r (USD)15,618 ± 4814,515 ± 44.51103 ± 6515,294 ± 47324 ± 67
c (USD)18,901 ± 177.516,866 ± 1532035 ± 234.517,719 ± 1621183 ± 240.5
π (USD)−3284 ± 179.5−2351 ± 155933 ± 237.5−2425 ± 163.5859 ± 243
BCR1.85 ± 0.0753.67 ± 0.155
Disclaimer/Publisher’s Note: The statements, opinions and data contained in all publications are solely those of the individual author(s) and contributor(s) and not of MDPI and/or the editor(s). MDPI and/or the editor(s) disclaim responsibility for any injury to people or property resulting from any ideas, methods, instructions or products referred to in the content.