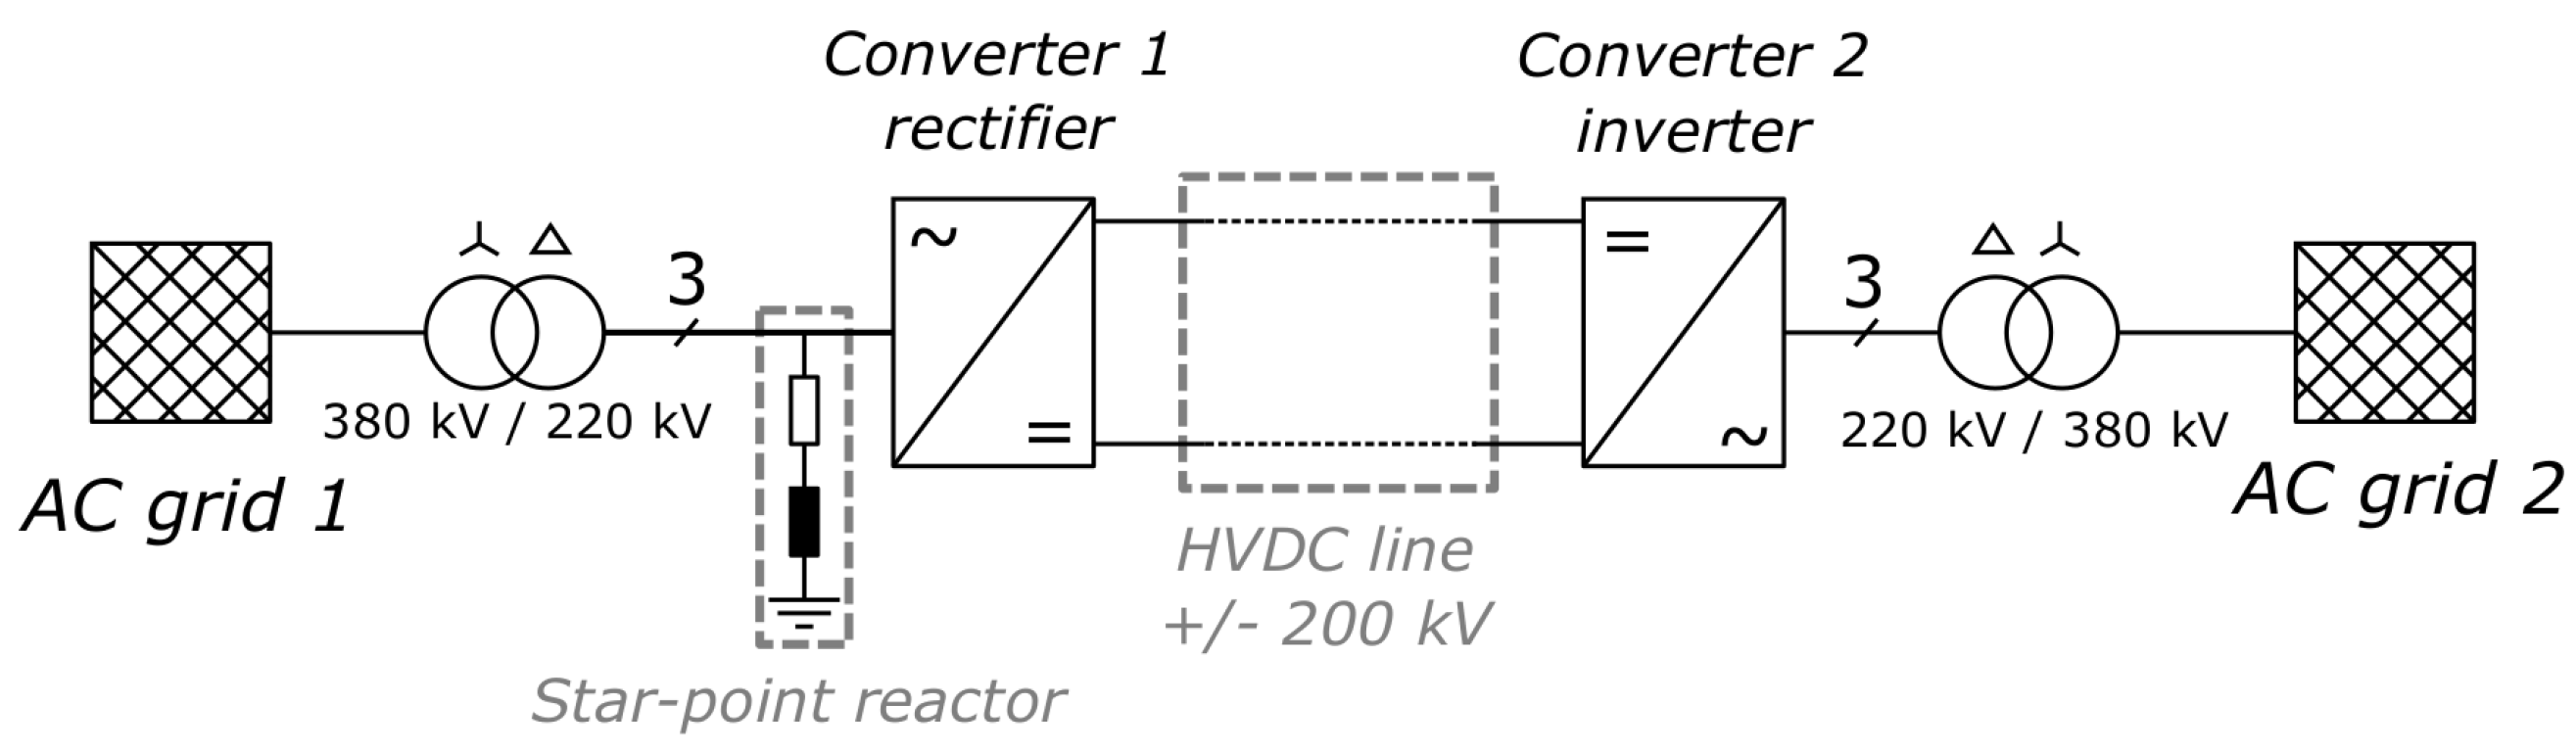
Figure 1.
Overview of the symmetric monopole high-voltage direct-current (HVDC) link; Converter 1 operates as a rectifier and Converter 2 operates as an inverter.
Figure 1.
Overview of the symmetric monopole high-voltage direct-current (HVDC) link; Converter 1 operates as a rectifier and Converter 2 operates as an inverter.
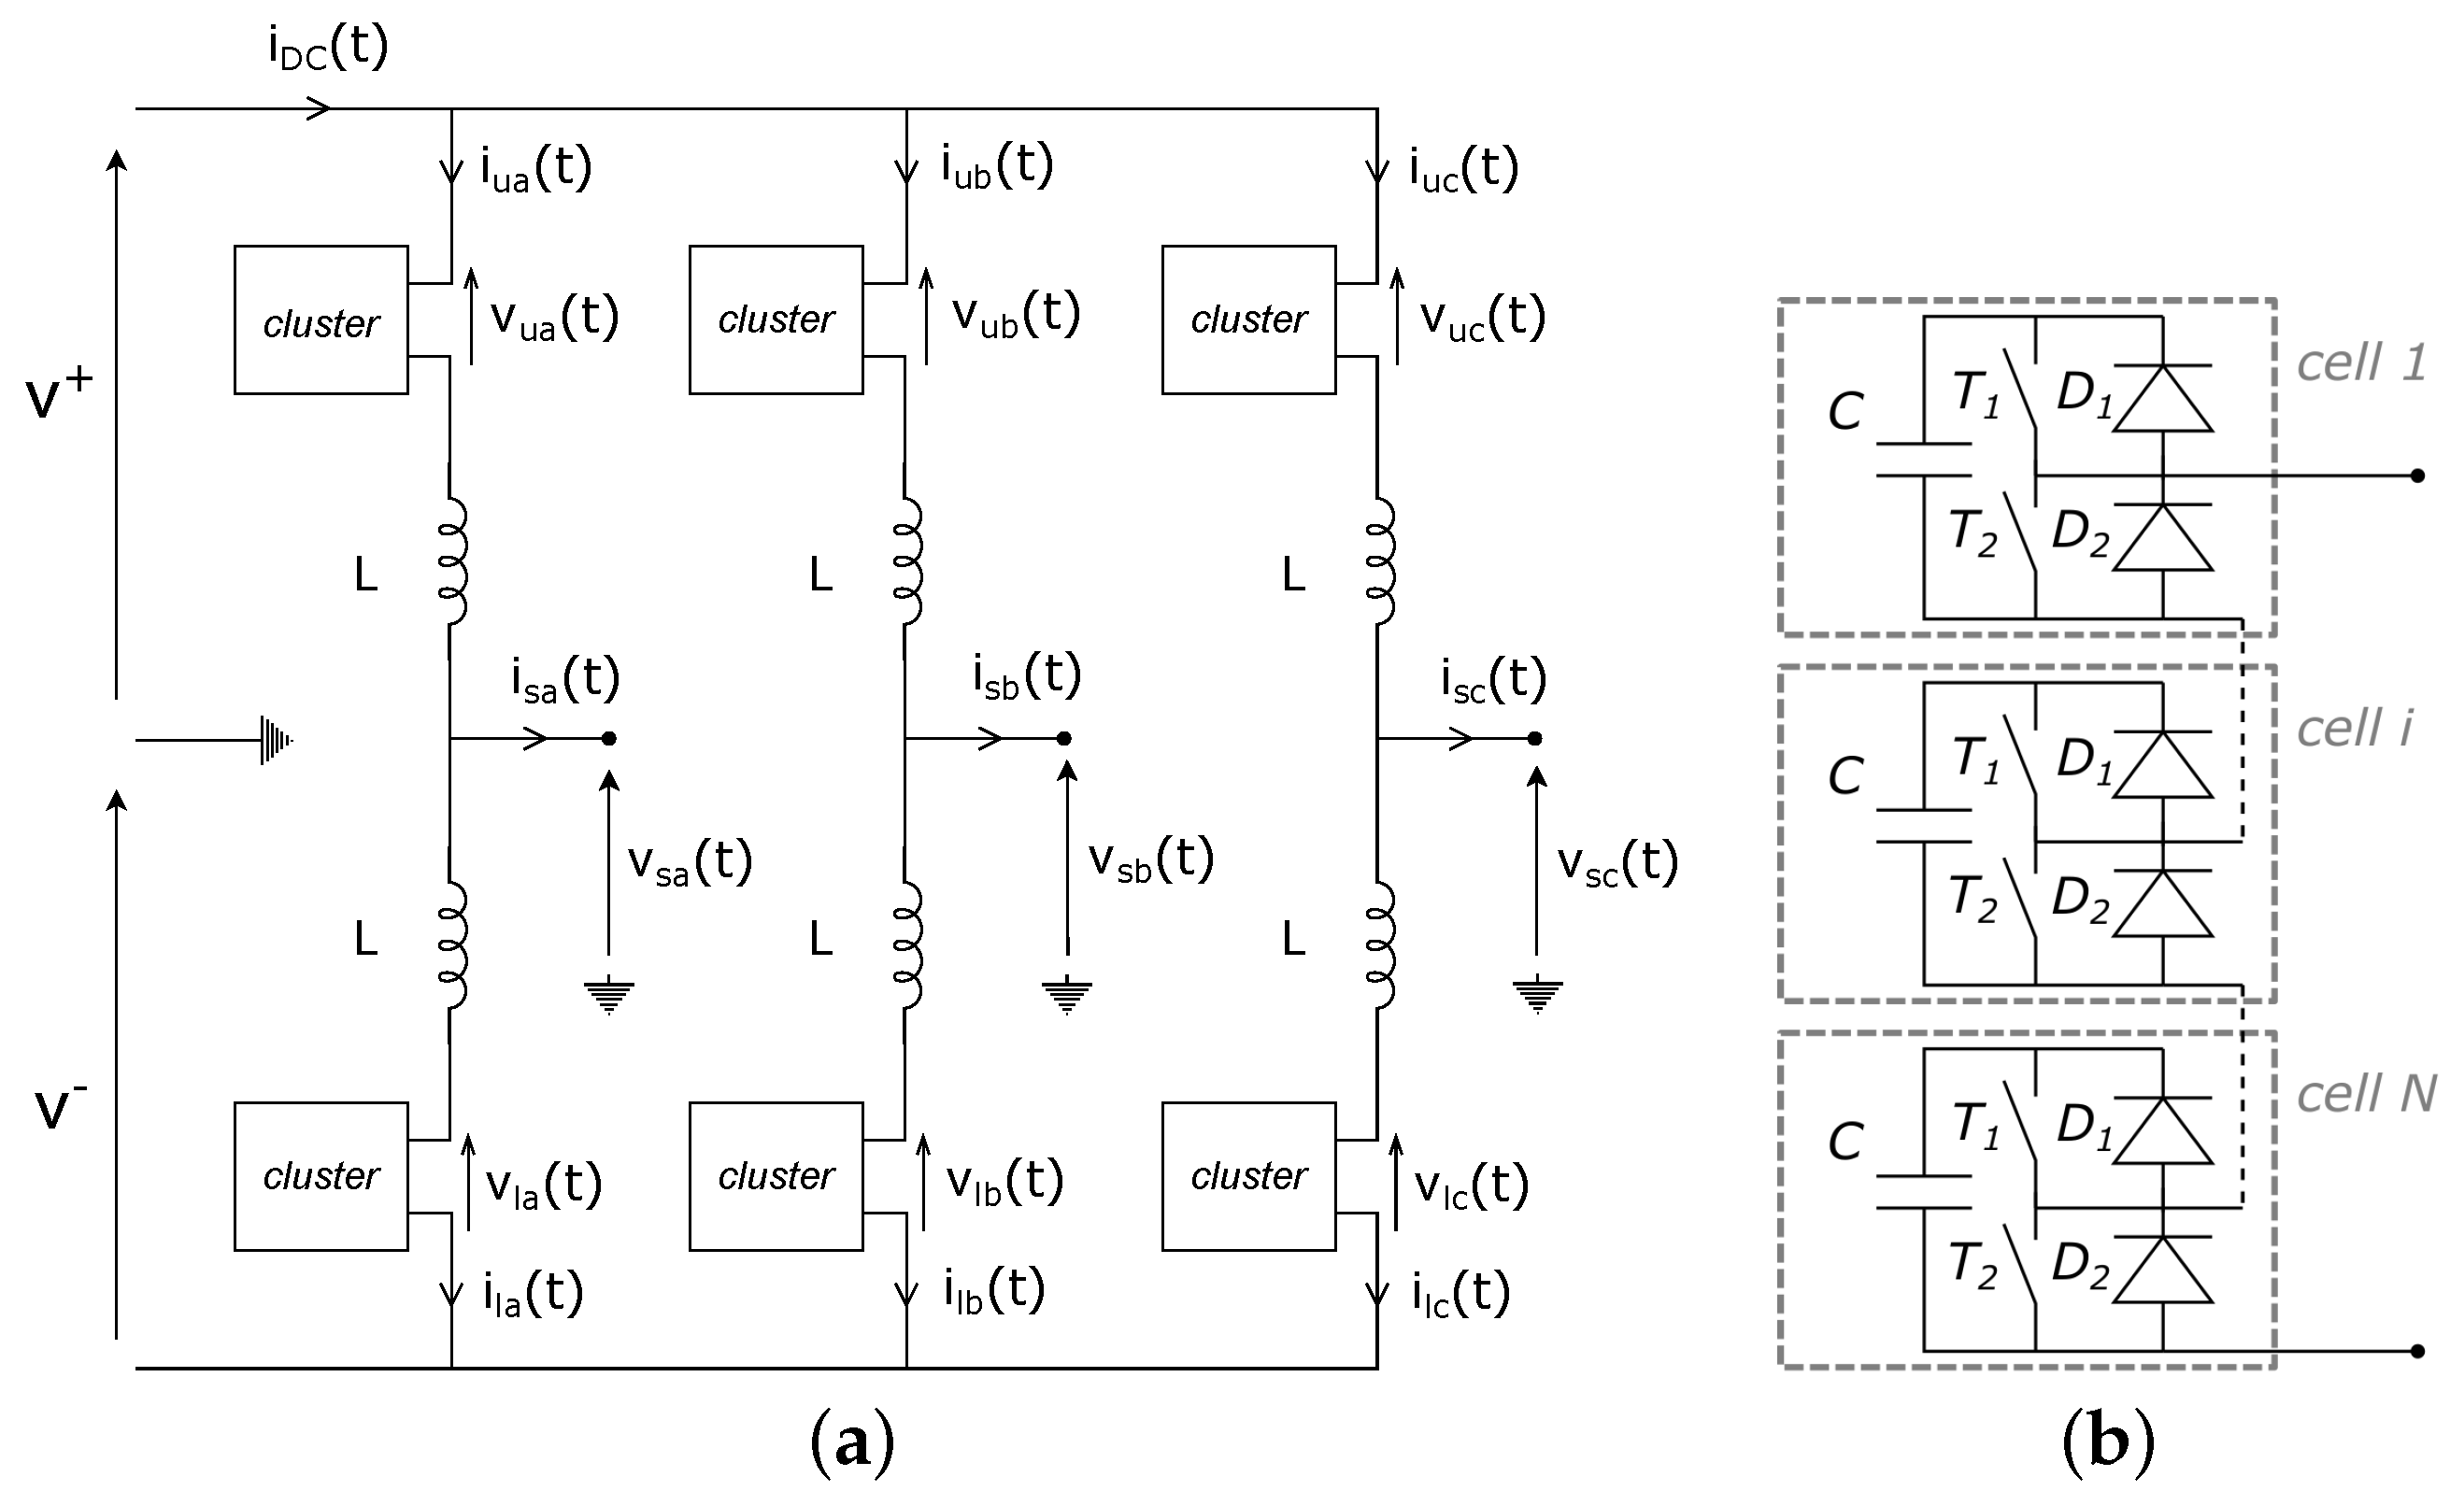
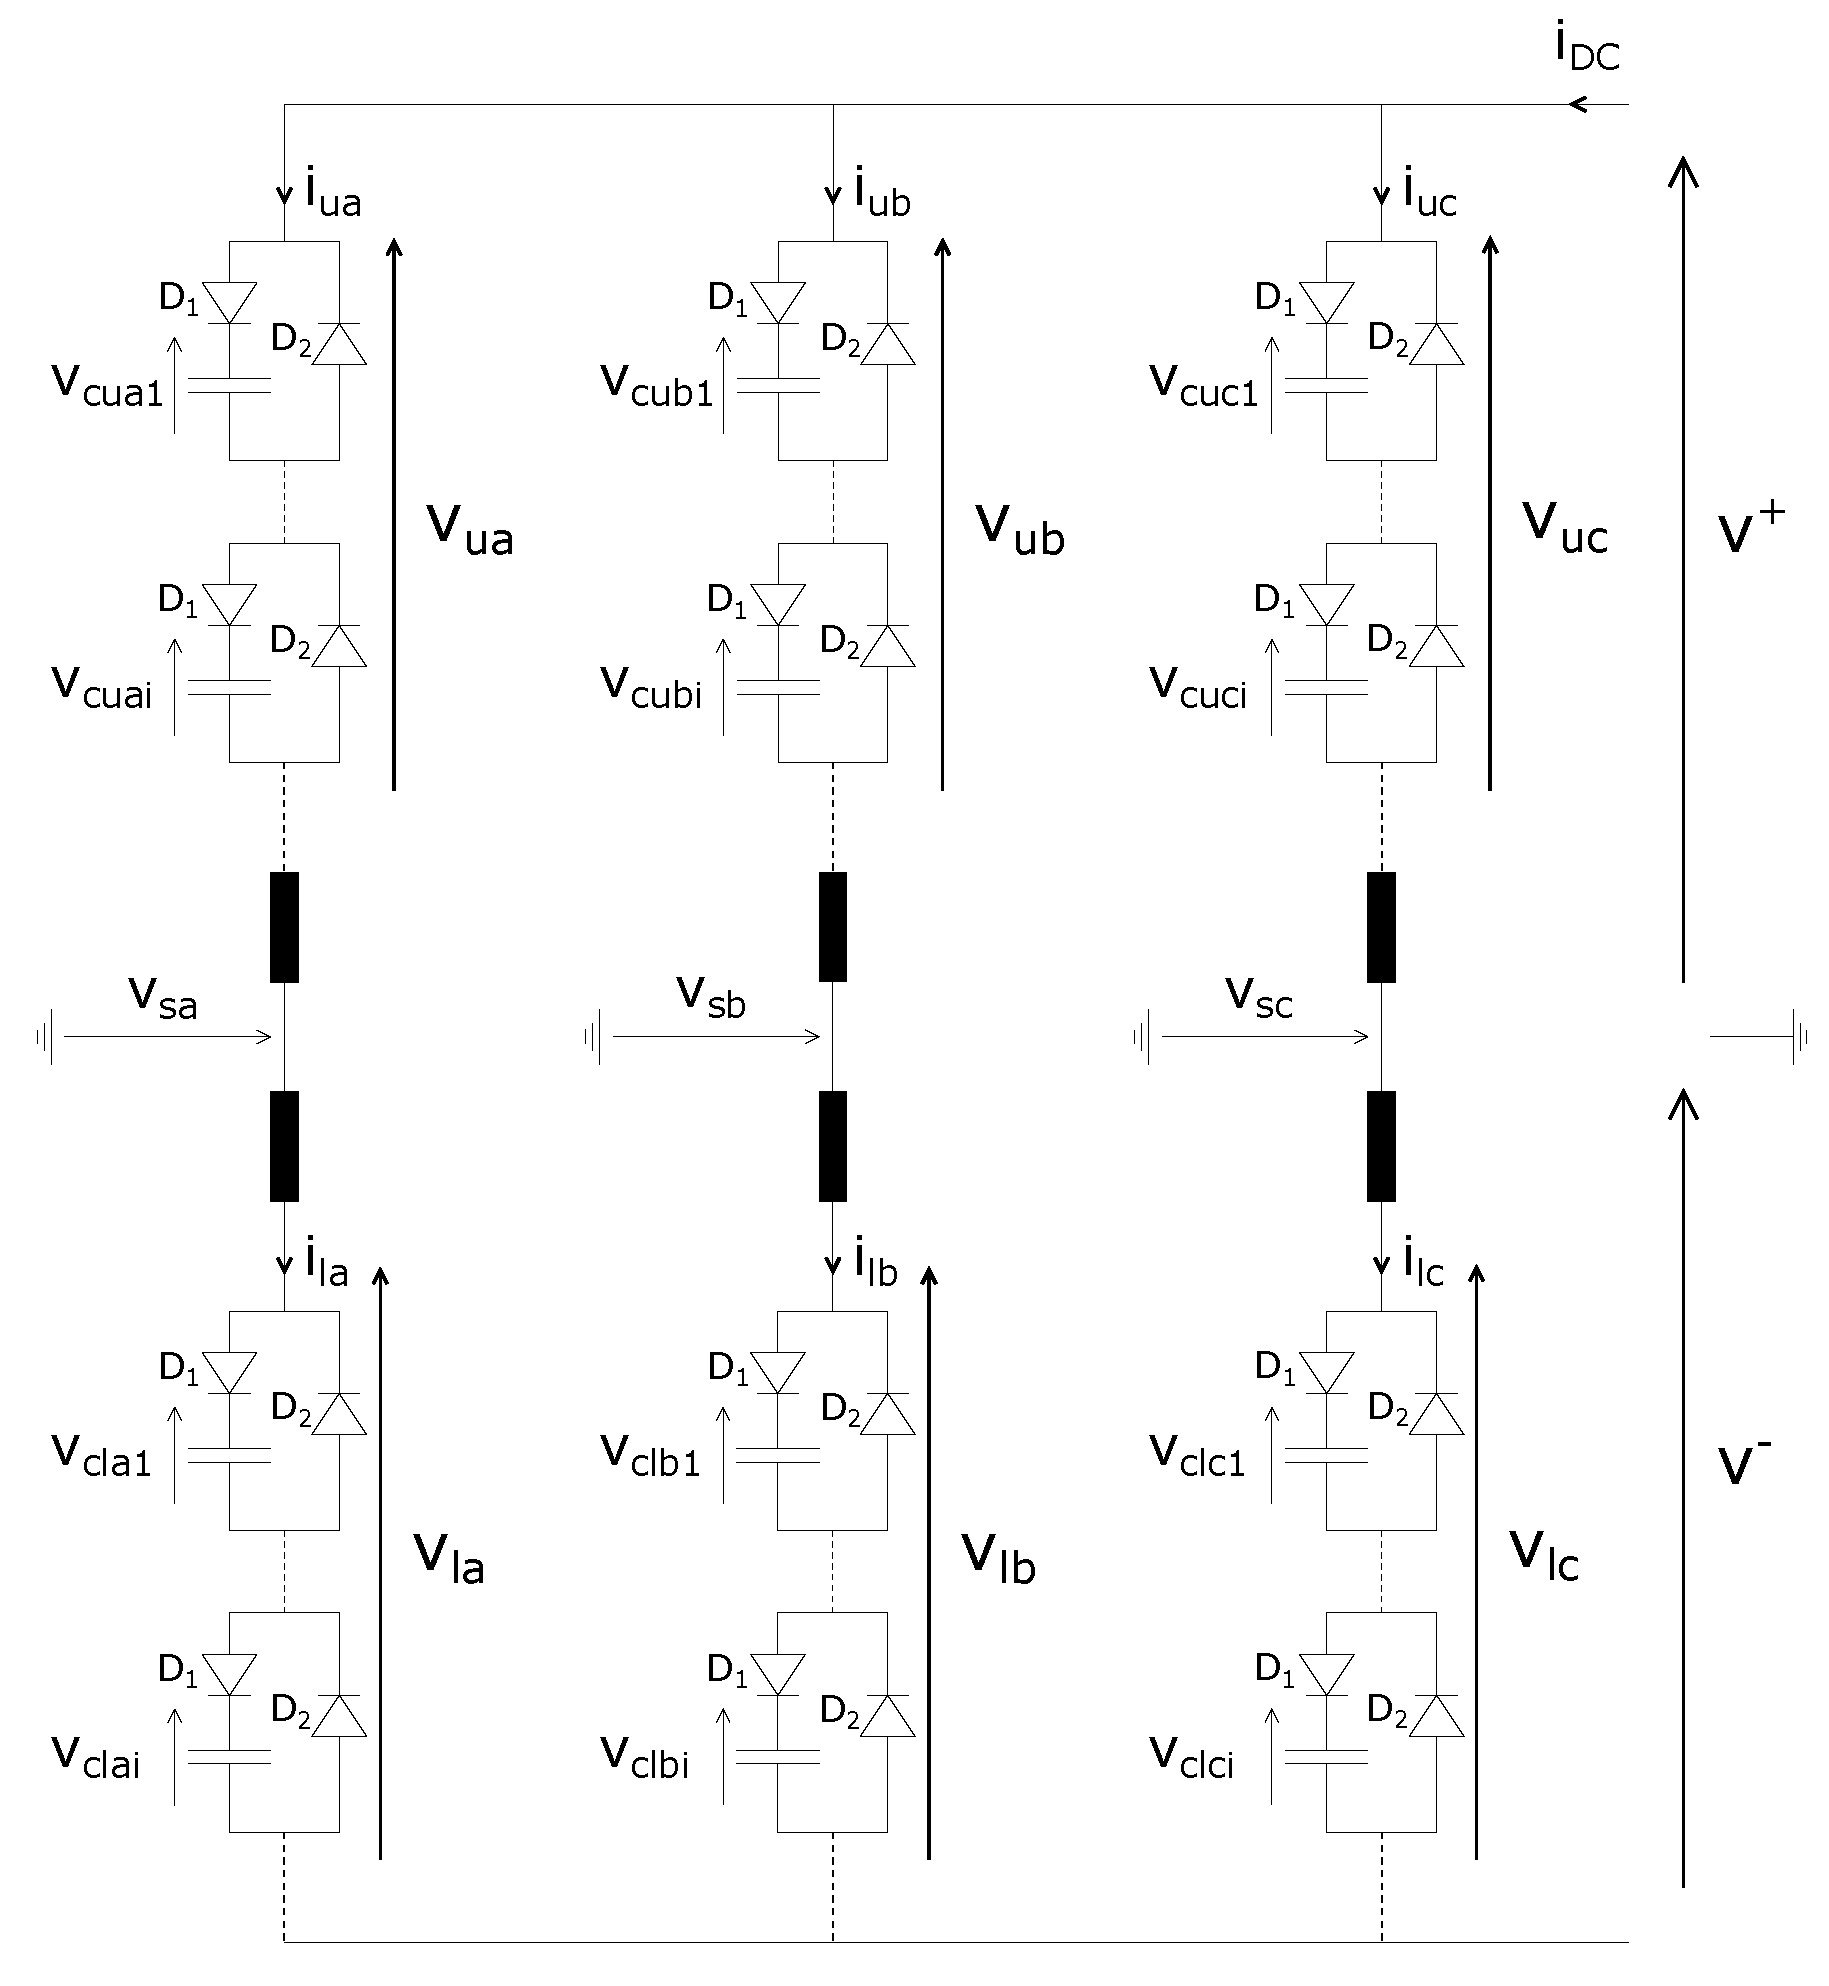
Figure 2.
Overview of the modular multilevel converter. (a) Modular multilevel converter. (b) Cluster with half-bridge cells.
Figure 2.
Overview of the modular multilevel converter. (a) Modular multilevel converter. (b) Cluster with half-bridge cells.
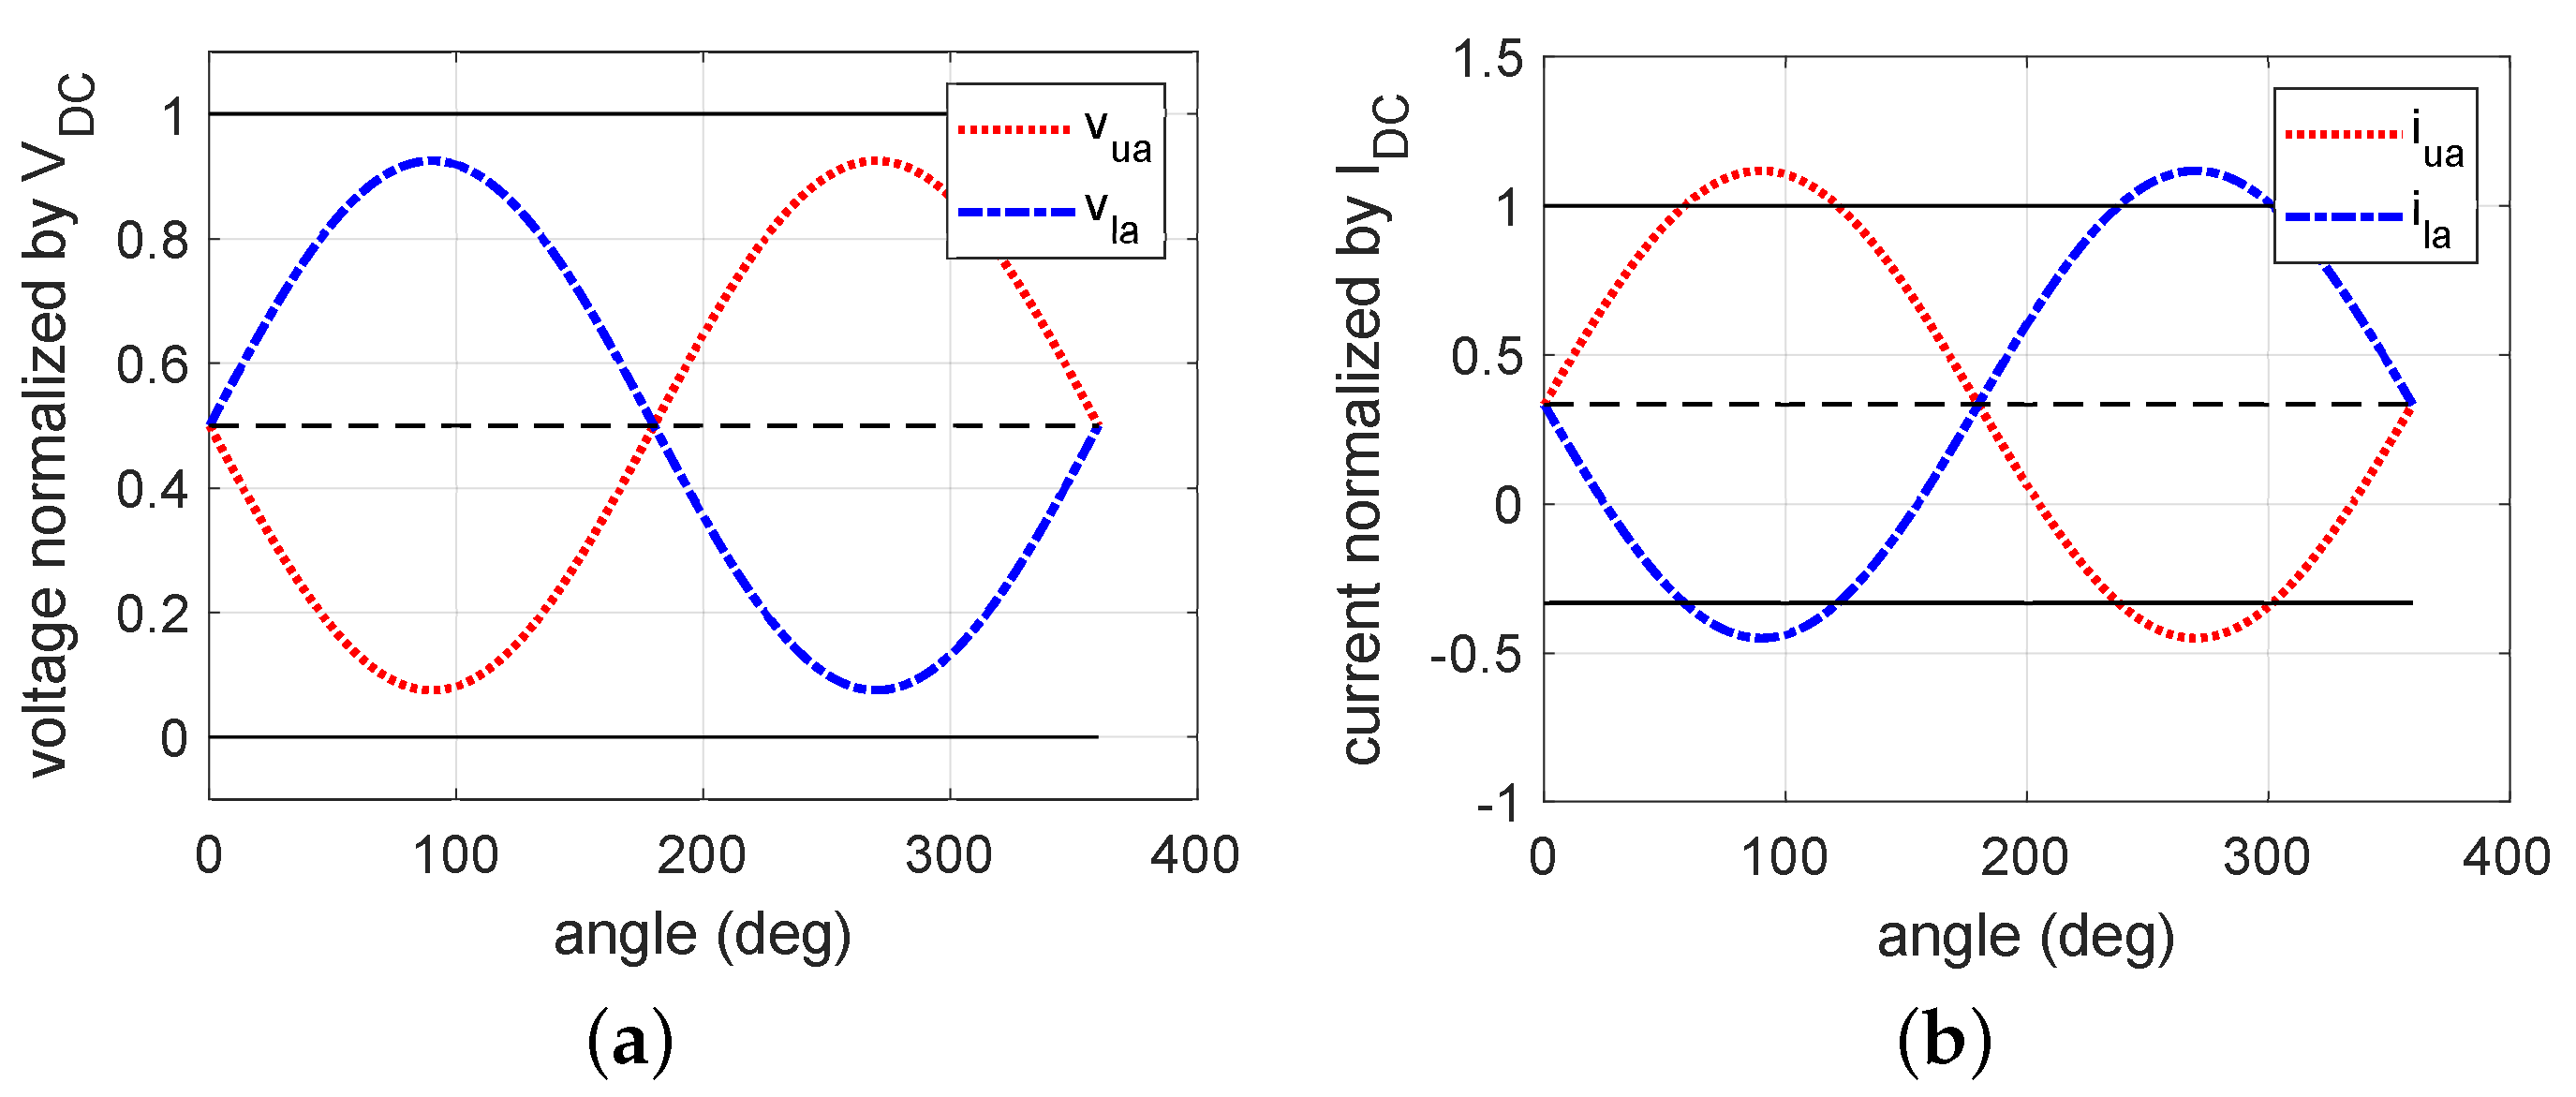
Figure 3.
Arm-voltages and arm-currents of MMC with half-bridge cells. (a) Voltages. (b) Currents.
Figure 3.
Arm-voltages and arm-currents of MMC with half-bridge cells. (a) Voltages. (b) Currents.
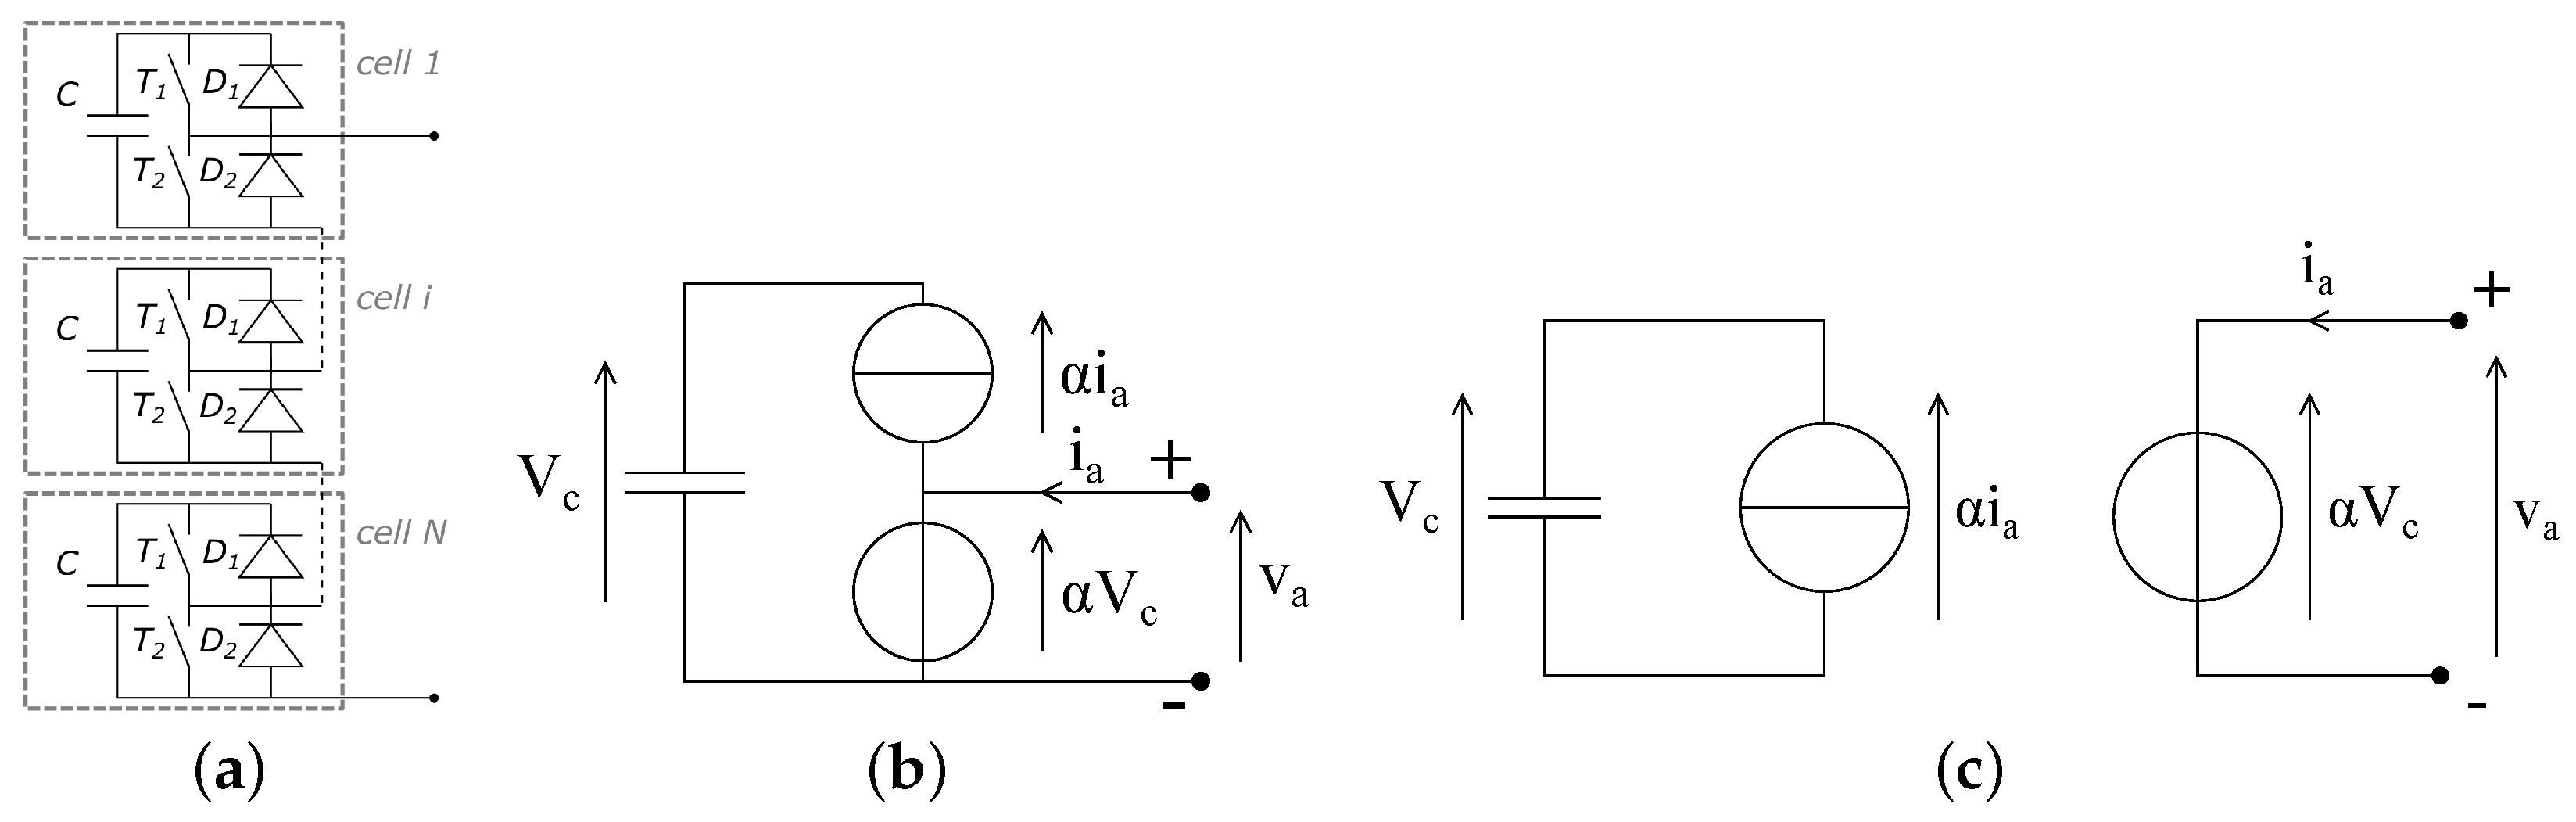
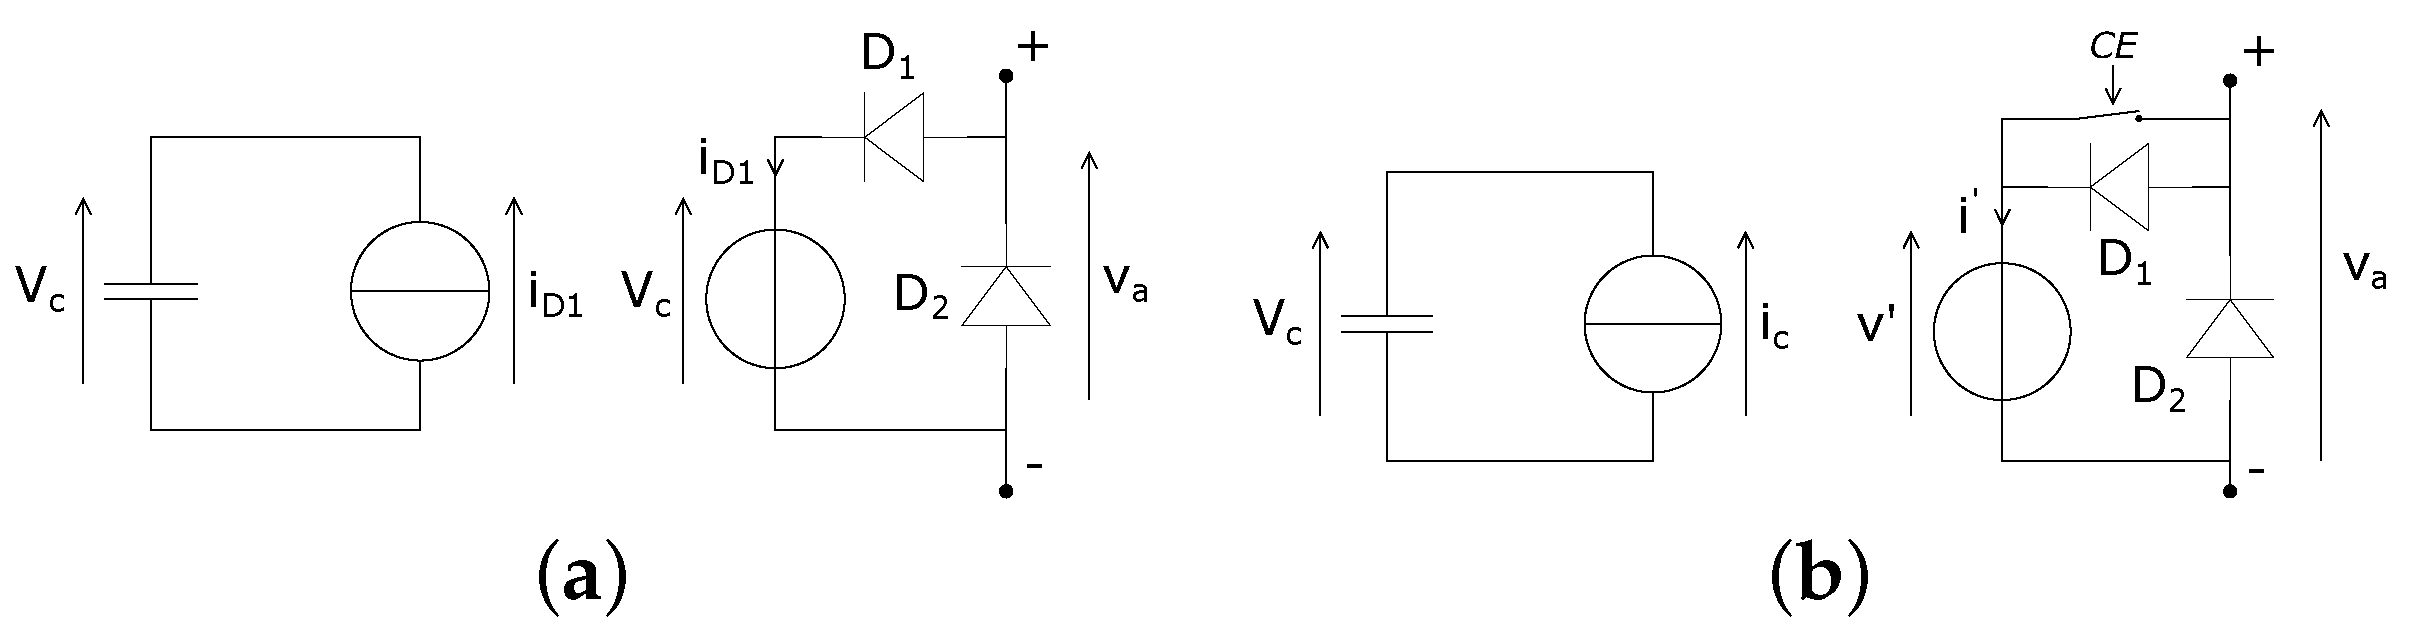
Figure 4.
Models for simulation of MMC in normal operation. (a) Real cluster. (b) Averaged model of the cluster. (c) Averaged model of the cluster divided into two parts.
Figure 4.
Models for simulation of MMC in normal operation. (a) Real cluster. (b) Averaged model of the cluster. (c) Averaged model of the cluster divided into two parts.
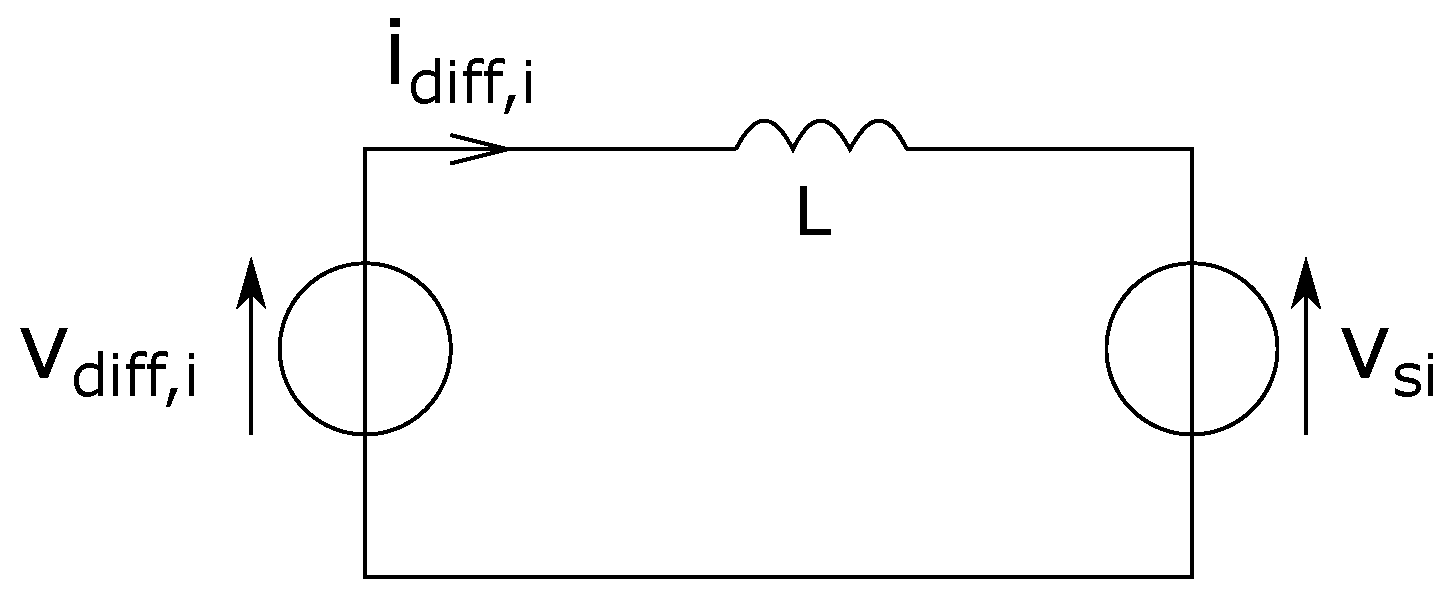
Figure 5.
Equivalent circuit for “diff” components, .
Figure 5.
Equivalent circuit for “diff” components, .
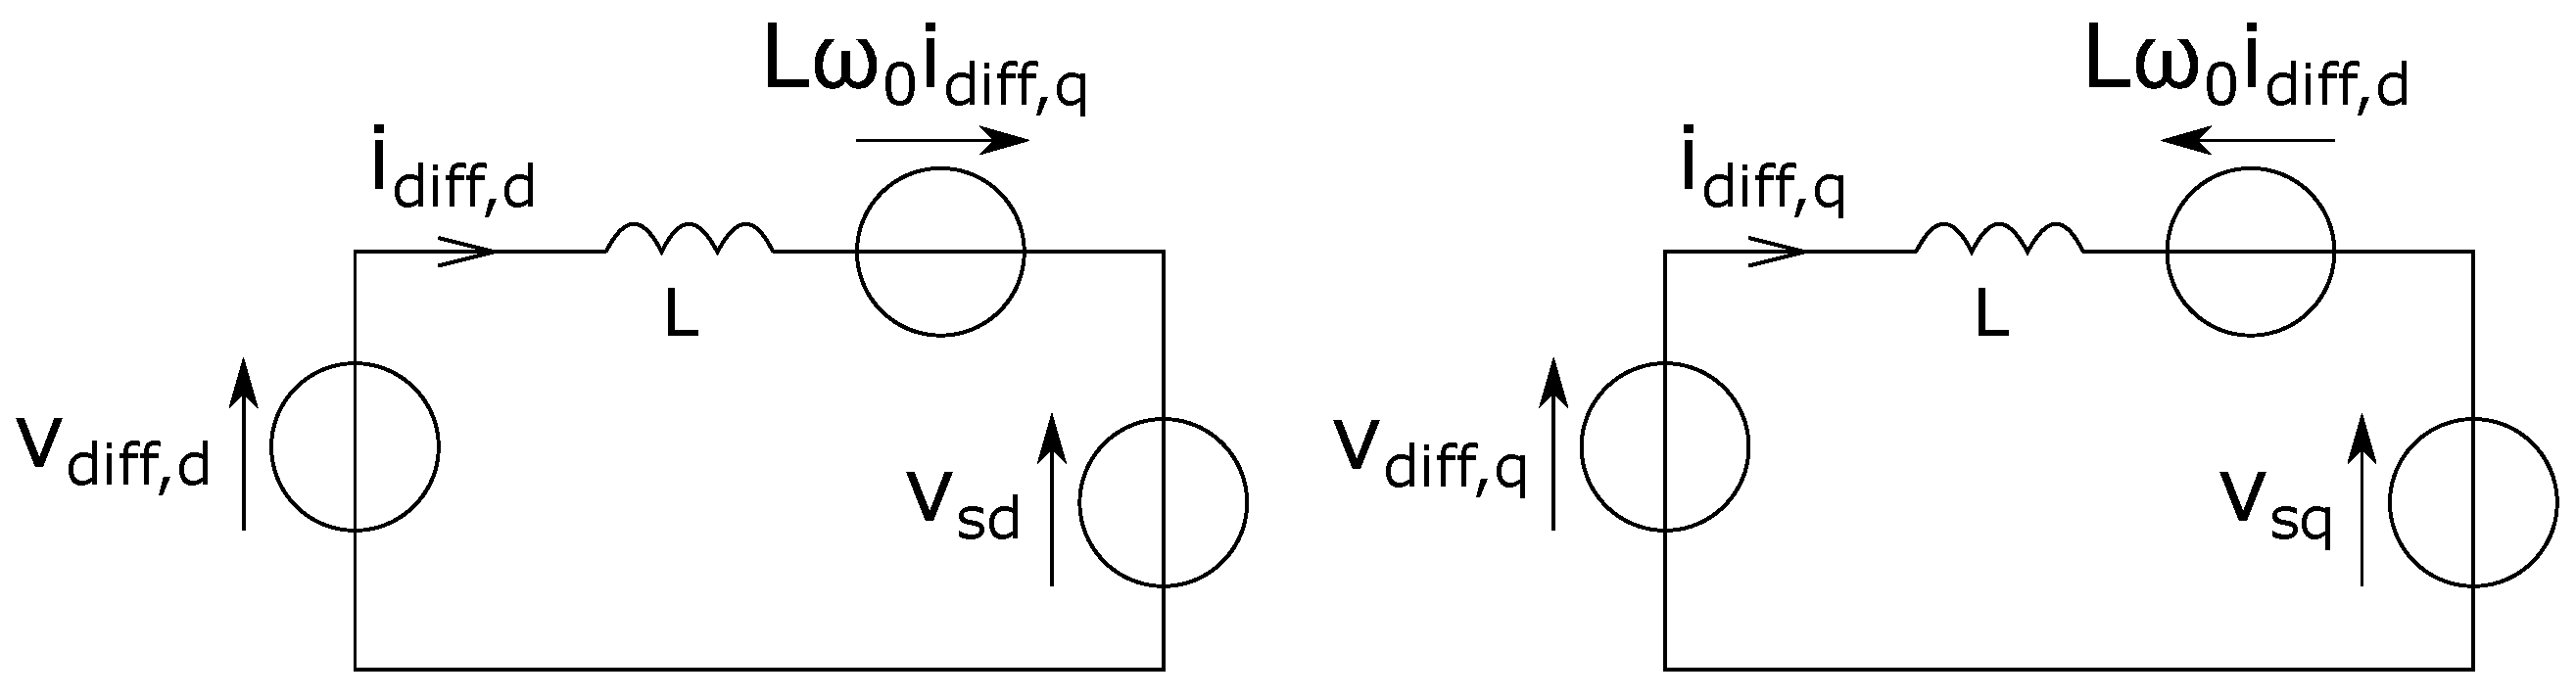
Figure 6.
Equivalent circuits of the converter in the dq plane, for output-current control.
Figure 6.
Equivalent circuits of the converter in the dq plane, for output-current control.
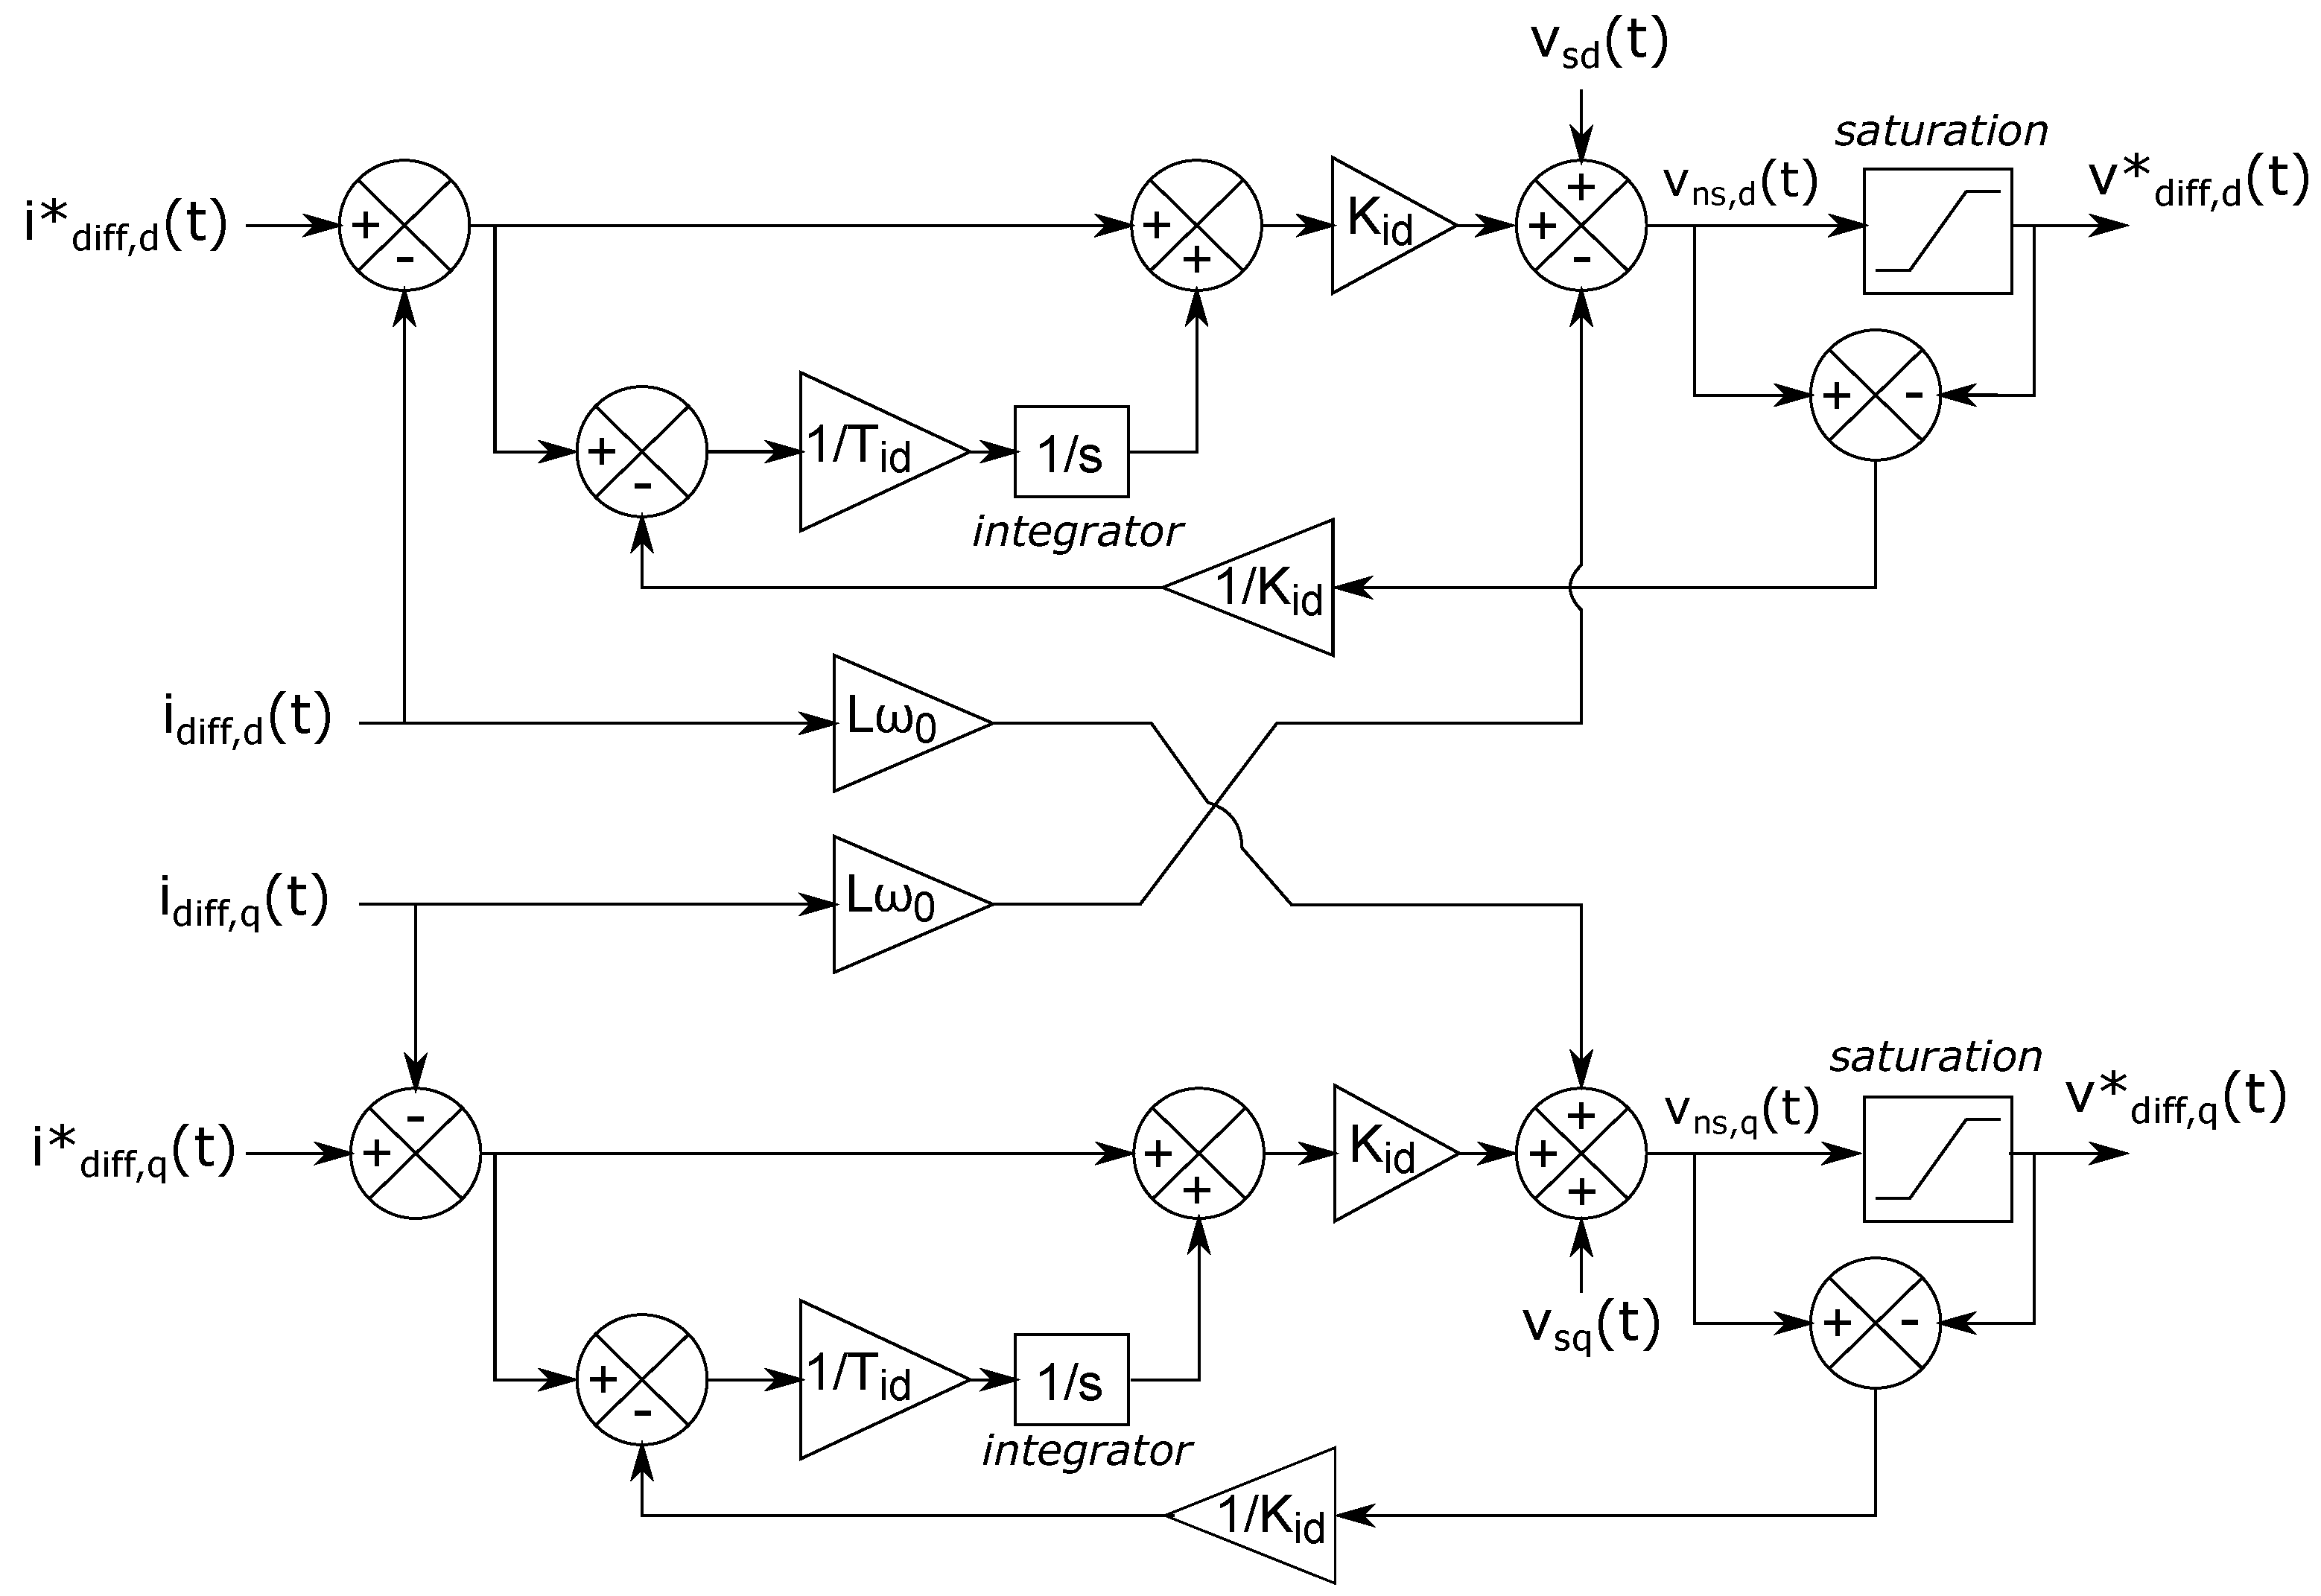
Figure 7.
Block diagram of the output-current controller.
Figure 7.
Block diagram of the output-current controller.
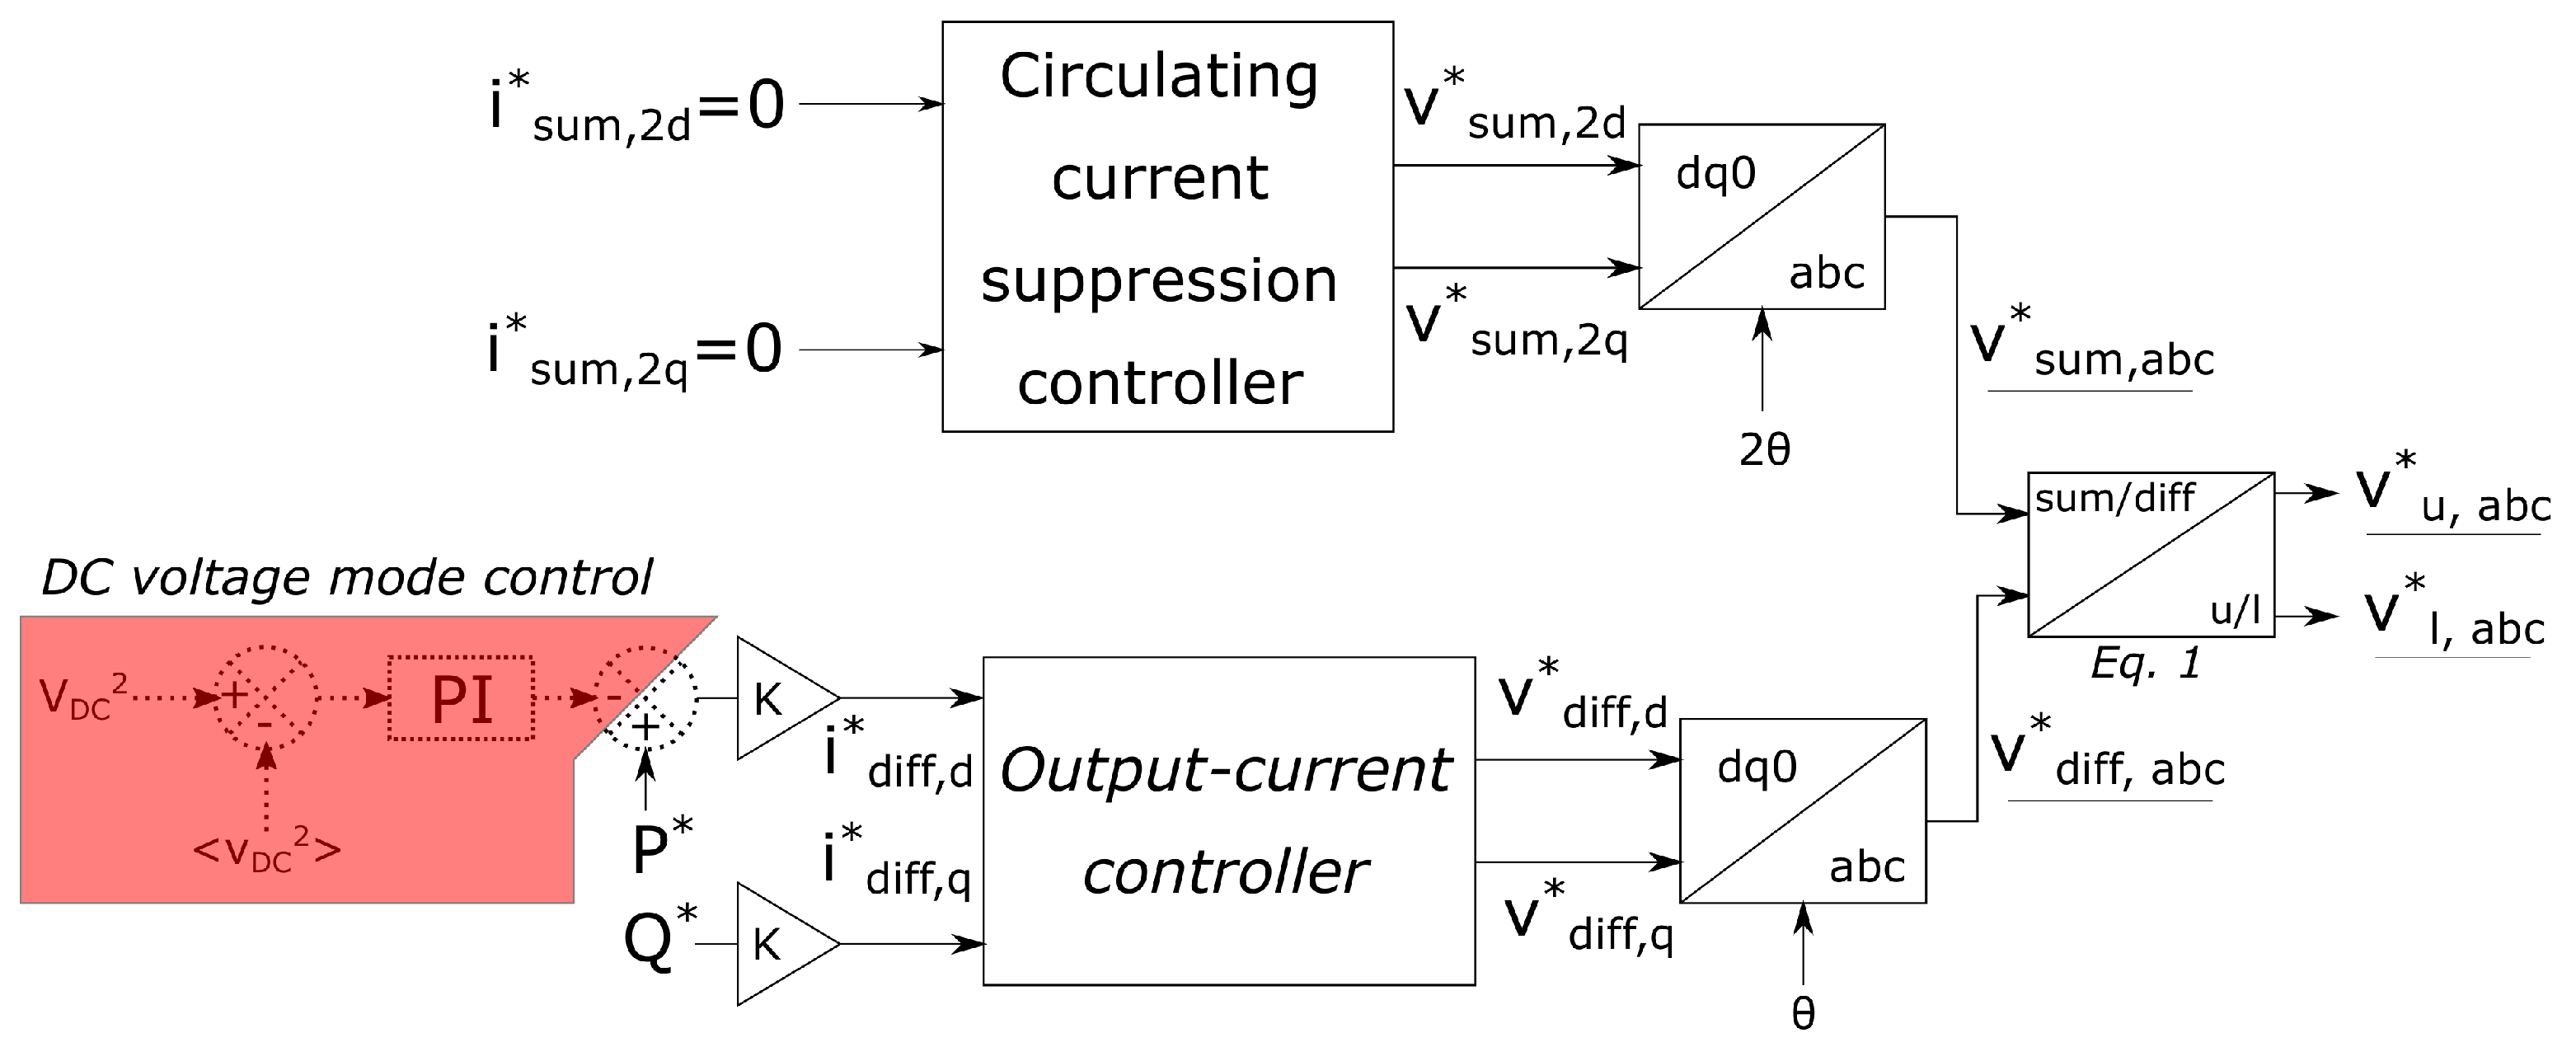
Figure 8.
Simplified block diagram of the overall control system.
Figure 8.
Simplified block diagram of the overall control system.
Figure 9.
MMC with half-bridge cells after blocking of the controlled devices.
Figure 9.
MMC with half-bridge cells after blocking of the controlled devices.
Figure 10.
Averaged models for MMC simulation under faulty operation. (a) Averaged model of the cluster during faulty operation; all controlled devices are blocked. (b) Averaged model for normal and faulty operation; the switch is closed during normal operation and opened during faulty operation.
Figure 10.
Averaged models for MMC simulation under faulty operation. (a) Averaged model of the cluster during faulty operation; all controlled devices are blocked. (b) Averaged model for normal and faulty operation; the switch is closed during normal operation and opened during faulty operation.
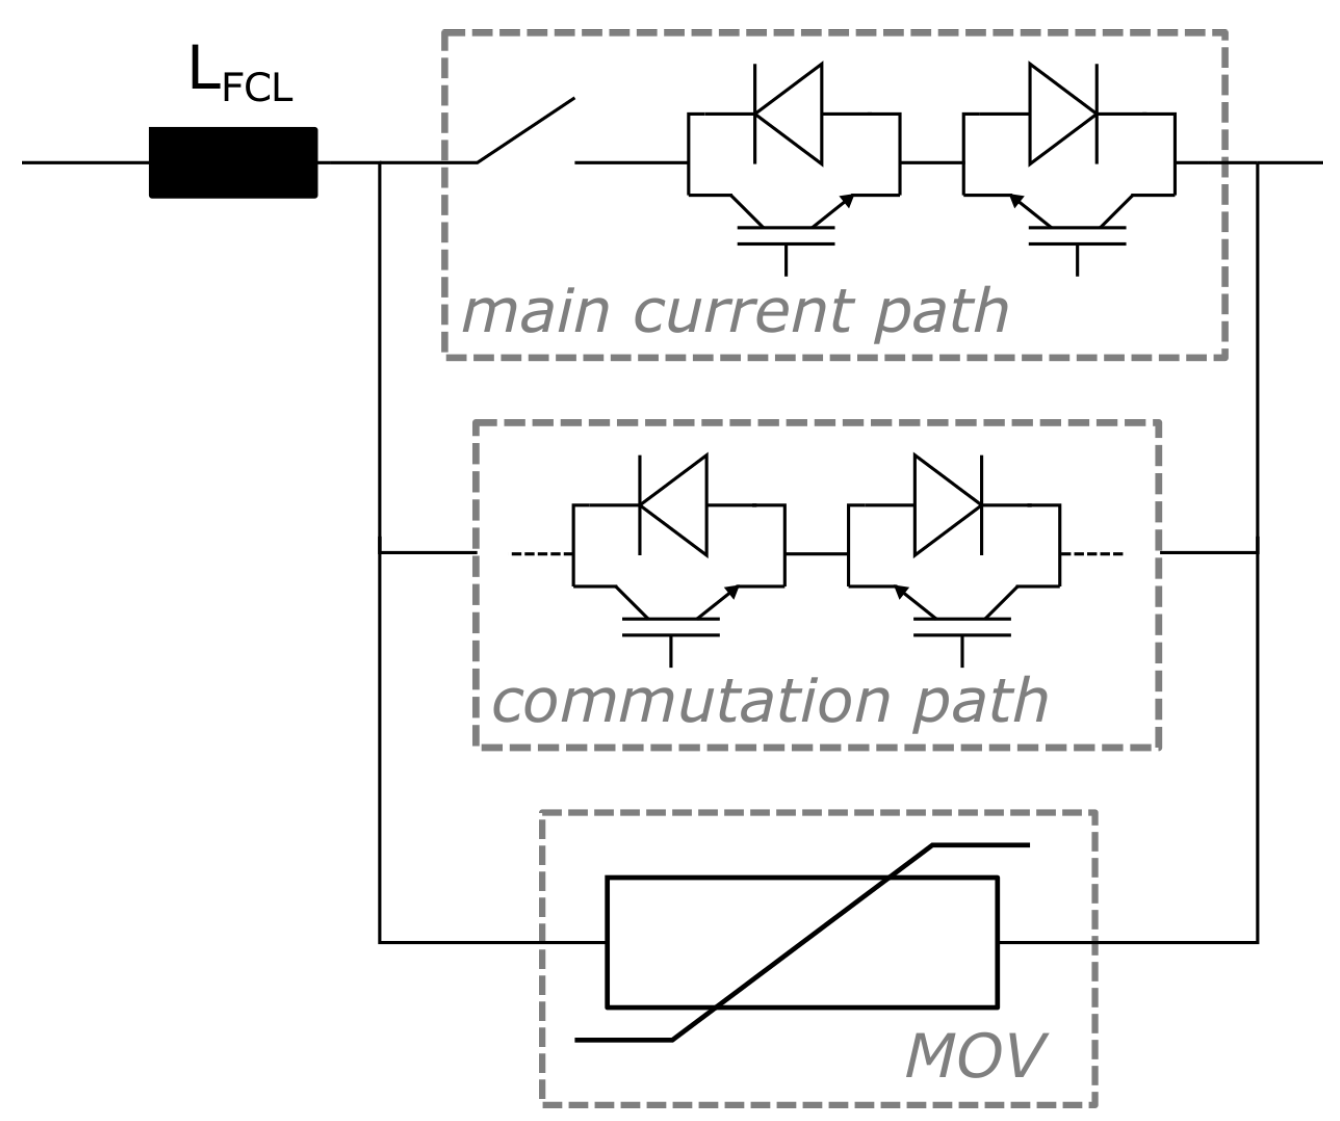
Figure 11.
Generic hybrid DC circuit-breaker selection.
Figure 11.
Generic hybrid DC circuit-breaker selection.
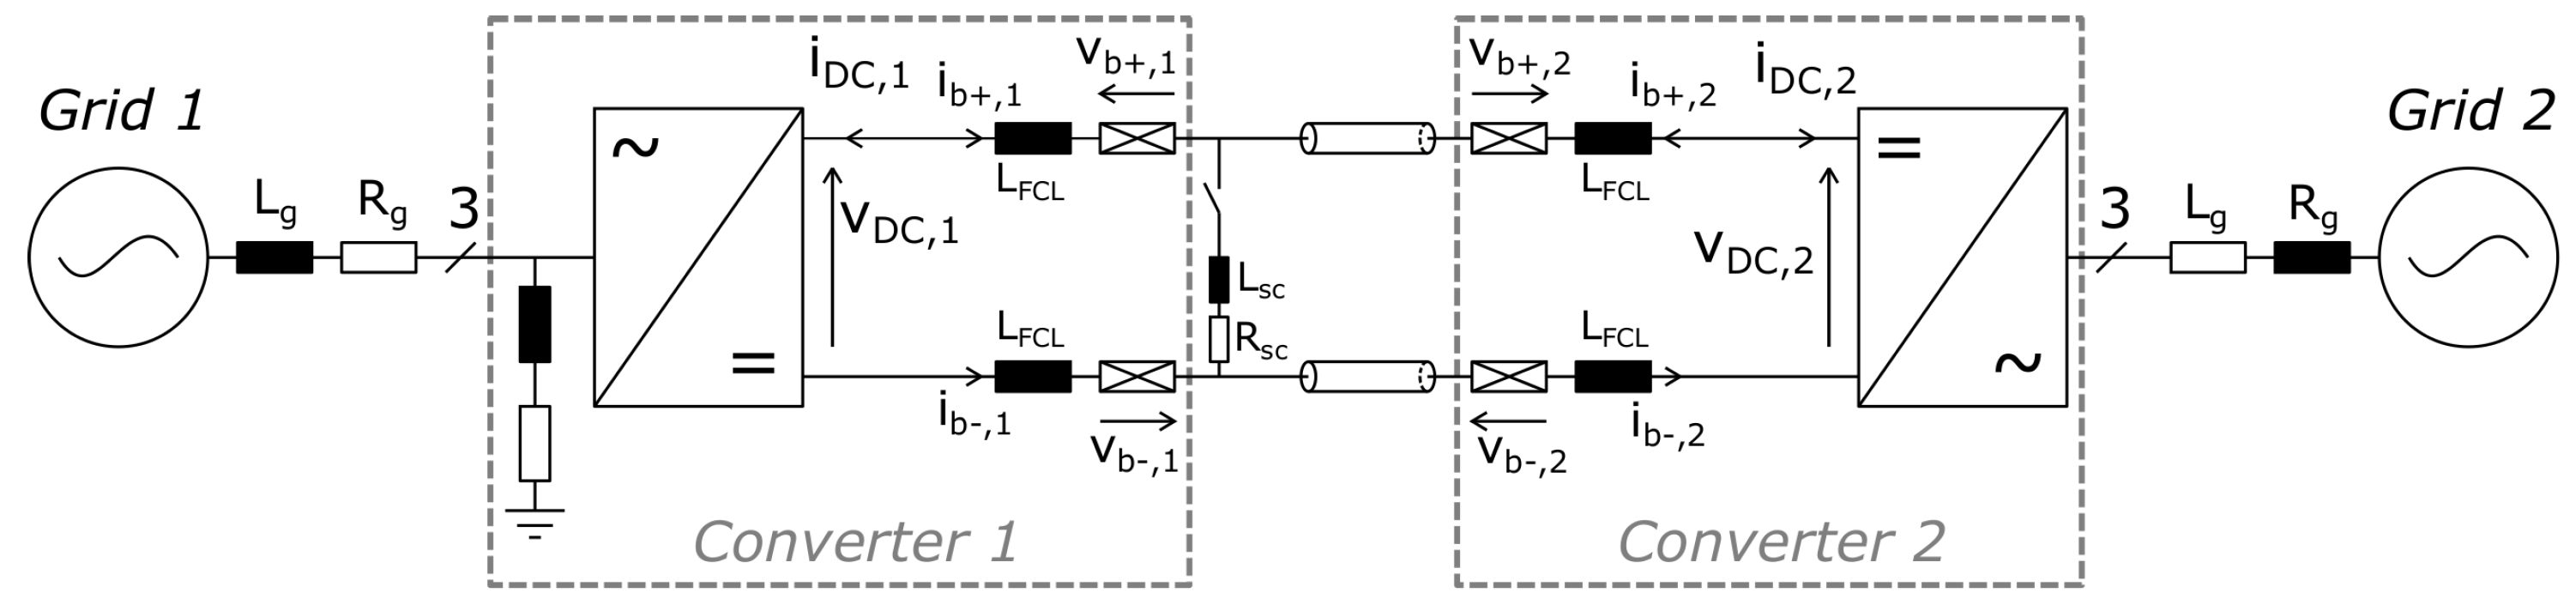
Figure 12.
Detailed model of the HVDC link with DC circuit-breakers and notations.
Figure 12.
Detailed model of the HVDC link with DC circuit-breakers and notations.
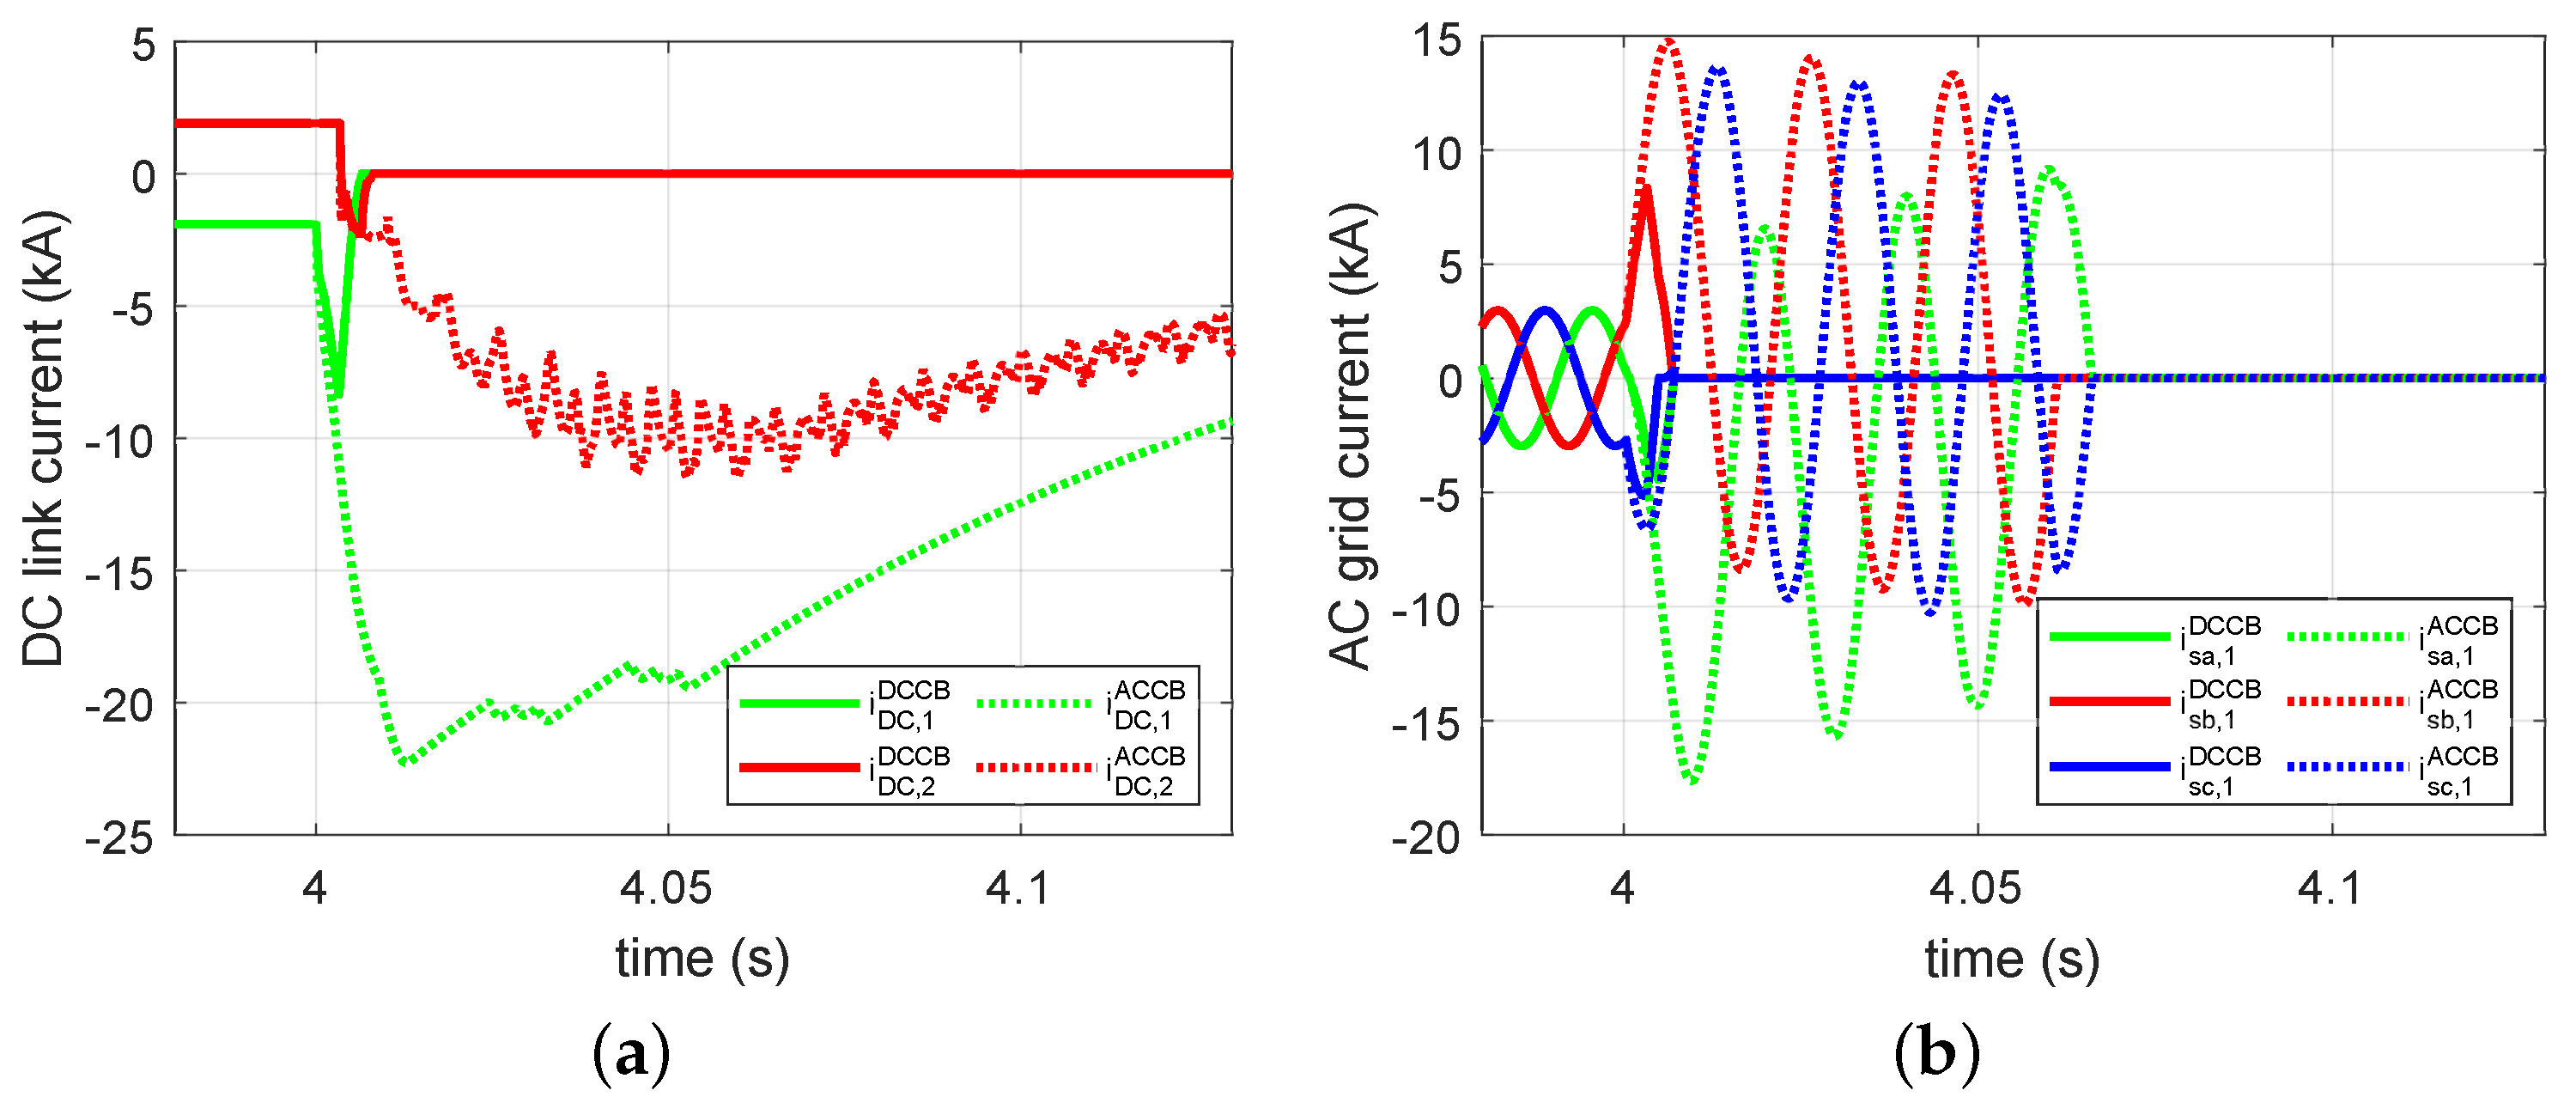
Figure 13.
DC link current and AC grid currents during DC pole-to-pole fault with AC circuit-breakers (dotted lines) and DC circuit-breakers (solid lines). (a) DC link current - zoom - green for Converter 1, red for Converter 2, solid line for DC CBs and dotted line for AC CBs. (b) AC grid currents , green for phase a, red for phase b and blue for phase c, solid line for DC CBs and dotted line for AC CBs.
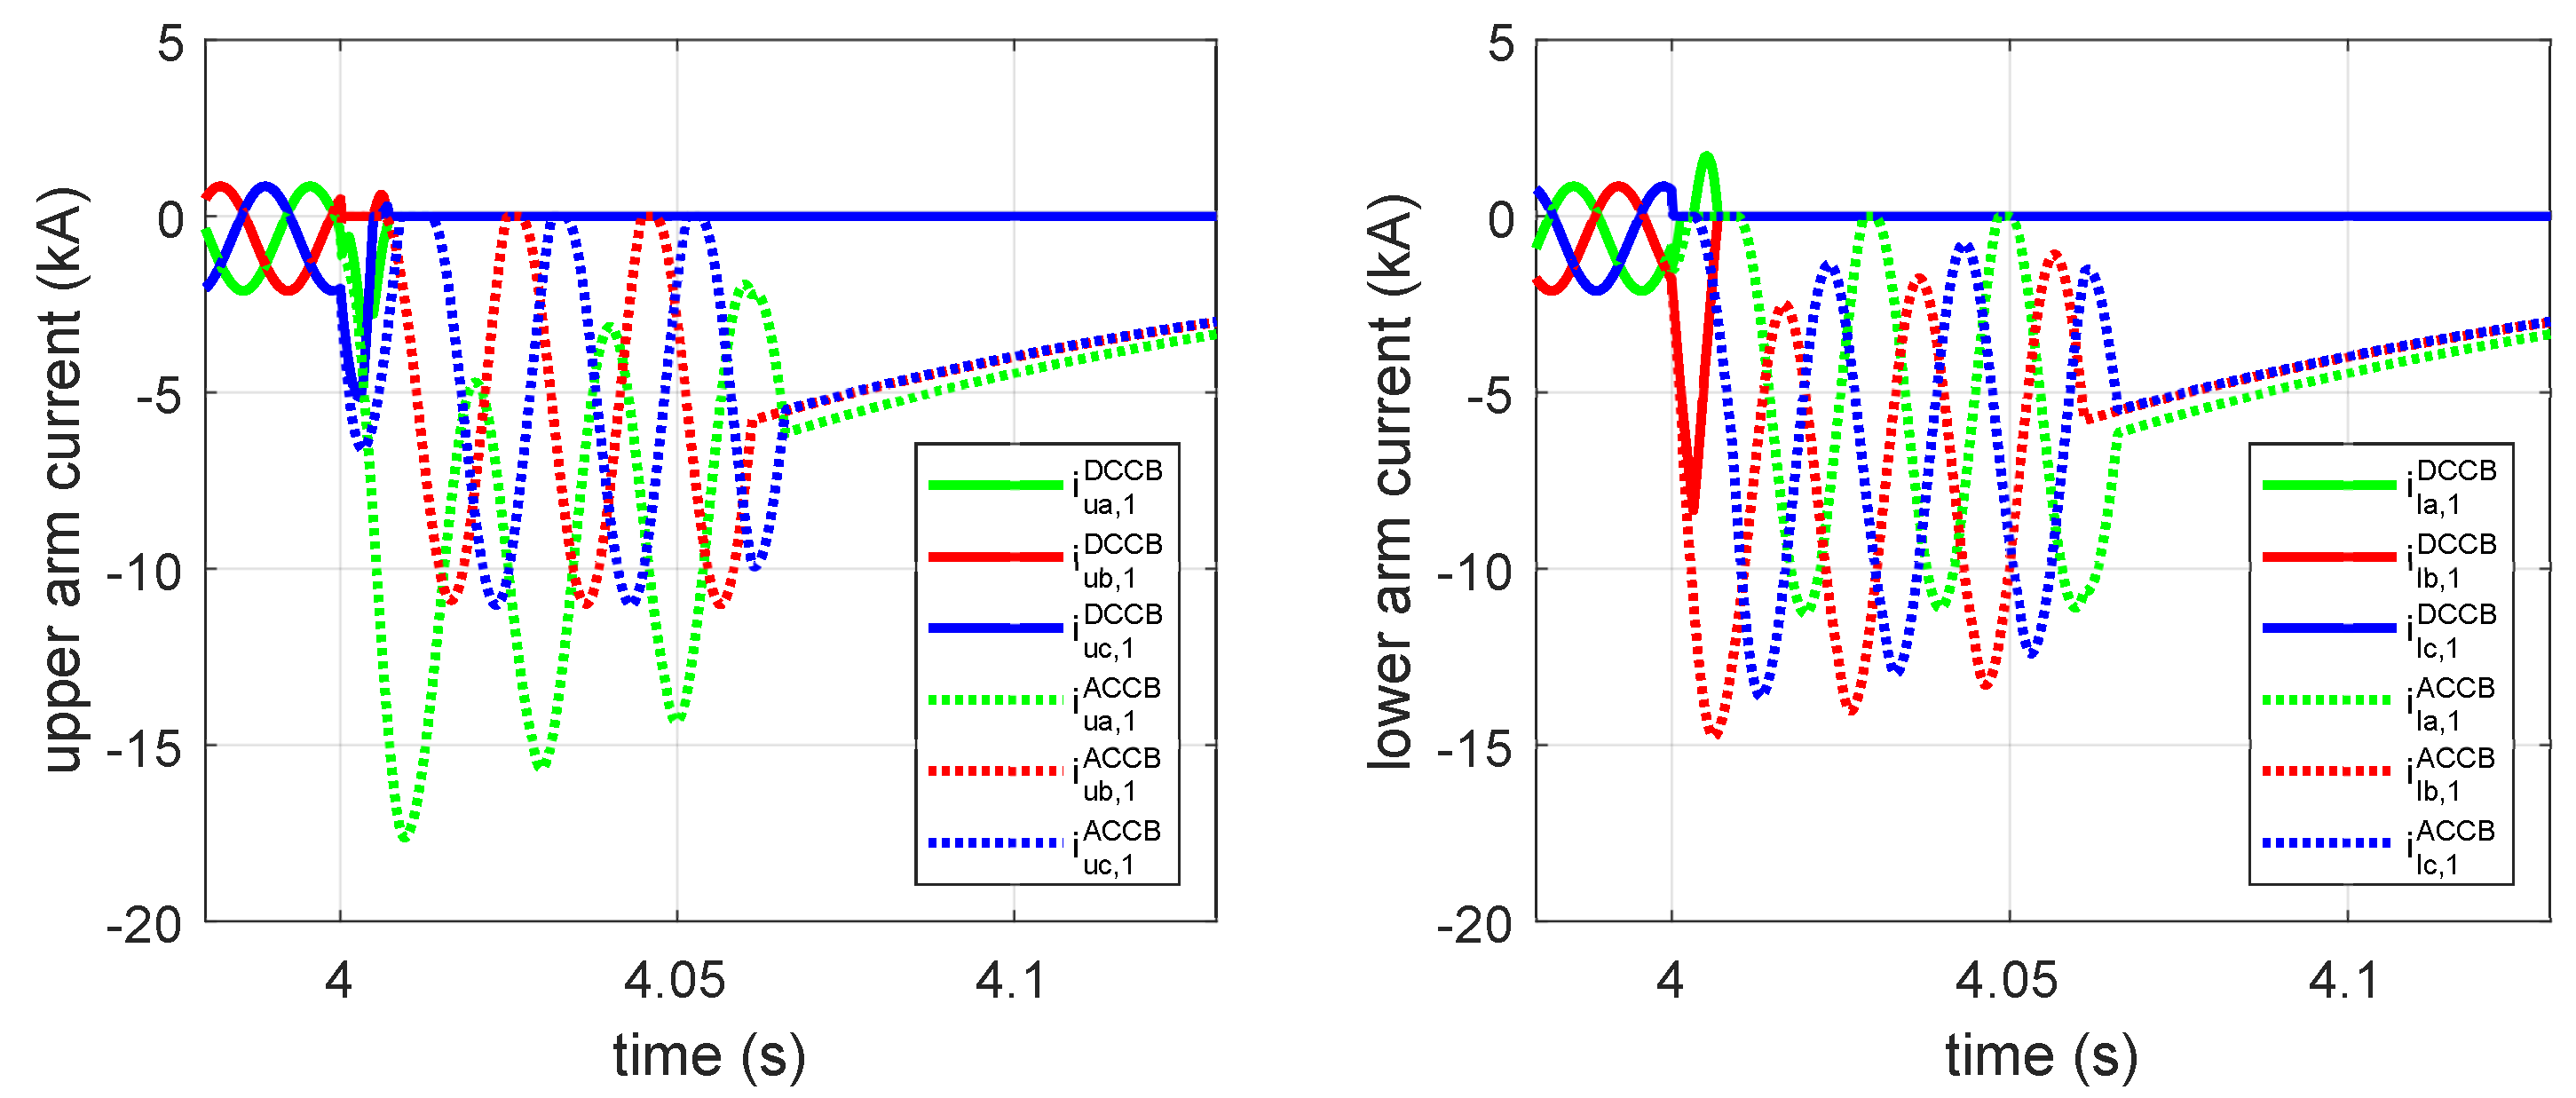
Figure 14.
Upper and lower arm-currents during DC pole-to-pole fault with AC circuit-breakers (dotted lines) and DC circuit-breakers (solid lines); green for phase a, red for phase b and blue for phase c.
Figure 14.
Upper and lower arm-currents during DC pole-to-pole fault with AC circuit-breakers (dotted lines) and DC circuit-breakers (solid lines); green for phase a, red for phase b and blue for phase c.
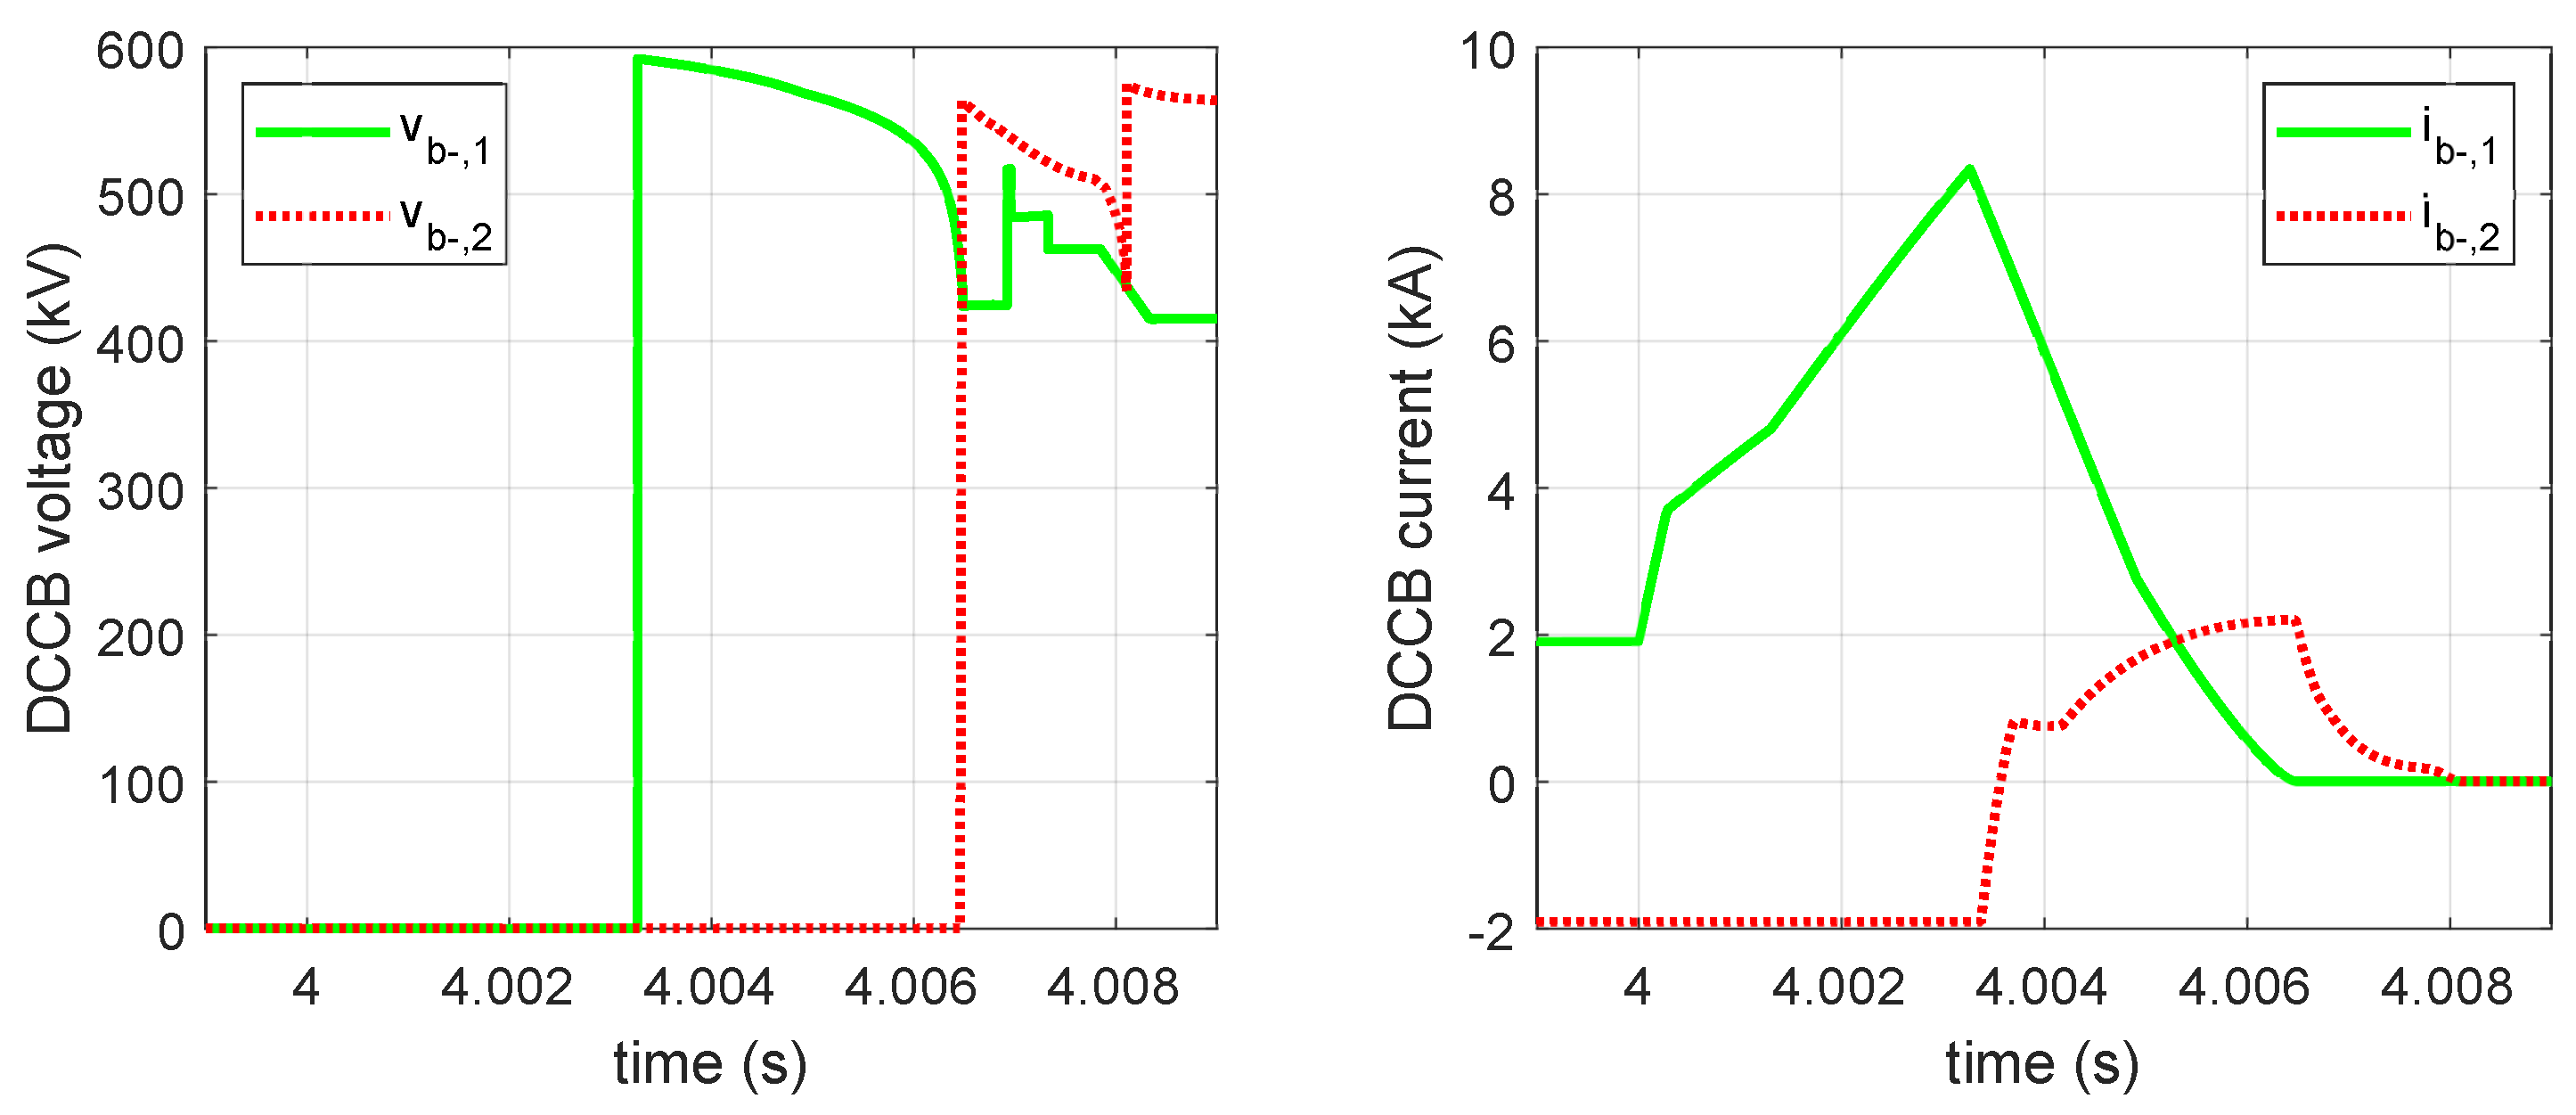
Figure 15.
Voltage and current of the lower DC circuit-breakers during DC pole-to-pole fault.
Figure 15.
Voltage and current of the lower DC circuit-breakers during DC pole-to-pole fault.
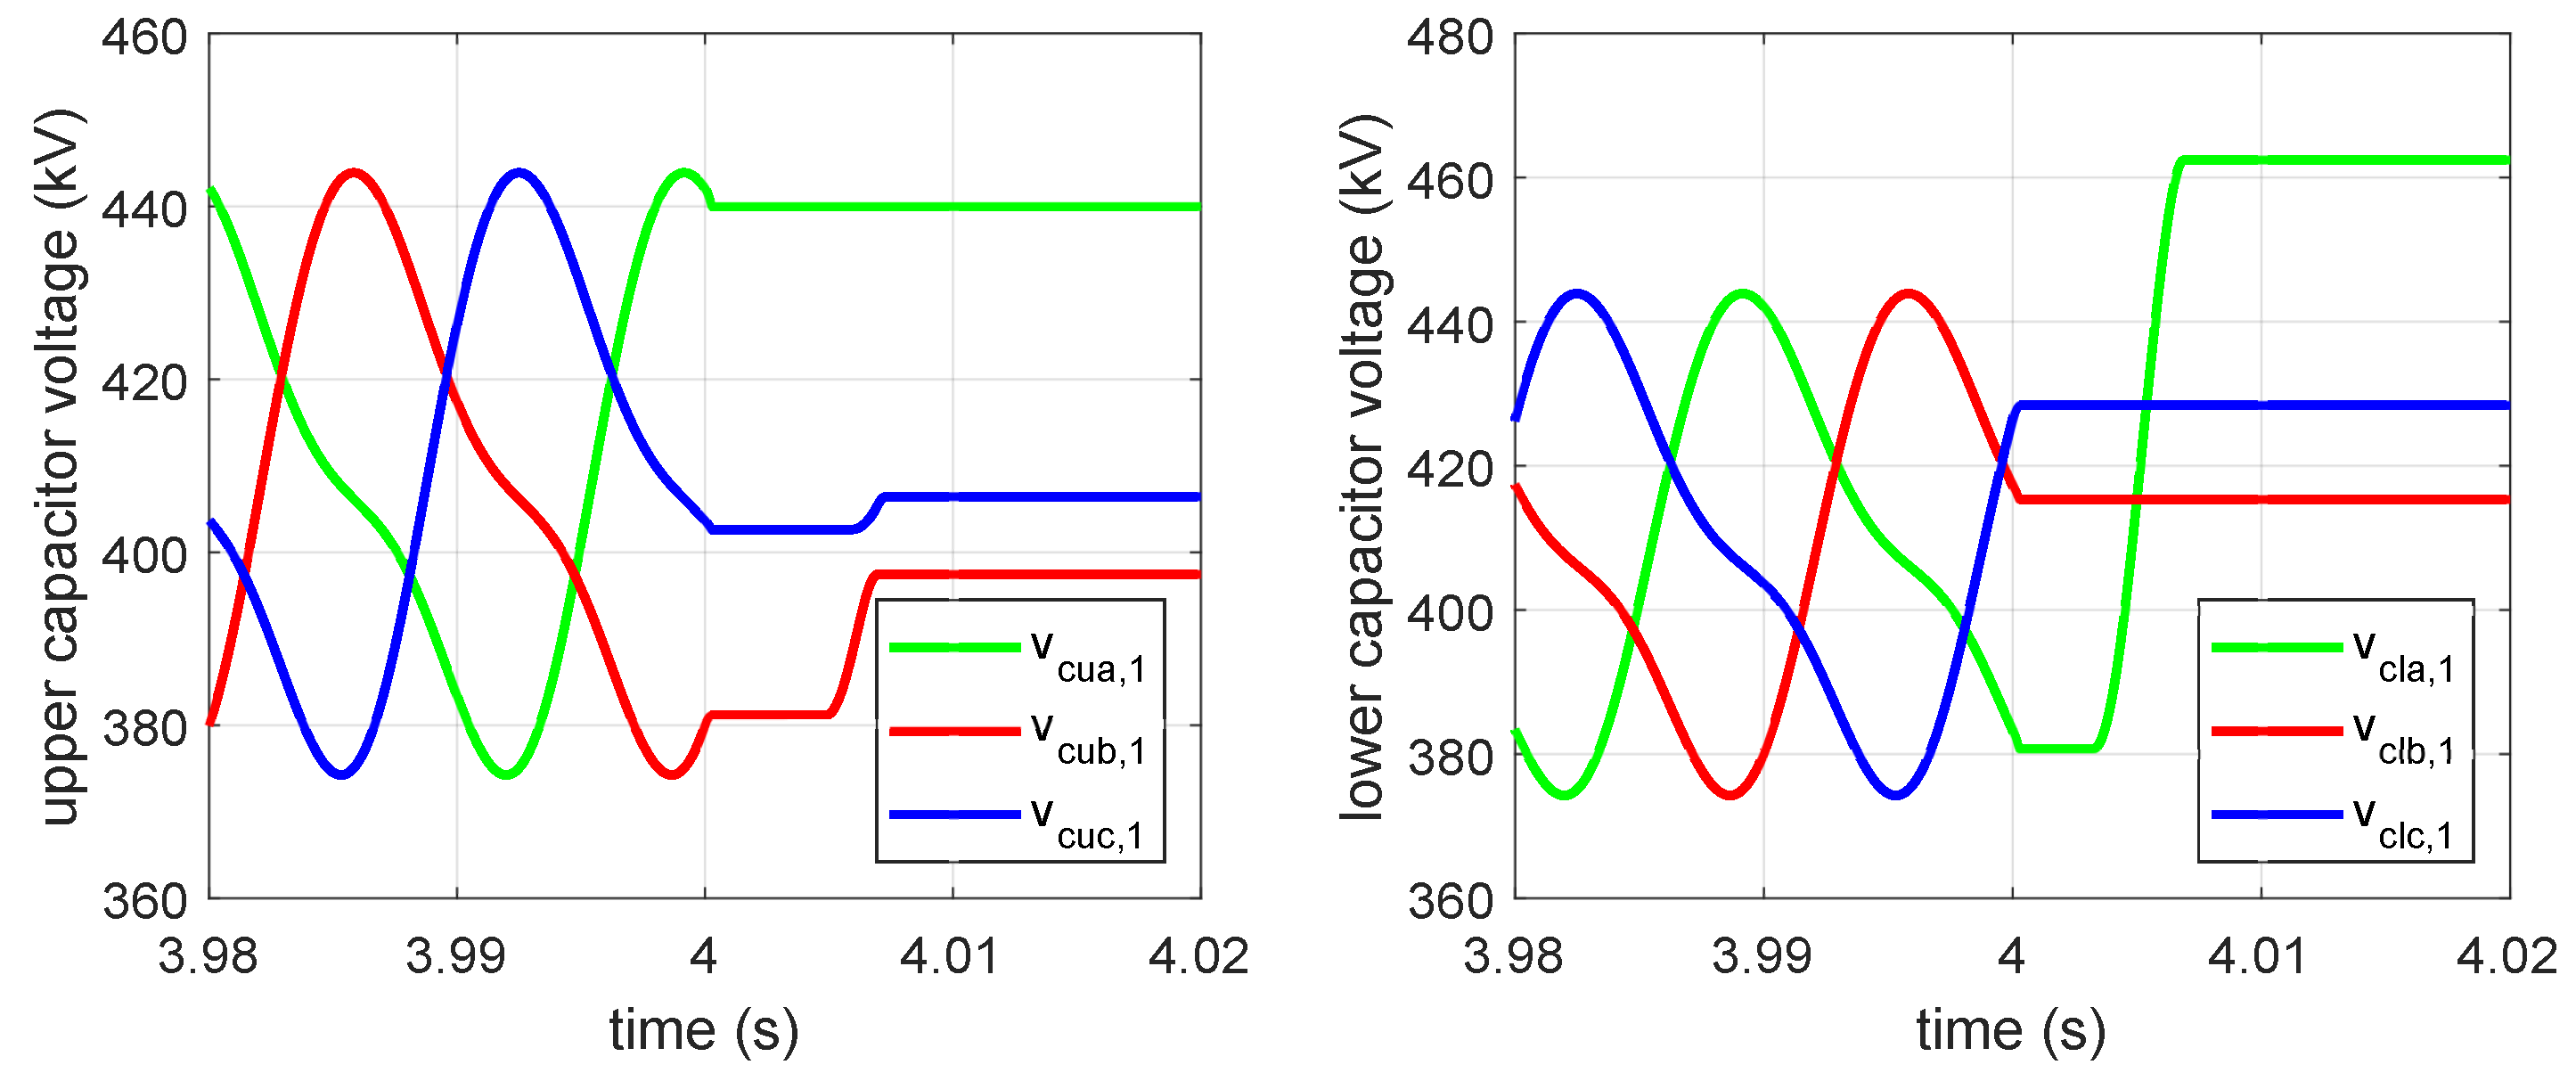
Figure 16.
Capacitors voltages during DC pole-to-pole fault with DC circuit-breakers , green for phase a, red for phase b and blue for phase c.
Figure 16.
Capacitors voltages during DC pole-to-pole fault with DC circuit-breakers , green for phase a, red for phase b and blue for phase c.
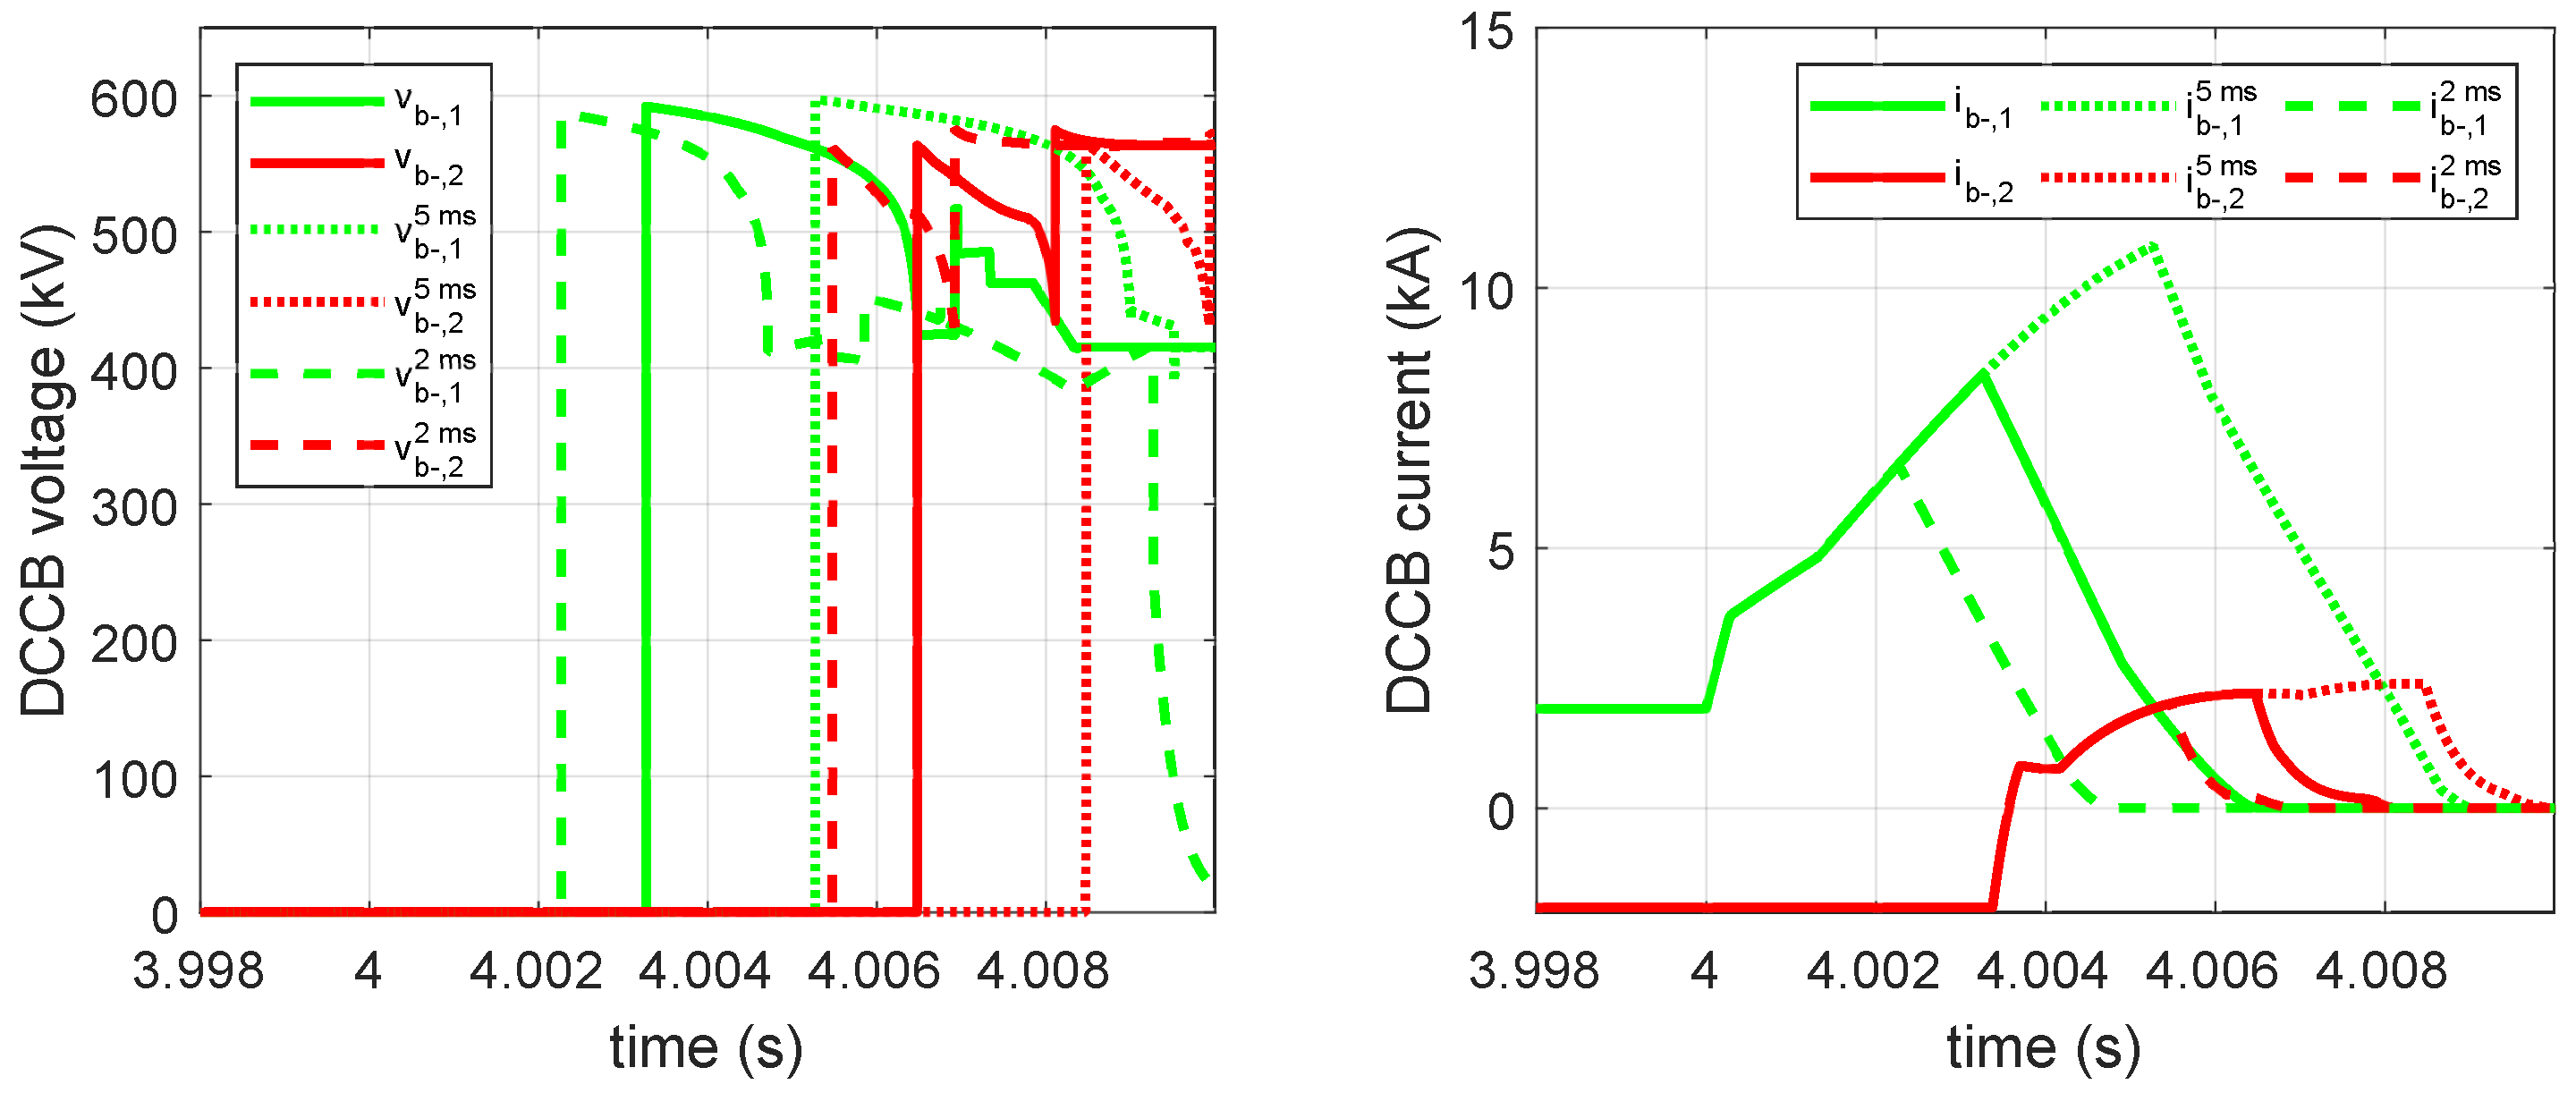
Figure 17.
Current and voltage for the DC circuit-breakers of the negative poles of Converter 1 (green) and Converter 2 (red) with different internal current commutation times , dashed line for ms, solid line for ms and dotted line for ms.
Figure 17.
Current and voltage for the DC circuit-breakers of the negative poles of Converter 1 (green) and Converter 2 (red) with different internal current commutation times , dashed line for ms, solid line for ms and dotted line for ms.
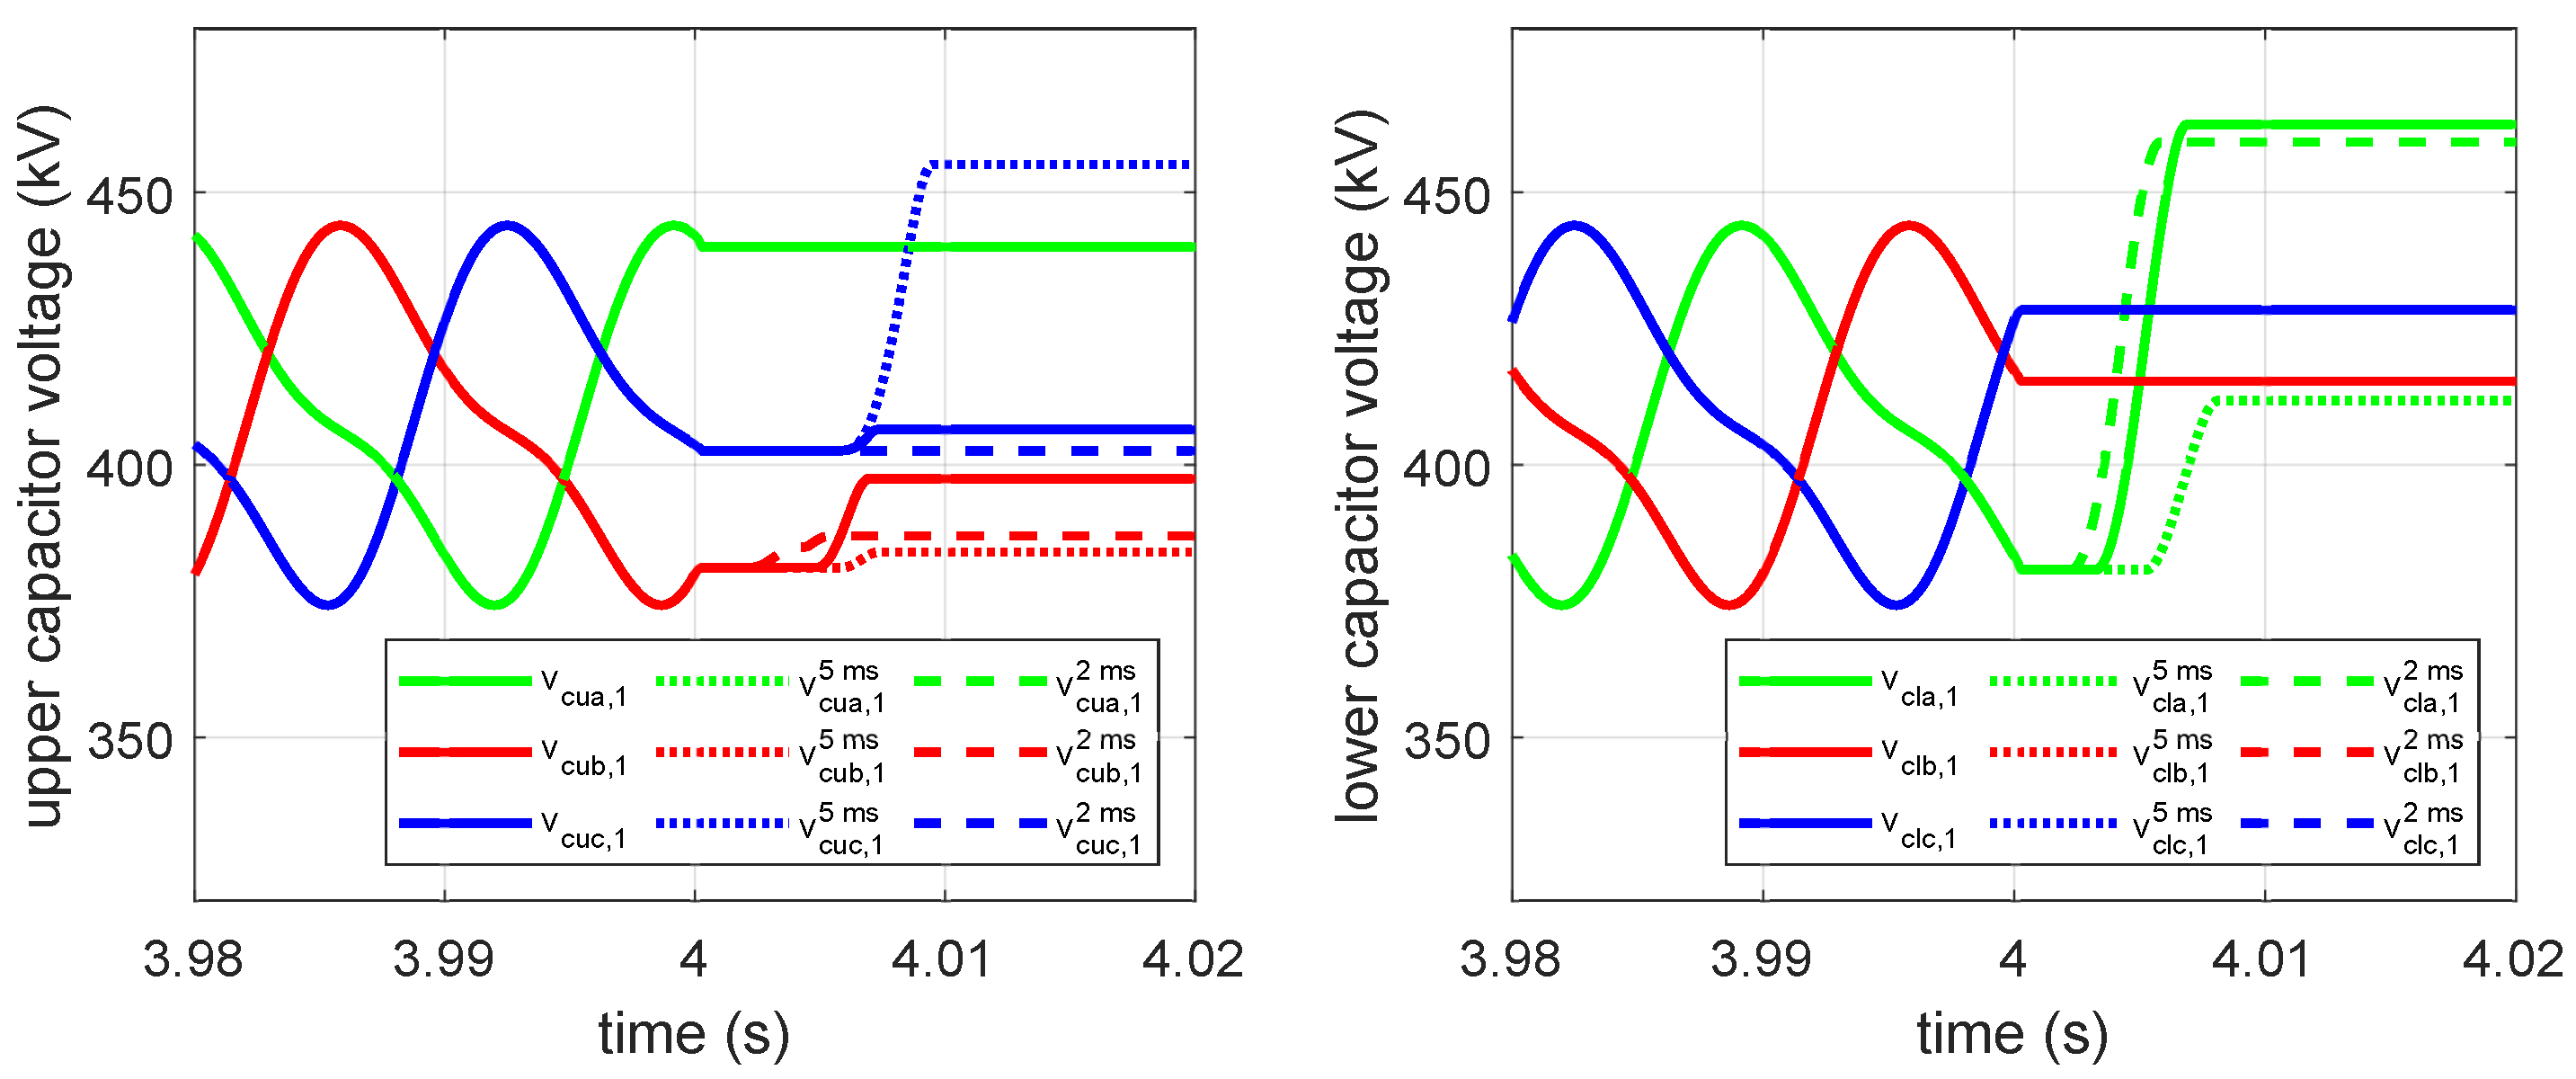
Figure 18.
Capacitor voltages with different internal current-commutation times , dashed line for ms, solid line for ms and dotted line for ms.
Figure 18.
Capacitor voltages with different internal current-commutation times , dashed line for ms, solid line for ms and dotted line for ms.
Table 1.
Electrical characteristics of the HVDC link.
Table 1.
Electrical characteristics of the HVDC link.
| Name | Symbol | Value |
|---|
| Active power | P | 800 MW |
| DC bus voltage | | kV |
| Arm inductor | L | 29 mH |
| Cell capacitance | C | 10 mF |
| Number of cells | N | 200 |
| Equivalent cell resistance | | 1.361 m |
Table 2.
Assumptions considered to model a modular multilevel converter (MMC) cluster.
Table 2.
Assumptions considered to model a modular multilevel converter (MMC) cluster.
| Model with Discrete Devices | Averaged Model |
|---|
| Perfect power switches | Low harmonic distortion |
| Perfect cell capacitor | Large number of cells |
Table 3.
Comparison between the model with discrete devices and the averaged model.
Table 3.
Comparison between the model with discrete devices and the averaged model.
| Modelling of... | Model with Discrete
Devices—Figure 4a | Averaged Model
Figure 4b,c |
|---|
| ...semiconductor | - | - |
| switching transients | no | no |
| ...modulation strategy | yes | no |
| ...cell balancing | yes | no |
| ...semiconductor losses | yes | no |
| ...inner control loops | yes | yes |
| ...voltage and power control | yes | yes |
Table 4.
Macroscopic characteristics of a
kV DC cable [
8].
Table 4.
Macroscopic characteristics of a
kV DC cable [
8].
| Name | Symbol | Value |
|---|
| Resistance per km | | 11 m/km |
| Inductance per km | | 2.615 mH/km |
| Pole-to-ground capacitance per km | | 0.2185 µF/km |
| Conductance per km | | 0.055 µS/km |
Table 5.
Numeric data for the passive elements of the HVDC link.
Table 5.
Numeric data for the passive elements of the HVDC link.
| Name | Symbol | Value |
|---|
| Transformer leakage inductance | | 35 mH |
| Transformer series resistance | | |
| Grid phase-to-phase voltage | | 220 kV |
| Short-circuit resistance | | 1 m |
| Short-circuit inductance | | 100 nH |
| Fault-current limiter | | mH |
Table 6.
Protection method that triggers for each converter with AC circuit-breakers
Table 6.
Protection method that triggers for each converter with AC circuit-breakers
| Converter | Nature of the Protection | Duration | Total Duration
with Internal Delays |
|---|
| 1 (rectifier) | undervoltage | 0 s | 100 µs |
| 2 (inverter) | undervoltage | ms | ms |
Table 7.
Protection method that triggers for each converter with DC circuit-breakers
Table 7.
Protection method that triggers for each converter with DC circuit-breakers
| Converter | Nature of the Protection | Duration | Total Duration
with Internal Delays |
|---|
| 1 (rectifier) | overcurrent (DC link) | 172 µs | 272 µs |
| 2 (inverter) | undervoltage | ms | ms |
Table 8.
Surge current integral (s) for in Converter 1 with AC circuit-breakers.
Table 8.
Surge current integral (s) for in Converter 1 with AC circuit-breakers.
| Phase | a | b | c |
|---|
| upper arms | | | |
| lower arms | | | |
Table 9.
Surge current integral (s) for typical kV devices.
Table 9.
Surge current integral (s) for typical kV devices.
| Manufacturer | Device | Technology | |
|---|
| ABB | 5SNA 2000K450300 | press-pack IGBT + diode | |
| ABB | 5SDF 20L4520 | single press-pack diode | |
| Infineon | D1961SH45T | single press-pack diode | |
| Infineon | D4600U45X172 | single press-pack diode | |
| Toshiba | ST1500GXH24 | press-pack IEGT + diode | |
Table 10.
Surge current integral (s) for in rectifier with DC circuit-breakers.
Table 10.
Surge current integral (s) for in rectifier with DC circuit-breakers.
| Phase | a | b | c |
|---|
| upper arms | | <0.001 | |
| lower arms | <0.001 | | <0.001 |
Table 11.
Electrical characteristics of the circuit-breakers’ operation for different internal current commutation times (ICCTs).
Table 11.
Electrical characteristics of the circuit-breakers’ operation for different internal current commutation times (ICCTs).
| Converter | | 2 ms | 3 ms | 5 ms |
|---|
| 1 | Maximum fault current | kA | kA | kA |
| 1 | Fault current suppression time | ms | ms | ms |
| 1 | Transient interruption voltage | 587 kV | 592 kV | 598 kV |
| 2 | Maximum fault current | kA | kA | kA |
| 2 | Fault current suppression time | ms | ms | ms |
| 2 | Transient interruption voltage | 561 kV | 563 kV | 565 kV |
Table 12.
Surge current integral (s) for with DC circuit-breakers for different internal current commutation times (ICCTs).
Table 12.
Surge current integral (s) for with DC circuit-breakers for different internal current commutation times (ICCTs).
| 2 ms | 3 ms | 5 ms |
|---|
| Converter 1 | | | |
| Converter 2 | | | |


