Article

Throughfall and Litterfall Fluxes Reveal New Inputs and Foliar Cycling Maintain Pb, Cd, Cu, and Zn Pollution Legacy in Eastern U.S. Temperate Forests

by
Justin B. Richardson
1,*,
Minh Tri Truong
1 and
Annise M. Dobson
2
1
Department of Environmental Sciences, University of Virginia, Charlottesville, VA 22904, USA
2
School of the Environment, Yale University, New Haven, CT 06511, USA
*
Author to whom correspondence should be addressed.
Pollutants 2024, 4(4), 474-489; https://doi.org/10.3390/pollutants4040032
Submission received: 26 July 2024 / Revised: 13 September 2024 / Accepted: 8 October 2024 / Published: 15 October 2024

Abstract

Atmospheric pollution of metals negatively impacts the health of terrestrial and aquatic plants and animals. Despite implementation of policies that have substantially decreased emissions of metal pollutants, their legacy continues in temperate forest ecosystems across the globe. Here, we evaluated throughfall and litterfall concentrations and fluxes of Cu, Zn, Cd, and Pb via in rural temperate forests along the Appalachian Mountain range in eastern United States. Our five years of data show that throughfall fluxes of Cu, Cd, and Pb have decreased >89% since the 1980s. However, throughfall Zn and litterfall Cu, Zn, and Cd fluxes remain comparable or greater than the 1980s. These results suggest that Cd, Cu, and Pb emissions have decreased, but trees retain and recycle Cd, Cu, and Zn pollution, extending their legacy for decades following the emission.

1. Introduction

Due to the severe environmental damage done from the industrial revolution to heavy industries of the 1970s, the United States, European nations, and other countries have enacted policies to curb metal pollution to the air, soil, and water [1]. In the United States, the Clean Air Act of 1977 and Clean Air Act Amendment of 1990 limited emission rates of metal pollution from the combustion of fuels (coal, tetraethyl-lead gasoline), industrial activities (non-ferrous smelting, ore processing), and domestic emissions (automobiles, waste incineration) [2,3,4,5,6]. In particular, enactment of these policies substantially reduced metal pollution emission and deposition rates in urban areas of the northeastern United States and rural areas along the Appalachian Mountains (e.g., [3,4,5]). Although emission and deposition have substantially decreased for many inorganic pollutants such as lead (Pb), new inputs of metal pollution of cadmium (Cd), copper (Cu), and zinc (Zn) continue, and the legacy of these metals in rural forest soils continues with potential negative impacts on regional soil and water quality.
Minimizing plant and animal exposure to metal pollutants (e.g., Cd and Pb) is important for the long-term sustainability of ecosystems as well as the ecosystem services provided. At elevated concentrations, Cd and Pb can negatively inhibit plant growth via diminished chemical signaling, chlorophyll abundance, and decreased root growth [7,8]. As pollutants, metals also negatively affect several animal physiological systems (e.g., nervous, circulatory, renal, reproductive) [6,9]. Pollutant elements (Cd, Pb) do not serve essential roles in organisms. For example, Cd negatively impacts ion receptors, transporters, and antioxidant enzymes associated with Ca and Mn, and human Cd exposure is related to cancers of the breast, lung, prostate, nasopharynx, pancreas, and kidney cancers [10]. Similarly, Pb is an important neurotoxin that negatively impacts antioxidant enzymes and chemical signaling associated with Ca and Mn and is also likely a human cancer-causing agent [11].
Pollutant metals may also include elements that serve as essential micronutrients in plants and animals [6], which promote their biological uptake and cycling by trees [12]. In particular, Cu and Zn serve roles as enzyme cofactors and maintain oxidation-reduction potentials in plant and animal organelles and cellular structures [13,14,15]. Furthermore, Cu and Zn have also been widely emitted from non-ferrous smelters in Pennsylvania and New York states and widespread combustion of fuels [14,15]. These non-point source and point source emitters have been enriched in leaves and soils in temperate forests across the eastern United States [5] and globally [16,17]. Fortunately, excessive atmospheric deposition of pollutant metals occurs in close proximity to point source heavy industrial areas [18], occupational exposure [19], and high elevation systems [20]. However, elevated concentrations of Cu in soils (>70 mg kg−1, [21]) and stream waters (1 to 3 µg L−1, [21]) can be harmful to terrestrial and aquatic plants [22], invertebrates [23,24], and vertebrate animals [25].
Although wet and dry deposition are the most common measurements of atmospheric deposition, throughfall and litterfall are unique pathways in temperate forests and provide a better assessment of inputs to soils. Combustion of gasoline containing tetraethyllead, non-ferrous metal smelting, and domestic vehicles and fuel combustion have emitted Cd, Cu, Pb, and Zn to the atmosphere [3,4,5,6]. Atmospheric deposition rates of all four metals were elevated during the 1960s to 1980s but have generally decreased in the 1990s and 2000s from atmospheric emission policies [1,3,4,6]. Wet deposition (e.g., precipitation) and dry deposition (e.g., particles) are commonly monitored for air quality assessment [26,27], but they miss the complex chemical and physical interactions that occur with tree foliage [28]. Tree leaves can scavenge wet and dry deposition from the atmosphere, increasing deposition rates of metal pollution [6,25,28]. Moreover, tree leaves can contribute to metals reaching the surface soil through foliar leaching [26,28], in which metals taken up from the soil are solubilized from the leaf back to the soil. Therefore, throughfall could serve as a better estimate of modern atmospheric inputs to soils as opposed to wet deposition, dry deposition, and bulk deposition commonly studied. Furthermore, metals captured by the foliage or taken up by the leaves can be returned to the soil via litterfall [6,25,28]. The cycling of pollutant metals cycled from leaves back into soil and taken back up by the roots can prolong the legacy of metals in the plant–soil system of temperate forests.
The central goal of this study was to evaluate the current state of atmospheric deposition and vegetation-driven cycling of Cu, Zn, Cd, and Pb in the temperate forests along the Appalachian Mountain range in the eastern United States, from Virginia to New Hampshire. Quantification of throughfall and litterfall atmospheric inputs is limited due to shifts towards dry and wet deposition measurements, which lack interactions with tree canopies. The main premise is that with successful policies reducing atmospheric metal pollution, current deposition rates should be significantly lower than when first enacted in the 1970s and 1980s. Because of this expected decrease, the uptake and internal cycling by tree litter should be the aboveground input of these pollutant metals. Continued evaluation of pollutant metal fluxes via throughfall and litterfall is also needed to evaluate the efficacy of policies and the long-term pollution legacy and recovery from the industrial emissions of the 20th century.

2. Materials and Methods

2.1. Field Study Sites

Six field sites were created in 2018 to investigate element cycling along a 6° latitude gradient (38° N to 44° N) along the Appalachian Mountains of the eastern U.S. (Figure 1, Table 1). Each site was 600 m2 plots in which trees, soils, and aboveground processes were studied. Sites are hardwood aboveground vegetation with minimal modern management post 1960, and are at physiographic montane positioning. The sites are state or privately owned forests, and land-use history has determined their ages to be similar—60–80 years of limited management following reforestation from clear-cutting or pasture land. Each site is at least 30 km from metropolitan areas and known point-source metal pollutant sources to limit surrounding anthropogenic disturbance to focus on non-point-source pollution.

2.2. Throughfall Collection and Flux Measurements

Four throughfall collectors were deployed at each site to capture atmospheric inputs of elements. An acid-washed 20 L vessel was secured to the ground and had a circular funnel (diameter = 10.2 cm) from the sealed lid at 50 cm height. The collectors were placed ~10 m apart from each other along cardinal directions and at least 1 m from tree stems to capture spatial heterogeneity and avoid stemflow. Fiber glass mesh covers the top of the funnel, preventing debris > 1 mm from entering. To capture the influence of the tree canopy, the four throughfall collectors were emptied twice a year, once in April-May for winter throughfall prior to spring leaf emergence and again in October and November immediately after autumnal leaf senescence for growing season throughfall. The total volume of throughfall collected was weighed in the field, and one representative 1 L subsample is returned to the laboratory to be filtered to a pore size < 0.2 µm, oxidized with H2O2 to remove all the organics, and acidified to pH 1 with 15.8 M HNO3. Due to their low inherent concentrations, throughfall solutions were analyzed for trace elements (As, Cd, Cr, Co, Cu, Ni, Pb, W, Zn, and U) with an Agilent 7700x Inductively Coupled Plasma-Mass Spectrometer (Agilent Technologies, Santa Clara, CA, USA). Trace metals and metalloids (TMMs) in the preparation blank were <0.01 ng g−1 and all duplicates were within 6% CV.

2.3. Aboveground Litterfall Fluxes

Sites 1, 2, and 3 are predominantly northern hardwoods, predominantly American beech (Fagus grandifolia), birches (Betula nigra, Betula papyrifera), sugar maple (Acer saccharum), red maple (Acer rubrum) and black cherry (Prunus serotina). Dominant tree species of Sites 4, 5, and 6 are red oaks (e.g., Quercus rubrus), white oaks (e.g., Quercus montana), hickory (Carya spp.,), yellow poplar (Liriodendron tulipifera), and sassafras (Sassafras albidum). All trees within the 600 m2 site were identified and measured for diameter at breast height (DBH).
Four litterfall traps were deployed at each of the six study sites. Litterfall traps were 1.2 m tall and 0.9 m × 0.9 m PVC pipes with plastic mesh (φ = 1 cm) to collect foliage and woody debris. Litterfall trap nets were serviced in May and June and emptied in October and November, with varying timeframes due to differences in spring leaf out and fall senescence timing along the climate gradient. Plastic netting and structural joints were replaced at least every 3 years or sooner as needed. Litterfall collections were completed in 2018, 2019, 2020, 2021, and 2022, in which collected litter was sorted by tree species, dried to a constant weight, and then weighed to determine total litterfall fluxes as mass per unit area with the four collection traps. Foliage and woody debris sub-samples were analyzed for micronutrient and pollutant metals using a modified EPA 3050B method. At least 10 separate identifiable leaves were ground to <2 mm fragments, ashed at 450 °C for 6 h and then digested using 5 mL of reverse aqua regia (9:1 ratio of 15.7 M HNO3: 11.6 HCl) at 80 °C for 1 h, then diluted to 50 mL using 18.2 MΩ DI water. Litterfall digest dilutions were analyzed for pollutant elements using an Agilent 5110 Inductively Coupled Plasma-Optical Emission Spectrometer (Agilent Technologies, Santa Clara, CA, USA). Copper, Cd, Pb, and Zn concentrations in the preparation blank were <0.001 mg kg−1, and all duplicates were within 6% CV. Recovery for TMMs in NIST 2709a and 2710a by pseudo-total digestion was 80 to 105% of their certified values (Cd 95–104%, Cu 87–106%, Pb 87–106%, Zn 92–101%, respectively).

2.4. Data Analyses

Descriptive statistics as well as parametric and non-parametric statistical tests were calculated in MATLAB R2023a. In-text values either report minimum and maximum values; arithmetic mean values ± 1 standard error (SE) are presented in text and in figures. Throughfall data were analyzed for each site for each year as the average of the four traps. Litterfall data were analyzed for the average mass per trap and again by genera or genera. We determined annual flux rates using litterfall masses of each species or genera for each litterfall trap. After establishing normality with the Lilliefors test and logarithmically transforming data when needed, a two-way ANOVA was applied with post hoc Tukey’s HSD test to determine significant differences among sites and year collected. When sample sizes were small and could not meet criteria to be parametric, such as among species and genera, the non-parametric Kruskal–Wallis test with post hoc Wilcoxon Rank Sum test was used.

3. Results and Discussion

3.1. Throughfall Concentrations

Throughfall concentrations for each site are displayed in Table 2, and throughfall data are available online [29]. Overall average growing season (April to October 2018–2022) throughfall Cu, Zn, Cd, and Pb concentrations were 469 ng L−1, 43 μg L−1, 32 ng L−1 and 36 ng L−1, respectively. Overall average winter (November to March 2018–2022) throughfall Cu, Zn, Cd, and Pb concentrations were 472 ng L−1, 64 μg L−1, 16 ng L−1 and 43 ng L−1, respectively.
Copper and zinc throughfall concentrations were at the very lower range of rural wet deposition concentrations across the eastern U.S. in the 1970s compiled by Galloway et al. (1982) [26], at 400 to 150,000 ng L−1 for Cu and 1 to 311 μg L−1 for Zn (Table 2). The Cu throughfall concentrations at our sites were lower than similar contemporary studies in Europe and Asia such as Gandois et al. (2010) [30] conducted across France (1600 ng L−1) and Zhang et al. (2021) [31] in the Qinling mountains of China (2000 to 4000 ng L−1) in 2009 to 2011. These results highlight that Cu concentrations have substantially decreased from the successful implementation of the air pollution control policies in the United States but show that their release and emission continue globally.
Likewise, Cd and Pb throughfall concentrations were well-below the rural wet deposition ranges estimated by Galloway et al. (1982) [26] of 80 to 4600 ng L−1 for Cd and 590 to 64,000 ng L−1 for Pb (Table 2). Since the 1980s, throughfall Pb concentrations have decreased 20× from ~20,000 ng L−1 measured at Hubbard Brook, which was considered ‘low Pb’ period of precipitation [3].
The only consistent seasonal difference was throughfall Zn concentrations, which were greater during winter at three of the six sites. Considering all sites together, throughfall concentrations of Zn were significantly greater for winter (64 ± 10 µg L−1) than during the growing season (43 ± 10 µg L−1). Regarding seasonal differences among metals, throughfall Zn concentrations were consistently higher in winter than the growing season, which agrees with spikes in Zn concentration in precipitation during winter months revealed by Sweet et al. (1998) [32]. One potential hypothesis is the greater scavenging of Zn in ice formed from small water droplets in winter cloud layers [33].
Across the six sites, Cu, Cd, and Pb did not exhibit a strong seasonality difference (t-test, p > 0.1). However, there were also site-specific differences in throughfall concentrations observed: lower Cd throughfall concentrations at Sites 3 and 4 in the winter (p < 0.05), lower Pb throughfall concentrations at Sites 5 and 6 during the winter (p < 0.05) and Cu throughfall concentrations (Site 2) during growing season (p < 0.05) were also observed in our study. The elevated Cd during the growing season could be due to interactions with foliage containing Cd translocated from the soil, while the elevated Pb and Cu during winter may be due to winter combustion of fuels for domestic heating or biomass burning to clear agricultural fields and wooded lands.

3.2. Throughfall Fluxes

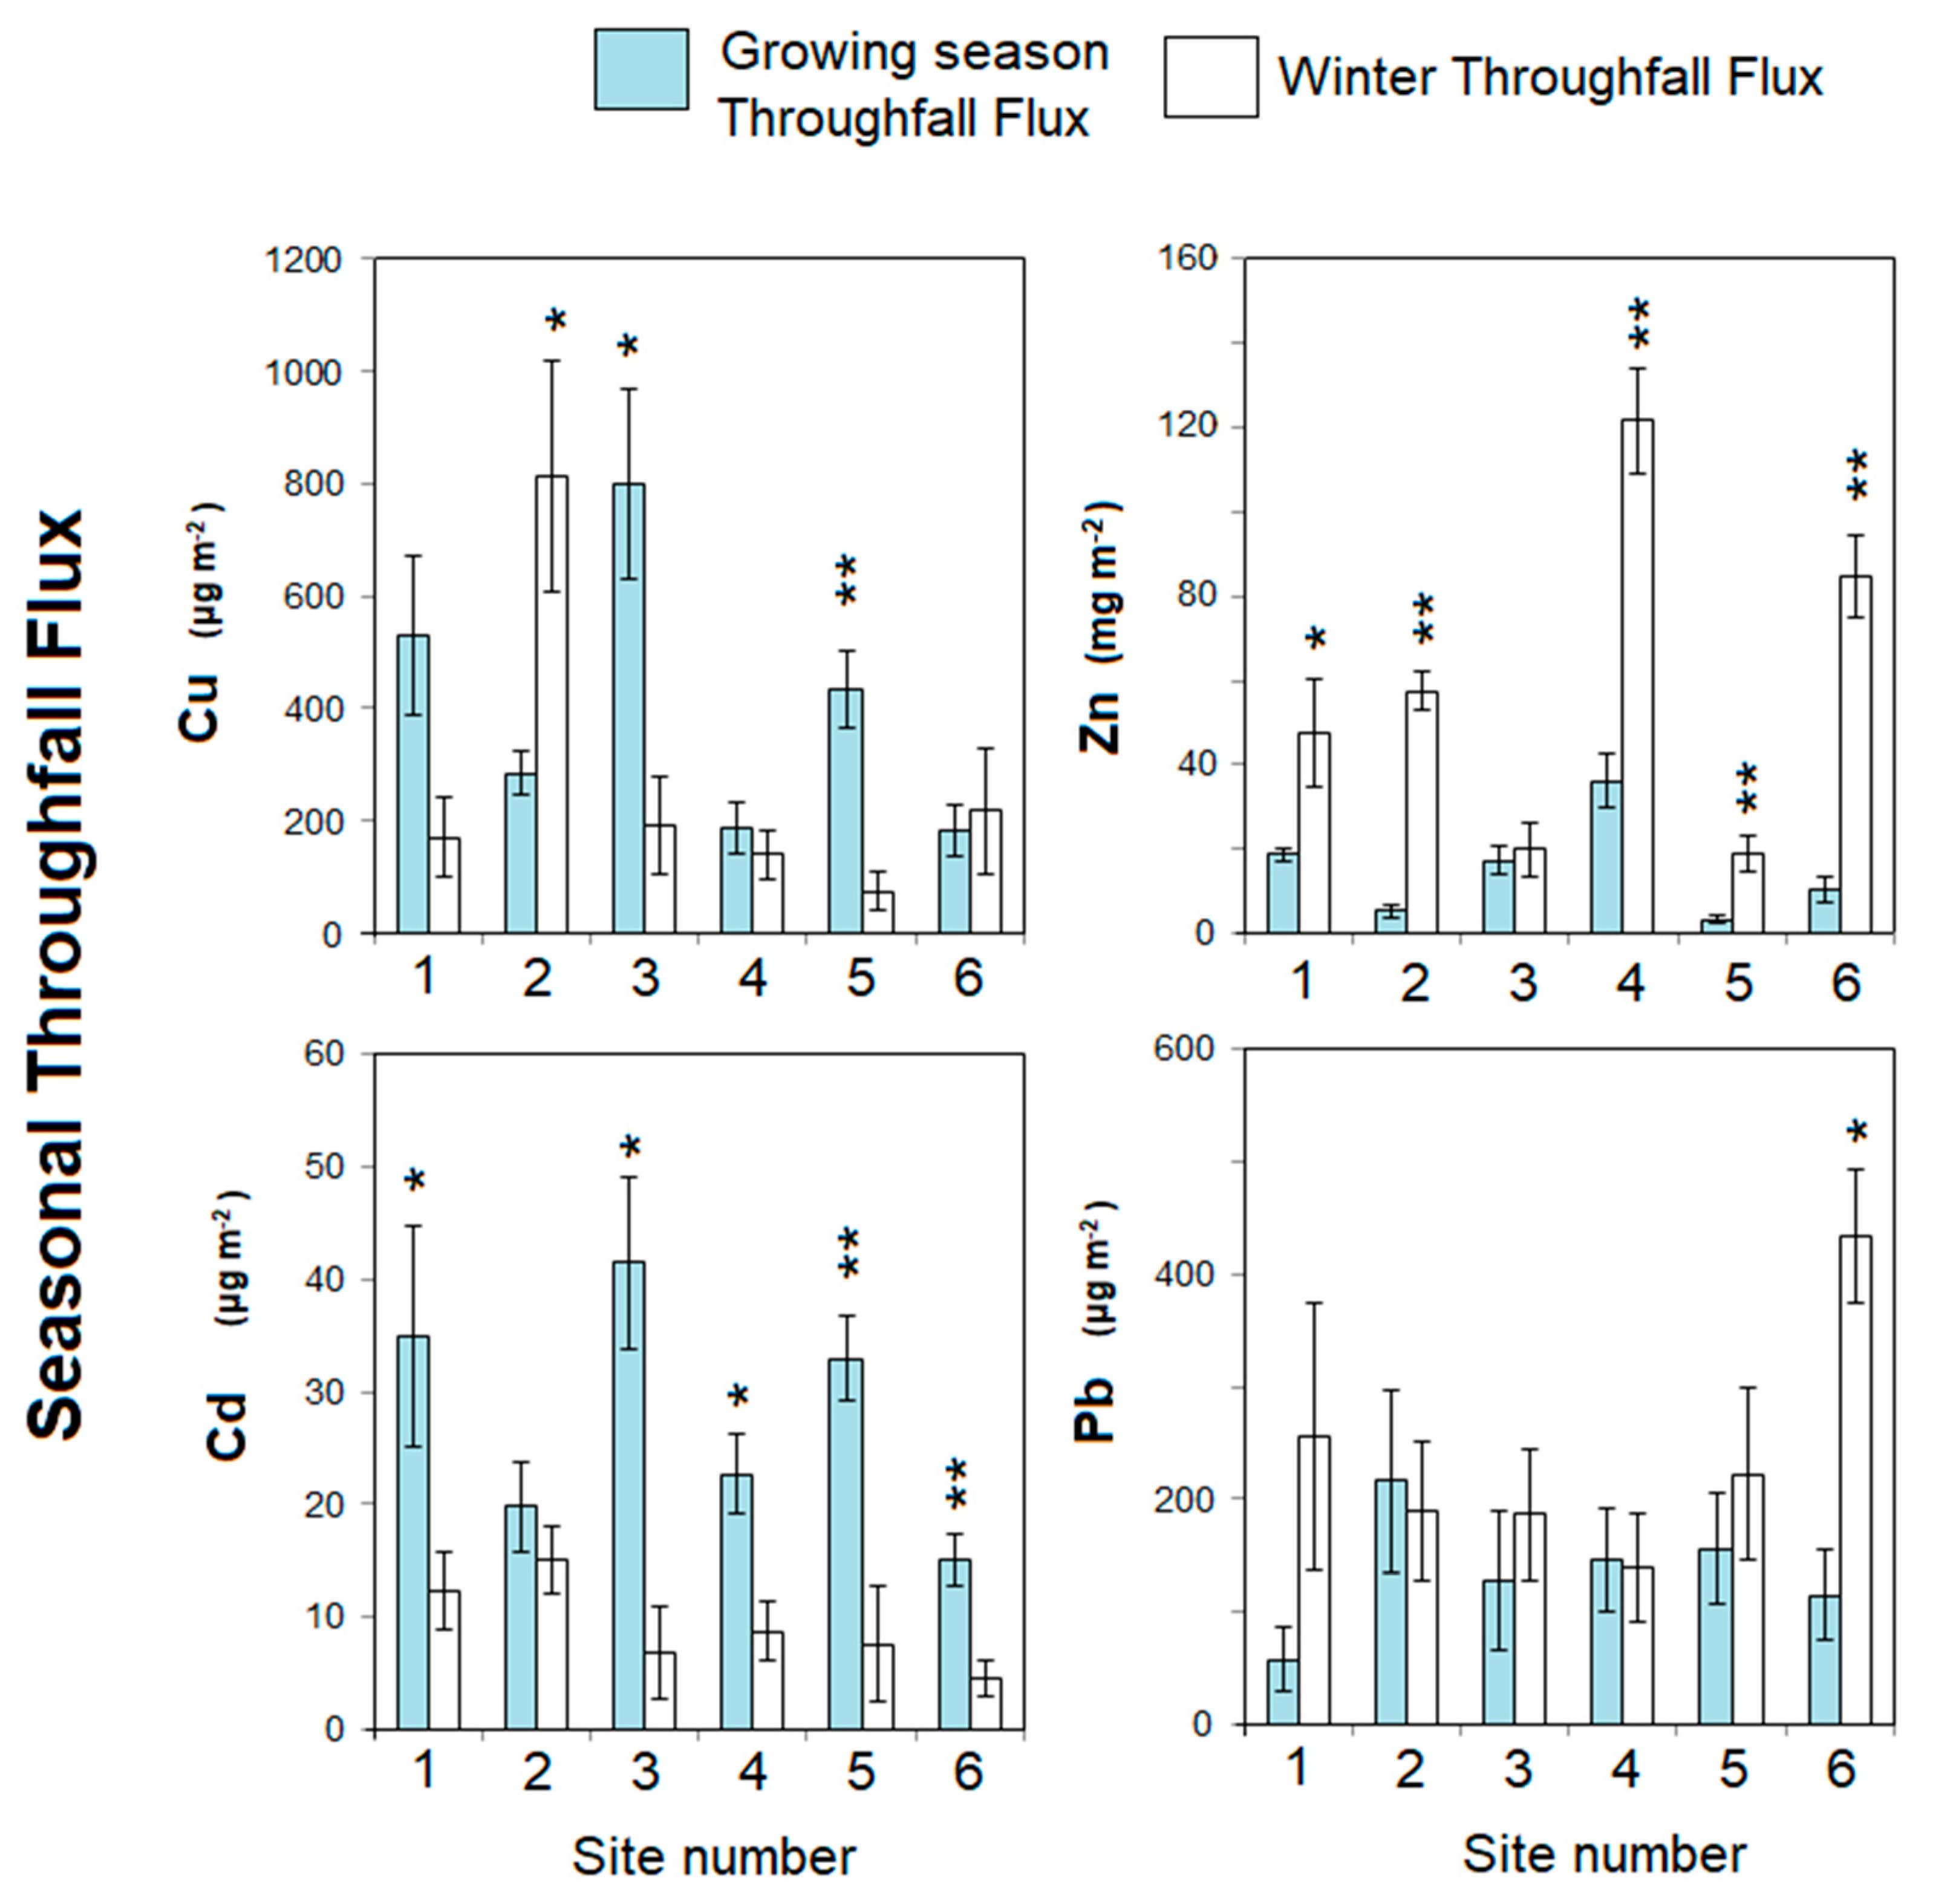
Due to variability in the total amount of throughfall occurring at each site each season, it is useful to consider elemental fluxes in addition to concentrations. Throughfall fluxes for each site were estimated using the throughfall concentrations and the mass of throughfall collected per season (Figure 2). Throughfall mass was comparable for the six sites (900 to 1150 L m−2 yr−1) except for Site 4 (710 L m−2 yr−1). Overall average growing season 2018–2022 throughfall Cu, Zn, Cd, and Pb fluxes were 215 ug m−2, 15.2 mg m−2, 13.9 ug m−2, 137 ug m−2, respectively. Overall winter 2018–2022 throughfall Cu, Zn, Cd, and Pb fluxes were 268 ug m−2, 58.4 mg m−2, 9.2 ug m−2, 239 ug m−2, respectively. Summing the growing season and winter season yields and estimating the total annual throughfall flux rates. Total annual throughfall Cu, Zn, Cd, and Pb flux rates were 483 ug m−2 yr−1, 73.6 mg m−2 yr−1, 23.2 ug m−2 yr−1, and 376 ug m−2 yr−1, respectively.
Total annual Cu, Cd, and Pb throughfall fluxes were substantially below the range of rural wet deposition concentrations of the 1970s compiled by Galloway et al. (1982) [26] of 1000 to 50,000 μg m−2 yr−1 for Cu, 120 to 880 μg m−2 yr−1 for Cd, and 1000 to 50,000 μg m−2 yr−1 for Pb. The throughfall Cu, Cd, and Pb fluxes were lower than more modern studies such as Landre et al. (2010) [34] conducted in central Ontario, Canada, and Pan and Wang (2014) [35] in the rural areas of northern China. These results highlight that fluxes have also substantially decreased from the successful implementation of the air pollution control policies in the United States and also globally.
Our measured Zn throughfall fluxes (30 to 151 mg m−2 yr−1) were within the lower range of rural wet deposition concentrations of the 1970s of 4 to 1100 mg m−2 yr−1 for Zn [26] (Figure 2). The throughfall Zn fluxes matched observed Zn wet and dry deposition fluxes in urban, peri-urban, and industrial areas of northern China with annual fluxes of ~15 to 150 mg m−2 yr−1 [35]. Moreover, the throughfall Zn fluxes were 6× higher than observed in central Ontario [34]. These results highlight that despite reductions in Zn emissions, throughfall rates of Zn still remain high over the Appalachian Mountains. There are two potential drivers of the continued elevated Zn throughfall rates in the eastern US: (1) continued modern emissions from fuel combustion, automobiles, and industrial activities; or (2) legacy cycling from vegetation and legacy pollutant Zn leaching from leaves. In the first scenario, Zn emissions and atmospheric deposition may have continued or increased. As shown by eight USGS sediment cores analysis by Thapalia et al. [36]. Zn deposition continues to increase in several regions of the United States and can be attributed to vehicle-related sources [36]. In the second scenario, legacy Zn is taken up to the foliage from the soil by the trees, where it can leach from leaves during precipitation. As noted by Rea et al. (2001) [37], Zn has been shown to be one of the more mobile metals that can be leached from tree foliage. While both mechanisms are possible, the observed higher winter Zn throughfall concentration and fluxes suggests a greater fuel combustion intensity for heating or lingering industrial emissions, while tree foliage is at a minimum. Therefore, Zn is unlikely to leach into the collectors, and additional analyses using Zn isotopes can help identify and quantify the impact of legacy Zn from the soil compared to modern vehicular pollutant Zn.
Throughfall Cd fluxes exhibited strong seasonality, with significantly higher rates during the growing season (Figure 2). Similarly to Zn, this implies either (1) higher emissions or foliar capture of Cd during the growing season or (2) that trees are uplifting Cd to the leaves and precipitation is leaching the Cd from the leaves. Since emissions of Cd should be comparable during the growing season and previous studies (such as Richardson and Friedland [38]) have shown enrichment of Cd in tree leaves from soil uptake, we hypothesize that uptake of legacy pollutant Cd is likely driving the higher throughfall of Cd during the growing season.
Similar to throughfall concentrations, throughfall fluxes exhibited mixed site-specific seasonality differences for Cu and Pb but were not significantly different between seasons among sites (Figure 2). Throughfall Cd fluxes were significantly different at Sites 3 and 5 but not significantly different across sites. A study by Avila and Rodrigo (2004) [39] suggested Cu and Pb dry deposition as the main driver in oak forests as opposed to foliage leaching in Montseney Mountains (Spain), explaining the disparity in fluxes and seasonality in Cu and Pb throughfall concentration and fluxes at our sites.

3.3. Litterfall Concentrations

Litterfall was examined to evaluate tree effects on pollutant metal legacy. Litterfall data are available online [29]. Overall, foliar litterfall concentrations across all sites and all species were 5.0 mg kg−1 for Cu, 43 mg kg−1 for Zn, 0.34 mg kg−1 for Cd, and 0.48 mg kg−1 for Pb (Table 3). There were significant differences (p < 0.05, Two-way ANOVA) among sites for litterfall concentrations. Litterfall Cu was significantly greater for Site 6 than Site 2. Litterfall Zn, Cd, and Pb concentrations were significantly higher for Site 3 than Site 2. Litterfall Cu, Zn and Cd concentrations in this study were comparable to leaves and litter measurements in Maine USA in 2004 by McGee et al. (2006) [40], in Sweden in 1984 by Nordén (1994) [41], and Ontario, Canada in 1999 by Landre et al. (2010) [34]. Litterfall Pb concentrations were substantially lower than measured at Hubbard Brook in 1975 by Smith and Siccama (1981) at 7.0 mg kg−1 [42] and in Sweden in 1984 by Nordén (1994) [41] at 4.0 mg kg−1.
Table 3. Litterfall concentrations across dominant tree species means across five years of collection.
Site/Study TreesLocationYearsCuZnCdPb
mg kg−1mg kg−1mg kg−1mg kg−1
(This study) Site 1Beech/MapleNH, USA2018–20223.2 ± 0.621.1 ± 4.60.14 ± 0.040.22 ± 0.06
(This study) Site 2Beech/MapleVT, USA2018–20221.7 ± 0.314.7 ± 2.90.12 ± 0.030.14 ± 0.02
(This study) Site 3Birch/OakMA, USA2018–20222.8 ± 0.347.4 ± 6.40.36 ± 0.080.38 ± 0.08
(This study) Site 4Beech/Cherry/MaplePA, USA2018–20223.8 ± 0.821.5 ± 5.50.23 ± 0.110.27 ± 0.06
(This study) Site 5Hickory/OakMD, USA2018–20222.1 ± 0.221.5 ± 3.80.28 ± 0.060.52 ± 0.15
(This study) Site 6Hickory/Yellow PoplarVA, USA2018–20224.9 ± 1.121.3 ± 4.80.10 ± 0.030.30 ± 0.06
Pan and Wang [35] Mixed ChineseEastern China20138.239-4.9
Richardson and Friedland [38]Beech/Birch/MapleVT, NH USA2012–20147.173.70.480.39
McGee et al. [40]Birch/Aspen/MapleME, USA2004-2741.160.47
Landre et al. [34]Pine/Maple/OakOntario, CA19993.454.20.210.20
LaskowskiOak/HornbeamPoland198812.993.50.6413.1
Nordén [41]Beech/Oak/HornbeamS. Sweden1986–19885.936.2-3.9
Smith and Siccama [42]Beech/Birch/MapleNH, USA1975---6.1
Bergkvist et al. (1988) [16]BeechCentral Germany197424690.7033
Gosz et al. [43]Beech/Birch/MapleNH, USA19737.7192--
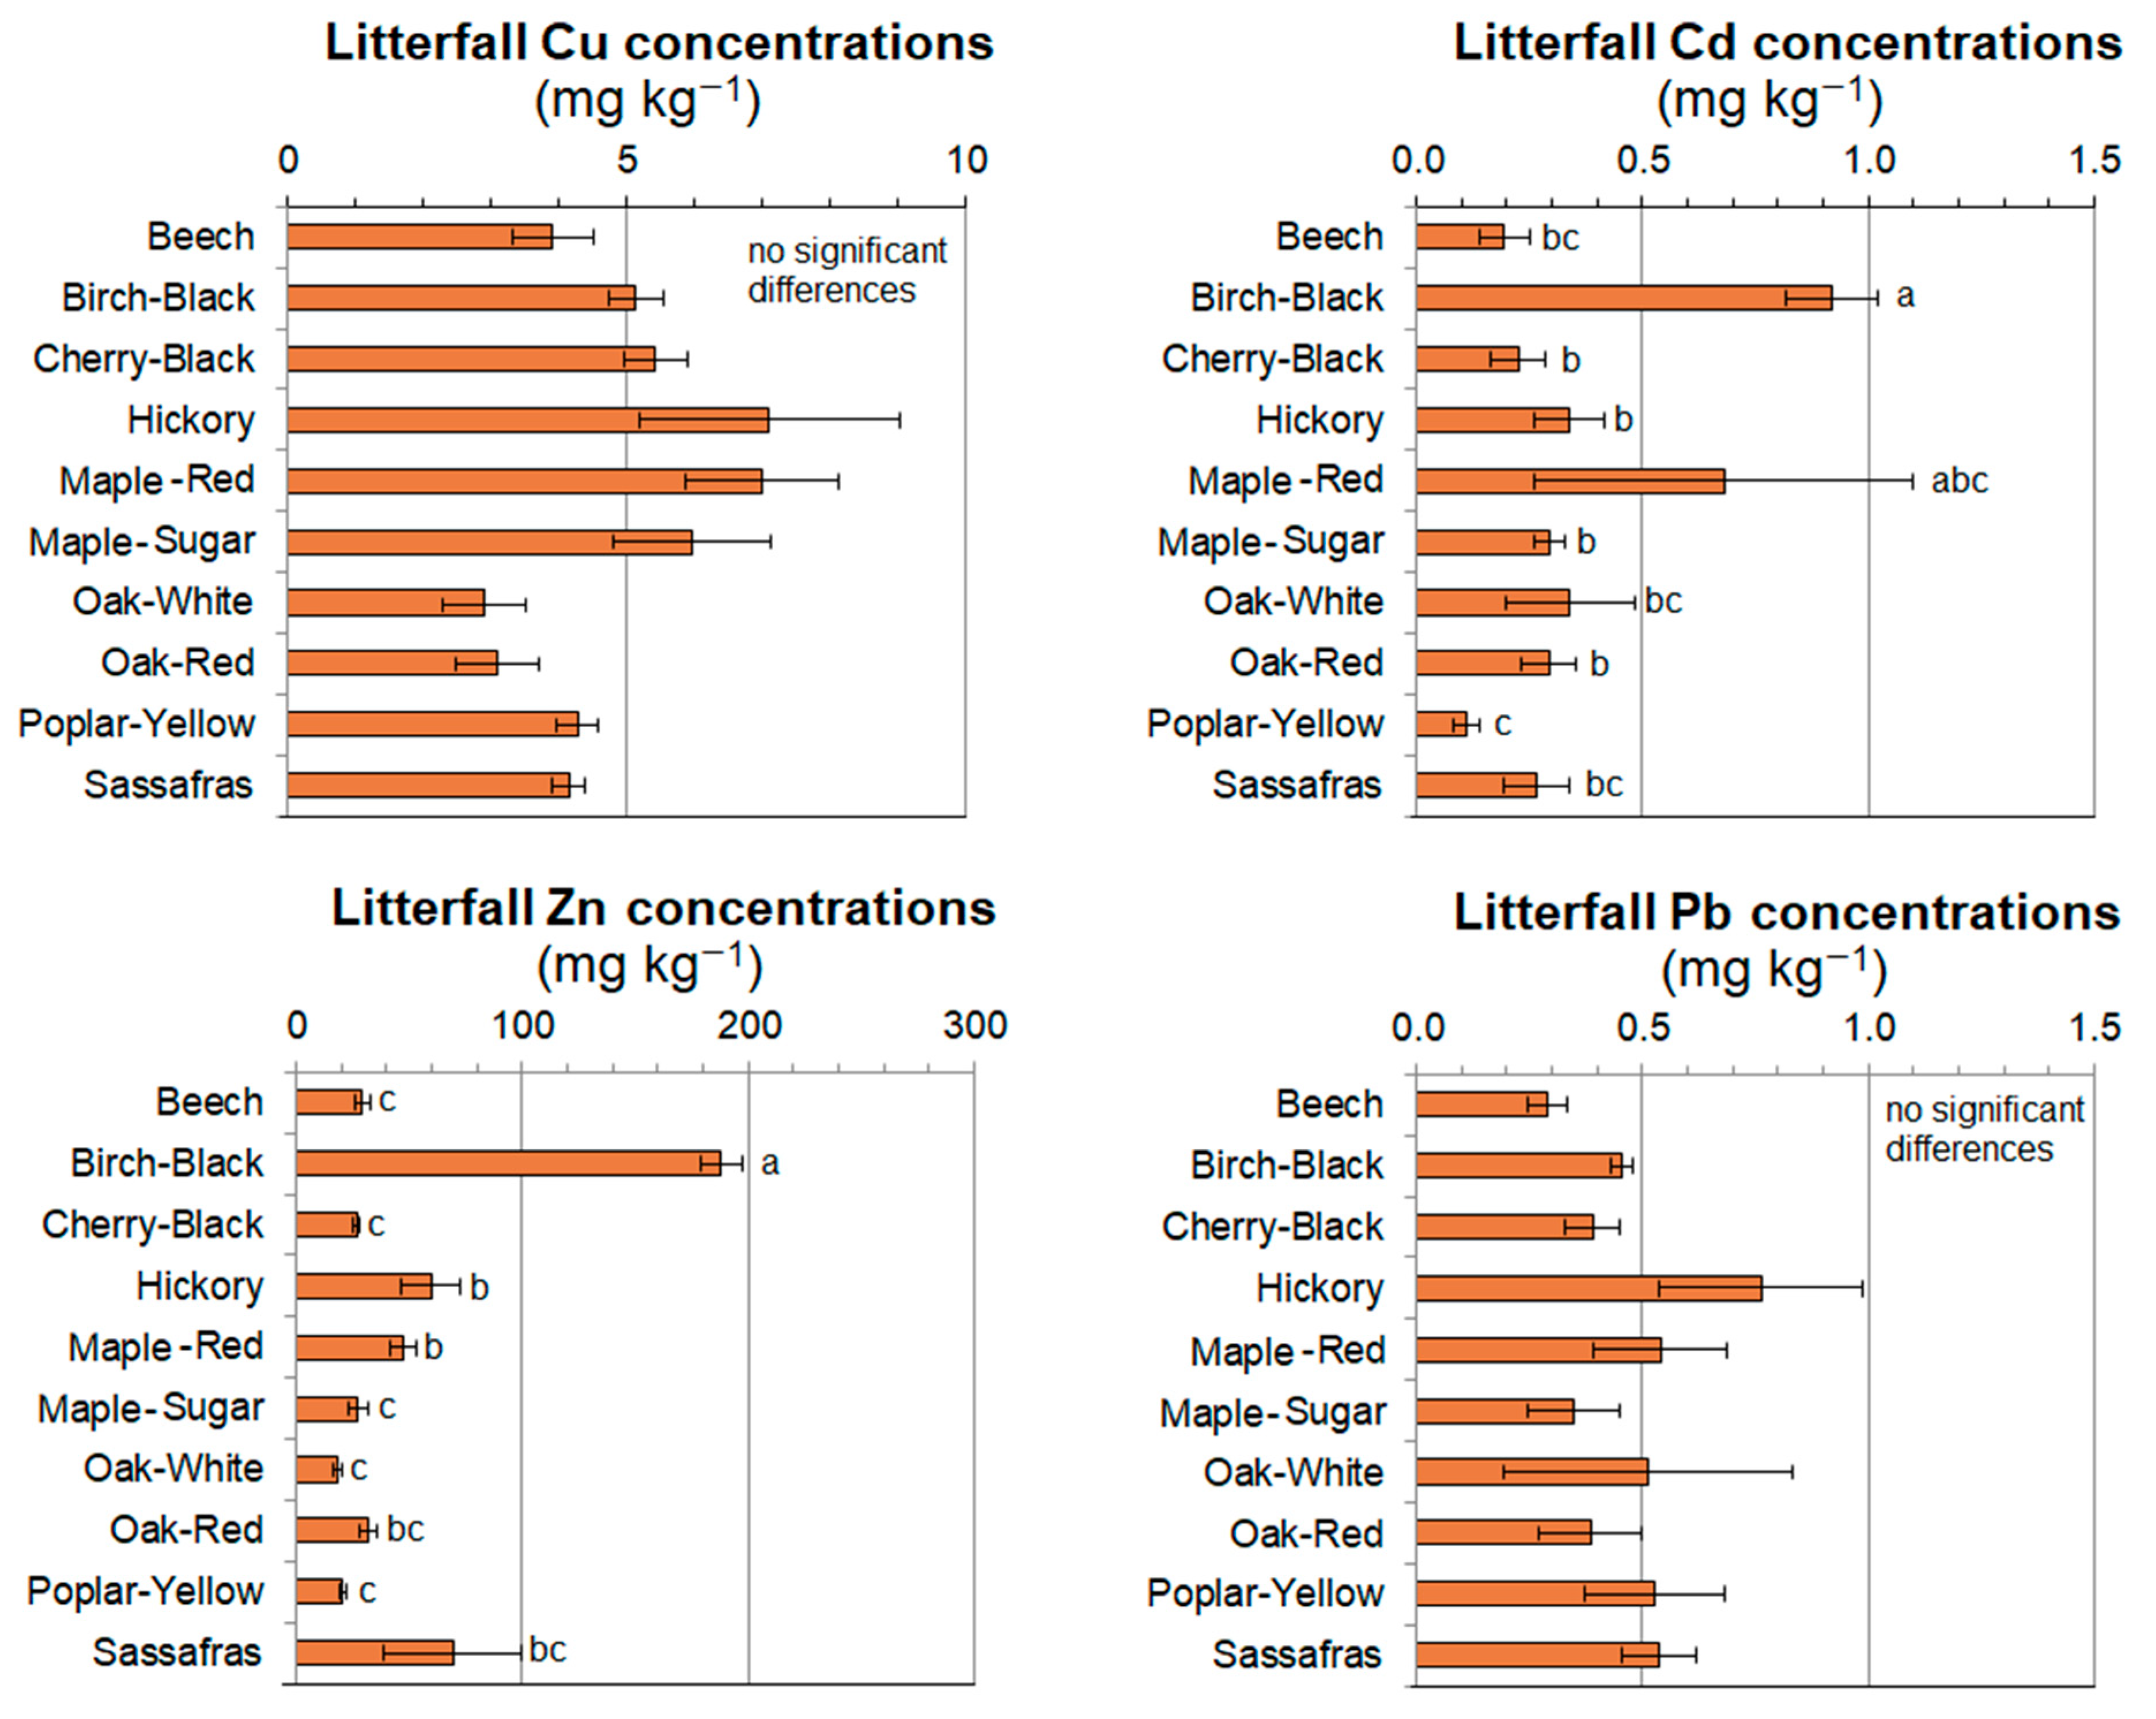
Differences in litterfall concentrations among sites may be explained by variability in tree genera abundance at each site. Birch (Betula) at Site 3 obtained significantly higher litterfall Zn and Cd concentrations compared with many other genera, especially American beech (Fagus grandifolia) abundance at Site 2 (Figure 3). The elevated accumulation of divalent cations (e.g., Cd, Ni, Zn) by birch trees has been well-characterized by previous studies [44,45,46]. Birch metal accumulation from soil has been observed to occur in urban systems, industrially polluted sites, and even remote forests away from anthropogenic activities [4].

3.4. Litterfall Fluxes

Litterfall fluxes of Cu, Zn, Cd, and Pb were determined using five years of litter trap collections from 2018 to 2022, sorted by species, and analyzed for elemental concentrations separately. Woody debris was not considered part of litterfall due to its high heterogeneity in mass across traps and years and low trace element concentrations. Five-year average litterfall masses were not significantly different among the sites and ranged from 470 up to 602 g m−2 yr−1 (p > 0.05). Litterfall flux five-year averages for Cu, Zn, Cd, and Pb were 3.1 mg m−2 yr−1, 25 mg m−2 yr−1, 0.20 mg m−2 yr−1, and 0.30 mg m−2 yr−1, respectively. Litterfall fluxes exhibited significant differences across sites. Higher litterfall masses (i.e., larger trees) and litterfall metal concentrations (e.g., higher birch proportion) drove the high Zn, Cd, and Pb fluxes at Site 3 (Figure 4). In particular, birch was only 15% of the total litterfall mass at Site 3 but was 55% of the Zn flux and 41% of the Cd flux for Site 3. The only other genera to have an outsized proportional effect on litterfall fluxes was hickory, which represented 44% of the litterfall mass at Site 6 but 65% of the Cu flux and 61% of the Cd flux at Site 6.
In addition, there were significant annual differences in litterfall fluxes. In 2022, there was significantly higher litterfall mass collected across all of the sites than 2020 and 2021 and thus higher Cu, Zn, Cd, and Pb flux rates. In 2022, there were above-average precipitation and air temperatures across the northeastern United States [47], which likely promoted greater production of foliage. Conversely, 2020 and 2021 had below average precipitation and near average temperatures early in the growing season (May and June) across the six sites, likely decreasing overall foliage production [47].

3.5. Comparing Throughfall and Litterfall Fluxes, Past and Present

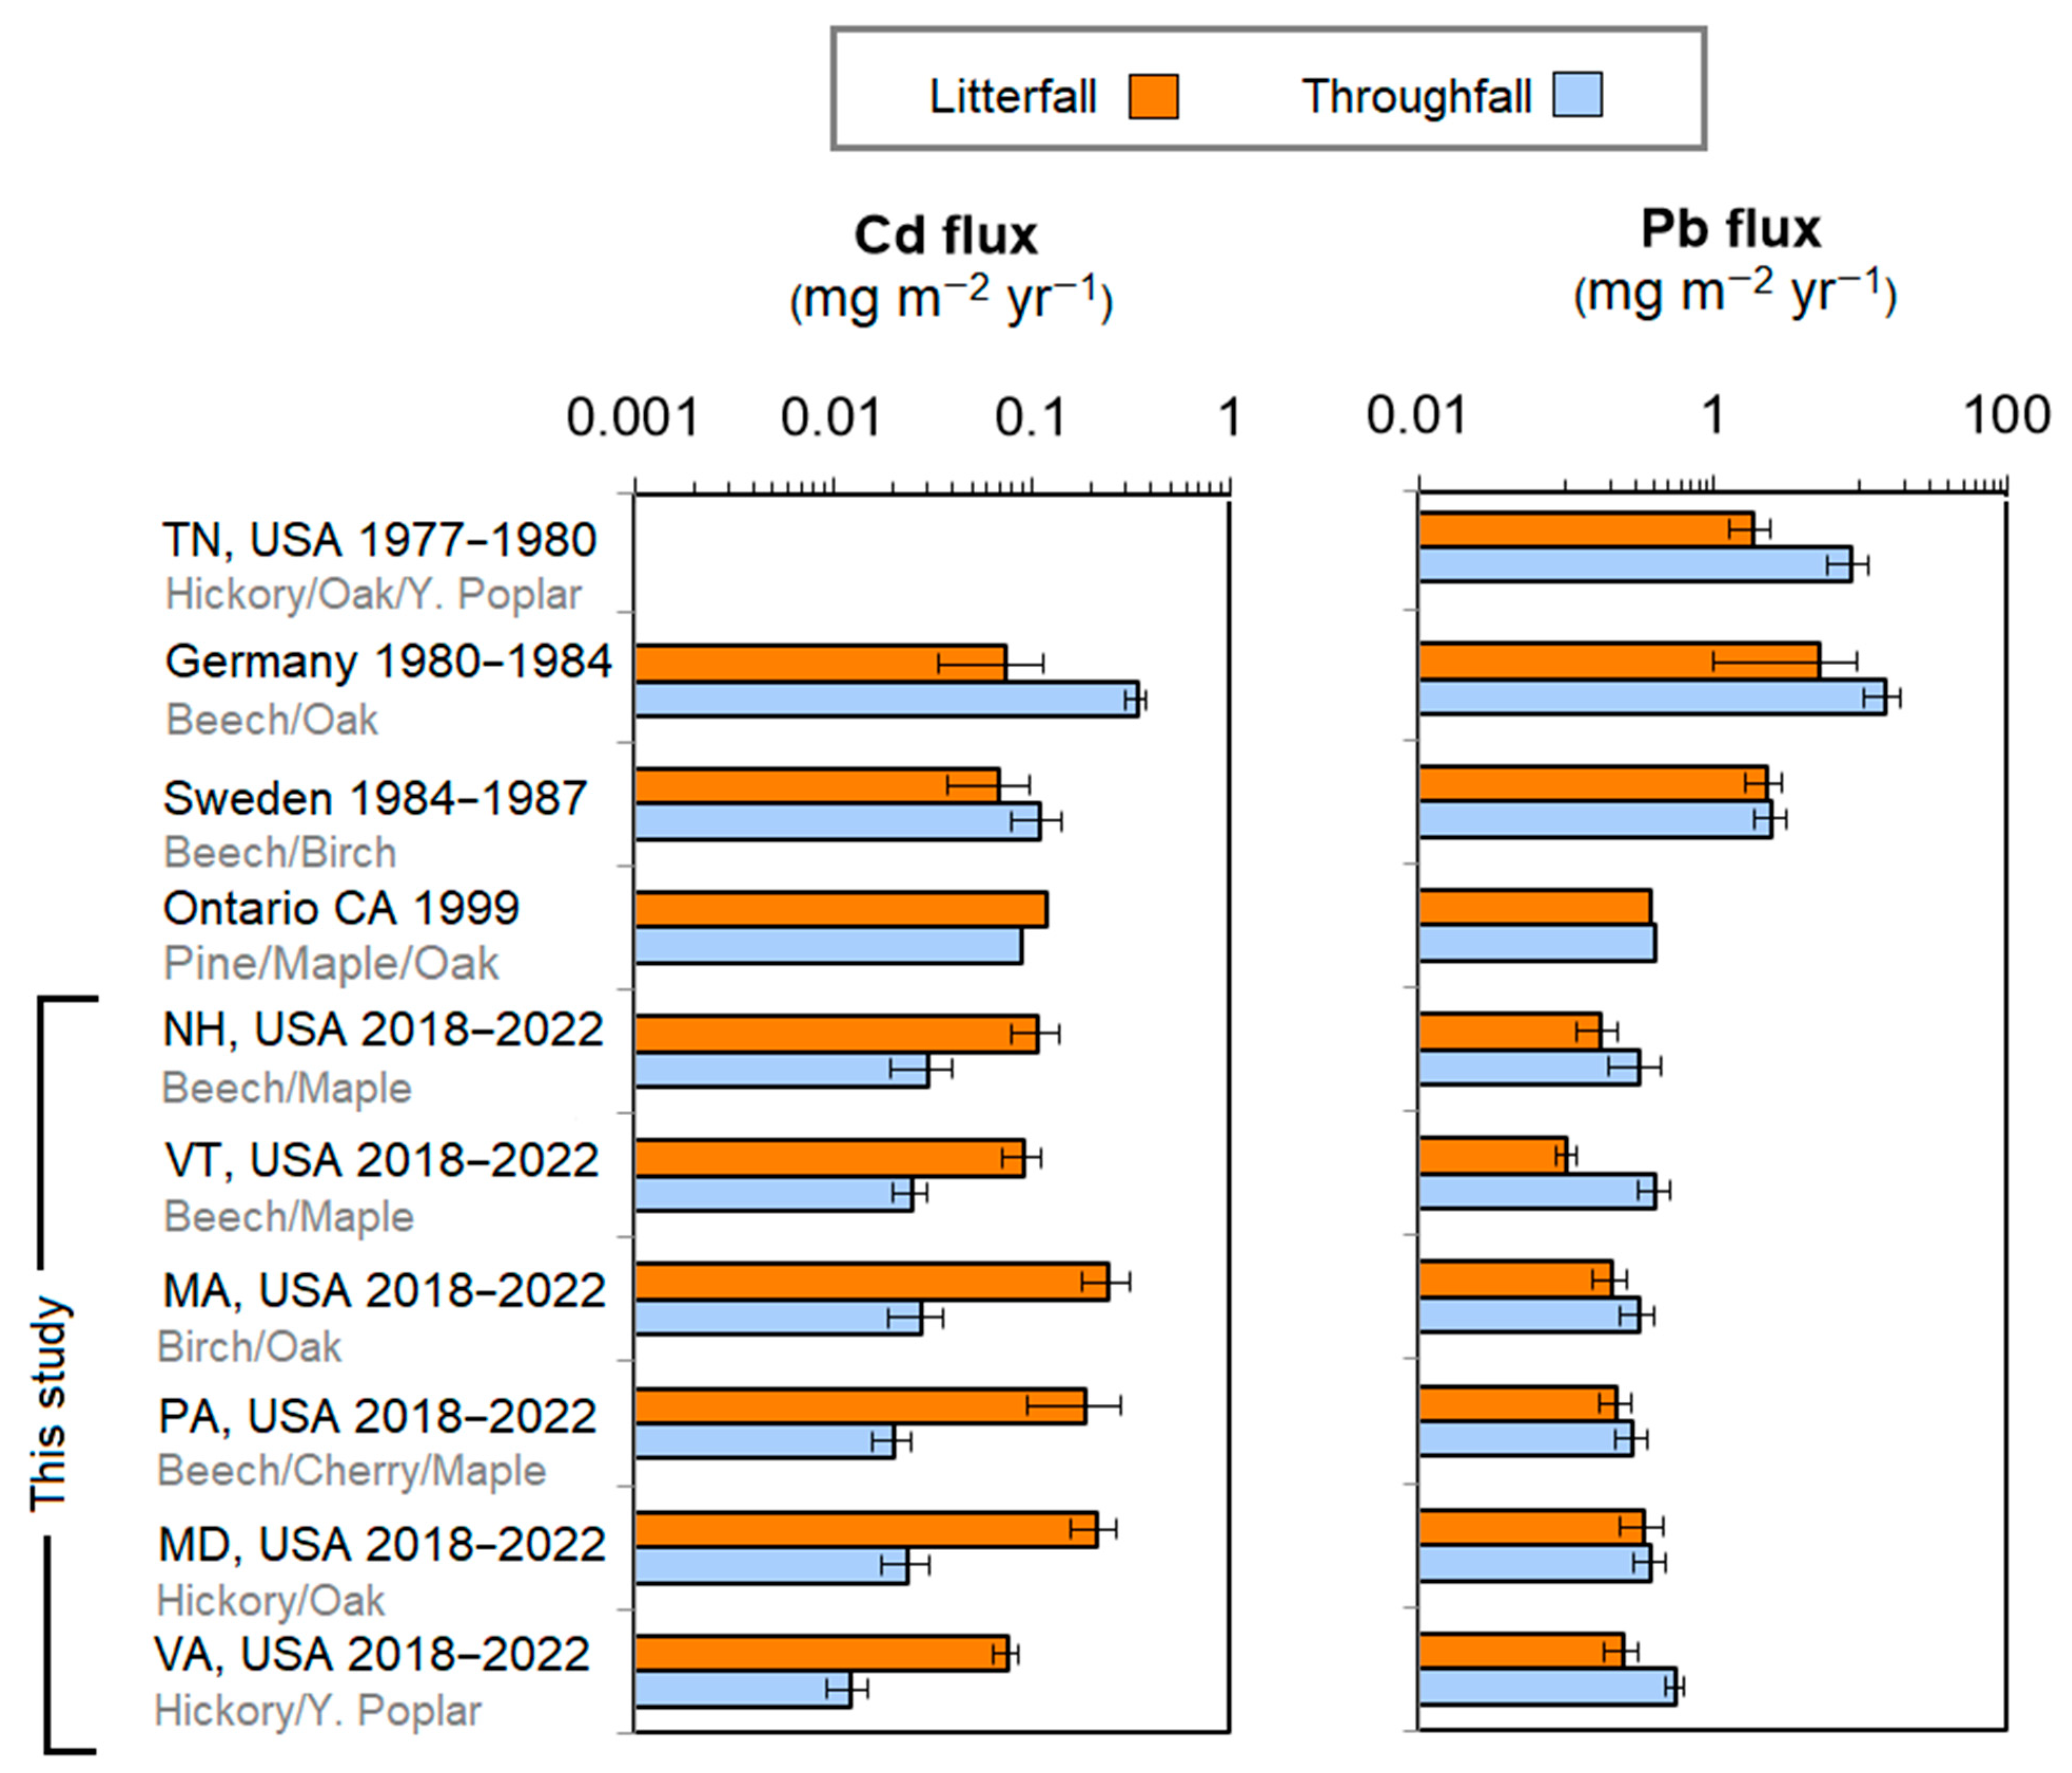
The main premise of this study sought to quantify reductions in Cu, Zn, Cd, and Pb atmospheric inputs to rural forests stemming from decreased metal emissions and deposition rates due to successful implementation of environmental policies in the 1970s, 1980s, and 1990s. Figure 5 and Figure 6 show declining Cu, Cd, and Pb throughfall rates from peak emissions in the 1970s, and early 1980s. Multiple sites in this study have at or close to an order of magnitude lower throughfall fluxes compared with measurements by Van Hook et al. (1977) [48], Van Hook et al. (1980) [49] in the late 1970s and Bergkvist et al. (1988) [16] in the early 1980s. Comparing our average throughfall flux across the six sites with data from Tennessee in the 1970s [48,49], our sites had throughfall fluxes 89% lower for Cu, 93% lower for Cd, and 97% lower for Pb.
Moreover, there has been a relative shift from throughfall to litterfall as the dominant input pathway into forests. Throughfall was the dominant input of Cu and Cd to forests in the 1970s and 1980s but has shifted to litterfall being the dominant input into the 2000s. Throughfall inputs of Cu and Cd are significantly lower than their litterfall inputs. Similarly, throughfall of Pb was significantly greater than litterfall inputs in the 1970s and early 1980s but has shifted to being proportionally similar during the years measured in this study. Contrary to the other metals, the throughfall of Zn has remained the same or increased from historical measurements in the 1970s and early 1980s.
Litterfall fluxes for Cd, Cu, and Zn at our six sites were comparable for higher than observations during the 1970s and 1980s. There are two possible mechanisms to explain why litterfall concentrations for Cd, Cu, and Zn may not have decreased as expected from changes in deposition patterns recorded in sediment cores [36,51,52]. The first potential mechanism (i.e., top-down) is that tree foliage is an effective scavenger of atmospheric pollutants. Tree foliage may be increasing across the region with secondary forest maturation following recovery from mass deforestation in the 1890s, including all six sites in this study. The increasing overall foliar surface area for interception via stomatal uptake [52] or sorption to waxy cuticle outer layer [53], leading to greater litterfall fluxes than in historical assessments. However, this mechanism is unlikely to maintain constant litterfall fluxes of metals, as it should have also resulted in higher litterfall fluxes in the 1980s, when atmospheric metal concentrations were also higher. The second possible mechanism (i.e., bottom-up) involves greater uptake and transfer of the pollutant metals from the soil to the leaves and is occurring now than in the past. This mechanism implies that throughfall in 2018 to 2022 does not drive litterfall of pollutant metals. Unfortunately, quantifying the uptake rate and source of the Cu, Zn, Cd, and Pb is difficult due to variable root uptake rates and internal translocation and storage of metals within the trees via vascular tissues (i.e., phloem) from both aboveground and belowground tissues, which could pose as a further direction for future studies.

4. Conclusions

The central goal of this study was to evaluate the current state of throughfall and litterfall Cu, Zn, Cd, and Pb fluxes in the temperate forests along the Appalachian Mountain range in the eastern United States. Our throughfall data show substantial decreases in Cu, Cd, and Pb, highlighting the successful implementation of metal pollution control policies and technology across the United States. Lead appears to be largely controlled by historical inputs from tetraethyllead additives to gasoline, as Pb throughfall and litterfall fluxes in our study are over an order of magnitude lower than during the 1970s and 1980s. Decreases in litterfall Pb concentrations and flux rates indicate aboveground recycling via tree uptake and litterfall is limited (Figure 7). Zinc throughfall fluxes are comparable or higher than historical rates, implying the continuous Zn inputs to temperate forests along the Appalachian Mountains due to increasing atmospheric emissions and deposition such as wet or dry deposition. Moreover, Zn litterfall fluxes have remained similar to historical measurements despite decreasing Zn litterfall concentrations. This finding suggests that modern Zn sources that have not been targeted by policies such as automobiles and fuel combustion remain important for throughfall, and soil-tree-litter recycling is maintaining elevated Zn cycling in the studied forests (Figure 7).
Throughfall fluxes of Cu and Cd have substantially decreased compared to measurements during the 1970s and 1980s, suggesting controls on industrial emissions have dramatically reduced Cu and Cd emissions. However, litterfall fluxes of Cu and Cd remain at similar or higher levels than observed in past studies. The most likely mechanism is uptake of Cu and Cd from the soil and translocation to foliage, stored within the aboveground and belowground woody tissues, and recycled back to the soil via litterfall (Figure 7). These metals may be taken up by trees due to Ca or Mg scavenging, either from nutrient losses by acid rain or during forest maturation competition for inorganic nutrients. Litterfall concentrations of Cu and Cd were shown to be generally comparable across species, except for the elevated concentrations of Cd and Zn in birch, a well-known genera of high metal uptake. The comparable Cu and Cd litterfall fluxes suggest that the legacy of metal pollution will persist for many decades into the future. The impacts of these uptake and retention of pollutant metals in forest ecosystems are unclear, with potential diminished growth, invertebrate communities, or shifts in nutrient acquisition efficiency. Continued evaluation of pollutant metals is needed to evaluate the long-term efficacy of policies and the potential need for mitigation in rural areas far from emission sources. The impacts on forest ecosystem health and the duration of pollution legacy and recovery from the industrial emissions of the 20th century remain a need for future biogeochemists.

Author Contributions

Conceptualization J.B.R. and A.M.D.; methodology J.B.R. and A.M.D.; writing—original draft preparation, J.B.R. and M.T.T.; writing—review and editing, J.B.R. and M.T.T.; visualization, J.B.R.; funding acquisition, J.B.R. and A.M.D. All authors have read and agreed to the published version of the manuscript.

Funding

This research was funded by the U.S. National Science Foundation Award Number: 2052046 to P.I. Justin Richardson and Co-I Annise M. Dobson.

Data Availability Statement

Data can be downloaded Litterfall and Throughfall Data for Six Sites along Appalachian Mountain Range, Eastern United States; University of Virginia Dataverse: University of Virginia, 2024. https://doi.org/10.18130/V3/I00LKH.

Acknowledgments

We thank Ashley Keiser, William Caston, Ainsley McStay, and several additional UMass Amherst students for helping sort and identify tree litter.

Conflicts of Interest

The authors declare no conflicts of interest.

References

  1. Kuklinska, K.; Wolska, L.; Namiesnik, J. Air quality policy in the US and the EU—A review. Atmos. Pollut. Res. 2015, 6, 129–137. [Google Scholar] [CrossRef]
  2. Schmalensee, R.; Stavins, R.N. Policy Evolution under the Clean Air Act. J. Econ. Perspect. 2019, 33, 27–50. [Google Scholar] [CrossRef]
  3. Johnson, C.E.; Siccama, T.G.; Driscoll, C.T.; Likens, G.E.; Moeller, R.E. Changes in lead biogeochemistry in response to decreasing atmospheric inputs. Ecol. Appl. 1995, 5, 813–822. [Google Scholar] [CrossRef]
  4. Buckley, S.M.; Mitchell, M.J. Improvements in urban air quality: Case studies from New York State, USA. Water Air Soil Pollut. 2011, 214, 93–106. [Google Scholar] [CrossRef]
  5. Richardson, J.B.; Donaldson, E.C.; Kaste, J.M.; Friedland, A.J. Forest floor lead, copper and zinc concentrations across the northeastern United States: Synthesizing spatial and temporal responses. Sci. Total Environ. 2015, 505, 851–859. [Google Scholar] [CrossRef] [PubMed]
  6. Kabata-Pendias, A.; Mukherjee, A.B. Humans; Springer: Berlin/Heidelberg, Germany, 2007; pp. 67–83. [Google Scholar]
  7. Srivastava, V.; Sarkar, A.; Singh, S.; Singh, P.; De Araujo, A.S.; Singh, R.P. Agroecological responses of heavy metal pollution with special emphasis on soil health and plant performances. Front. Environ. Sci. 2017, 5, 64. [Google Scholar] [CrossRef]
  8. Banerjee, B.P.; Raval, S.; Zhai, H.; Cullen, P.J. Health condition assessment for vegetation exposed to heavy metal pollution through airborne hyperspectral data. Environ. Monit. Assess. 2017, 189, 1–11. [Google Scholar] [CrossRef]
  9. Lynes, M.A.; Kang, Y.J.; Sensi, S.L.; Perdrizet, G.A.; Hightower, L.E. Heavy metal ions in normal physiology, toxic stress, and cytoprotection. Ann. N. Y. Acad. Sci. 2007, 1113, 159–172. [Google Scholar] [CrossRef]
  10. Genchi, G.; Sinicropi, M.S.; Lauria, G.; Carocci, A.; Catalano, A. The effects of cadmium toxicity. Int. J. Environ. Res. Public Health 2020, 17, 3782. [Google Scholar] [CrossRef]
  11. Flora, G.; Gupta, D.; Tiwari, A. Toxicity of lead: A review with recent updates. Interdiscip. Toxicol. 2012, 5, 47–58. [Google Scholar] [CrossRef]
  12. Kraepiel, A.M.L.; Dere, A.L.; Herndon, E.M.; Brantley, S.L. Natural and anthropogenic processes contributing to metal enrichment in surface soils of central Pennsylvania. Biogeochemistry 2015, 123, 265–283. [Google Scholar] [CrossRef]
  13. Merchant, S.S. The elements of plant micronutrients. Plant Physiol. 2010, 154, 512–515. [Google Scholar] [CrossRef] [PubMed]
  14. Rehman, M.; Liu, L.; Wang, Q.; Saleem, M.H.; Bashir, S.; Ullah, S.; Peng, D. Copper environmental toxicology, recent advances, and future outlook: A review. Environ. Sci. Pollut. Res. 2019, 26, 18003–18016. [Google Scholar] [CrossRef] [PubMed]
  15. Noulas, C.; Tziouvalekas, M.; Karyotis, T. Zinc in soils, water and food crops. J. Trace Elem. Med. Biol. 2018, 49, 252–260. [Google Scholar] [CrossRef]
  16. Bergkvist, B.; Folkeson, L.; Berggren, D. Fluxes of Cu, Zn, Pb, Cd, Cr, and Ni in temperate forest ecosystems: A literature review. Water Air Soil Pollut. 1989, 47, 217–286. [Google Scholar] [CrossRef]
  17. Duan, Q.; Lee, J.; Liu, Y.; Chen, H.; Hu, H. Distribution of heavy metal pollution in surface soil samples in China: A graphical review. Bull. Environ. Contam. Toxicol. 2016, 97, 303–309. [Google Scholar] [CrossRef]
  18. Beavington, F.; Cawse, P.A.; Wakenshaw, A. Comparative studies of atmospheric trace elements: Improvements in air quality near a copper smelter. Sci. Total Environ. 2004, 332, 39–49. [Google Scholar] [CrossRef]
  19. Newhook, R.; Hirtle, H.; Byrne, K.; Meek, M.E. Releases from copper smelters and refineries and zinc plants in Canada: Human health exposure and risk characterization. Sci. Total Environ. 2003, 301, 23–41. [Google Scholar] [CrossRef]
  20. Camarero, L.; Bacardit, M.; de Diego, A.; Arana, G. Decadal trends in atmospheric deposition in a high elevation station: Effects of climate and pollution on the long-range flux of metals and trace elements over SW Europe. Atmos. Environ. 2017, 167, 542–552. [Google Scholar] [CrossRef]
  21. US Environmental Protection Agency. Aquatic Life Ambient Freshwater Quality Criteria—Copper; USEPA: Washington, DC, USA, 2007; EPA-822-R-07-001.
  22. Kumar, V.; Pandita, S.; Sidhu, G.P.S.; Sharma, A.; Khanna, K.; Kaur, P.; Bali, A.S.; Setia, R. Copper bioavailability, uptake, toxicity and tolerance in plants: A comprehensive review. Chemosphere 2021, 262, 127810. [Google Scholar] [CrossRef]
  23. Lukkari, T.; Aatsinki, M.; Väisänen, A.; Haimi, J. Toxicity of copper and zinc assessed with three different earthworm tests. Appl. Soil Ecol. 2005, 30, 133–146. [Google Scholar] [CrossRef]
  24. Malhotra, N.; Ger, T.R.; Uapipatanakul, B.; Huang, J.C.; Chen, K.H.C.; Hsiao, C.D. Review of copper and copper nanoparticle toxicity in fish. Nanomaterials 2020, 10, 1126. [Google Scholar] [CrossRef] [PubMed]
  25. Roman, Y.E.; De Schamphelaere, K.A.; Nguyen, L.T.; Janssen, C.R. Chronic toxicity of copper to five benthic invertebrates in laboratory-formulated sediment: Sensitivity comparison and preliminary risk assessment. Sci. Total Environ. 2007, 387, 128–140. [Google Scholar] [CrossRef] [PubMed]
  26. Galloway, J.N.; Likens, G.E.; Keene, W.C.; Miller, J.M. The composition of precipitation in remote areas of the world. J. Geophys. Res. Ocean. 1982, 87, 8771–8786. [Google Scholar] [CrossRef]
  27. Cheng, I.; Al Mamun, A.; Zhang, L. A synthesis review on atmospheric wet deposition of particulate elements: Scavenging ratios, solubility, and flux measurements. Environ. Rev. 2021, 29, 340–353. [Google Scholar] [CrossRef]
  28. Zang, F.; Zhao, C. Atmospheric deposition inputs more trace elements than litterfall in primitive forest soils. Catena 2024, 244, 108262. [Google Scholar] [CrossRef]
  29. Richardson, J.; Dobson, A. Litterfall and Throughfall Data for Six Sites along Appalachian Mountain Range, Eastern United States; University of Virginia Dataverse: University of Virginia: Charlottesville, VA, USA, 2024. [Google Scholar] [CrossRef]
  30. Gandois, L.; Nicolas, M.; Vanderheijden, G.; Probst, A. The importance of biomass net uptake for a trace metal budget in a forest stand in north-eastern France. Sci. Total Environ. 2010, 408, 5870–5877. [Google Scholar] [CrossRef]
  31. Zhang, S.; Yu, J.; Pan, T.; Gao, X.; Qiu, Z.; Hou, L. Difference between rainfall and throughfall chemistry for different forest stands in the Qinling Mountains, China. Hydrol. Res. 2021, 52, 523–535. [Google Scholar] [CrossRef]
  32. Sweet, C.W.; Weiss, A.; Vermette, S.J. Atmospheric deposition of trace metals at three sites near the Great Lakes. Water Air Soil Pollut. 1998, 103, 423–439. [Google Scholar] [CrossRef]
  33. Voldrichova, P.; Chrastny, V.; Sipkova, A.; Farkas, J.; Novak, M.; Stepanova, M.; Krachler, M.; Veselovsky, F.; Blaha, V.; Prechova, E.; et al. Zinc isotope systematics in snow and ice accretions in Central European mountains. Chem. Geol. 2014, 388, 130–141. [Google Scholar] [CrossRef]
  34. Landre, A.L.; Watmough, S.A.; Dillon, P.J. Metal pools, fluxes, and budgets in an acidified forested catchment on the Precambrian Shield, Central Ontario, Canada. Water Air Soil Pollut. 2010, 209, 209–228. [Google Scholar] [CrossRef]
  35. Pan, Y.P.; Wang, Y.S. Atmospheric wet and dry deposition of trace elements at ten sites in Northern China. Atmos Chem. Phys. 2014, 14, 20647–20676. [Google Scholar]
  36. Thapalia, A.; Borrok, D.M.; Van Metre, P.C.; Wilson, J. Zinc isotopic signatures in eight lake sediment cores from across the United States. Environ. Sci. Technol. 2015, 49, 132–140. [Google Scholar] [CrossRef] [PubMed]
  37. Rea, A.W.; Lindberg, S.E.; Keeler, G.J. Dry deposition and foliar leaching of mercury and selected trace elements in deciduous forest throughfall. Atmos. Environ. 2001, 35, 3453–3462. [Google Scholar] [CrossRef]
  38. Richardson, J.B.; Friedland, A.J. Influence of coniferous and deciduous vegetation on major and trace metals in forests of northern New England, USA. Plant Soil 2016, 402, 363–378. [Google Scholar] [CrossRef]
  39. Avila, A.; Rodrigo, A. Trace metal fluxes in bulk deposition, throughfall and stemflow at two evergreen oak stands in NE Spain subject to different exposure to the industrial environment. Atmos. Environ. 2004, 38, 171–180. [Google Scholar] [CrossRef]
  40. McGee, C.J.; Fernandez, I.J.; Norton, S.A.; Stubbs, C.S. Cd, Ni, Pb, and Zn concentrations in forest vegetation and soils in Maine. Water Air Soil Pollut. 2007, 180, 141–153. [Google Scholar] [CrossRef]
  41. Nordén, U. Leaf litterfall concentrations and fluxes of elements in deciduous tree species. Scand. J. For. Res. 1994, 9, 9–16. [Google Scholar] [CrossRef]
  42. Smith, W.H.; Siccama, T.G. The Hubbard Brook Ecosystem Study: Biogeochemistry of Lead in the Northern Hardwood Forest; American Society of Agronomy, Crop Science Society of America, and Soil Science Society of America: Madison, WI, USA, 1981; Volume 10, pp. 323–333. [Google Scholar]
  43. Gosz, J.R.; Likens, G.E.; Bormann, F.H. Nutrient release from decomposing leaf and branch litter in the Hubbard Brook Forest, New Hampshire. Ecol. Monogr. 1973, 43, 173–191. [Google Scholar] [CrossRef]
  44. Schebek, L.; Lieser, K.H.; Höllwarth, M. Birch (Betula pendula) as a bioindicator for heavy metal pollution. Angew. Bot. 1984, 58, 475–482. [Google Scholar]
  45. Denny, H.J.; Wilkins, D.A. Zinc tolerance in Betula spp. I. Effect of external concentration of zinc on growth and uptake. New Phytol. 1987, 106, 517–524. [Google Scholar] [CrossRef]
  46. Jonczak, J.; Jankiewicz, U.; Kondras, M.; Kruczkowska, B.; Oktaba, L.; Oktaba, J.; Olejniczak, I.; Pawłowicz, E.; Polláková, N.; Raab, T.; et al. The influence of birch trees (Betula spp.) on soil environment—A review. For. Ecol. Manag. 2020, 477, 118486. [Google Scholar] [CrossRef]
  47. NOAA. National Centers for Environmental Information, Monthly National Climate Report for Annual 2022. Available online: https://www.ncei.noaa.gov/access/monitoring/monthly-report/national/202213 (accessed on 18 July 2024).
  48. Van Hook, R.; Harris, W.F.; Henderson, G.S. Cadmium, lead, and zinc distributions and cycling in a mixed deciduous forest. Ambio 1977, 6, 281–286. [Google Scholar]
  49. Van Hook, R.I.; Nielsen, M.G.; Shugart, H.H. Energy and Nitrogen Relation for a Macrosiphum Liriodendri (Homoptera: Aphididae) Population in an East Tennessee Liriodendron Tulipifera Stand. Ecology 1980, 61, 960–975. [Google Scholar] [CrossRef]
  50. Schultz, R. Vergleichende Betrachtung des Schwermetallhaushalts verschiedener Watdökosysteme Norddeutschlands. In Ber. d. Forschungszentr. Waldökosysteme/Waldsterben, Reihe A, Bd 32; Universität Göttingen: Göttingen, Germany, 1987; p. 217. [Google Scholar]
  51. Butler, M.J.; Yellen, B.C.; Oyewumi, O.; Ouimet, W.; Richardson, J.B. Accumulation and transport of nutrient and pollutant elements in riparian soils, sediments, and river waters across the Thames River Watershed, Connecticut, USA. Sci. Total Environ. 2023, 899, 165630. [Google Scholar] [CrossRef]
  52. Shahid, M.; Natasha; Dumat, C.; Niazi, N.K.; Xiong, T.T.; Farooq, A.B.U.; Khalid, S. Ecotoxicology of heavy metal (loid)-enriched particulate matter: Foliar accumulation by plants and health impacts. Rev. Environ. Contam. Toxicol. Vol. 2021, 253, 65–113. [Google Scholar]
  53. Wang, H.; Xing, Y.; Yang, J.; Xie, B.; Shi, H.; Wang, Y. The nature and size fractions of particulate matter deposited on leaves of four tree species in Beijing, China. Forests 2022, 13, 316. [Google Scholar] [CrossRef]
Figure 1. Location of the six study sites along the Appalachian Mountains in the eastern United States of America.
Pollutants 04 00032 g001
Figure 2. Seasonal throughfall fluxes for Cd, Cu, Pb, and Zn during the growing season and winter season, measured across the six sites, were calculated as the mean over the five years of collection. Using two-way ANOVA was applied with post hoc Tukey’s HSD test, (*) indicates a significant difference of p < 0.05 and (**) indicates a significant difference of p < 0.01 between mean growing season and winter season fluxes.
Pollutants 04 00032 g002
Figure 3. Litterfall concentrations for Cu, Zn, Cd, and Pb, across the dominant tree species averaged across the five years and six sites. Letters (a, b, c) represent significant differences among species using the post hoc Wilcoxon Rank Sum test. Species with the same letter indicate no significant differences, while species with different letters indicate a significant difference p < 0.05.
Pollutants 04 00032 g003
Figure 4. Litterfall fluxes for Cd, Cu, Pb, and Zn for the five years and across the six sites. Letters (a, b, c, d) represent significant differences among species using the post hoc Wilcoxon Rank Sum test. Site–Year fluxes with the same letter indicate no significant differences (or n.s.), while Site–Year fluxes with different letters indicate a significant difference of p < 0.05.
Pollutants 04 00032 g004
Figure 5. Copper and Zinc litterfall and throughfall flux comparisons from six sites in this study with historical data from the 1970s and 1980s. Data from Bergkvist et al. (1989) were gathered from Van Hook et al. (1977) [48], Van Hook et al. (1980) [49], Schultz (1987) [50], Bergkvist et al. (1988) [16], and Landre et al. (2010) [33].
Pollutants 04 00032 g005
Figure 6. Cadmium and lead litterfall and throughfall flux comparisons from six sites in this study with historical data from the 1970s and 1980s. Germany forest data are from Bergkvist et al. (1988) [16], TN, USA forest data are from Van Hook et al. (1977) [48] and Van Hook et al. (1980) [49]. Swedish forest data are from Schultz (1987) [50]. Ontario, CA data are from Landre et al. (2010) [33].
Pollutants 04 00032 g006
Figure 7. Conceptual diagram of our findings that Cd and Cu appear to be controlled most by litterfall, which recycles metals from the soil, while Pb and Zn are controlled by historical Pb throughfall fluxes and modern Zn throughfall fluxes.
Pollutants 04 00032 g007
Table 1. Site location, climate, and forest type information.
Site NameSite NumberElevation 30 yr MAT 130 yr MAP 1Forest Type
m a.s.l.°Cmm
Mt. Moosilauke, NHSite 157061180Beech/Maple
Mt. Ascutney State forest, VTSite 23806965Beech/Maple
MacLeish Field Station, MASite 32709 1205Birch/Oak
Tobyhanna State Forest, PASite 461081080Beech/Cherry/Maple
Green Ridge State Forest, MD Site 5420111066Hickory/Oak
Lesesne State Forest, VA Site 6380141092Hickory/Yellow Poplar
1 Data are 30-year averages from PRISM.
Table 2. Seasonal throughfall concentrations of Cd, Cu, Pb, and Zn during the growing season and winter for each of the six sites averaged over the five years of collection.
Site SeasonYearsCuZnCdPb
ng L−1µg L−1ng L−1ng L−1
Site 1Growing season2018–2022700 ± 19937 ± 851 ± 1830 ± 13
Site 2Growing season2018–2022213 ± 5011 ± 121 ± 645 ± 9
Site 3Growing season2018–2022761 ± 22031 ± 538 ± 831 ± 7
Site 4Growing season2018–2022458 ± 71157 ± 5135 ± 556 ± 8
Site 5Growing season2018–2022461 ± 1036 ± 129 ± 430 ± 5
Site 6Growing season2018–2022219 ± 2718 ± 715 ± 122 ± 1
Site 1Winter2018–2022264 ± 8048 ± 618 ± 339 ± 10
Site 2Winter2018–20221271 ± 32454 ± 623 ± 430 ± 5
Site 3Winter2018–2022338 ± 7411 ± 510 ± 332 ± 5
Site 4Winter2018–2022426 ± 120165 ± 6318 ± 139 ± 9
Site 5Winter2018–2022191 ± 2719 ± 721 ± 450 ± 10
Site 6Winter2018–2022342 ± 9287 ± 218 ± 170 ± 2
Disclaimer/Publisher’s Note: The statements, opinions and data contained in all publications are solely those of the individual author(s) and contributor(s) and not of MDPI and/or the editor(s). MDPI and/or the editor(s) disclaim responsibility for any injury to people or property resulting from any ideas, methods, instructions or products referred to in the content.