Article

Exposure to Air Pollution from Road Traffic and Incidence of Respiratory Diseases in the City of Meknes, Morocco

1
“Health & Environment” Competence Cluster, Faculty of Sciences, Moulay Ismail University of Meknes, Meknes 50000, Morocco
2
Louvain School of Management, Catholic University of Louvain la Neuve, 1348 Ottignies-Louvain-la-Neuve, Belgium
3
Environment & Health Unit, Faculty of Medicine, Katholieke Universiteit of Leuven, 3000 Leuven, Belgium
*
Author to whom correspondence should be addressed.
Pollutants 2022, 2(3), 306-327; https://doi.org/10.3390/pollutants2030020
Submission received: 2 May 2022 / Revised: 5 June 2022 / Accepted: 14 June 2022 / Published: 4 July 2022

Abstract

:
For monitoring spatio-temporal variations of nitrogen dioxide (NO2) content, passive diffusive samplers have been deployed in 14 near-road and residential sites for 14 days. In parallel with the winter campaign to measure the NO2 tracer, road traffic counting sessions were carried out on the city’s main roads. The coupling of the results of the measurement campaigns and the counting sessions under Arcgis 9.3 made it possible to determine the areas most affected by automobile pollution and to carry out a high spatial resolution mapping of the pollutant prospected. The results of this study show that atmospheric NO2 concentrations reach maximum values in the city center and decrease towards its periphery. The analysis of the epidemiological situation of the principal diseases related to air pollution in the city of Meknes during the study period (2010–2014) showed that among subjects aged five years and older, acute respiratory diseases occurred more in women than men. The most affected age group was between 15 and 49 years, while asthma attacks were noted mainly among women aged 50 years and older. Acute respiratory illness and asthma attacks were prevalent in the winter and fall. Among children under five years of age, the age group most affected by pneumonia was those under 11 months. Our integrative approach combined spatialized GIS-based health indicators of these diseases, the location of stationary and mobile sources of air pollution, and measured NO2 levels. This combination has made it possible to detect that residents in areas with heavy road traffic are likely to be more affected than those in areas near industrial activity. The habitat type also contributes significantly to the development and exacerbation of the pathologies studied, especially in the districts of the old Medina.

1. Introduction

The air pollution problem affects both well-developed and developing countries to varying degrees. According to the WHO, 9 out of 10 people breathe air of poor quality [1]. 5.5 million premature deaths worldwide are attributable to air pollution, which represents the fourth leading risk factor for death worldwide.
The deterioration of air quality has an impact on human health by increasing the incidence of respiratory and cardiovascular diseases [2,3,4], premature death [5], and cancer [6,7]. Respiratory diseases represent one of the major causes of morbidity and mortality [8]. One billion people suffer from chronic respiratory diseases, including 300 million with asthma and more than 210 million with chronic obstructive pulmonary disease [9]. As in developing countries, Morocco is experiencing a significant development of its industrial fabric, growing consumption of natural resources and energy, and intensification of means of transport. These factors exert pressure on the different compartments of the environment [10]. According to the latest estimates of the World Bank, the cost of environmental degradation for Morocco has been evaluated, for the year 2014, at nearly 32.5 billion Moroccan Dirhams, or 3.52% of its GDP [11]. Water pollution (1.26% of GDP) is the primary vector of environmental degradation, followed by air pollution (1.05% of GDP).
However, air pollution is the most burdensome in the urban context. According to a WHO study on urban air pollution, all the studied Moroccan cities exceed the recommended thresholds for suspended particles (PM10 and PM2.5), namely Casablanca, Marrakech, Tangier, Meknes, Fez, Sale, and Safi [12]. This finding has also been raised in different urban areas of the Kingdom by studies that have assessed the quality of urban air, focusing on various pollutants [13,14,15,16,17,18,19,20,21,22,23]. Thus, the eco-epidemiological studies Casa-Airpol [24] and Mohammadia-Airpol [25], have revealed the possible health impacts caused by this form of pollution.
The city of Meknes is among the Moroccan cities affected by air pollution. Studies have revealed air quality degradation due to particles [26,27], sulfur oxide, and ozone [28], which exceeds the standards. The main sources of this urban pollution are multiple: transportation, a dominant factor with a concentration of traffic in the center of the city [29] and a large fleet of cars [30]; industry, with units dispersed in the urban space and discharges of variable nature and untreated [29,31]; and agricultural production and livestock activities in urban and peri-urban areas [31]. Local studies have shown that the potential impacts of air pollution are multidimensional, ranging from human health [32] and urban flora [33] to the historical monuments of Meknes [34] classified as UNESCO World Heritage. Considering this situation, local environmental managers have launched a project to set up an air quality monitoring system. However, the planned system has certain limitations and constraints, such as the high cost of the measuring devices, which does not allow for the coverage of the entire urban agglomeration; and the quantitative and punctual aspect on which this system is based and which does not integrate the effects of pollution on human health and urban ecosystems.

Objectives and Research Hypothesis

This work aims to evaluate air pollution levels due to nitrogen dioxide in Meknes city and to study its sanitary impacts.
This objective is based on the scientific hypothesis that a multidimensional and interdisciplinary approach contributes to a better understanding of urban air pollution and its health impacts.

2. Materials and Methods

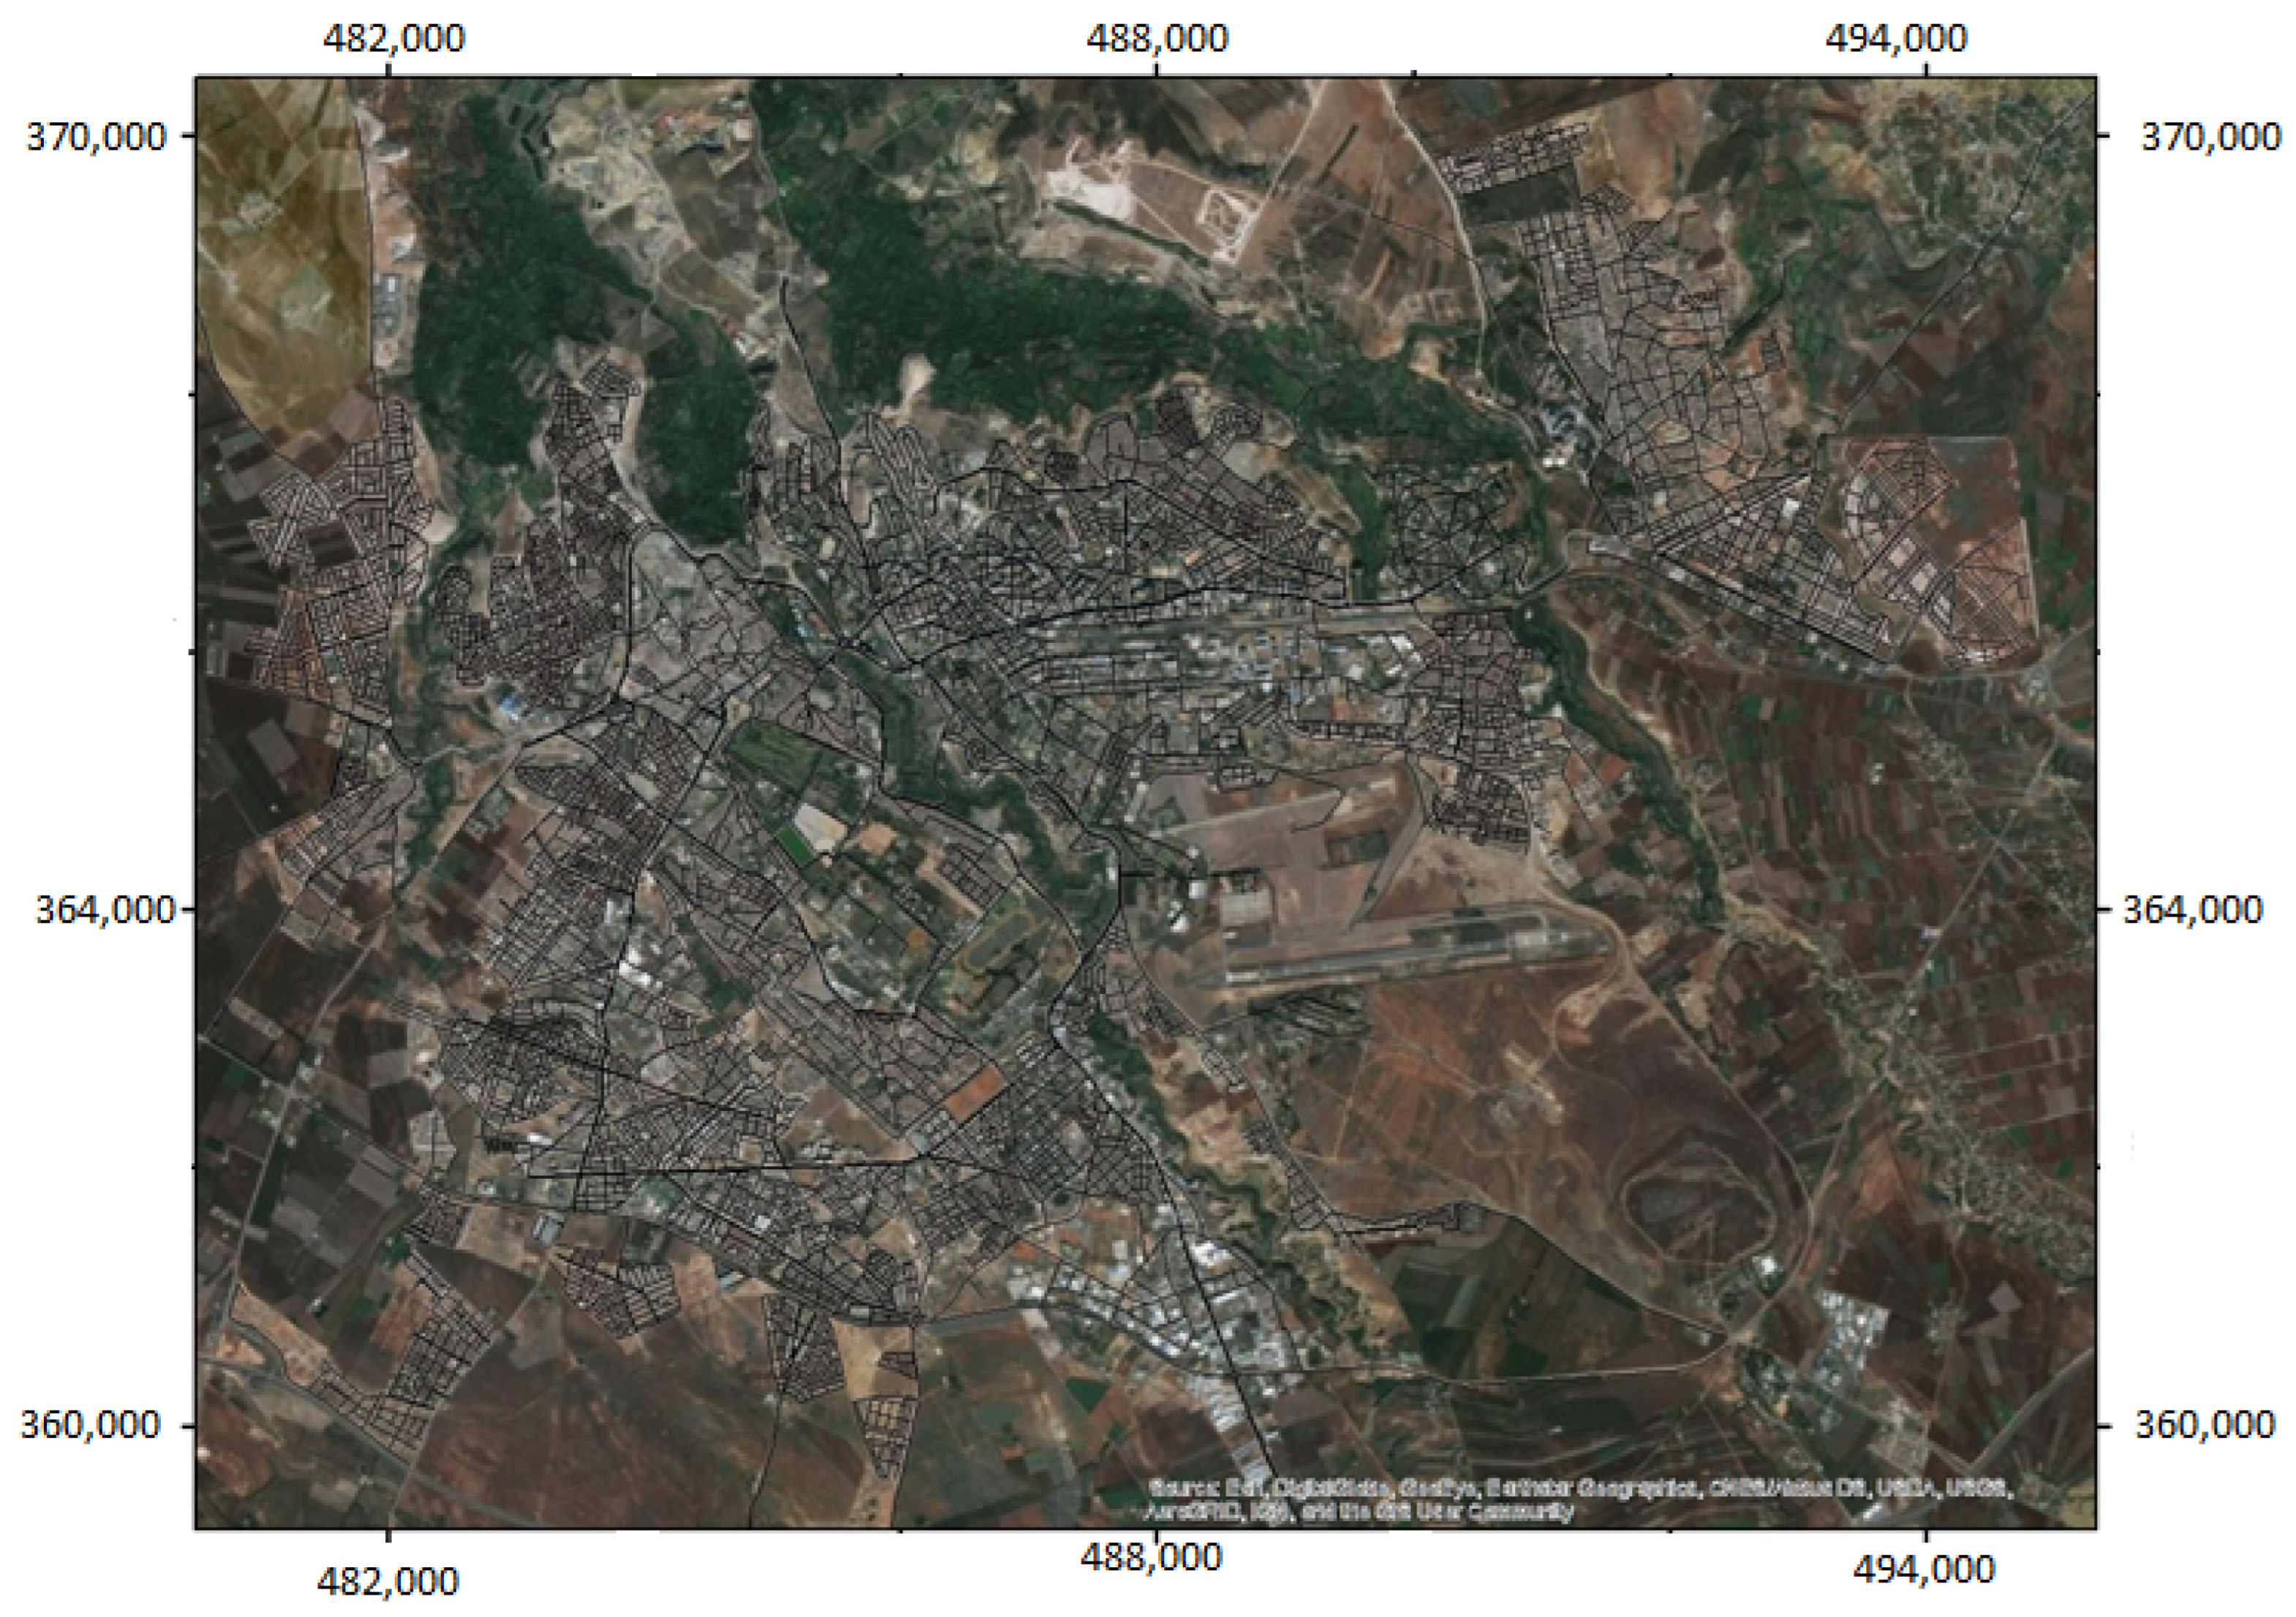
2.1. Presentation of the Study Area

The monitoring of spatio-temporal variations in NO2 levels and study of the respiratory pathologies registers were conducted in the city of Meknes (33°53° N, 5°33° W), located in the North-West of Morocco at an altitude of 564 m (Figure 1).
The city of Meknes is the second metropolis in the Fez-Meknes region. It is located in the northern part of Morocco, 140 km east of the capital Rabat and 60 km southwest of the capital of the region Fez.
Administratively, it includes four urban communes: Meknes, Al Machouar-Stinia, Ouislane and Toulal.
The city of Meknes is located on the Saïs plain, which covers an area of 4560 km2. This plain is located below the pre-rific hills to the north, as well as the central plateau and the causse of El Hajeb to the south. It also overlooks the hills of the lower pasys of Zemmour to the west and the pre-Rifa hills to the east [35].
The Saïs plateau, with its two metropolises Fez and Meknes, constitutes the regional sub-area of Fez-Meknes best endowed with natural and human resources, and the most privileged by its geographical position and the quality of its links with modern communication networks [35,36].
According to the recent general census of population and housing (RGPH) in 2014, the urban population of the prefecture of Meknes amounts to 684,484 inhabitants, or about 83% of the total population against 17% in rural areas. The share of the city of Meknes with these four urban communes is 92%, or 628,993 inhabitants [37].
The city of Meknes is under a Mediterranean climate with a semi-arid, temperate and humid climate in winter, and in summer, hot and dry in a semi-continental regime [38].
The remoteness of the coasts marks the thermal regime of Meknes, hence a significant average annual temperature range reaching 30.7 °C. The average maximum of the hottest month varies between 33° and 36°, while the average minimum of the coldest month varies between 3° and 7°.

2.2. Study of the Concentrations of the Pollutant Surveyed

2.2.1. Choice of the Pollutant Studied: Nitrogen Dioxide

The multidimensional study of urban air pollution in the city of Meknes focused on nitrogen dioxide (NO2) for several reasons: (i) first, NO2 is considered to be a good indicator of urban air pollution, especially since it generates by road traffic and is a precursor of secondary pollutants such as ozone and nitrate particles [39,40]. Second, it is a proxy for some pollutants, such as BTX (Benzene, Toluene, Xylene) [41,42], used in so many epidemiological studies as a marker of the cocktail of pollutants related to combustion [43]. (ii) The link between NO2 exposure and respiratory diseases is increasingly confirmed [43,44], which allows these diseases to be used as health indicators. (iii) It presents a great spatial heterogeneity compared to other pollutants, which allows considering contrasts with the variability of biological and health effects indicators.

2.2.2. Measurement Periods

The duration of the measurements is determined by the sensitivity of the equipment, concentration levels, nature of the sources, spatial resolution, and missions’ cost [45]. For the study period to be representative of a year, it must include at least one summer and one winter campaign [46]. Therefore, two 14-day measurement campaigns were carried out: summer from 14 July 2014 to 28 July 2014; winter from 25 December 2014 to 12 January 2015.

2.2.3. Sensors Used for Monitoring Nitrogen Dioxide Levels

Passive sensors guarantee a cost-effective method of measuring atmospheric gas concentrations in locations where active methods cannot be used due to high cost or infrastructure problems [47].
Since its first use in 1976, the passive sampling method has been adopted to measure nitrogen dioxide in the atmosphere. This technique is based on the principle of passive pollutant diffusion through a column of air to an adsorbent medium. The concentration is calculated from the amount of pollutant captured by the adsorbent, integrated over the sampling period.
Passive tubes are simple, lightweight, inexpensive, quiet, and require neither a power supply nor a number of trained personnel to maintain. They are suitable for simultaneous measurements at multiple sites and can be deployed in remote or risky environments since they are less likely to be damaged or stolen. These characteristics favor their uses in high-resolution spatial and temporal distribution studies of pollutants [48,49,50,51,52,53].
This study used traditional acrylic Palmes tubes (71.16 ± 0.20 mm height; 10.91 ± 0.15 mm diameter) for NO2 sampling. At the upper end of the tube, a double stainless steel grid impregnated with Triethanolamine (TEA) solution was attached and sealed with a colored polyethylene cap. At the other end, a removable cap of a different color is used to avoid losing the grids and is removed at the beginning of the sampling. The tubes are open to the air, the progression of nitrogen dioxide in the tube is carried out by molecular diffusion, in contact with the grid impregnated with TEA, and the NO2 is absorbed by chemical trapping. The diffusion rate is in accordance with FICK’s first law, as a function of the geometrical characteristics of the tube and the diffusion coefficient of NO2. The same removed cap is used to close the open end of the tube after exposure [54,55,56].
In order to protect the tubes from the weather and avoid possible effects of direct sunlight or excessive wind on the sample, the tubes were placed vertically in specially designed shelters installed at the height of 2.5 to 3 m from the ground. The caps of the tubes were removed and mounted vertically, with the opening facing downward to prevent the entry of raindrops and dust. For each site, the time and date of the beginning and end of each exposure period were accurately recorded.

2.2.4. Determination of Nitrogen Dioxide

Determining nitrogen dioxide trapped in the exposed tubes was performed by a colorimetric determination of nitrite ions followed by analysis according to NBN EN 16339 [57].

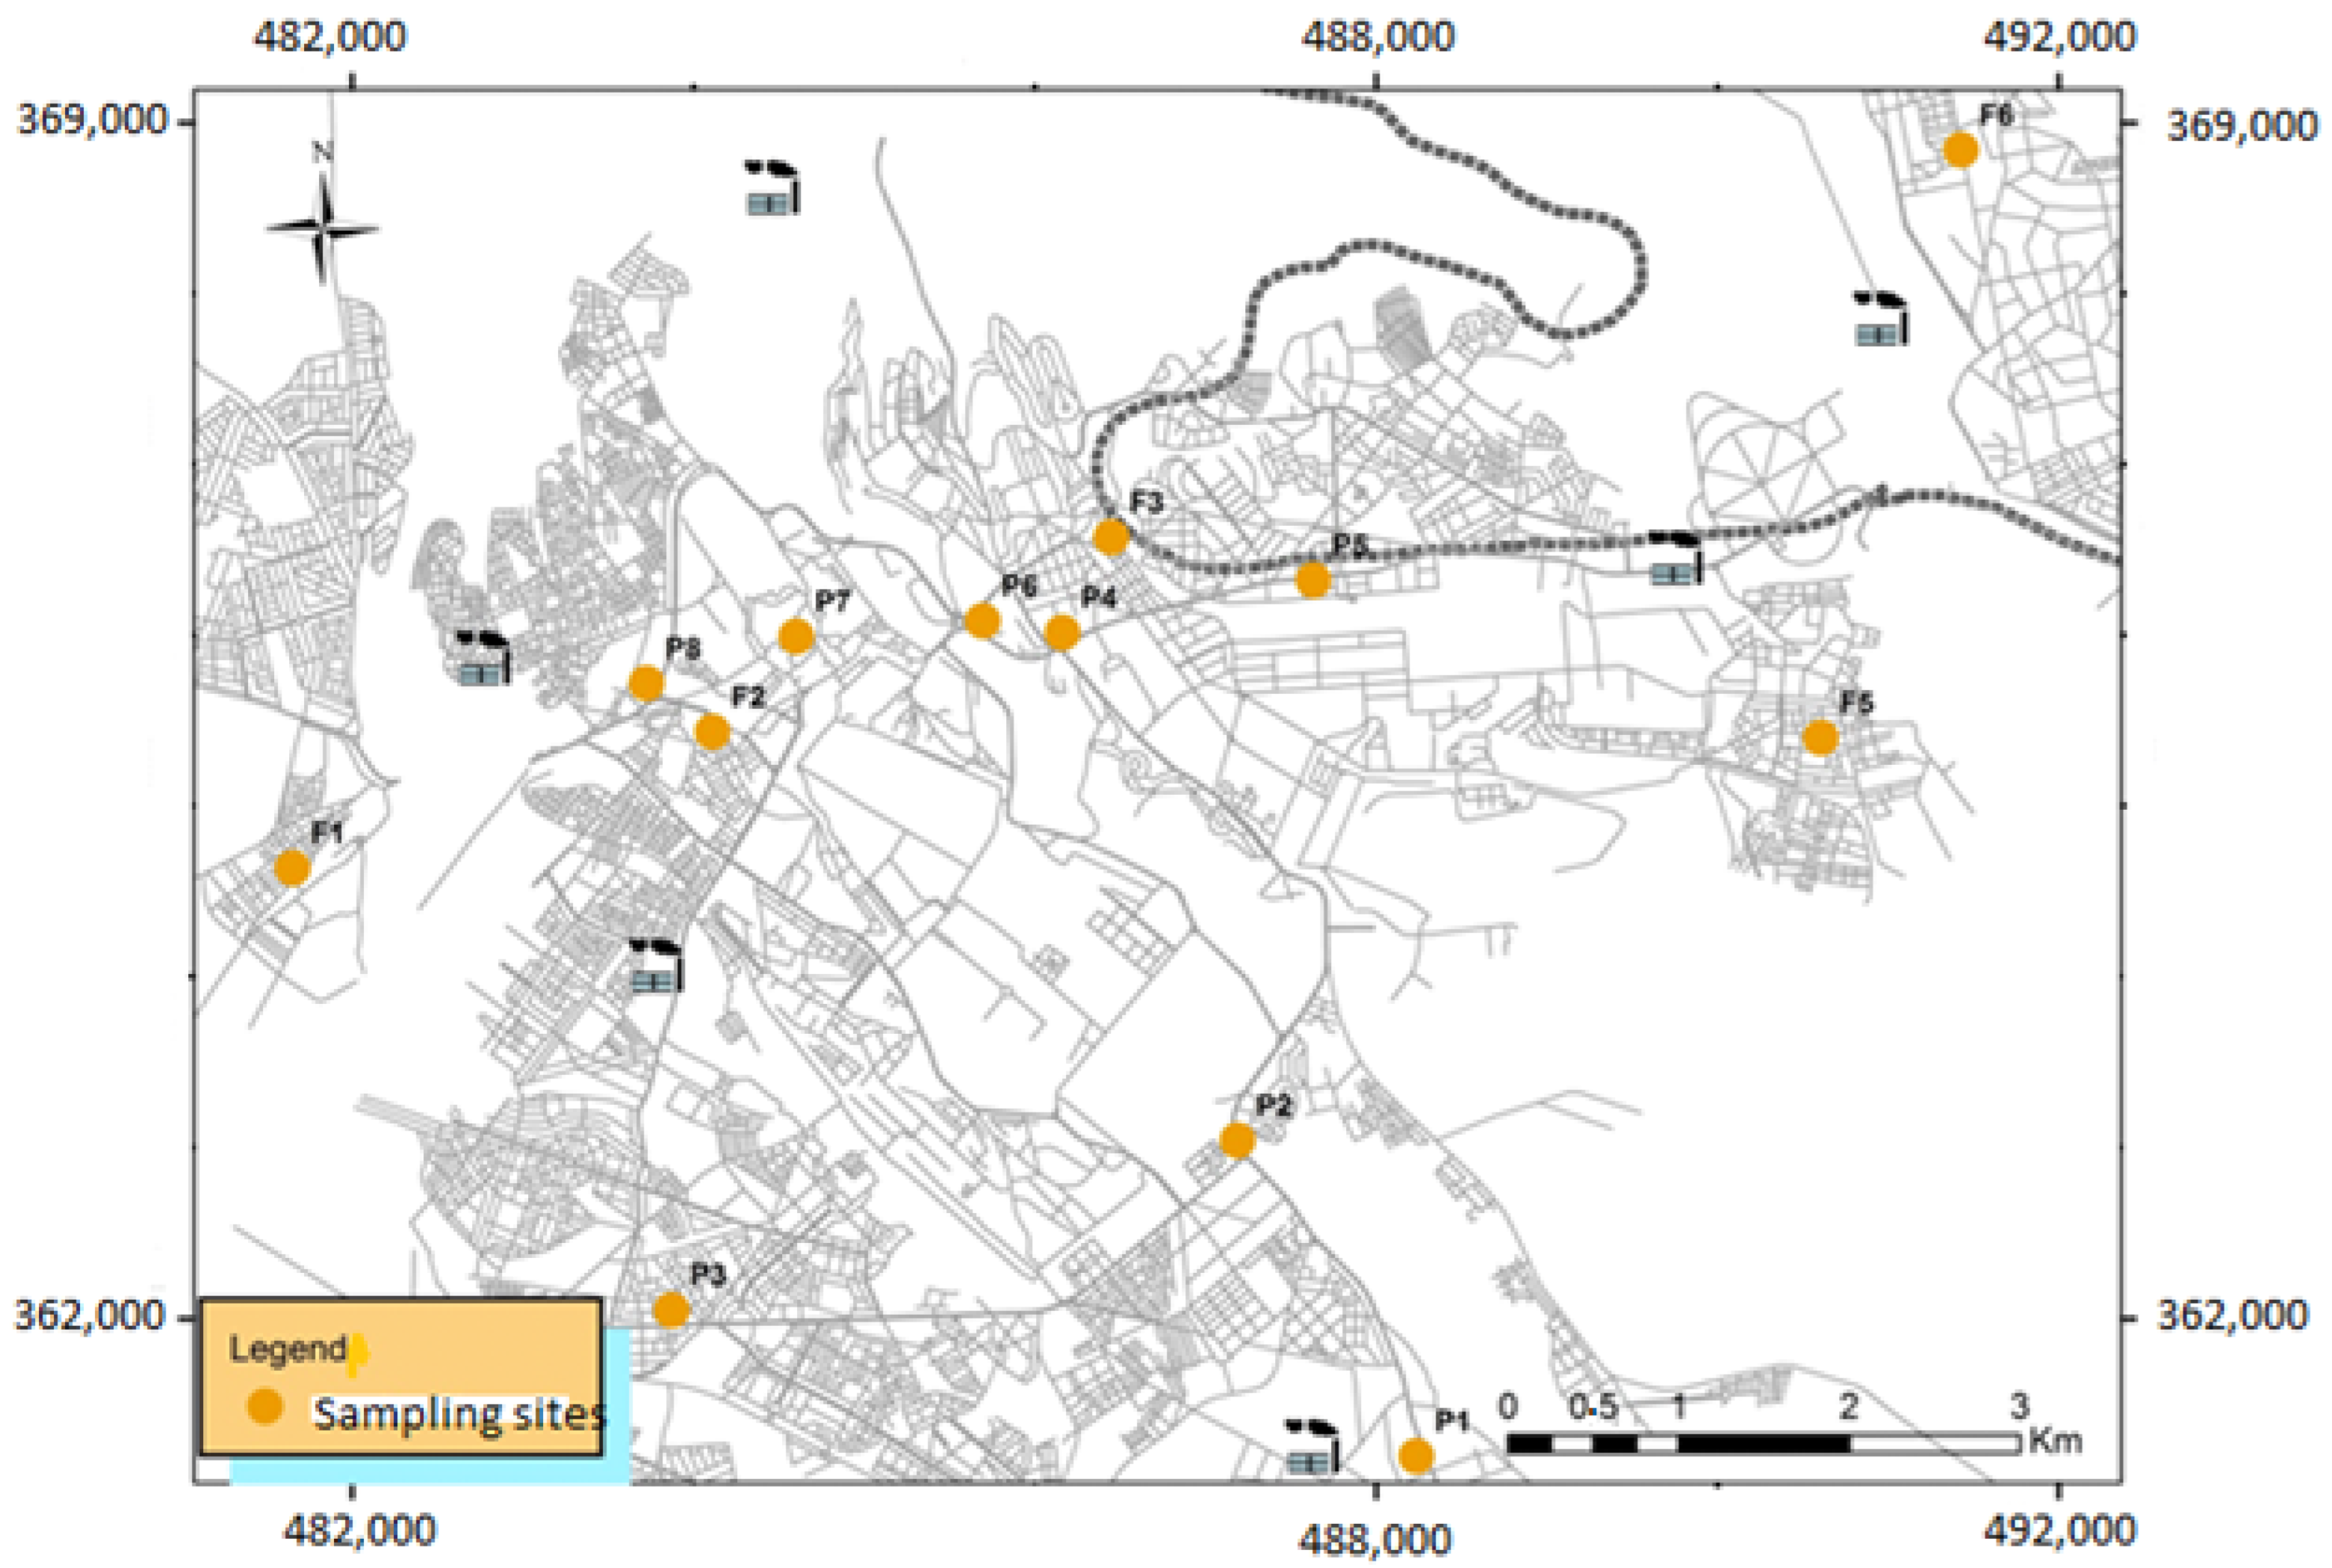
2.2.5. Geolocation of NO2 Sampling Sites

For the monitoring of NO2 levels, passive diffusion tubes of the Palmes type, were deployed at 14 sampling sites, divided into car proximity sites (P) and background sites (F) (Figure 2 and Table 1).

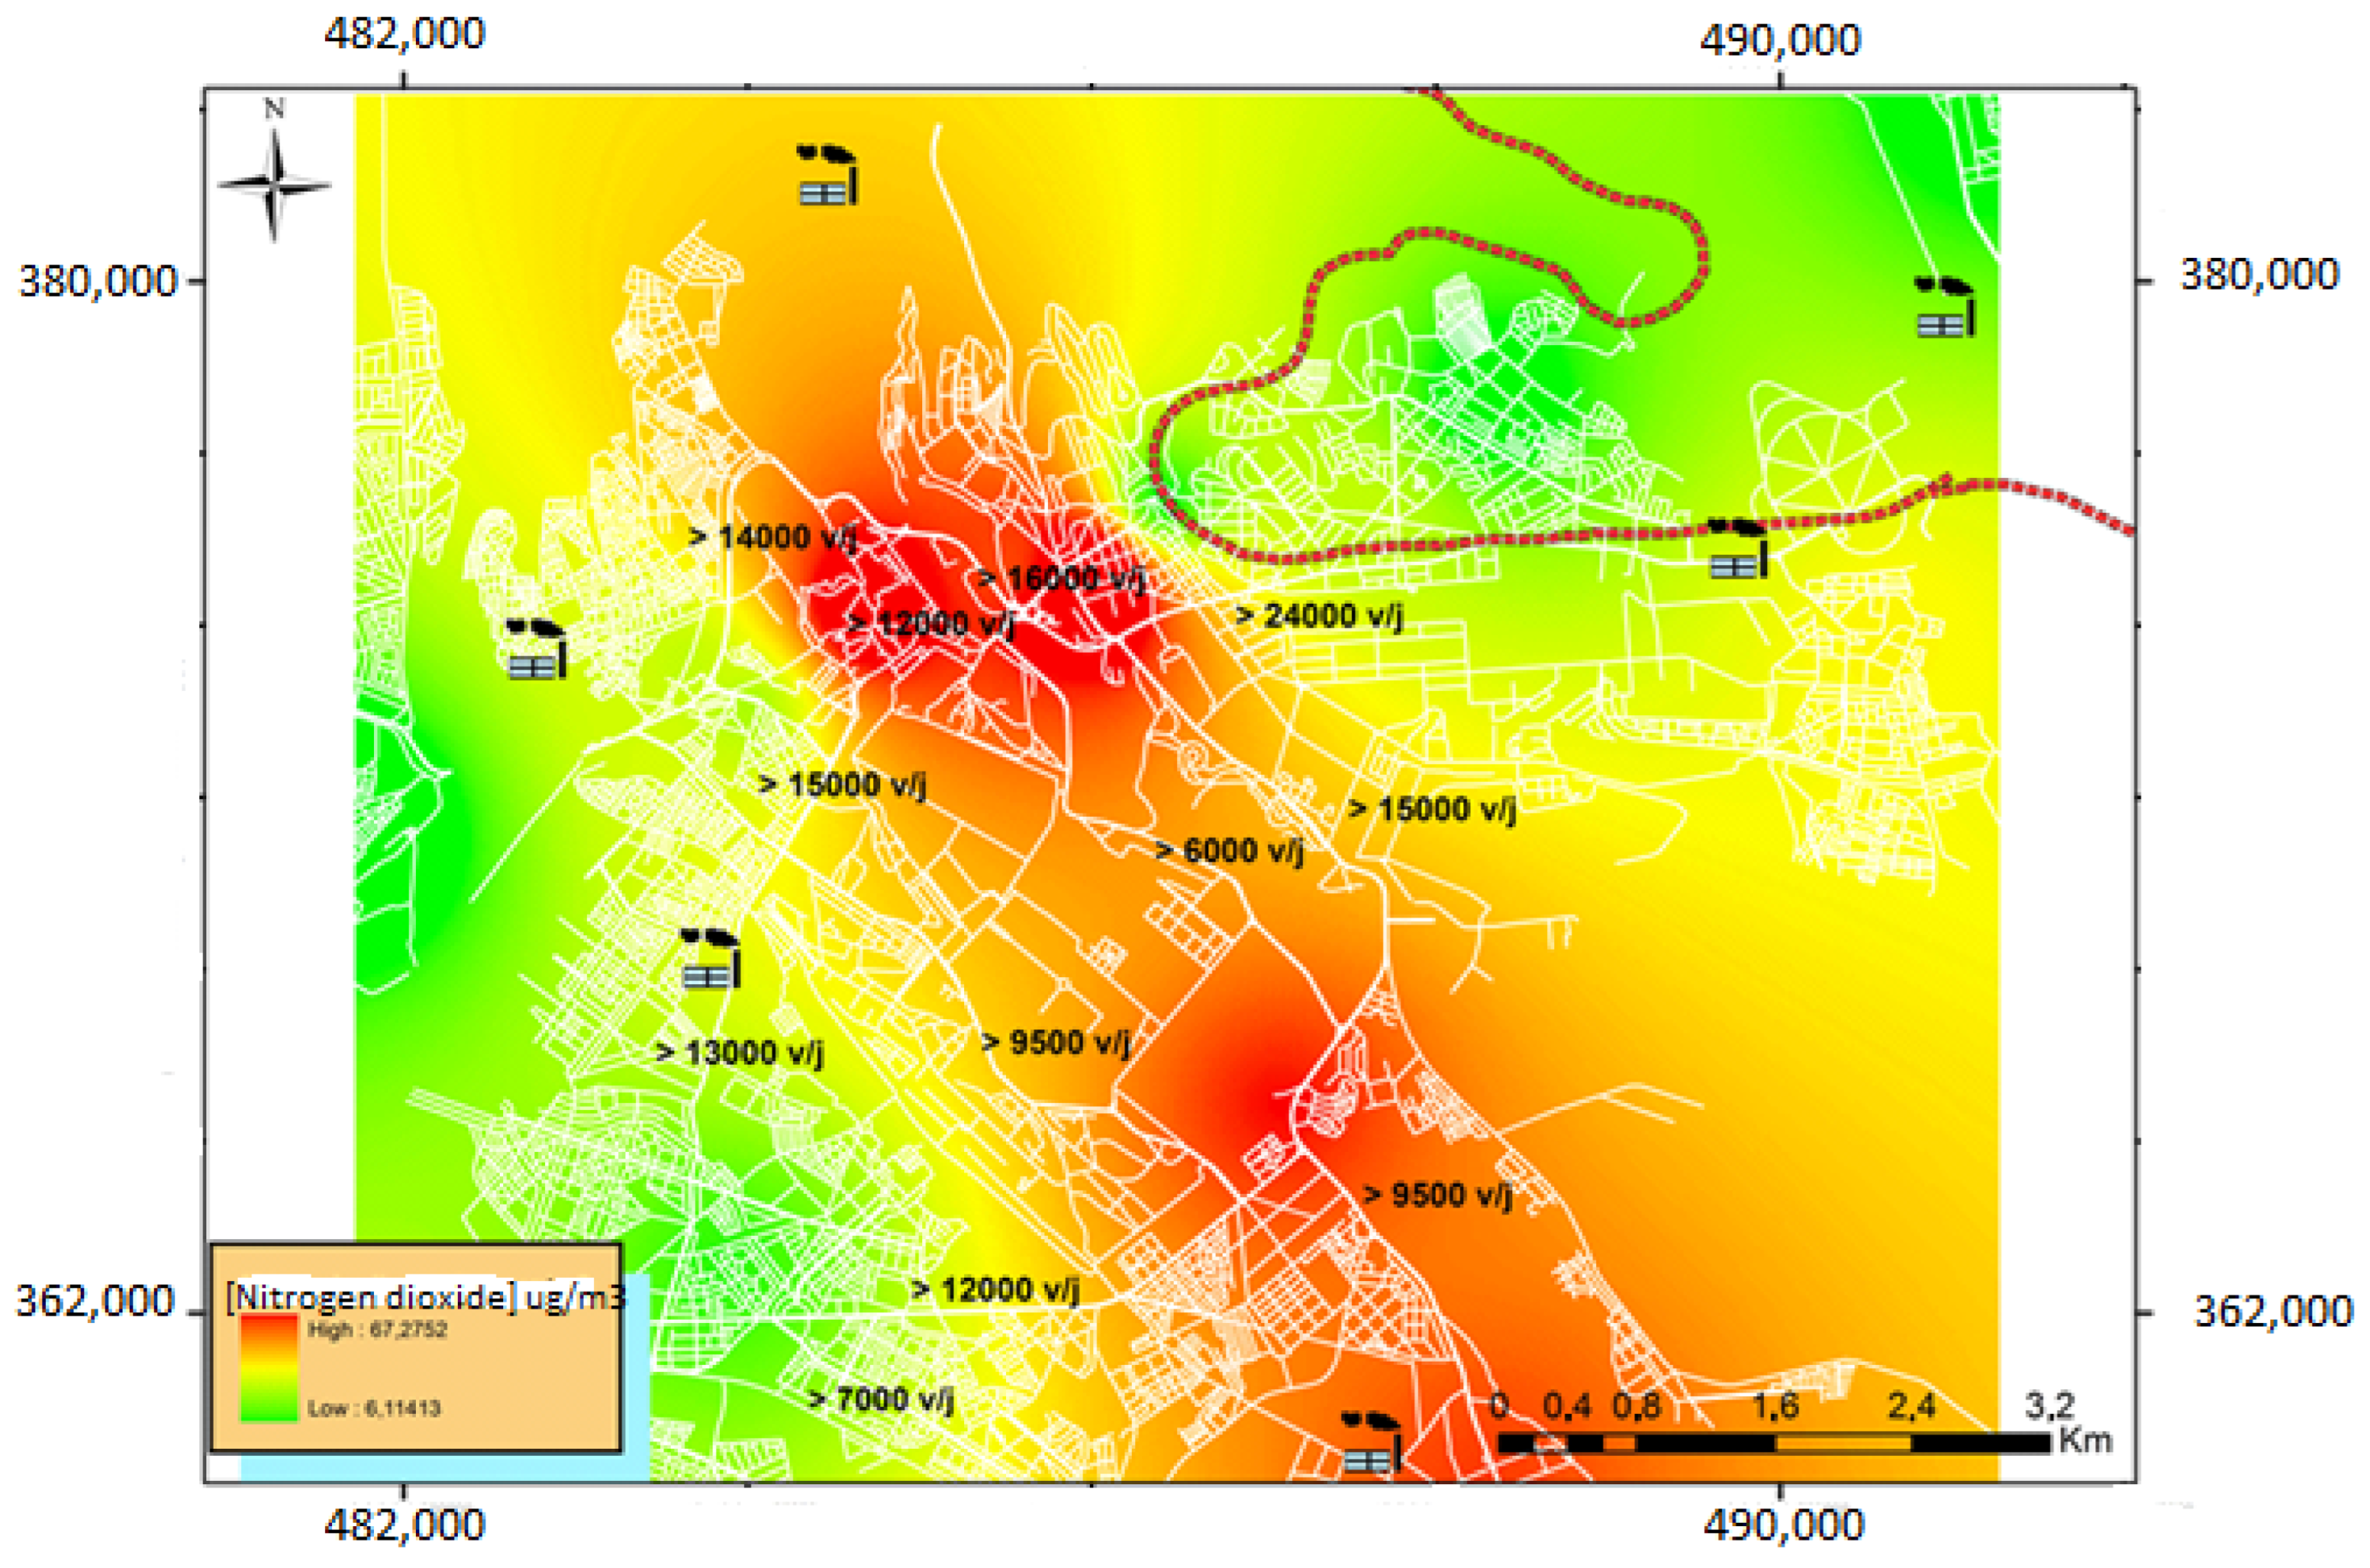
2.2.6. Mapping Representation

Under the geographic information system (GIS), mapping of the spatial distribution of NO2 was performed by spatial interpolation using the inverse distance weighted (IDW) method. Interpolation is a technique that estimates continuous variables in space at unknown locations from values measured at specified locations.
IDW is one of the most widely used deterministic interpolation methods. The IDW function generates the interpolated surface by estimating the nitrogen dioxide concentration at unsampled points, which is based on linear combinations of values at sampled points weighted by an inverse distance function.

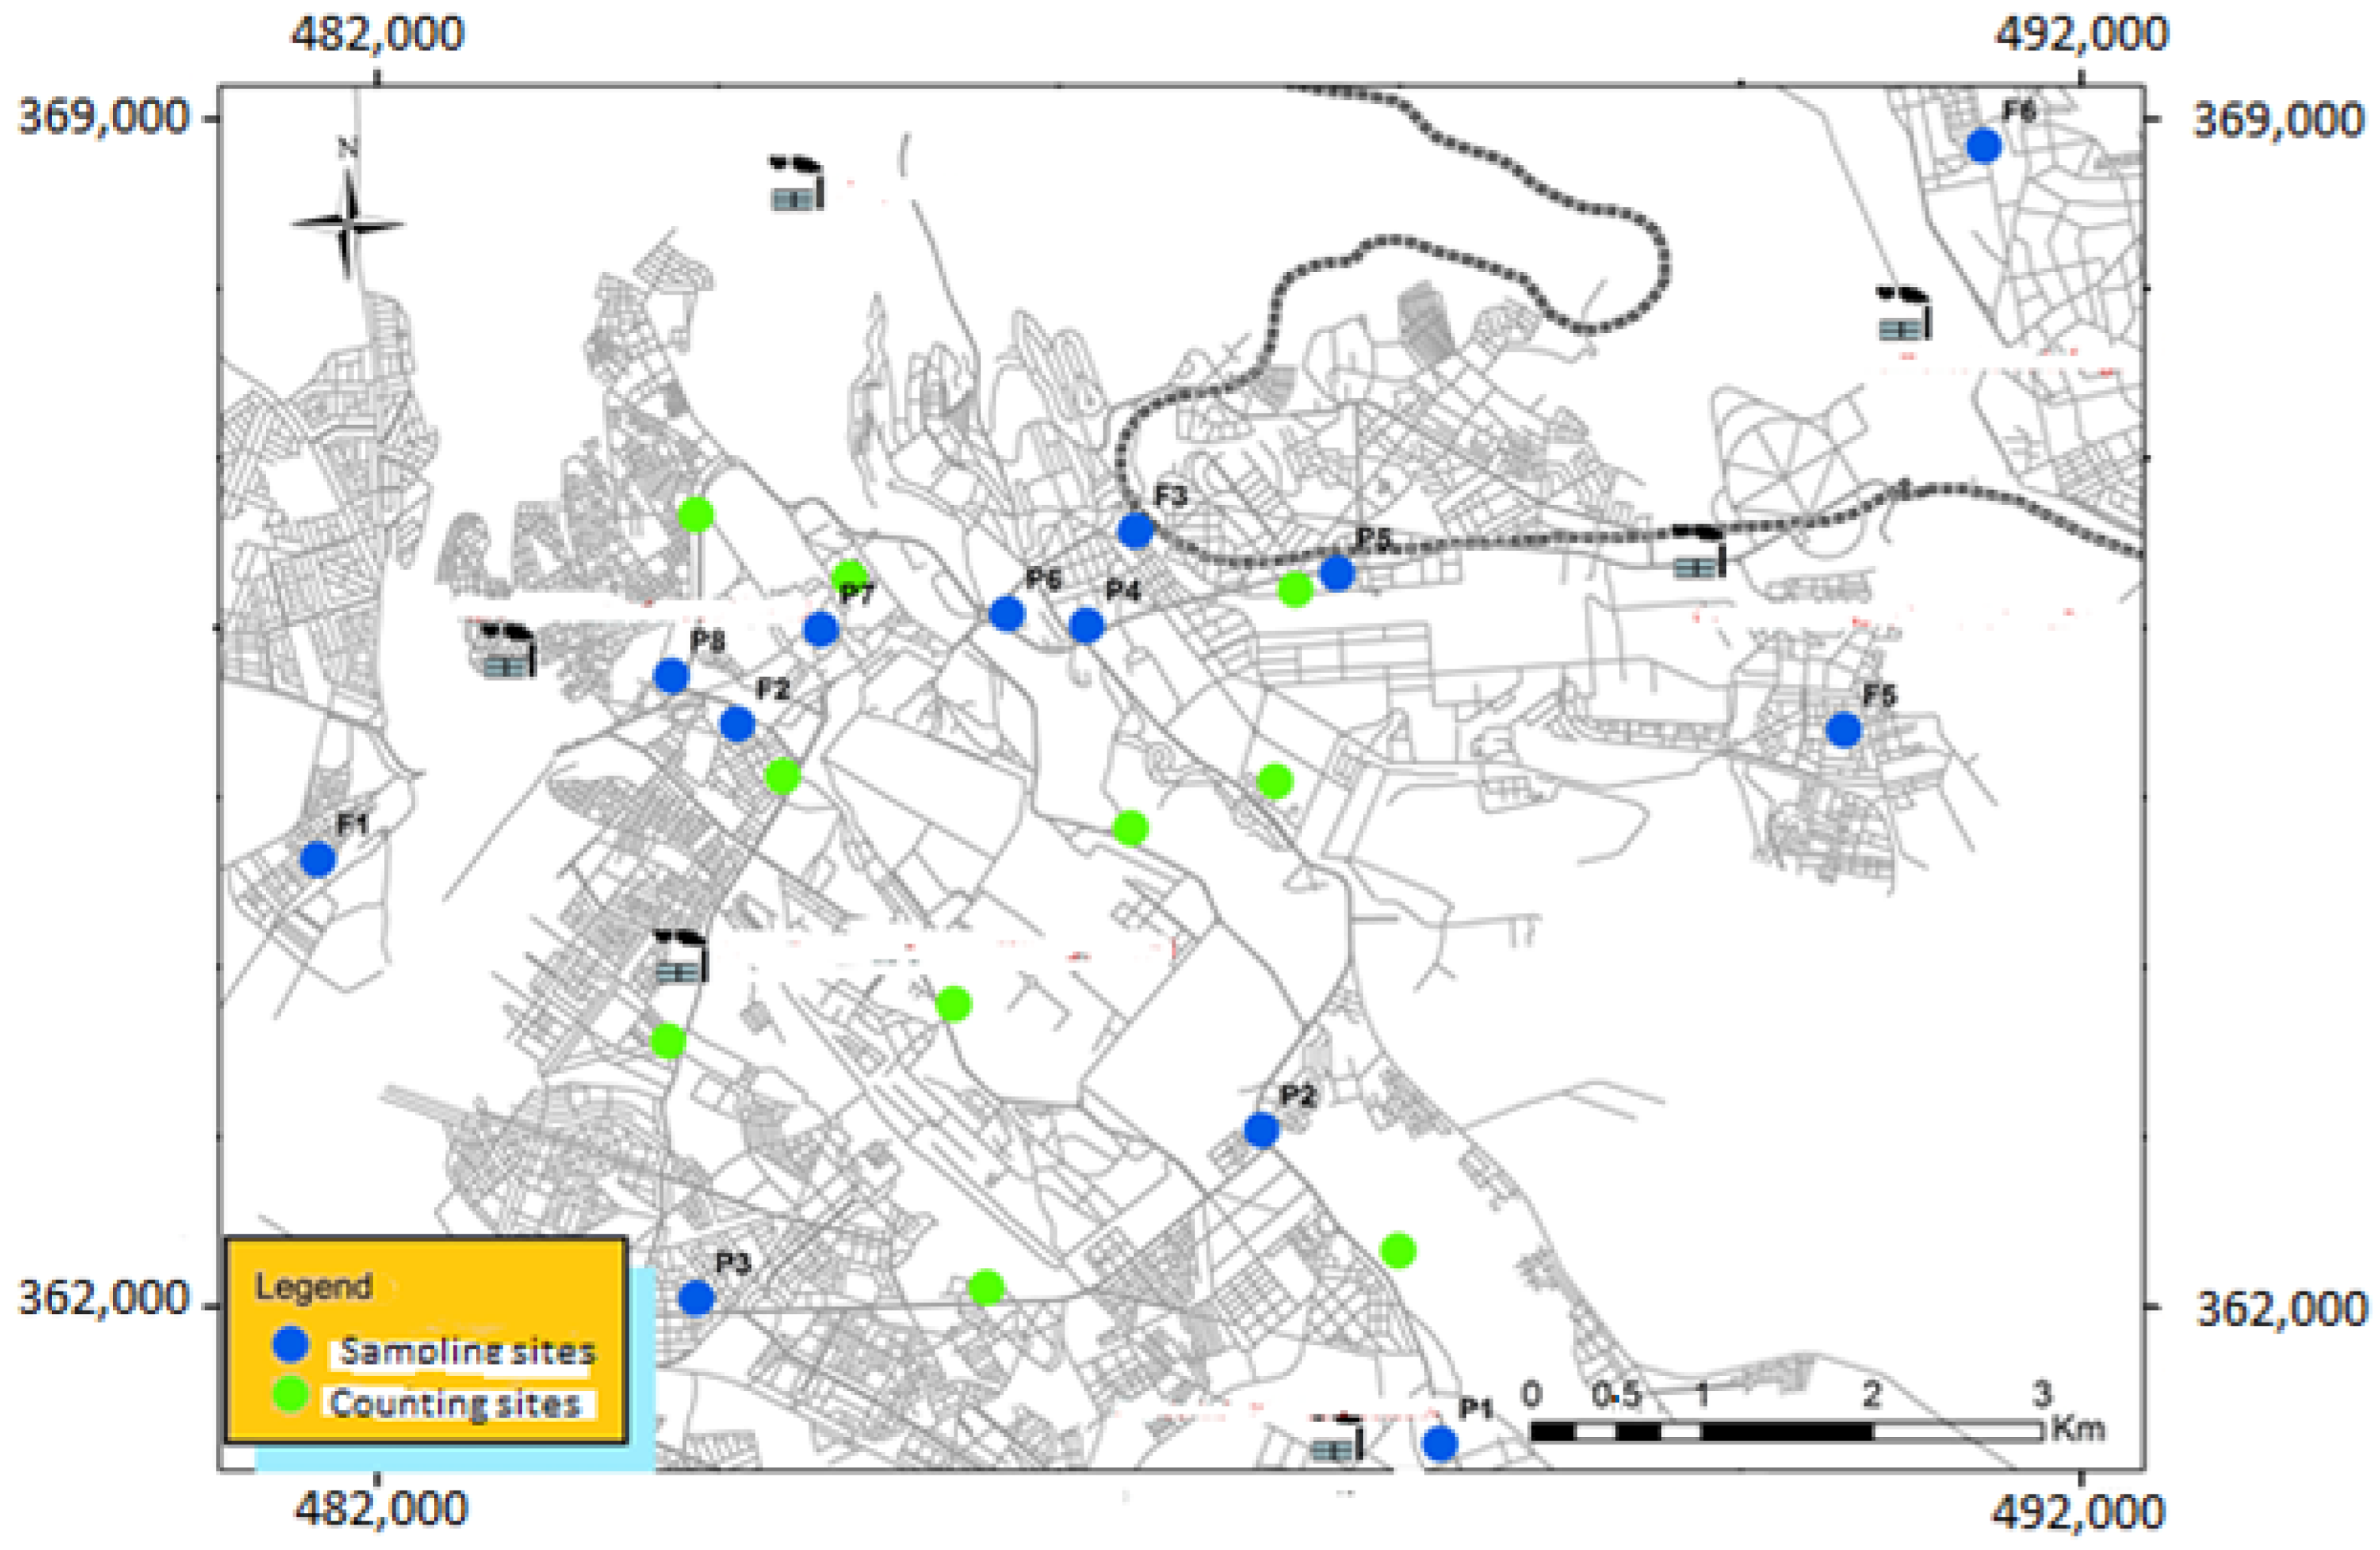
2.3. Comptage du Trafic Routier

In parallel with the winter NO2 measurement campaign, road traffic counting sessions were conducted during January 2015 on the surveyed area’s main roads. The counting was carried out by operators equipped with manual clickers.
To monitor intra-day variations, counting operations were focused mainly on the peak hours: morning (7:30/9:30), noon (11:30/14:30) and evening (17:30/19:30). In order to study inter-day variations and fluctuations in road traffic during working and non-working days, one week of counts per site was required. Twelve traffic sites were selected, and their location was dictated by the nature of the road section and the location of the passive samplers (Figure 3). Average road traffic is expressed in vehicles per day (v/j).

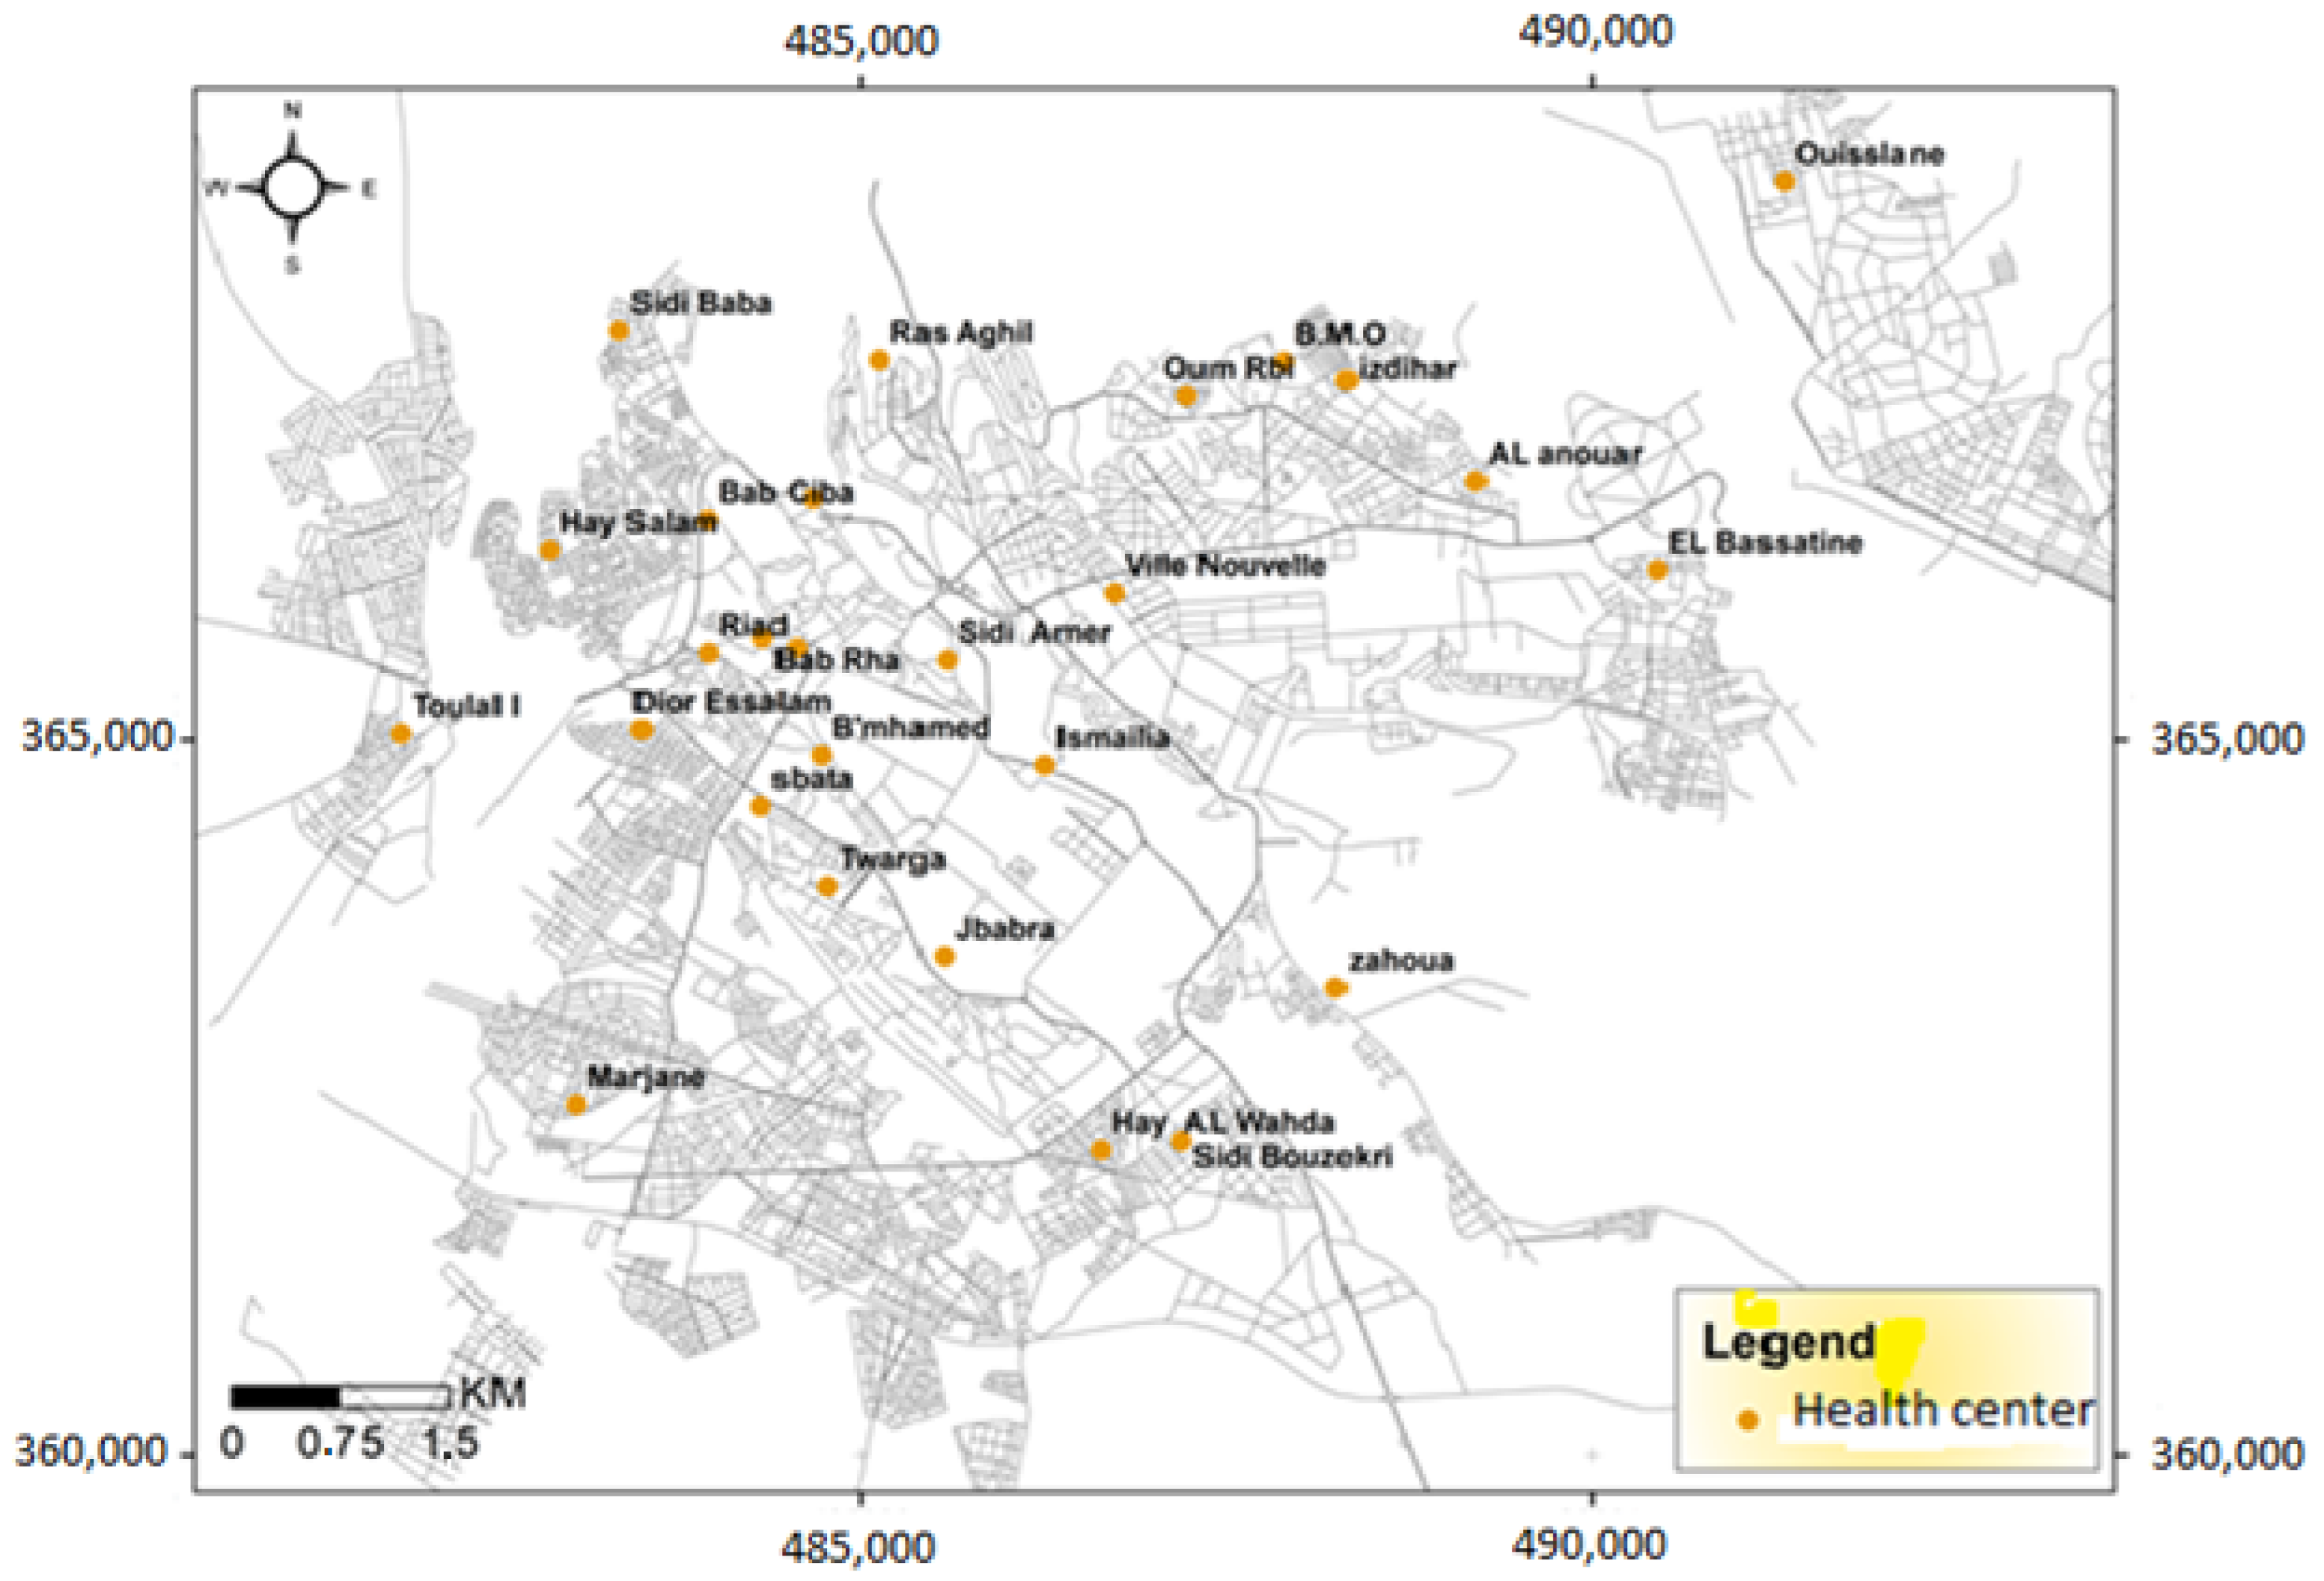
2.4. Study of the Epidemiological Profile of Respiratory Pathologies

This is a retrospective and descriptive study of the incidence of respiratory pathologies in the health centers of the city of Meknes (Figure 4) over five years (2010–2014). The health data were obtained from the prefectural epidemiology cell of the Meknes prefecture, which centralizes the quarterly reports sent by the various urban health structures. The information used included age, sex, health center, and quarter of reporting. These data were entered and analyzed using Microsoft Excel 2010.

3. Results

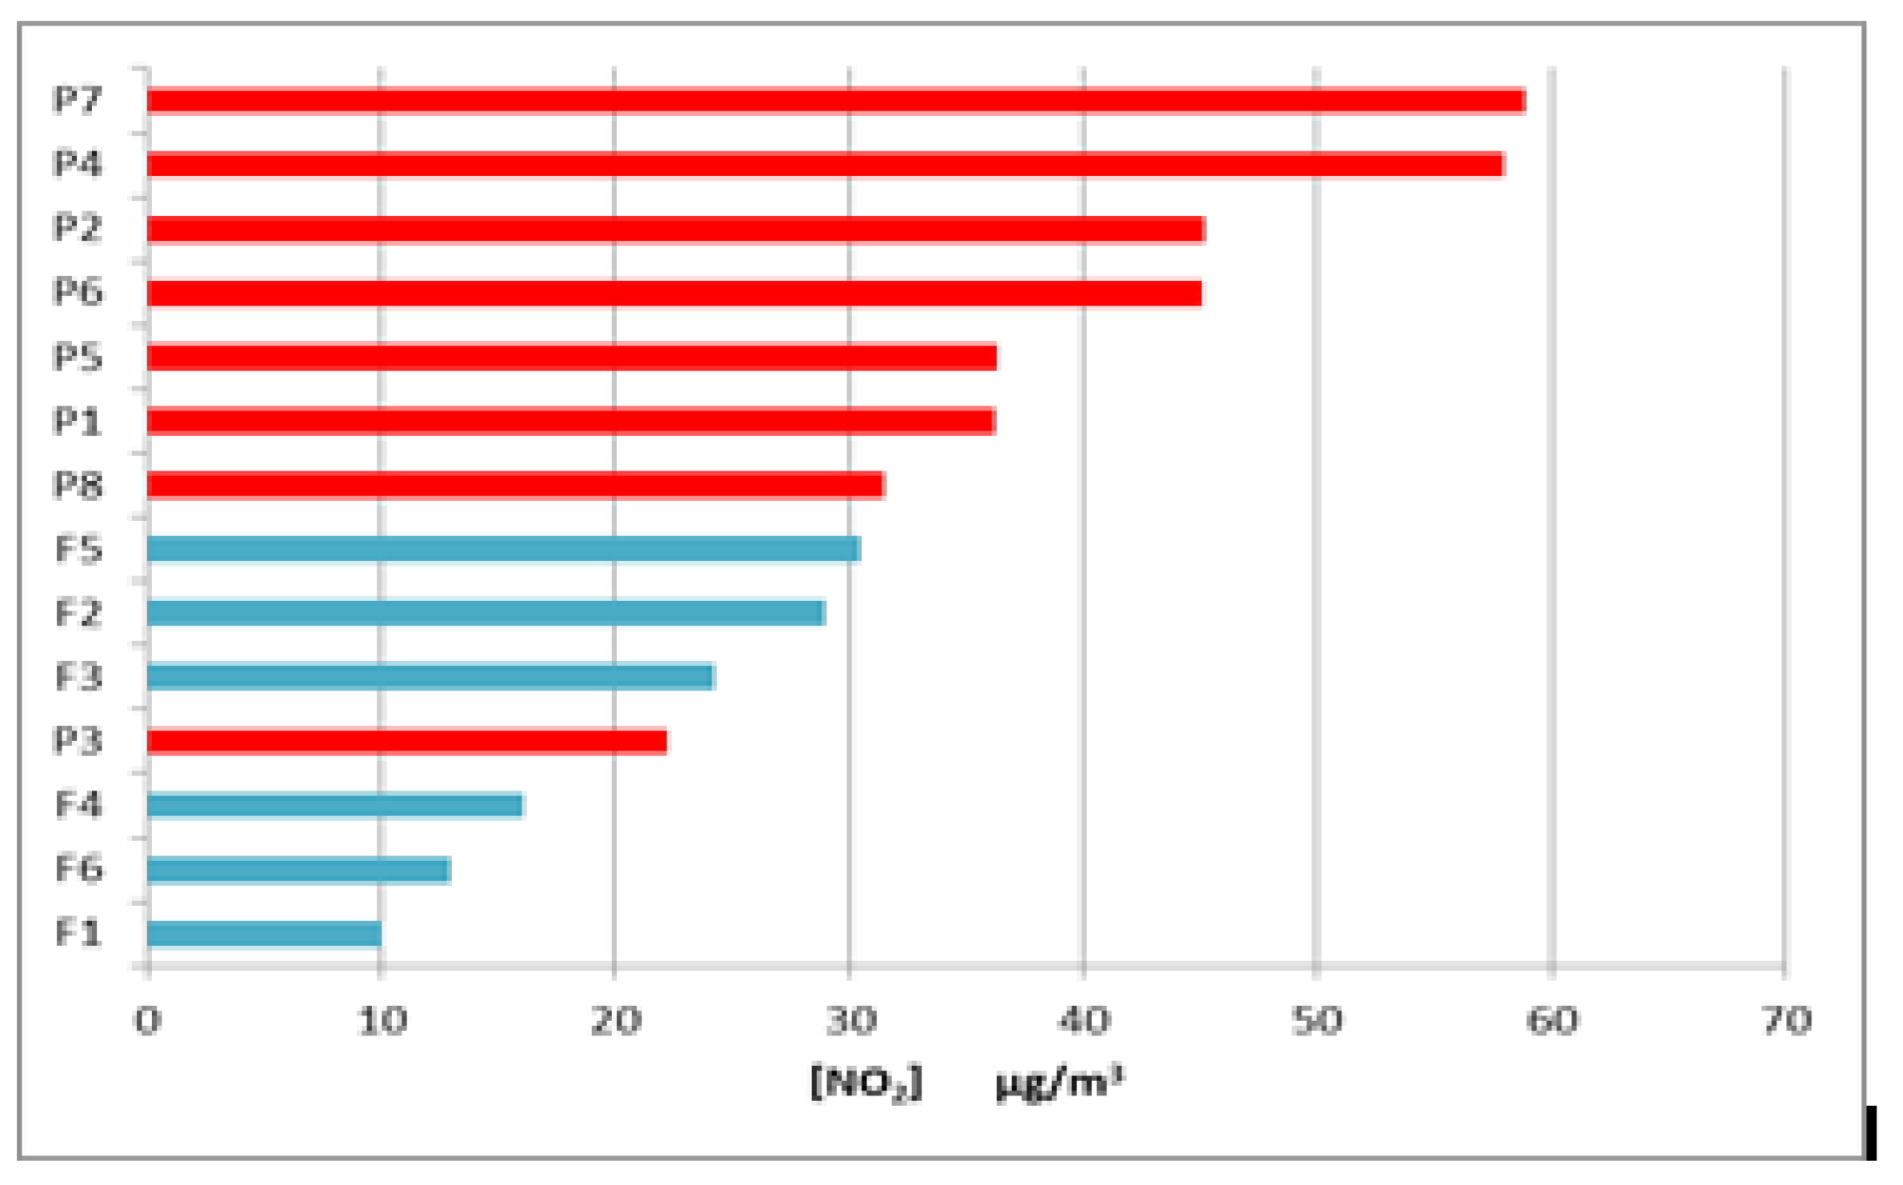
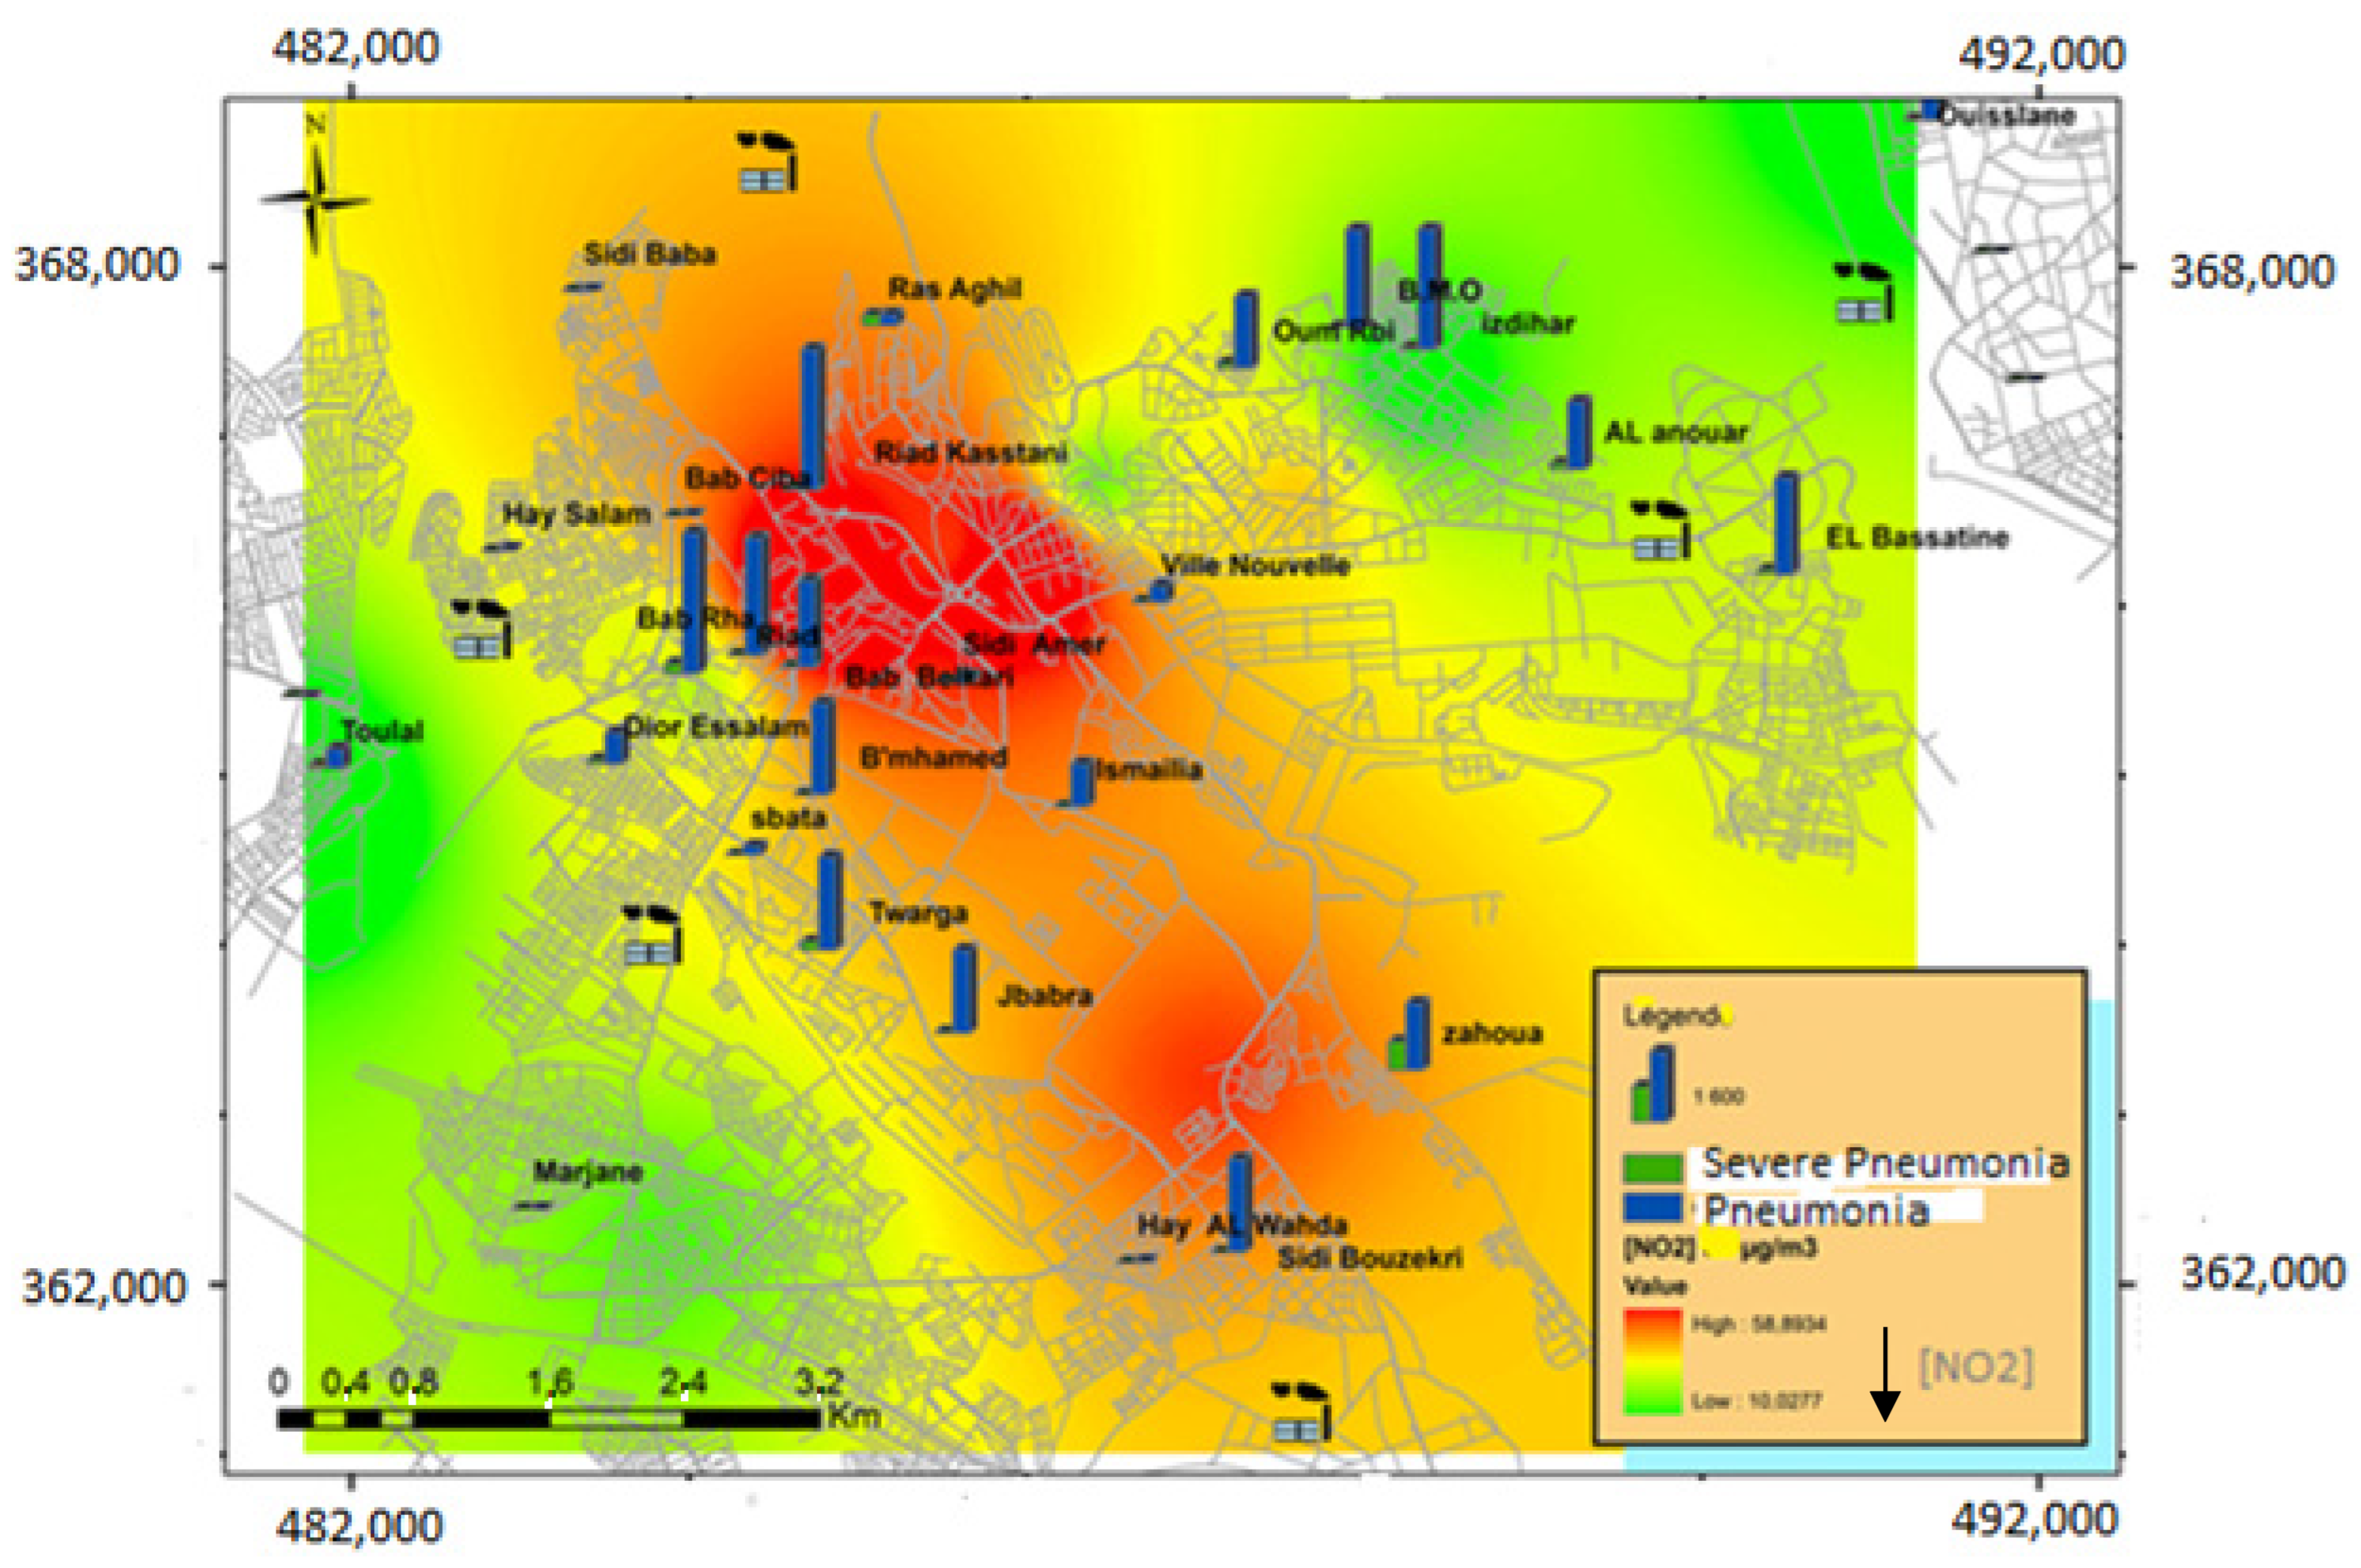
3.1. Study of NO2 Levels

The average NO2 concentration measured during the summer campaign (33.09 µg/m3) is very close to that reported in winter (33.20 µg/m3).
The average NO2 concentration measured at the car proximity sites is 41.89 µg/m3, and at the background sites, is 20.63 µg/m3.
NO2 concentrations in the air reach maximum values in the city center and tend to decrease towards its periphery.
The highest average concentrations are found at sites close to the city center: Dar Smane Street (59.41 µg/m3), the intersection of Avenue des FAR and Bir Anzarane Avenue (58.38 µg/m3), the intersection of Bir Anzarane Avenue and Zitoune Boulevard (45.57 µg/m3), and the intersection of Mohammed VI Avenue and FAR (45.49 µg/m3).
The sampling sites located near the industrial areas (Sidi Bouzekri, Ouislane, Route d’Agourai, Sidi Saïd, and El Bassatine) show lower levels of the tracer (Figure 5 and Figure 6).
In winter, NO2 dispersion is localized near the emitting sources. During the summer campaign, NO2 dispersion is characterized by a feather-like shape spread out towards the city’s southeast.

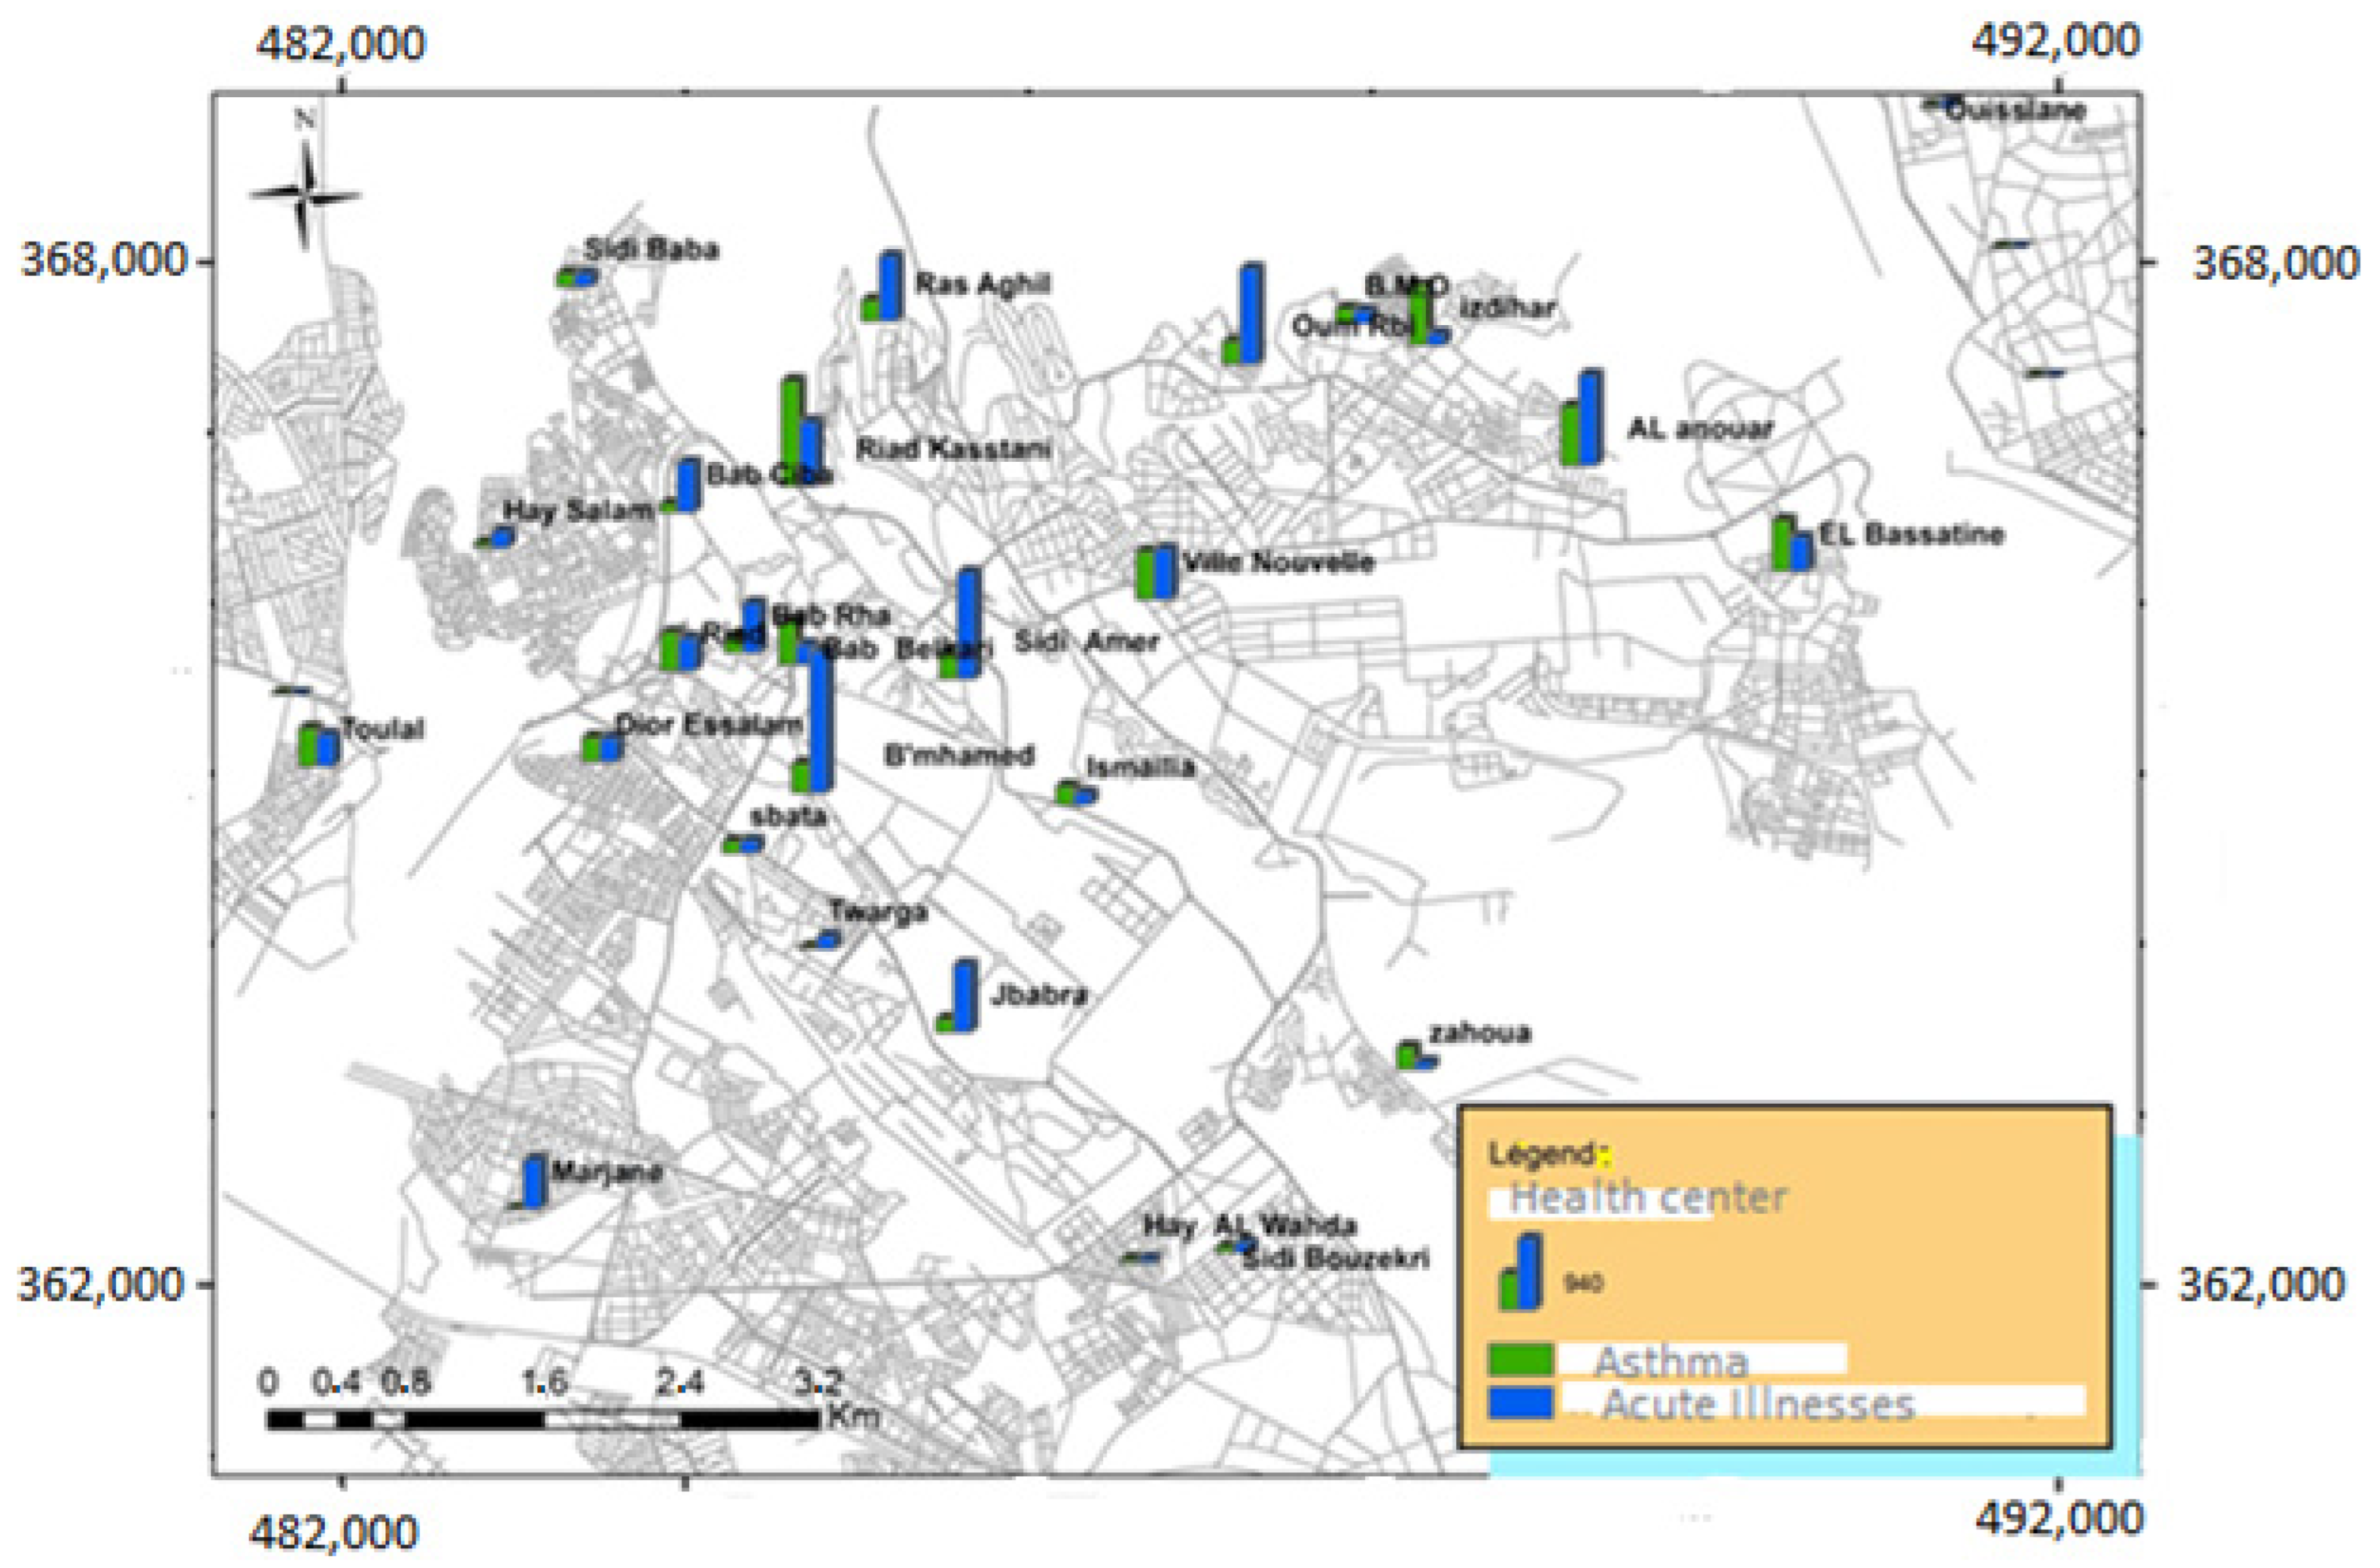
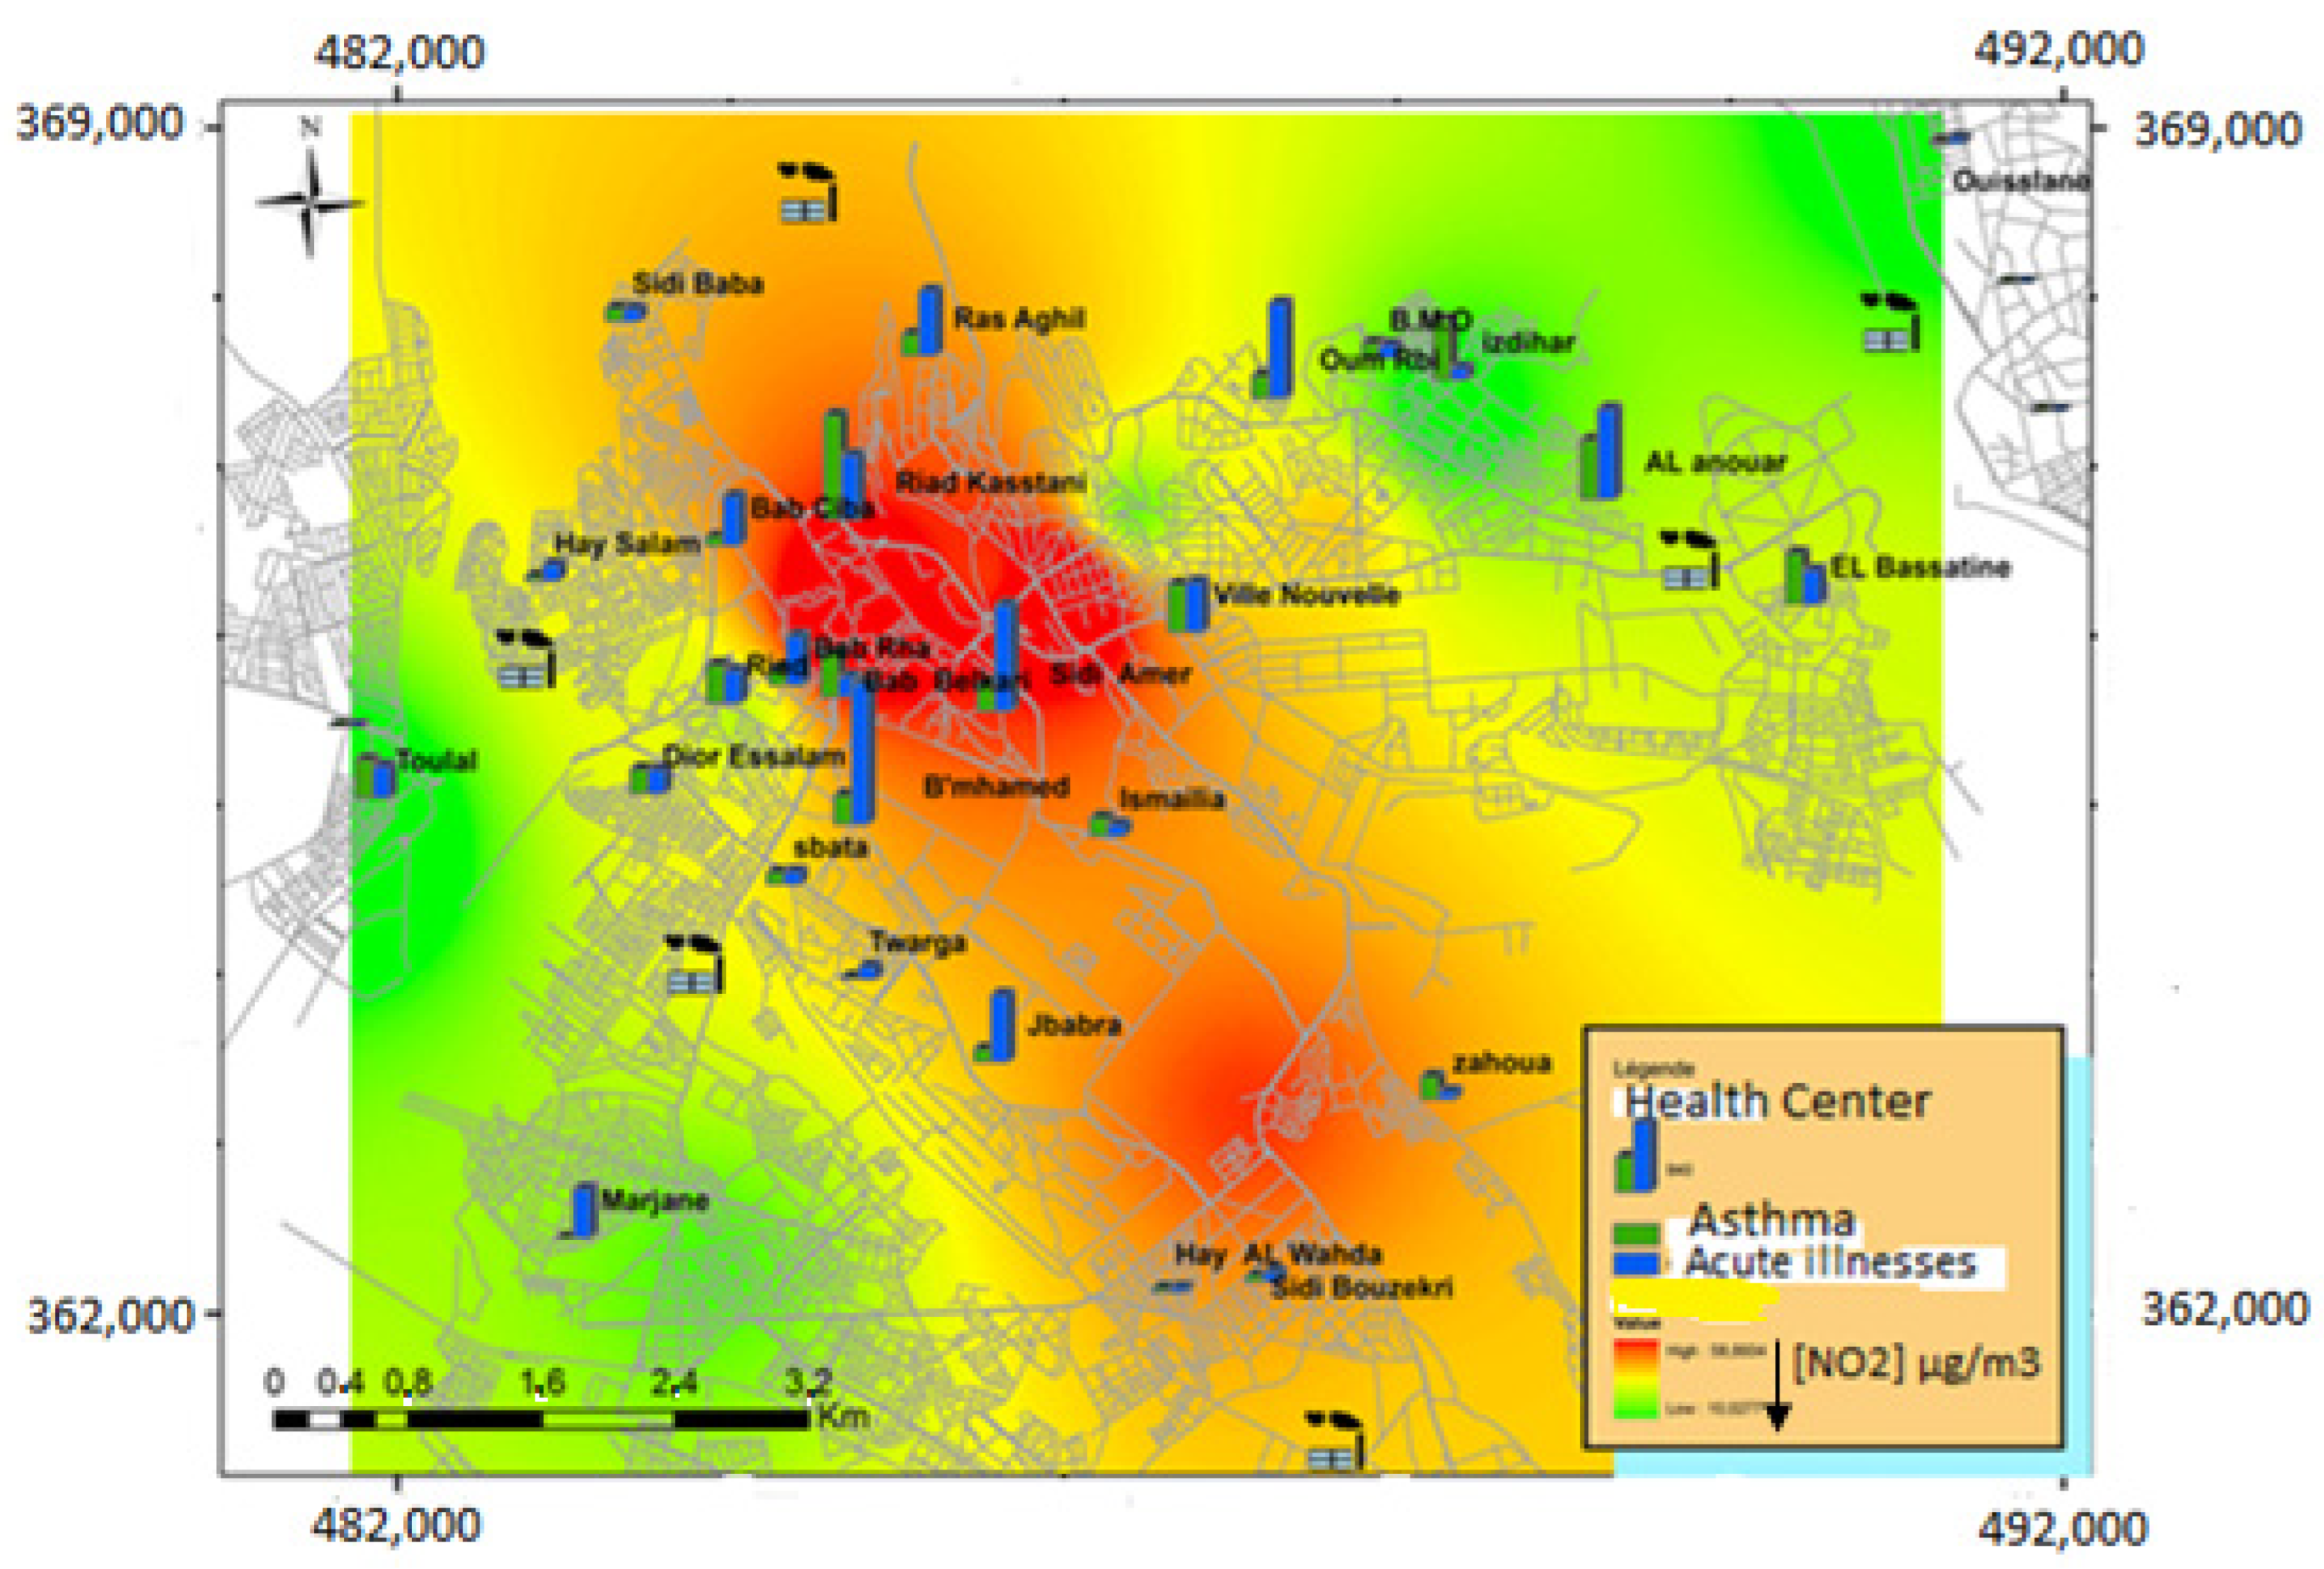
3.2. Study of the Epidemiological Profile of Respiratory Pathologies in Subjects Aged 5 Years and Over

The analysis of the distribution of consultations for acute respiratory diseases and asthma attacks by sex shows that for both health indicators, women were slightly more affected than men, with respectively 53.23% versus 46.77% and 52.51% versus 47.49% (Table 2) with sex ratios of 1.13 and 1.10.
The results in Table 2 show that acute respiratory illnesses were more frequent in the 15–49 age group, with 36.54%, and the least affected age group was 50 years and over with 28.02%. For asthma attacks, 47.16% of the consultants belonged to the 50+ age group, followed by the 15–49 age group with 42.50% (Table 3).
The quarterly distribution of acute respiratory illness and asthma attack visits show that acute respiratory illness and asthma attacks were more prevalent in winter and fall (Table 4).
If the distribution of respiratory consultations is variable in time, it is also in space. Indeed, during the study period (2010–2014), 119,665 new consultations for acute respiratory diseases were reported at the health centers of the city of Meknes. If we consider the number of consultations reported, the health centers that recorded the most cases are Bni M’Hamed (11,850 consultations), Oum Rabiae (11,404), Marjane (9815), Sidi Amar (7877), Jbabra (7475) and Riad Al Kostani (6633). While if we relate the number of new respiratory consultations to the population of each health center, we find that the health centers where the highest average annual incidence rates were noted are: Bni M’Hamed (1865 consultations per 10,000 inhabitants), Sidi Amar (1404), Oum Rabiae (1269), Al Anouar (1190), Jbabra (874) and Riad Al Kostani (838).
The highest average annual incidence rates of consultations for asthma attacks were recorded in Riad Al Kostani (1394/100,000), Al Anouar (788), Izdihar (792), El Bassatine (680), Downtown (634) and Bab Belkari (591). In contrast, the lowest rates were reported in Marjane (0 per 100,000 inhabitants), Touargua (29), Ouislane (34), Al Wahda (49), Hay Salam (61) and Sidi Bouzekri (81) (Figure 7).
The health centers surrounding the industrial districts of Ouislane (Saada, Ouislane and Al Boustane), Sidi Bouzekri (Sidi Bouzekri and Al Wahda) and El Bassatine have low incidences (Figure 7 and Figure 8).

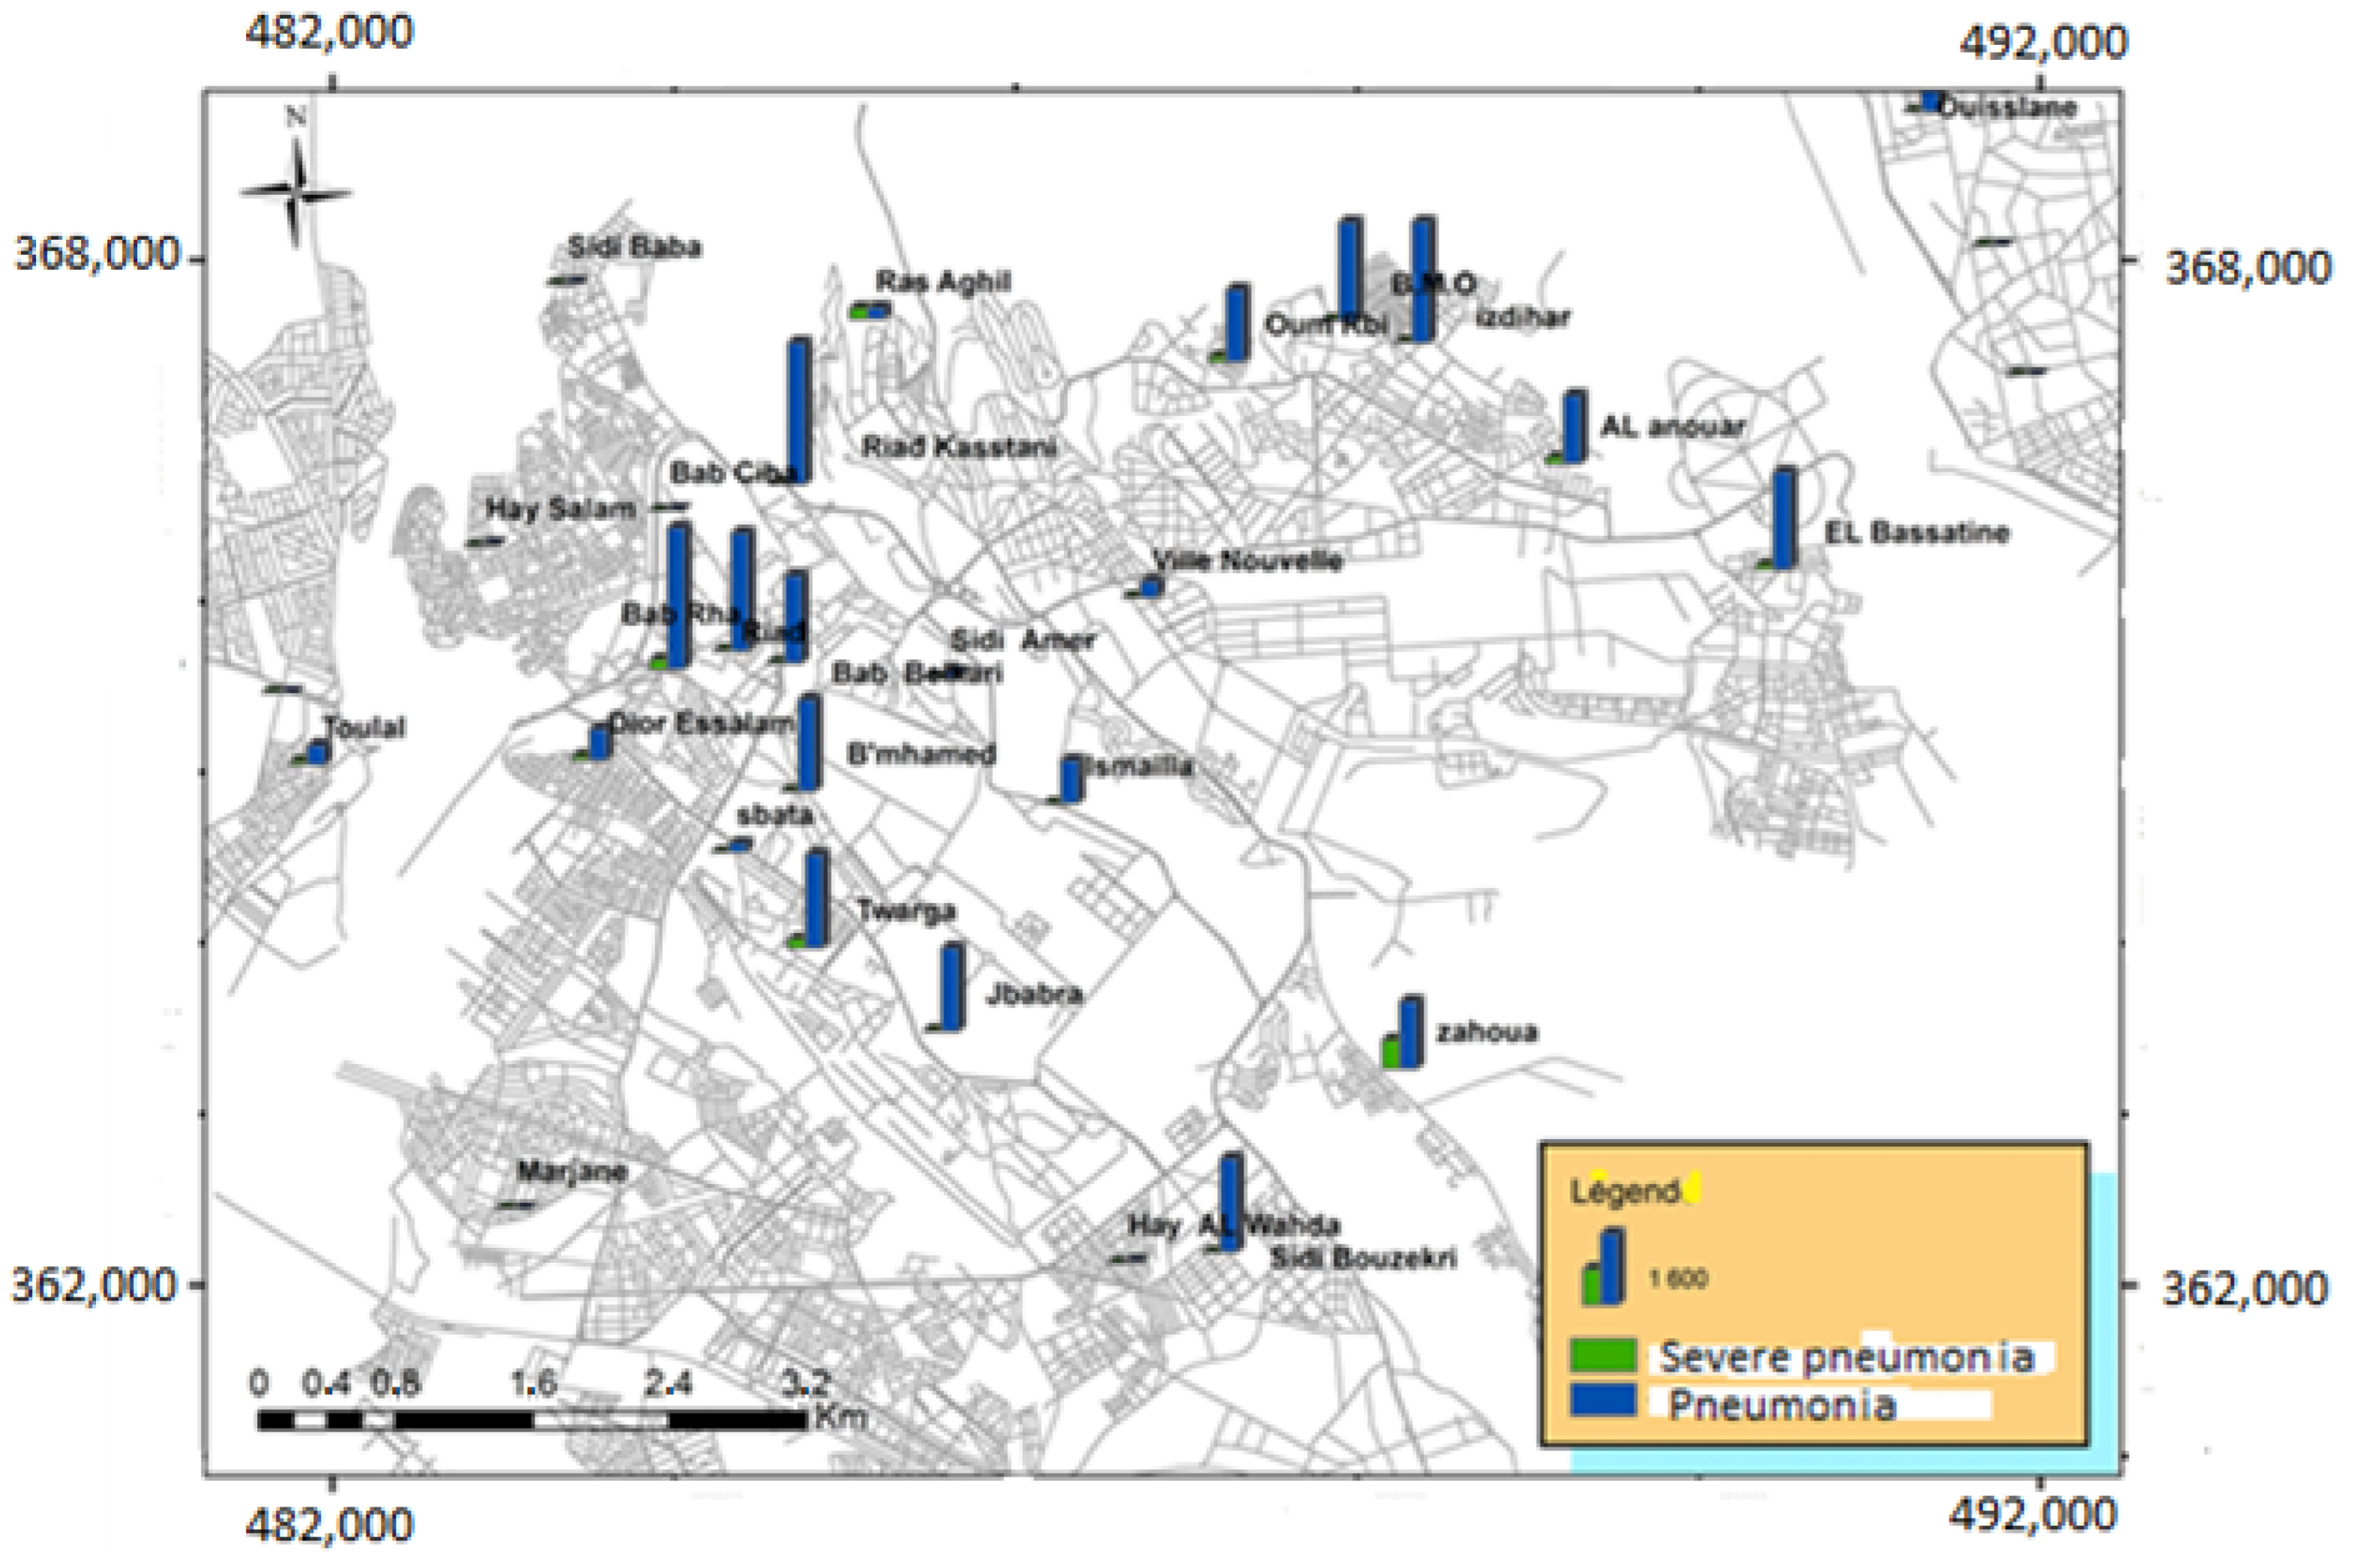
3.3. Study of the Epidemiological Profile of Respiratory Diseases in Children under 5 Years of Age

In Meknes, 26,070 cases of pneumonia were reported by the city’s primary care network. Analysis of the distribution of cases by age shows that the age group most affected was 24–59 months with 37.74%, followed by 12–23 months which represented 31.57% of the cases recorded (Table 5).
The health centers in the city of Meknes recorded 1081 cases of severe pneumonia in children under five years of age. Analysis of the distribution of cases by age showed that 51.15% of the patients were under 11 months, 79.27% under 23 months, while those aged two years and over represented only 20.72% (Table 5).
Pneumonia and severe pneumonia were more common during the fall-winter period than in the spring-summer period (Table 6).
The highest incidences of pneumonia were recorded in Riad, Izdihar, and Bab Rha, while for severe pneumonia, the highest incidences were reported at Zahoua, Ras Aghil, and Riad (Figure 9).
The health centers near the industrial sites do not show high frequencies of bronchopulmonary diseases (Figure 9 and Figure 10).

4. Discussions

The analysis of the results shows that for acute respiratory diseases, women (53.23%) were slightly more affected than men (46.76%) with a sex ratio of 1.13. The most affected age group was 15–49 years with 36.11%, while the least represented age group was 50 years and above with 29%. Our results are supported by a study conducted in the city of Meknes covering 30 health centers [58]. The study conducted by Boularab et al. showed that age is a risk factor in subjects aged 15–49 years and is more important in women (relative risk (RR) ranging from 2.48 to 2.82) than in men (RR ranging from 1.71 to 2.20). The population aged 50 years and older had lower RRs ranging from 1.07 to 1.26, regardless of sex. Age was a protective factor for children aged 5 to 14 years, with RRs significantly below the threshold of 1. The sex ratio (M/F) was generally less than 1.
For asthma attack consultations, women were slightly more affected than men with 53.12% versus 46.85% for a sex ratio of 1.13. The most represented age group was that of 50 years and over, followed by that of 15 to 49 years. In Meknes, Boularab [58] showed that age is a risk factor for the working population aged 15 years and over with RRs ranging from 1.7 to 4.08. The risk of having asthma attacks was higher in women aged 15–49 years (RR fluctuating from 2.66 to 4.08). The M/F ratios were significantly less than 1. For the 5–14-year age group, age was a protective factor with RRs that ranged from 0.05 to 0.20.
For pneumonia, the age group most affected was 24–59 months, followed by 12–23 months. This result contradicts the results reported by Boularab et al., who noted a decrease in relative risk with increasing age, and the highest risks were recorded in children under 11 months (RR ranged from 2.73 to 5.07) [58].
Fifty-one point sixty-two percent of the severe pneumonia cases were reported among toddlers less than 11 months old, while those aged 2 years and more represented only 21.22% of the cases. These results are consistent with those reported by Boularab et al. [58] who showed that age is a risk factor for those under 23 months with RRs ranging from 1.64 to 1.9.
The increased respiratory consultations during the autumn-winter period may be related to temperature variations. The drop in temperature favors the propagation of germs responsible for respiratory infections. It also contributes to the development of molds and dust mites especially in homes that are poorly ventilated and that suffer from a lack of sunlight. These microorganisms release very powerful pneumallergens (spores, mycotoxins, volatile organic compounds and excrements), which can participate in the genesis of asthma in non-asthmatics and the development of asthma attacks in asthmatic people [59]. Closing windows in winter to increase the temperature inside the home leads to a decrease in ventilation and an accumulation of pollutants. In addition, in cold periods, the increase in household activities, particularly cooking, can lead to an increase in the concentration of indoor pollutants [60]. Furthermore, the increase in the activity of oil mills from September to March is accompanied by the generation of significant quantities of atmospheric pollutants that can actively participate in the occurrence of asthma attacks and other bronchopulmonary diseases.
The increase in asthma attacks during the spring compared to the summer period may be related to the inhalation of plant pollen since this season is characterized by the flowering and pollination of higher plants.
In the study area, the highest concentrations of NO2 were found at sites near the city center. Indeed, these roads are characterized by heavy daily traffic, causing a large part of this tracer’s emissions of car proximity pollution [41,61]. For the sampling sites installed near the industrial districts of Sidi Bouzekri, Agourai road, Sidi Saïd, El Bassatine, and the Lafarge cement plant, the NO2 levels measured are below the permissible limit value (40 µg/m3). These results are consistent with surveys conducted by the Moroccan Ministry of the Environment, which showed that road traffic is responsible for 75% of NO2 emissions and that the industrial sector does not exceed 25% [62]. The precipitation rate during the winter campaign has probably led to a decrease in NO2 levels in the air, given its solubility in water which induces its decomposition into nitrous and nitric acid [41]. The high temperatures recorded during the summer measurement campaign catalyze the formation of O3 from NO2 [41]. In winter, NO2 dispersion is localized near the emitting sources due to multidirectional winds and/or a temperature inversion layer a few hundred kilometers above the ground [58]. During the summer campaign, NO2 dispersion is characterized by a feathery shape spread towards the southeast of the city and influenced during this period by a dominant wind of moderate intensity coming from the northwest, which ensures maximum dispersion of this tracer [58]
Nitrogen dioxide is a photoreactive product whose content is controlled by the NO-NO2-O3 formation-destruction Chapman reaction cycle under the effect of radiation with a wavelength lower than 400 nm [58].
This cycle ensures a photostationary equilibrium between NO, NO2, and O3, which is disturbed in the presence of other pollutants such as the volatile organic compounds (VOC) identified as RH, benefiting the conversion of NO to NO2. The OH radicals react with RH and give rise to alkyls that lead to the formation of peroxide radicals through a series of rapid reactions with O2.
These peroxides promote the rapid oxidation of NO to NO2, increasing nitrogen dioxide near the emission source and ozone at more distant locations [63].
These reactions explain the low concentrations at the peri-urban site and the concentrations that exceed the limit values at the roadside sites.
The high spatial variability is represented in the maps as a pollution gradient. It shows higher concentrations in the city center, near roads, and at locations and intersections with high traffic loads, which gradually deteriorate towards the periphery of the agglomeration.
The net spatial gradients of NO2 are a common feature in the various studies of nitrogen dioxide as a pollutant in urban environments [64,65]. These gradients are attributed to pollution sources’ location, measurement site type, topography, and road infrastructure [66]. For example, high NO2 concentrations at high traffic sites can be attributed to traffic congestion and high NO emissions that rapidly oxidize to NO2 near the emission sources. However, some NO is oxidized before reaching the tailpipe [67,68]. In urban areas, some air pollutants may show more spatial variability than others [69,70], showing that the nature of the pollutant plays a crucial role in tracing these gradients.
The photoreactive nature of nitrogen dioxide also explains the very similar average concentrations of the two campaigns. 75% of the days of the first campaign and 58% of the second campaign are clear sky, representing a similar meteorological profile and favorable to the secondary production of NO2 in the absence of rain in the two campaigns. In the presence of rain, nitrogen dioxide leaches from the atmosphere and is transformed into wet deposition as nitric acid [71]:
The effects of meteorology on the concentration and dispersion of nitrogen dioxide have been revealed in many studies. As in our case study, some of them confirm the absence of a significant difference in average NO2 concentration between the different study periods [72,73]. On the other hand, other studies have revealed a periodic variability attributed mainly to differences in the meteorological profiles of these periods [74,75].
According to this study, the city of Meknes appears as a moderately polluted city compared to other urban sites. The average NO2 concentrations are very similar to those of Elche (Spain), Edinburgh (UK), and Granada (Spain), with almost the same population. These concentrations are in the range of large agglomerations with populations over one million, such as Kanpur (India) and Bamako (Mali) (Table 7).
These observed disparities between cities could be attributed to differences in urban structure, traffic flows, pollutant emitters, and climatic conditions [76].
The following table shows nitrogen dioxide concentrations measured worldwide by the passive sampling technique and by automatic monitoring networks in some neighboring countries.
Table 7. NO2 results were obtained in the city of Meknes compared with other urban agglomerations worldwide.
Study Area[NO2] µg/m3Study PeriodCountryReferences
Kocaeli14July 2006Turkey[77]
Bouni Region14.8 *Average of 7 months of measurement in 2011Algeria[78]
Windsor23.31Average of four 14-day campaigns in February, May, August and October 2004Canada[74]
Malaga22.8September 2001 and from December 2001 to February 2002Spain[64]
Pampelune23From June 2006 to 2007Spain[69]
Gothenburg and Mölndal23.57–20 May 2011Sweden[79]
Asturies23.6Average of two 7-day campaigns in June and November 2005Spain[80]
Northern Ireland24.3Annual average for 1997UK[81]
Kampala24.9From 30 June to 13 July, 2014Uganda[82]
Kocaeli25January 2007Turkey[77]
Wales27.26Annual average for 1997UK[81]
Scotland27.26Annual average for 1997UK[81]
Bamako30.45From June 2008 to 2009Mali[53]
Meknes30.41From 14 July to 28 July 2014 and from 25 December 2014 to 12 January 2015MoroccoThis study
Elche32Average for 2007–2008Spain[83]
East Anglia34.78Annual average for 1997UK[81]
South East England34.78Annual average for 1997UK[81]
Edimbourg 34From 2 December 2013 to 13 January 2014UK[73]
West Midlands35.72Annual average for 1997UK[81]
Granada36.5Average of two campaigns: from July to September 1999 and from December 1999 to February 2000Spain[64]
Kanpur36.9February and March 2004India[68]
Edimbourg 37From 2 August to 13 September 2013UK[73]
East Midlands40.42Annual average for 1997UK[81]
Yourkshire-and-Humber42.3Annual average for 1997UK[81]
London42.3Annual average for 1997UK[81]
Agadir44From 20 April to 27 April, 2006Morocco[22]
Durban45.12Average of one week in summer 2001South Africa[75]
Rawalpindi55.74Annual average for 2008Pakistan[84]
Dakar59.9From January 2008 to December 2009Senegal[53]
Al-ain59.3From 21 February 2005 to 20 February 2006United Arab Emirates[85]
Delhi68.6February and March 2004India[68]
SfaxBetween 37.6 and 112.8 *Fall 1996, Winter 1997, Spring and Summer 1998Tunis[63]
Durban110.92Average of one week in winter of 2001South Africa[75]
* Measurements made with an automatic monitoring network.
The highest incidence rates of consultations for acute respiratory diseases were recorded in Béni M’Hamed, Sidi Amar, Aïn Choubik, Al Anouar, Jbabra, and Riad Al Kostani. In Meknes, Boularab [58] analyzed the spatial pattern of acute respiratory illnesses using the Kulldorff spatial scanning method, which identified eight highly significant (p < 0.001) high-risk clusters divided into three zones. The first zone is located in the northwest of the city, and includes four clusters centered on the Ras Aghil health sector, with relative risks evolving from 2.3 in 2010 to 5.6 in 2012. The second is located in the center of the city and includes three clusters, two of which are centered on Al Ismailia health sector with relative risks of about 4.2 in 2013 and 4.7 in 2014; the third area represents Al Anouar health sector which recorded a relative risk of 4.1 in 2012 [58].
The health centers where the highest average annual incidences of asthma attack consultations were recorded are Riad Al Kostani, Al Anouar, Izdihar, El Bassatine, downtown (Ville Nouvelle) and Bab Belkari. Boularab [58] indicated that the high-risk areas for the occurrence of asthma attacks are located in the north and west of the city of Meknes. The area to the west of the city is composed of two clusters around the Riad health sector, with relative risks of about four. The area to the north of the city is subdivided into three sub-regions. The first is made up of two clusters centered on the Ville Nouvelle health sector, with relative risks of 7.7 and 9.6, respectively; the second sub-region is made up of a cluster centered on the Borj Moulay Omar health sector, with a relative risk of 6.4; as for the last sub-region, it includes a cluster with the lowest relative risk of about 1.8 around the AL Anouar sector.
For severe pneumonia, the highest incidence rates were reported in Zahoua, Ras Aghil, and Riad. Bouarab [58] revealed the existence of nine high risk clusters, divided into three zones. The first zone is made up of five clusters and is located in the north of the city: two clusters around the Ville Nouvelle health sector with RRs varying between 3.7 and 7.8, one cluster centered on the Ras Aghil health sector with an RR of 5.5 and one cluster around the BMO health sector with an RR of 3.5. The second zone is located in the southwest of the city and is made up of three clusters, two of which are centered on the Touargua health sector with RRs of 14.6 and 6.3, respectively, and one cluster around the Diour Salam health sector with RRs of 4.7 in 2011 and 9.5 in 2013. The last high-risk area is located in the west of the city and is composed of the administrative district health sector with an exceptional RR of 40.8 in 2012.
The highest incidences of pneumonia were recorded in Riad, Izdihar and Bab Rha. Boularab [58] identified ten high-risk spatial clusters divided into four zones. The first area is located in the north of the city and consists of three clusters: one cluster, with an RR of 1.9, which is centered on the Al Anouar health sector; one cluster around the Izdihar health sector with a relative risk of 2.3; and one cluster with an RR of 3.2 is centered on the El Bassatine health sector. The second high-risk area is located in the southwest of the city and includes three clusters: two clusters around the Jbabra health sector with RRs of 2.6 and 3.1, respectively, and one cluster centered on the Touargua health sector with a relative risk of 2. The third zone is composed of 2 clusters, one centered on the Bab Rha health sector with an RR of 3.8 and the other is around the Riad health sector with an RR of 4. The fourth zone has two clusters centered on the Zahoua health sector with RRs of 3.1 and 3.7, respectively.
Many studies reported associations between NO2 in ambient air and upper and lower respiratory tract diseases, asthma, pulmonary fibrosis, chronic obstructive pulmonary disease and allergic rhinitis [86].
In 2011, the APHEKOM (improving knowledge and communication for decision making on air pollution and health in Europe) study conducted in 10 major European cities estimated that exposure to vehicular pollution tracers is likely to increase new cases of childhood asthma by 9–25% and COPD by 10–35% in adult subjects over 65 years of age, residing within 150 m of a roadway used by more than 10,000 vehicles per day [87].
In the PIAMA (prevalence and incidence of asthma and mite allergy) cohort, at the age of four, there was an increased risk of developing several allergic and respiratory health indicators among children exposed to high concentrations of traffic tracers at birth [87].
A study from the Montreal area in Canada showed that annual and birth exposure to NO2 was positively associated with the development of asthma. Annual NO2 exposure was also related to exacerbation of childhood asthma [88].
Another study conducted in Atlanta, Georgia, during the 1996 Olympic Games showed that an 11–44% decrease in asthma hospitalizations was associated with a 22% decrease in the number of vehicles driven per week [89].
Lindgren et al. found that adults living within 100 m of a road with more than ten vehicles per minute had a 40% increased risk of asthma and a 64% increased risk of COPD [90]. Meng et al. (2007) [91] also noted a 211% increased risk of contracting asthma symptoms in adults living in a high traffic area (>200,000 vehicles/day within 15 m).
Various studies have also shown that NO2 in ambient air is associated with a significant increase in the risk of emergency room visits and hospitalizations for lower respiratory tract infections [92,93,94,95]. In parallel, the results of controlled exposure studies in humans and epidemiological studies indicate a causal link between short-term exposure to NO2 in ambient air and increased asthma-related morbidity [96,97,98,99,100,101]. In children, exposure to air pollution doubles the risk of pneumonia [102]. Studies have elucidated significant associations between long-term exposure to NO2 in ambient air and increased hospitalizations for pneumonia [103].
In Meknes, the relatively high risks of respiratory pathologies observed in the health sectors of the old Medina (Bni M’Hamed, Sidi Amer, Riad Al Kostani, Bab Belkari, and Riad) are probably due to both the emissions of the means of transport and the type of habitat. This sector is characterized by dense traffic, as it contains the place Zine El Abidine, which is the point of convergence of the city’s bus network and public transport. Avenue Mohammed VI, a nerve center of the city (15,000 vehicles/day), the bus station, and the street Dar Smane recorded the highest levels of NO2. Insufficient sunlight, poor ventilation, and the almost non-existent ventilation of dwellings induce an increase in the indoor relative humidity rate and consequently create favorable conditions for the development and proliferation of a number of microorganisms, including dust mites and molds [104,105], which produce very powerful pneumallergens that are strongly implicated in the exacerbation of existing respiratory pathologies and the development of respiratory diseases in unaffected individuals. The accumulation of pollutants from household work (internal pollution) in poorly ventilated homes with ventilation problems is, according to the WHO, responsible for the death of 1.6 million people each year (i.e., one death every 20 s) [106].
The low incidence of respiratory diseases reported at the Ville Nouvelle health center does not reflect the reality in the field. Indeed, the measurement campaigns conducted during this study (NO2) and those carried out by Ait Bouh (SO2, fine and coarse particles) have shown the existence of relatively high levels compared to other sites surveyed in the city. The main causes are the high density of road traffic, especially at the level of FAR Avenue, Bir Anzarane, McDonald’s traffic circle and El Manouni, and the gas stations, which permanently release significant quantities of volatile organic compounds. This can be explained by the social level of the inhabitants, which pushes many of them to consult private practices. In order to know the real incidence of respiratory diseases, it is important to include data from the private sector in this kind of studies, as these diseases are not reportable. In addition, a number of studies have shown a very positive correlation between the social level and the incidence of certain diseases due to exposure to air pollution [107,108]. A Canadian study shows that while the risk of being affected by air pollution for high-income subjects with high exposure to air pollution is 33% higher than that of the general Canadian population, it is 162% higher for low-income subjects. Even when subjects from low-income backgrounds are exposed to low levels of pollutants, their relative risk of being affected by air pollution remains higher than subjects from more affluent backgrounds exposed to high levels of air pollutants (82% versus 33%) [109]. In Rome, Forastiere et al. [110] have shown that populations with a high socio-economic level, living in the city center, are both more exposed to air pollution and less affected by respiratory pathologies than populations in the periphery, which are less exposed but also less favored in socio-economic terms.
The low incidence rates of respiratory diseases associated with low levels of the pollutant in the three health centers of the commune of Ouislane (Ouislane, Saada, and Al Boustane) may be due to consultations in private practices, visits to emergencies, and the purchase of respiratory drugs directly from pharmacies without having recourse to the competent health structures.
The health centers of Sidi Bouzekri and El Wahda, despite their location near the industrial district of Sidi Bouzekri, present low rates of incidence of respiratory diseases. This is perhaps attributed to the fact that most companies represent storage warehouses, not production units. In addition, the transfer of the headquarters of a large part of the companies to the new industrial districts of Sidi Slimane Moule Al Kifane and Mejjat.

5. Conclusions

The assessment of the health impact was based on the study of the epidemiological and spatial profile of health indicators associated with exposure to air pollution tracers.
Women were more affected than men, and residents in areas with heavy road traffic were more affected by respiratory diseases than those near industrial areas.
The highest incidences of the pathologies studied were noted in the working-class neighborhoods of the study area, which are moderately exposed, compared to the downtown health sectors, which are highly exposed to the pollutant studied.
For the neighborhoods of the old Medina (Bni M’Hamed, Sidi Amer, Riad Al Kostani, Bab Rha, and Riad), the incidences of consultations for respiratory pathologies are relatively high, despite the distance of the latter from all sources of air pollution of industrial origin. This suggests that the emissions of the means of transport and the type of habitat are strongly incriminated.
The approach developed could be used as a decision-making tool for the competent authorities in this field and adapted to assess the health and environmental impacts related to exposure to other types of pollutants (pesticides, tracers generated by industrial units, etc.).
Finally, to mitigate the health impacts of road traffic-related air pollution, several actions could be implemented, such as:
-
The replacement of fossil fuel vehicles by electric and hybrid cars;
-
The creation of low emission zones;
And the implementation of alternating traffic and urban tolls;

Author Contributions

I.E.G.: bibliographic research, data collection and processing, and writing of the manuscript. I.B. and A.M.: statistical processing and proofreading of the manuscript. M.A.: Scientific supervision. S.E.J. and M.-P.K.: elaboration of the research protocol, supervision of the study and validation of the manuscript. All authors have read and agreed to the published version of the manuscript.

Funding

This work is supported by the SEBIO PRD Project (2017–2022) funded by the Academy of Research and Higher Education. APC are funded by the Catholic University of Louvain La-Neuve.

Institutional Review Board Statement

Not applicable.

Informed Consent Statement

Not applicable.

Acknowledgments

The authors acknowledge the support of the Academy of Research and Higher Education (ARES) through the funding of post-doc stays at the Catholic University of Louvain La-Neuve, Belgium.

Conflicts of Interest

The authors declare no conflict of interest in relation to this article.

References

  1. OMS. Neuf Personnes sur 10 Respirent un Air Pollué dans le Monde; Communiqué de Presse de l’Organisation Mondiale de la Santé: Geneve, Switzerland, 2018. [Google Scholar]
  2. Dockery, D.W.; Pope, C.A., III; Xu, X.; Spengler, J.D.; Ware, J.H.; Fay, M.E.; Ferris, B.G., Jr.; Speizer, F.E. An association between air pollution and mortality in six U.S. cities. N. Engl. J. Med. 1993, 329, 1753–1759. [Google Scholar] [CrossRef] [PubMed] [Green Version]
  3. Lipsett, M.J.; Ostro, B.D.; Reynolds, P.; Goldberg, D.; Hertz, A.; Jerrett, M.; Smith, D.F.; Garcia, C.; Chang, E.T.; Bernstein, L. Long-Term Exposure to Air Pollution and Cardiorespiratory Disease in the California Teachers Study Cohort. Am. J. Respir. Crit. Care Med. 2011, 184, 828–835. [Google Scholar] [CrossRef] [PubMed] [Green Version]
  4. Shah, A.S.V.; Langrish, J.P.; Nair, H.; McAllister, D.A.; Hunter, A.L.; Donaldson, K.; Newby, D.E.; Mills, N.L. Global association of air pollution and heart failure: A systematic review and meta-analysis. Lancet 2013, 382, 1039–1048. [Google Scholar] [CrossRef] [Green Version]
  5. Thurston, G.D.; Burnett, R.T.; Turner, M.C.; Shi, Y.; Krewski, D.; Lall, R.; Ito, K.; Jerrett, M.; Gapstur, S.M.; Diver, W.R.; et al. Ischemic heart disease mortality and long-term exposure to source-related components of U.S. fine particle air pollution. Environ. Health Perspect. 2016, 124, 785–794. [Google Scholar] [CrossRef] [Green Version]
  6. Liu, C.-C.; Tsai, S.-S.; Chiu, H.-F.; Wu, T.-N.; Chen, C.-C.; Yang, C.-Y. Ambient Exposure to Criteria Air Pollutants and Risk of Death from Bladder Cancer in Taiwan. Inhal. Toxicol. 2009, 21, 48–54. [Google Scholar] [CrossRef]
  7. Turner, M.C.; Jerrett, M.; Pope, C.A., III; Krewski, D.; Gapstur, S.M.; Diver, W.R.; Beckerman, B.S.; Marshall, J.D.; Su, J.; Crouse, D.L.; et al. Long-term ozone exposure and mortality in a large prospective study. Am. J. Respir. Crit. Care Med. 2016, 193, 1134–1142. [Google Scholar] [CrossRef] [Green Version]
  8. AlAmoudi, O. Prevalence of respiratory diseases in hospitalized patients in Saudi Arabia: A 5 years study 1996–2000. Ann. Thorac. Med. 2006, 1, 76. [Google Scholar] [CrossRef]
  9. Sultana, T.; Afzal, A.; Sultana, S.; Al-Ghanim, K.; Shahid, T.; Jabeen, Z.; Turab, N.; Ahmed, Z.; Mahboob, S. Epidemiological estimates of respiratory diseases in the hospital population, Faisalabad, Pakistan. Braz. Arch. Biol. Technol. 2017, 60, e17160358. [Google Scholar] [CrossRef]
  10. Observatoire National de l’Environnement et du Développement Durable du Maroc (ONEED). 3 éme Rapport sur l’état de L’environnement du Maroc. Rapport: Ministère Délégué Auprès du Ministère de l’énergie des Mines, de l’eau et de L’environnement du Royaume du Maroc. 2015. Available online: http://www.environnement.gov.ma/fr/etat-de-l-environnement/119-etatenv/3438-rapport-sur-l-etat-de-l-environnement-au-maroc-reem (accessed on 21 April 2022).
  11. Croitoru, L.; Sarraf, M. Le Coût de la Dégradation de l’Environnement au Maroc; 105633-MA; World Bank Group: Washington, DC, USA, 2017. [Google Scholar]
  12. Organisation Mondiale de la Santé (OMS). Pneumonie; Aide-mémoire n 331, l’Organisation Mondiale de la Santé: Geneve, Switzerland, 2016. [Google Scholar]
  13. Ouarzazi, J.; Terhzaz, M.; Abdellaoui, A.; Bouhafid, A.; Nollet, V.; Dechaux, J.C. Etude descriptive de la mesure de polluants atmosphériques dans l’agglomération de Marrakech. Rev. Pollut. Atmos. 2003, 177, 2268–3798. [Google Scholar] [CrossRef] [Green Version]
  14. El Khoukhi, T.; Cherkaoui, R.; Gaudry, A.; Ayrault, S.; Senhou, A.; Chouak, A.; Moutia, Z.; Chakir, E.M. Air pollution biomonitoring survey in Morocco using k0-INAA. Nucl. Instrum. Methods Phys. Res. Sect. B Beam Interact. Mater. At. 2004, 213, 770–774. [Google Scholar] [CrossRef]
  15. Bounakhla, M.; Fatah, A.; Embarch, K.; Majah, M.I.; Azami, R.; Sabir, A.; Nejjar, A.; Cherkaoui, R.; Gaudry, A. Air pollution Assessment of Salé’s city (Morocco). J. De Phys. IV Fr. 2003, 107, 211–213. [Google Scholar] [CrossRef]
  16. Ait Bouh, H. Application des Techniques d’Analyses Physico-Chimiques aux Questions Environnementales: Évaluation et Suivi de la Qualité de l’Air dans la Ville de Meknès. Ph.D. Thesis, Faculté des Sciences, Université Moulay Ismail, Meknes, Morocco, 2012; 230p. [Google Scholar]
  17. Monna, F.; Bouchaou, L.; Rambeau, C.; Losno, R.; Bruguier, O.; Dongarrà, G.; Black, S.; Chateau, C. Lichens used as monitors of atmospheric pollution around Agadir (Southwestern Morocco)—A case study predating lead-free gasoline. Water Air Soil Pollut. 2012, 223, 1263–1274. [Google Scholar] [CrossRef]
  18. Tahri, M.; Bounakhla, M.; Zghaïd, M.; Noack, Y.; Benyaïch, F.; Benchrif, A. Evaluation of airborne particulate matter pollution in Kenitra City, Morocco. Rev. Ambiente Água Interdiscip. J. Appl. Sci. 2013, 8, 38–47. [Google Scholar] [CrossRef]
  19. Alami, F.Z.O.; Elabidi, A.; Mouhir, L.; Fekhaoui, M. Utilisation des lichens comme bio-indicateurs de la pollution atmosphérique par le plomb, cadmium et zinc de la région de Rabat-Sale-Zemmour-Zaêr (Maroc). Afr. Sci. 2014, 10, 89–106. [Google Scholar]
  20. El Rhzaoui, G.; Divakar, P.K.; Crespo, A.; Tahiri, H. Biomonitoring of air pollutants by using lichens (Evernia prunastri) in areas between Kenitra and Mohammedia cities in Morocco. Lazaroa 2015, 36, 21–30. [Google Scholar] [CrossRef] [Green Version]
  21. Kouddane, N.; Mouhir, L.; Fekhaoui, M.; Elabidi, A.; Benaakame, R. Monitoring air pollution at Mohammedia (Morocco): Pb, Cd and Zn in the blood of pigeons (Columba livia). Ecotoxicology 2016, 25, 720–726. [Google Scholar] [CrossRef]
  22. Chirmata, A.; Leghrib, R.; Ichou, I.A. Implementation of the Air Quality Monitoring Network at Agadir City in Morocco. J. Environ. Prot. 2017, 8, 540–567. [Google Scholar] [CrossRef] [Green Version]
  23. Inchaouh, M.; Tahiri, M. Air pollution due to road transportation in Morocco: Evolution and impacts. J. Multidiscip. Eng. Sci. Technol. (JMEST) 2017, 4, 7547–7552. [Google Scholar]
  24. Ministère de l’Aménagement du Territoire; de l’Eau et de l’Environnement/Ministère de la Santé (MATEE/MS). Etude Casa Airpol: Evaluation de l’Impact de la Pollution Atmosphérique sur la Santé des Populations des Populations dans le Grand Casablanca, Résumé des Résultats. 2000. Available online: https://www.environnement.gov.ma/fr/partenariat-cooperation/partenariat/universites/94-preventions-des-risques/impact-sanitaire-de-la-pollution (accessed on 16 April 2022).
  25. Ministère de l’Aménagement du Territoire, de l’Eau et de l’Environnement/Ministère de la Santé (MATEE/MS). Etude Mohammedia Airpol: Evaluation de l’Impact de la Pollution Atmosphérique sur la Santé des Enfants Asthmatiques de Mohammedia, Résumé des Résultats. 2003. Available online: http://www.environnement.gov.ma/fr/partenariat-cooperation/94-preventions-des-risques/impact-sanitaire-de-la-pollution/186-moham-airpol (accessed on 16 April 2022).
  26. Ouhakki, H. Étude de la Pollution de l’Air de la Ville de Meknès par les Poussières: Cas des Poussières de la Cimenterie LAFARGE-Ciment Meknès. Master’s Thesis, Université Moulay Ismail, Meknes, Morocco, 2009; 130p. [Google Scholar]
  27. Ait Bouh, H.; Benyaich, F.; Bounakhla, M.; Noack, Y.; Tahri, M.; Zahry, F. Variations Saisonnières des particules atmosphériques et ses composants chimiques dans la Ville de Meknès–Maroc. J. Mater. Environ. Sci. 2013, 4, 49–62. [Google Scholar]
  28. Ait Bouh, H.; Benyaich, F.; Bounakhla, M.; Noack, Y.; Zahry, F.; Tahri, M. Introduction à la pollution atmospherique dans la ville de Meknès: Dioxyde de soufre, ozone et matière particulaire en suspension. Les Technol. Lab. 2014, 8, 192–196. [Google Scholar]
  29. Abdouh, M.; El Harouni, A.; Mechkouri, A. Le Secteur de L’habitat dans la Région Meknès-Tafilalet: Performances et limites; avec le concours du ministère de l’Habitat et de l’Urbanisme; Faculté des Lettres et Sciences Humaines de Meknès: Meknes, Morocco, 2002. [Google Scholar]
  30. Ministère d’Equipement, de Transport et de la Logistique (METL). Transport Routier en Chiffres (2006–2014). Ministère d’Equipement, de Transport et de la Logistique du Royaume du Maroc. 2015. Available online: http://www.equipement.gov.ma/chiffrescles/Routier/Pages/Transport-routier-en-chiffres.aspx (accessed on 16 April 2022).
  31. Abdouh, M.; El Atrouz, A.; Mechkouri, A. Profil Environnemental de Meknès, Agenda 21 Locaux Pour la Promotion de l’Environnement et du Développement Durable en Milieu Urbain; Ministère de l’Aménagement du Territoire, de l’Eau et de l’Environnement: Rabat, Morocco, 2004; 94p. [Google Scholar]
  32. El Ghazi, I. L’utilisation du SIG Pour l’Analyse de la Relation Entre la Pollution Atmosphérique et l’Incidence de Certaines Maladies Respiratoires et Cardiovasculaires au Niveau de la Ville de Meknès. Master’s Thesis, Université Moulay Ismail-Meknès, Meknes, Morocco, 2012. [Google Scholar]
  33. Belhassan, M. Les Bioindicateurs Végétaux de la Pollution de l’Air au Niveau de la Ville de Meknès. Master’s Thesis, Université Moulay Ismail-Meknès, Meknes, Morocco, 2012. [Google Scholar]
  34. Vallet, J.; Kamel, S.; Bromblet, P.; Meunier, J.; Mahjoubi, R.; Ajakane, R.; Bouabib, R.; Noack, Y.; Borschnek, D. Study of the historical buildings of Meknès (Morocco) and their alterations–Proposal of various tools for their conservation. In Proceedings of the 7th European Commission Conference “SAUVEUR”, Prague, Czech Republic, 31 May–3 June 2006; Volume 2, pp. 1090–1093. [Google Scholar]
  35. Ministère de l’Habitat et de la Politique de la Ville (MHPV). Etude du Schéma Régional d’Aménagement du Territoire (SRAT) de la Région Meknès-Tafilalt. Inspection Régionale de l’Habitat, de l’Urbanisme et de la Politique de la Ville, Meknès-Tafilalt. 2012. Available online: http://www.region-fes-meknes.ma/fr/administration-regionale/etudes/schema-regional-damenagement-du-territoire/ (accessed on 21 April 2022).
  36. Ministère de l’Intérieur. Monographie de la Région Fès-Meknès. Direction Générale des Collectivités Locales, Ministère de l’Intérieur du Royaume du Maroc. 2015. Available online: http://www.equipement.gov.ma/Carte-Region/RegionFes/Presentation-de-la-region/Monographie/Pages/Monographie-de-la-region.aspx (accessed on 21 April 2022).
  37. Haut-Commissariat au Plan (HCP). Recensement Général de la Population et de l’Habitat 2014. Direction Régionale de Meknès-Tafilalt. 2015. Available online: www.hcp.ma (accessed on 16 April 2022).
  38. Driouech, F. Distribution des Précipitations Hivernales sur le Maroc dans le Cadre d’un Changement Climatique: Descente d’Échelle et Incertitude. Ph.D. Thesis, Université de Toulouse, Institut National Polytechnique de Toulouse, Toulouse, France, 2010. [Google Scholar]
  39. Vione, D.; Maurino, V.; Minero, C.; Pelizzetti, E.; Harrison, M.A.J.; Olariu, R.-I.; Arsene, C. Photochemical reactions in the tropospheric aqueous phase and on particulate matter. Chem. Soc. Rev. 2006, 35, 441–453. [Google Scholar] [CrossRef] [PubMed]
  40. Stock, Z.S.; Russo, M.R.; Butler, T.M.; Archibald, A.T.; Lawrence, M.G.; Telford, P.J.; Abraham, N.L.; Pyle, J.A. Modelling the impact of megacities on local, regional and global tropospheric ozone and the deposition of nitrogen species. Atmos. Chem. Phys. 2013, 13, 12215–12231. [Google Scholar] [CrossRef] [Green Version]
  41. Meybeck, M.; Della Massa, J.-P.; Simon, V.; Grasset, E.; Toress, L. Etude de la Distribution Atmosphérique de Composés Organiques Volatils Aromatiques: Benzène, Toluène, Xylènes (BTX) et du Dioxyde d’Azote sur l’Agglomération Toulousaine. Pollut. Atmos. Clim. St. Société 2000, 168, 569–582. [Google Scholar] [CrossRef] [Green Version]
  42. Akdemir, A. The creation of pollution mapping and measurement of ambient concentration of sulfur dioxide and nitrogen dioxide with passive sampler. J. Environ. Health Sci. Eng. 2014, 12, 111. [Google Scholar] [CrossRef] [Green Version]
  43. Organisation Mondiale de la Santé (OMS). Health Effects of Transport-Related Air Pollution; World Health Organization Regional Office for Europe: Copenhagen, Denmark, 2005. [Google Scholar]
  44. Health Effects Institute (HEI). Traffic-Related Air Pollution: A Critical Review of the Literature on Emissions, Exposure, and Health Effects; HEI Special Report 17; Health Effects Institute: Boston, MA, USA, 2010. [Google Scholar]
  45. De Saeger, E.; Gerbolès, M.; Payrissat, M. La surveillance du Dioxyde d’azote à Madrid au Moyen D’échantillonneurs Passifs. Evaluation Critique de la Conception du Réseau; Rapport de la Commission Européenne, Institut de l’Environnement EUR 14175: Brussels, Belgium, 1991; 60p. [Google Scholar]
  46. Fouque, S.G.; Plaisance, H.; Houdret, J.-L.; Mathé, F.; Galloo, J.-C.; Guillermo, R. Improvements of passive sampling techniques for the measurements of ozone, nitrogen dioxide and sulfur dioxide in ambient air. In Proceedings of the Conférence Internationale de Venise Air quality in Europe: Challenges for the 2000s, Venice, Italy, 21 May 1999; 19–21 Mai. Session Monitoring techniques and standardization, Poster Sampling and Analysis 1999b. [Google Scholar]
  47. Deletraz, G. Géographie des Risques Environnementaux Liés aux Transports Routiers en Montagne: Incidences des Émissions d’Oxydes d’Azote en Vallée d’Aspe et de Biriatou (Pyrénées). Ph.D. Thesis, Université de Pau et des Pays de l’Adour, Pau, France, 2002. [Google Scholar]
  48. Ayers, G.; Keywood, M.; Gillett, R.; Manins, P.; Malfroy, H.; Bardsley, T. Validation of passive diffusion samplers for SO2 and NO2. Atmos. Environ. 1998, 32, 3587–3592. [Google Scholar] [CrossRef]
  49. Glasius, M.; Carlsen, M.F.; Hansen, T.S.; Lohse, C. Measurements of nitrogen dioxide on Funen using diffusion tubes. Atmos. Environ. 1999, 33, 1177–1185. [Google Scholar] [CrossRef]
  50. Brown, R.H. Monitoring the ambient environment with diffusive samplers: Theory and practical considerations. J. Environ. Monit. 2000, 2, 1–9. [Google Scholar] [CrossRef]
  51. Hadad, K.; Safavi, A.; Tahon, R. Air Pollution Assessment in Shiraz by Passive Sampling Techniques. Iran. J. Sci. Technol. Trans. Sci. 2005, 29, 471–480. [Google Scholar] [CrossRef]
  52. Martins, J.; Dhammapala, R.; Lachmann, G.; Galy-Lacaux, C.; Pienaar, J. Long-term measurements of sulphur dioxide, nitrogen dioxide, ammonia, nitric acid and ozone in southern Africa using passive samplers. S. Afr. J. Sci. 2007, 103, 336–342. [Google Scholar]
  53. Adon, M.; Galy-Lacaux, C.; Yoboué, V.; Delon, C.; Lacaux, J.P.; Castera, P.; Gardrat, E.; Pienaar, J.; Al Ourabi, H.; Laouali, D.; et al. Long term measurements of sulfur dioxide, nitrogen dioxide, ammonia, nitric acid and ozone in Africa using passive samplers. Atmos. Chem. Phys. 2010, 10, 7467–7487. [Google Scholar] [CrossRef] [Green Version]
  54. Palmes, E.D.; Gunnison, A.F.; Dimattio, J.; Tomczyk, C. Personal sampler for nitrogen dioxide. Am. Ind. Hyg. Ind. J. 1976, 37, 570–577. [Google Scholar] [CrossRef] [PubMed]
  55. Hafkenscheid, T.; Fromage-Mariette, A.; Goelen, E.; Hangartner, M.; Pfeffer, U.; Plaisance, H.; de Santis, F.; Saunders, K.; Swaans, W.; Tang, Y.S.; et al. Review of the Application of Diffusive Samplers in the European Union for the Monitoring of Nitrogen Dioxide in Ambient Air; JRC Scientific and Technical Reports; European Commission: Luxembourg, Germany, 2009. [Google Scholar]
  56. Pienaar, J.; Beukes, J.P.; Van Zyl, P.G.; Lehmann, C.; Aherne, J. Chapter 2-Passive Diffusion Sampling Devices for Monitoring Ambient Air Concentrations. In Comprehensive Analytical Chemistry; Forbes, P.B., Ed.; Elsevier: Amsterdam, The Netherlands, 2015; Volume 70, pp. 13–52. [Google Scholar]
  57. NBN EN 16339; Ambient air-Method for the Determination of the Concentration of Nitrogen Dioxide by Diffusive Sampling. European standard: Brussels, Belgium, 2013.
  58. Boularab, I. Pollution Atmosphérique Due au Dioxyde d’Azote: Mise au Point d’un Indicateur Composite Pour la Ville de Meknès. Ph.D. Thesis, Université Moulay Ismail, Faculté des Sciences de Meknès, Meknes, Morocco, 2018; 224p. [Google Scholar]
  59. Puddu, M.; Bayingana, K.; Tafforeau, J. L’Asthme et la Pollution de l’Air: Etat des Connaissances et Données Disponibles Pour le Développement d’une Politique de Santé en Belgique; IPH/EPI Reports Nr. 2003–012, N° de dépôt: D/2003/2505/23; Institut Scientifique de la Santé Publique: Brussels, Belgium, 2003. [Google Scholar]
  60. Just, A.; Nikasinovic, L.; Laoudi, Y.; Grimfeld, A. Pollution de l’air et asthme de l’enfant. Rev. Française D’Allergol. D’Immunol. Clin. 2007, 47, 207–213. [Google Scholar] [CrossRef]
  61. Laurinavičienė, D.; Dėdelė, A. Measurement of nitrogen dioxide concentration in cold and warm seasons using a passive sampling method. Biologija 2014, 59, 4. [Google Scholar] [CrossRef] [Green Version]
  62. Monographie Régionale de l’Environnement, Région Meknès Tafilalet. 2001; 64p, Available online: https://www.hcp.ma/downloads/Monographies-regionales_t11957.html (accessed on 21 April 2022).
  63. Azri, C.; Tlijani, A.; Abida, H.; Maalej, A.; Medhioub, K. Seasonal evolutions of ozone (O3) and its nitrogen precursors (NO, NO2) in urban Sfax (Tunisia). Int. J. Environ. Pollut. 2008, 35, 71. [Google Scholar] [CrossRef]
  64. Lozano, A.; Usero, J.; Vanderlinden, E.; Raez, J.; Contreras, J.; Navarrete, B. Air quality monitoring network design to control nitrogen dioxide and ozone, applied in Malaga, Spain. Microchem. J. 2009, 93, 164–172. [Google Scholar] [CrossRef]
  65. Matte, T.; Ross, Z.; Kheirbek, I.; Eisl, H.; Johnson, S.; Gorczynski, J.; Kass, D.; Markowitz, S.; Pezeshki, G.; Clougherty, J. Monitoring intraurban spatial patterns of multiple combustion air pollutants in New York City: Design and implementation. J. Expo. Sci. Environ. Epidemiol. 2013, 23, 223–231. [Google Scholar] [CrossRef]
  66. Jerrett, M.; Arain, A.; Kanaroglou, P.; Beckerman, B.; Potoglou, D.; Sahsuvaroglu, T.; Morrison, J.; Giovis, C. A review and evaluation of intraurban air pollution exposure models. J. Expo. Sci. Environ. Epidemiol. 2004, 15, 185–204. [Google Scholar] [CrossRef]
  67. Short, L.; Frey, R.; Benter, T. Simultaneous measurement of nitric oxide (NO) and Nitrogen Dioxide (NO2) in simulated automobile exhaust using medium pressure ionization-mass spectrometry. Appl. Spectrosc. 2006, 60, 208–216. [Google Scholar] [CrossRef]
  68. Behera, S.N.; Sharma, M.; Mishra, P.; Nayak, P.; Damez-Fontaine, B.; Tahon, R. Passive measurement of NO2 and application of GIS to generate spatially-distributed air monitoring network in urban environment. Urban Clim. 2015, 14, 396–413. [Google Scholar] [CrossRef]
  69. Parra, M.; Elustondo, D.; Bermejo, R.; Santamaría, J. Ambient air levels of volatile organic compounds (VOC) and nitrogen dioxide (NO2) in a medium size city in Northern Spain. Sci. Total Environ. 2009, 407, 999–1009. [Google Scholar] [CrossRef]
  70. Smith, L.; Mukerjee, S.; Gonzales, M.; Stallings, C.; Neas, L.; Norris, G.; Özkaynak, H. Use of GIS and ancillary variables to predict volatile organic compound and nitrogen dioxide levels at unmonitored locations. Atmos. Environ. 2006, 40, 3773–3787. [Google Scholar] [CrossRef]
  71. Defra. Review of Transboundary Air Pollution (RoTAP): Acidification, Eutrophication, Ground Level Ozone and Heavy Metals in the UK; Centre for Ecology and Hydrology: Midlothian, UK, 2012.
  72. Niepsch, D.; Clarke, L.J.; Tzoulas, K.; Cavan, G. Spatiotemporal variability of nitrogen dioxide (NO2) pollution in Manchester (UK) city centre (2017–2018) using a fine spatial scale single-NOx diffusion tube network. Env. Geochem. Health 2021. [Google Scholar] [CrossRef] [PubMed]
  73. Lin, C.; Feng, X.; Heal, M.R. Temporal persistence of intra-urban spatial contrasts in ambient NO2, O3 and Ox in Edinburgh, UK. Atmos. Pollut. Res. 2016, 7, 734–741. [Google Scholar] [CrossRef] [Green Version]
  74. Wheeler, A.J.; Smith-Doiron, M.; Xu, X.; Gilbert, N.L.; Brook, J.R. Intra-urban variability of air pollution in Windsor, Ontario—Measurement and modeling for human exposure assessment. Environ. Res. 2008, 106, 7–16. [Google Scholar] [CrossRef]
  75. Moodley, K.G.; Singh, S.; Govender, S. Passive monitoring of nitrogen dioxide in urban air: A case study of Durban metropolis, South Africa. J. Environ. Manag. 2011, 92, 2145–2150. [Google Scholar] [CrossRef]
  76. Lewné, M.; Cyrys, J.; Meliefste, K.; Hoek, G.; Brauer, M.; Fischer, P.; Gehring, U.; Heinrich, J.; Brunekreef, B.; Bellander, T. Spatial variation in nitrogen dioxide in three European areas. Sci. Total Environ. 2004, 332, 217–230. [Google Scholar] [CrossRef]
  77. Pekey, B.; Ozaslan, U. Spatial Distribution of SO2, NO2, and O3 Concentrations in an Industrial City of Turkey Using a Passive Sampling Method. Clean Soil Air Water 2013, 41, 423–428. [Google Scholar] [CrossRef]
  78. Fadel, D.; Laifa, A.; Djamai, R.; Kholladi, M. Metrological data of some air pollutants in a town in north-eastern Algeria for use in epidemiological studies: Case of respiratory. Phys. Chem. News 2011, 57, 135–140. [Google Scholar]
  79. Habermann, M.; Billger, M.; Haeger-Eugensson, M. Land use Regression as Method to Model Air Pollution. Previous Results for Gothenburg/Sweden. Procedia Eng. 2015, 115, 21–28. [Google Scholar] [CrossRef] [Green Version]
  80. Fernandez-Somoano, A.; Tardon, A. Socioeconomic status and exposure to outdoor NO2 and benzene in the Asturias INMA birth cohort, Spain. J. Epidemiol. Community Health 2014, 68, 29–36. [Google Scholar] [CrossRef] [Green Version]
  81. Stevenson, K.; Bush, T.; Mooney, D. Five years of nitrogen dioxide measurement with diffusion tube samplers at over 1000 sites in the UK. Atmos. Environ. 2001, 35, 281–287. [Google Scholar] [CrossRef]
  82. Kirenga, B.J.; Meng, Q.; Van Gemert, F.; Aanyu-Tukamuhebwa, H.; Chavannes, N.; Katamba, A.; Obai, G.; Van Der Molen, T.; Schwander, S.; Mohsenin, V. The State of Ambient Air Quality in Two Ugandan Cities: A Pilot Cross-Sectional Spatial Assessment. Int. J. Environ. Res. Public Health 2015, 12, 8075–8091. [Google Scholar] [CrossRef] [PubMed] [Green Version]
  83. Caballero, S.; Esclapez, R.; Galindo, N.; Mantilla, E.; Crespo, J. Use of a passive sampling network for the determination of urban NO2 spatiotemporal variations. Atmos. Environ. 2012, 63, 148–155. [Google Scholar] [CrossRef]
  84. Ahmad, S.S.; Biiker, P.; Emberson, L.; Shabbir, R. Monitoring Nitrogen Dioxide Levels in Urban Areas in Rawalpindi, Pakistan. Water Air Soil Pollut. 2011, 220, 141–150. [Google Scholar] [CrossRef]
  85. Salem, A.A.; Soliman, A.A.; El-Haty, I.A. Determination of nitrogen dioxide, sulfur dioxide, ozone, and ammonia in ambient air using the passive sampling method associated with ion chromatographic and potentiometric analyses. Air Qual. Atmos. Health 2009, 2, 133–145. [Google Scholar] [CrossRef] [Green Version]
  86. United States Environmental Protection Agency (U.S. EPA). Integrated Science Assessment (ISA) for Nitrogen Dioxide–Health Criteria; Office of Research and Development, United States Environmental Protection Agency: Washington, DC, USA, 2008.
  87. Declercq, C.; Pascal, M.; Chanel, O.; Corso, M.; Ung, A.; Pascal, L.; Blanchard, M.; Larrieu, S.; Medina, S. Impact Sanitaire de la Pollution Atmosphérique dans Neuf Villes Françaises. Résultats du Projet Aphekom; Institut de veille sanitaire: Saint-Maurice, France, 2012; 33p. [Google Scholar]
  88. Tétreault, L.-F. Asthme Infantile et Polluants du Trafic Routier. Ph.D. Thesis, Université de Montréal, Montreal, QC, Canada, 2016; 268p. [Google Scholar]
  89. Friedman, M.S.; Powell, K.E.; Hutwagner, L.; Graham, L.M.; Teague, W.G. Impact of Changes in Transportation and Commuting Behaviors During the 1996 Summer Olympic Games in Atlanta on Air Quality and Childhood Asthma. JAMA 2001, 285, 897–905. [Google Scholar] [CrossRef]
  90. Lindgren, A.; Stroh, E.; Montnémery, P.; Nihlén, U.; Jakobsson, K.; Axmon, A. Traffic-related air pollution associated with prevalence of asthma and COPD/chronic bronchitis. A cross-sectional study in Southern Sweden. Int. J. Health Geogr. 2009, 8, 2. [Google Scholar] [CrossRef] [Green Version]
  91. Meng, Y.-Y.; Wilhelm, M.; Rull, R.; English, P.; Ritz, B. Traffic and outdoor air pollution levels near residences and poorly controlled asthma in adults. Ann. Allergy, Asthma Immunol. 2007, 98, 455–463. [Google Scholar] [CrossRef]
  92. Halonen, J.I.; Lanki, T.; Yli-Tuomi, T.; Kulmala, M.; Tiittanen, P.; Pekkanen, J. Urban air pollution, and asthma and COPD hospital emergency room visits. Thorax 2008, 63, 635–641. [Google Scholar] [CrossRef] [Green Version]
  93. Sinclair, A.H.; Edgerton, E.S.; Wyzga, R.; Tolsma, D. A two-time-period comparison of the effects of ambient air pollution on outpatient visits for acute respiratory illnesses. J. Air Waste Manag. Assoc. 2010, 60, 163–175. [Google Scholar] [CrossRef] [Green Version]
  94. Grineski, S.; Staniswalis, J.; Bulathsinhala, P.; Peng, Y.; Gill, T. Hospital admissions for asthma and acute bronchitis in El Paso, Texas: Do age, sex, and insurance status modify the effects of dust and low wind events? Environ. Res. 2011, 111, 1148–1155. [Google Scholar] [CrossRef] [PubMed] [Green Version]
  95. Faustini, A.; Stafoggia, M.; Colais, P.; Berti, G.; Bisanti, L.; Cadum, E.; Cernigliaro, A.; Mallone, S.; Scarnato, C.; Forastiere, F. Air pollution and multiple acute respiratory outcomes. Eur. Respir. J. 2013, 42, 304–313. [Google Scholar] [CrossRef] [PubMed] [Green Version]
  96. Burra, T.A.; Moineddin, R.; Agha, M.M.; Glazier, R.H. Social disadvantage, air pollution, and asthma physician visits in Toronto, Canada. Environ. Res. 2009, 109, 567–574. [Google Scholar] [CrossRef] [PubMed]
  97. Castro-Giner, F.; Kunzli, N.; Jacquemin, B.; Forsberg, B.; de Cid, R.; Sunyer, J.; Jarvis, D.; Briggs, D.; Vienneau, D.; Norback, D.; et al. Traffic-related air pollution, oxidative stress genes, and asthma (ECHRS). Environ. Health Perspect. 2019, 117, 1919–1924. [Google Scholar] [CrossRef] [Green Version]
  98. Jacquemin, B.; Sunyer, J.; Forsberg, B.; Aguilera, I.; Briggs, D.; Garcia-Esteban, R.; Gotschi, T.; Heinrich, J.; Järvholm, B.; Jarvis, D.; et al. Home outdoor NO2 and new onset of self-reported asthma in adults. Epidemiology 2009, 20, 119–126. [Google Scholar] [CrossRef]
  99. Modig, L.; Toren, K.; Janson, C.; Jarvholm, B.; Forsberg, B. Vehicle exhaust outside the home and onset of asthma among adults. Eur. Respir. J. 2009, 33, 1261–1267. [Google Scholar] [CrossRef] [Green Version]
  100. Gruzieva, O.; Bergström, A.; Hulchiy, O.; Kull, I.; Lind, T.; Melén, E.; Moskalenko, V.; Pershagen, G.; Bellander, T. Exposure to Air Pollution from Traffic and Childhood Asthma Until 12 Years of Age. Epidemiology 2013, 24, 54–61. [Google Scholar] [CrossRef]
  101. To, T.; Shen, S.; Atenafu, E.; Guan, J.; McLimont, S.; Stocks, B.; Licskai, C. The Air Quality Health Index and Asthma Morbidity: A Population-Based Study. Environ. Healh Perspect. 2013, 121, 46–52. [Google Scholar] [CrossRef]
  102. Organisation Mondiale de la Santé (OMS). Classification et Traitement des Cas de Pneumonie Chez l’Enfant dans les Établissements de Santé Selon l’OMS; 2014; Available online: https://www.who.int/fr/publications-detail/9789241507813 (accessed on 21 April 2022).
  103. Neupane, B.; Jerrett, M.; Burnett, R.; Marrie, T.; Arain, A.; Loeb, M. Long-term exposure to ambient air pollution and risk of hospitalization with community-acquired pneumonia in older adults. Am. J. Respir. Crit. Care Med. 2010, 181, 47–53. [Google Scholar] [CrossRef]
  104. Harrison, P.T. Creature comforts—living with mites and moulds. Clin. Exp. Allergy 1999, 29, 148–149. [Google Scholar] [CrossRef]
  105. Hirsch, T.; Hering, M.; Bürkner, K.; Hirsch, D.; Leupold, W.; Kerkmann, M.-L.; Kuhlisch, E.; Jatzwauk, L. House-dust-mite allergen concentrations (Der f 1) and mold spores in apartment bedrooms before and after installation of insulated windows and central heating systems. Allergy 2000, 55, 79–83. [Google Scholar] [CrossRef] [PubMed]
  106. OMS. La Pollution de l’Air à l’Intérieur des Habitations et la Santé. Aide-Mémoire N° 292. 2005. Available online: https://www.who.int/fr/news-room/household-air-pollution-and-health (accessed on 21 April 2022).
  107. Wheeler, B.W.; Ben-Shlomo, Y. Environmental equity, air quality, socioeconomic status, and respiratory health: A linkage analysis of routine data from the Health Survey for England. J. Epidemiol. Community Health 2005, 59, 948–954. [Google Scholar] [CrossRef] [PubMed] [Green Version]
  108. Cakmak, S.; Dales, R.E.; Judek, S. Respiratory Health Effects of Air Pollution Gases: Modification by Education and Income. Arch. Environ. Occup. Health 2006, 61, 5–10. [Google Scholar] [CrossRef]
  109. Depoorter, S.; Niklaus, D.; Rafenberg, C. Rapport de la Commission des comptes et de l’Économie de l’Environnement Santé et Qualité de l’Air Extérieur. Commissariat Général au Développement Durable. 2012; 102p, Available online: http://temis.documentation.developpement-durable.gouv.fr/document.html?id=Temis-0076467 (accessed on 15 April 2022).
  110. Forastiere, F.; Stafoggia, M.; Tasco, C.; Picciotto, S.; Agabiti, N.; Cesaroni, G.; Perucci, C. Socioeconomic status, particulate air pollution, and daily mortality: Differential exposure or differential susceptibility. Am. J. Ind. Med. 2007, 50, 208–216. [Google Scholar] [CrossRef] [PubMed]
Figure 1. Location of the city of Meknes.
Pollutants 02 00020 g001
Figure 2. Location of sampling sites.
Pollutants 02 00020 g002
Figure 3. Location of counting sites.
Pollutants 02 00020 g003
Figure 4. Location of health structures in the city of Meknes.
Pollutants 02 00020 g004
Figure 5. Increasing distribution of sites by NO2 concentration.
Pollutants 02 00020 g005
Figure 6. Spatial variations of NO2 levels as a function of average road traffic.
Pollutants 02 00020 g006
Figure 7. Average annual incidences of respiratory consultations in subjects aged five years and older by health center.
Pollutants 02 00020 g007
Figure 8. Average annual incidences of consultations in subjects over five years of age by health center overlaid with NO2 levels.
Pollutants 02 00020 g008
Figure 9. The annual average incidence of respiratory infection consultations (pneumonia and severe pneumonia) by the health center.
Pollutants 02 00020 g009
Figure 10. The average annual incidence of respiratory infection consultations (pneumonia and severe pneumonia) by health center as a function of nitrogen dioxide concentrations.
Pollutants 02 00020 g010
Table 1. Distribution of sampling sites by type and location.
PointsLocationTypology
P1Point of intersection between the national road n°13 and the national road n°6traffic
P2Point of intersection of Bir Anzarane Avenue and Zitoune Boulevardtraffic
P3Zitoune Avenue (Marjane district)traffic
P4Point of intersection of Bir Anzarane Avenue and the Avenue of the Royal Armed Forcestraffic
P5Avenue of the Royal Armed Forces (FAR) near the main stationtraffic
P6Point of intersection of Mohammed VI Avenue and the Avenue of the Royal Armed Forcestraffic
P7Dar Smane Street, the point where the old Medina meets the new citytraffic
P8The bus station of Meknes citytraffic
F1Municipality of ToulalBackground
F2Neighborhood of RiadBackground
F3New city (station of el Amir Abdelkader)Background
F4 The neighborhood of the HaciendaBackground
F5The neighborhood of El BassatineBackground
F6Municipality of OuisslaneBackground
Table 2. Reasons for consultation in subjects aged five years and older by gender.
Consultations
Respiratory
MasculinFemale
Number of Consultations (NC)Percentage (%)Number of ConsultationsPercentage (%)
Acute illnesses56,019467763,7695323
Asthma attacks3996474944185251
Table 3. Reasons for consultation in subjects aged five years and older by age group.
Respiratory Consultations[5–14 Years][15–49 Years]>50 Years
NCPercentage (%)NCPercentage (%)NCPercentage (%)
Acute illnesses42,435354243,780365533,5732802
Asthma attacks87010343576425039684716
Table 4. Reasons for consultation in subjects aged five years and older by season.
Respiratory ConsultationsWinterSpringSummerAutumn
Acute illnesses29.56%24.62%21.13%24.67%
Asthma attacks29.44%22.98%19.95%27.62%
Table 5. Distribution of respiratory diseases in children under five by age.
Respiratory PathologiesAge Group
0–11 Months12–23 Months24–59 Months
Severe pneumonia51.15%28.12%20.72%
Pneumonia30.75%31.57%37.67%
Table 6. Seasonal distribution of respiratory diseases in children under five years of age.
Respiratory PathologiesWinterSpringSummerAutumn
Severe pneumonia40.61%22.29%10.82%26.27%
Pneumonia39.93%20.45%13.11%26.49%
Publisher’s Note: MDPI stays neutral with regard to jurisdictional claims in published maps and institutional affiliations.

