Article

The Evaluation of the Impact of a Saharan Event on Particulate Matter Using Compositional Data Analysis

IMAA, Istituto di Metodologie per l’Analisi Ambientale, CNR, C.da S. Loja—Zona Industriale, 85050 Tito Scalo, PZ, Italy
*
Author to whom correspondence should be addressed.
Pollutants 2022, 2(1), 1-11; https://doi.org/10.3390/pollutants2010001
Submission received: 29 September 2021 / Revised: 3 December 2021 / Accepted: 23 December 2021 / Published: 4 January 2022
(This article belongs to the Section Air Pollution)

Abstract

:
The proposed approach based on compositional data analysis was applied on simultaneous measurements of the mineral element concentrations of PM10 and PM2.5 from a typical suburban site with and without a Saharan event. The suburban site is located in the city of Rome. The selected mineral elements were Al, Si, Ca, Fe, Ti, Mg, and Sr. The data relating to these elements are reported in a previous study. The considered elements are mainly related to mineral matter. The proposed approach allows statistically validating that the mineral element concentrations of PM during days with a Saharan event differ from those without a Saharan event in terms of mineral element composition and size distribution. In particular, the results showed that the compositional data analysis applied to simultaneous measurements of mineral element concentrations of PM10 and PM2.5 is a helpful technique that can be used to study environmental sites affected by natural sources such as Saharan events. Moreover, the presented technique can be handy in all those conditions where it is important to discriminate whether the occurrence of an exceedance or a violation of the daily limit value established for PM could also be due to natural sources.

1. Introduction

Aerosol particles, also known as particulate matter (PM), have been known to play a central role in air quality and public health [1,2,3,4,5]. Respirable aerosol particles with an aerodynamic diameter smaller than 10 μm (PM10) are of particular interest because they can easily penetrate and be deposited in specific regions of the respiratory tract, delivering to the body a wide variety of elements and chemical compounds which, to some extent, are related to PM toxicity [6,7]. A considerable body of evidence has shown “lines that connect” PM exposure to cardiovascular and respiratory diseases [8]. In the light of the aforesaid effect of PM on public health, international and governmental institutions have issued recommendations and regulations regarding the levels of PM into the air [9,10].
The EU directive on environmental air quality and cleaner air for Europe (Directive 2008/50/EC) [11] establishes annual and daily limit values for PM mass concentration (i.e., 40 μg/m3 and 20 μg/m3 for PM10 and PM2.5, respectively) as well as a number of permitted annual limit exceedances/violations for the PM10 daily limit value (i.e., not exceeding the daily value of 50 μg/m3 more than 35 days per year). However, the exceedances/violations due in part or in whole to the contribution of natural sources of PM (that can be assessed but not controlled e.g., “atmospheric re-suspension or transport of natural particles from dry regions”) can be subtracted from the total amount of recorded annual exceedances/violations when assessing compliance with established limit values. Indeed, the atmospheric re-suspension and transport of natural particles from dry regions over the Mediterranean Sea toward the European continent in a Saharan event [12,13,14] represents the natural source that most frequently influences PM in Europe [15]. Saharan event intrusions are relatively short time events that can last from a few days to about a week [16,17,18]. These events have been recorded in South, Central, and Western Europe over the last few decades [19], resulting in an effect of mineral dust on air quality, which has become the objective of a number of studies in literature adopting different approaches in the European context [20,21,22] and worldwide [23].
Broadly speaking, the identification of the possible natural and/or anthropic source contributions to PM is a starting point for the evaluation of the impact of PM on the environment and the public health as well as for the development and implementation of policies aimed at mitigating the levels of PM into the air. A meta-analysis conducted on studies performed across Europe identified diverse natural and anthropogenic sources of PM linked to specific chemical elements and compounds. These, such as SO42−, NO3, and NH4+ were mainly linked to secondary aerosol, and the elements V and Ni were mainly linked to fuel–oil combustion. Moreover, the group of elements such as Na, Cl, and Mg were mainly linked to marine sources and sea spray, whereas the group of elements Al, Si, Ca, Fe, Ti, Mg, and Sr were considered as mainly linked to re-suspension, city dust, crustal material, road dust, and African dust (mineral elements) [24]. The above reported links between chemical elements or compounds and the PM sources were due to similarities that could be observed among the PM sampled from several similar environmental sites with a comparable PM load [25]. Nevertheless, the identification of the contribution of different sources of mineral matter to PM such as desert dust, fugitive dust, dust from arable lands, and demolition/construction activities poses a challenging problem, as these sources are characterized by the same range of chemical elements [26].
The evaluation of the contribution of the different sources of mineral matter to PM can be a central issue when assessing compliance with EU PM limit values [24]. In the last two decades, there has been an increasing scientific interest in simultaneous measurements of PM10 and PM2.5. These size fractions can be divided into PM coarse size fraction (i.e., particles with aerodynamic diameters between 2.5 and 10 μm) and fine size fraction (i.e., particles with an aerodynamic diameter below 2.5 μm). The coarse size fraction can mainly be formed through processes of dispersion as disintegration, abrasion, and resuspension, whereas PM fine size fraction can mainly be formed through processes of condensation/reaction as combustion and gas-to-particle conversion processes [27,28,29,30]. PM10 and PM2.5 simultaneous measurements have been performed on a variety of characteristic sites such as urban (e.g., traffic point, kerbside, roadside, background), suburban, rural, industrial, superstation, specific episodes, remote places, and dry arid sites. These successful applications demonstrate that the assessment of these PM size fractions was an effective and consistent tool in the characterization of emission from different possible sources of PM [31,32,33,34,35,36,37,38,39,40,41,42,43,44,45,46].
This preliminary study investigates the application of compositional data analysis on simultaneous measurements of mineral element concentrations of PM10 and PM2.5 on a European site affected by a Saharan event. Compositional data are quantitative descriptions of proportions of some whole and consist of vectors whose components sum to a constant c. The statistical analysis of compositional data began with Aitchison [47,48] and has since undergone several developments and many practical applications, leading it to be considered as a consolidated technique [49,50,51,52,53,54]. The main objectives of this study are to apply the tools provided by compositional data analysis to evaluate the physical–chemical variations in mineral elements of PM due to a Saharan event in an environmental site and provide a possible handy approach to statistically validate whether the occurrence of an exceedance or of a violation of the established daily limit value for PM could also be due to natural sources.

2. Materials and Methods

We performed the simultaneous measurement of the concentrations content of the mineral elements Al, Si, Ca, Fe, Ti, Mg, and Sr in PM10 and PM2.5 in a suburban background site located in Rome with and without a Saharan event. The data presented in this study are as reported in Matassoni [38] (p. 739). The data are relating to several days.
These measurements were conducted in winter, and the sampled PM was analyzed using a Particle-Induced X-ray Emission. The data validation of the Saharan event was performed as reported in the relating literature [38].
Two sets of compositional data were considered: a set of compositional data relating to the elements measured in days with the contribution of the Saharan event to the PM and a set of compositional data relating to the elements measured in days without the contribution of the Saharan event to the PM. The average values were considered.
The next section contains a concise description of the methods applied in the presented study. The statistical software used is R (R software) [55].

2.1. Compositional Data and Sample Space

The components of a compositional data vector are positive numbers that sum to a constant c. The sample space of compositional observation x with two components is the unit simplex
S c 2 = { x = ( x 1 , x 2 ) | x j > 0 ,   j = 1 , 2 ; x 1 + x 2 = c } .
PM10 and PM2.5 simultaneous measurements were decomposed in terms of relative fractions as coarse, see Equation (2), and fine, PM2.5, mass concentration as originally proposed by Lundgren [31]
PM 10 2.5 = PM 10 PM 2.5 .
These size fractions were converted into compositions based on weight proportions following the strategy suggested in Aitchison [56]
x = ( x 1 , x 2 ) = ( PM 10 2.5 / PM 10 , PM 2.5 / PM 10 ) % .
The compositional variables of this vector x are non-negative and sum to a constant c = 100; see Equation (1). The compositional dataset related to the simultaneous sampling of PM10 and PM2.5 of the mineral elements Al, Ti, Si, Ca, Mg, Fe, and Sr is concisely reported as a matrix X , with r rows (r = 7) representing the mineral elements and j columns (j = 2) representing the coarse and the fine size fractions in %, see Equation (4).
X = { ( PM 10 2.5 / PM 10 ) A l ( PM 2.5 / PM 10 ) A l ( PM 10 2.5 / PM 10 ) T i ( PM 2.5 / PM 10 ) T i ( PM 10 2.5 / PM 10 ) S i ( PM 2.5 / PM 10 ) S i ( PM 10 2.5 / PM 10 ) C a ( PM 2.5 / PM 10 ) C a ( PM 10 2.5 / PM 10 ) M g ( PM 2.5 / PM 10 ) M g ( PM 10 2.5 / PM 10 ) F e ( PM 2.5 / PM 10 ) F e ( PM 10 2.5 / PM 10 ) S r ( PM 2.5 / PM 10 ) S r }   %

2.2. Transformation of Compositional Data

In order to perform statistical analysis of compositional data, an approach based on log-ratios transformation of x is required. The compositional data are transformed into coordinates using ilr (isometric log-ratio) transformations [57]. Thus, the composition of a considered element can be represented as a real number,
i l r = 1 2 ln ( x 1 / x 2 ) = 1 2 ln ( PM 10 2.5 / PM 2.5 ) .
The compositional variables of the vector x were transformed into i l r for each considered element (i.e., Al, Ti, Si, Ca, Mg, Fe, and Sr). The transformed data are concisely reported as a vector Y ; see Equation (6). Two sets of ilr data were considered for days with a Saharan event and days without a Saharan event.
Y = { i l r A l i l r T i i l r S i i l r C a i l r M g i l r F e i l r S r }
The isometric log-ratio, ilr, could be inversely transformed by:
x = ( x 1 , x 2 ) = ( exp ( 2 i l r ) / ( exp ( 2 i l r ) + 1 ) , 1 / ( exp ( 2 i l r ) + 1 ) ) % .

2.3. Centre and Perturbation Difference

The center of a two-part compositional dataset is defined as Equation (8).
g = C ( g 1 , g 2 ) ,   where   g j = ( i = 1 n x i , j ) 1 n , j = 1 , 2
where C was the closure operation for a vector z = ( z 1 , z 2 ) defined as below in Equation (9). This operation divides each component of the vector z by the sum of its components, hence scaling the vector to the constant c [58].
C ( z ) = ( c z 1 / ( z 1 + z 2 ) , c z 2 / ( z 1 + z 2 ) )
The perturbation operation is defined as perturbation p applied to a composition x, which produces composition v = p x , with v , x , and p vectors in S c 2 [56].
v = C ( p 1 x 1 , p 2 x 2 )
The perturbation difference is defined as perturbation p to which a change can be attributed as p = x     y , whatever the processes involved, with p, y , and x , vectors in S c 2 [59]. The perturbation difference is calculated as in Equation (11).
p = C ( x 1 / y 1 , x 2 / y 2 )

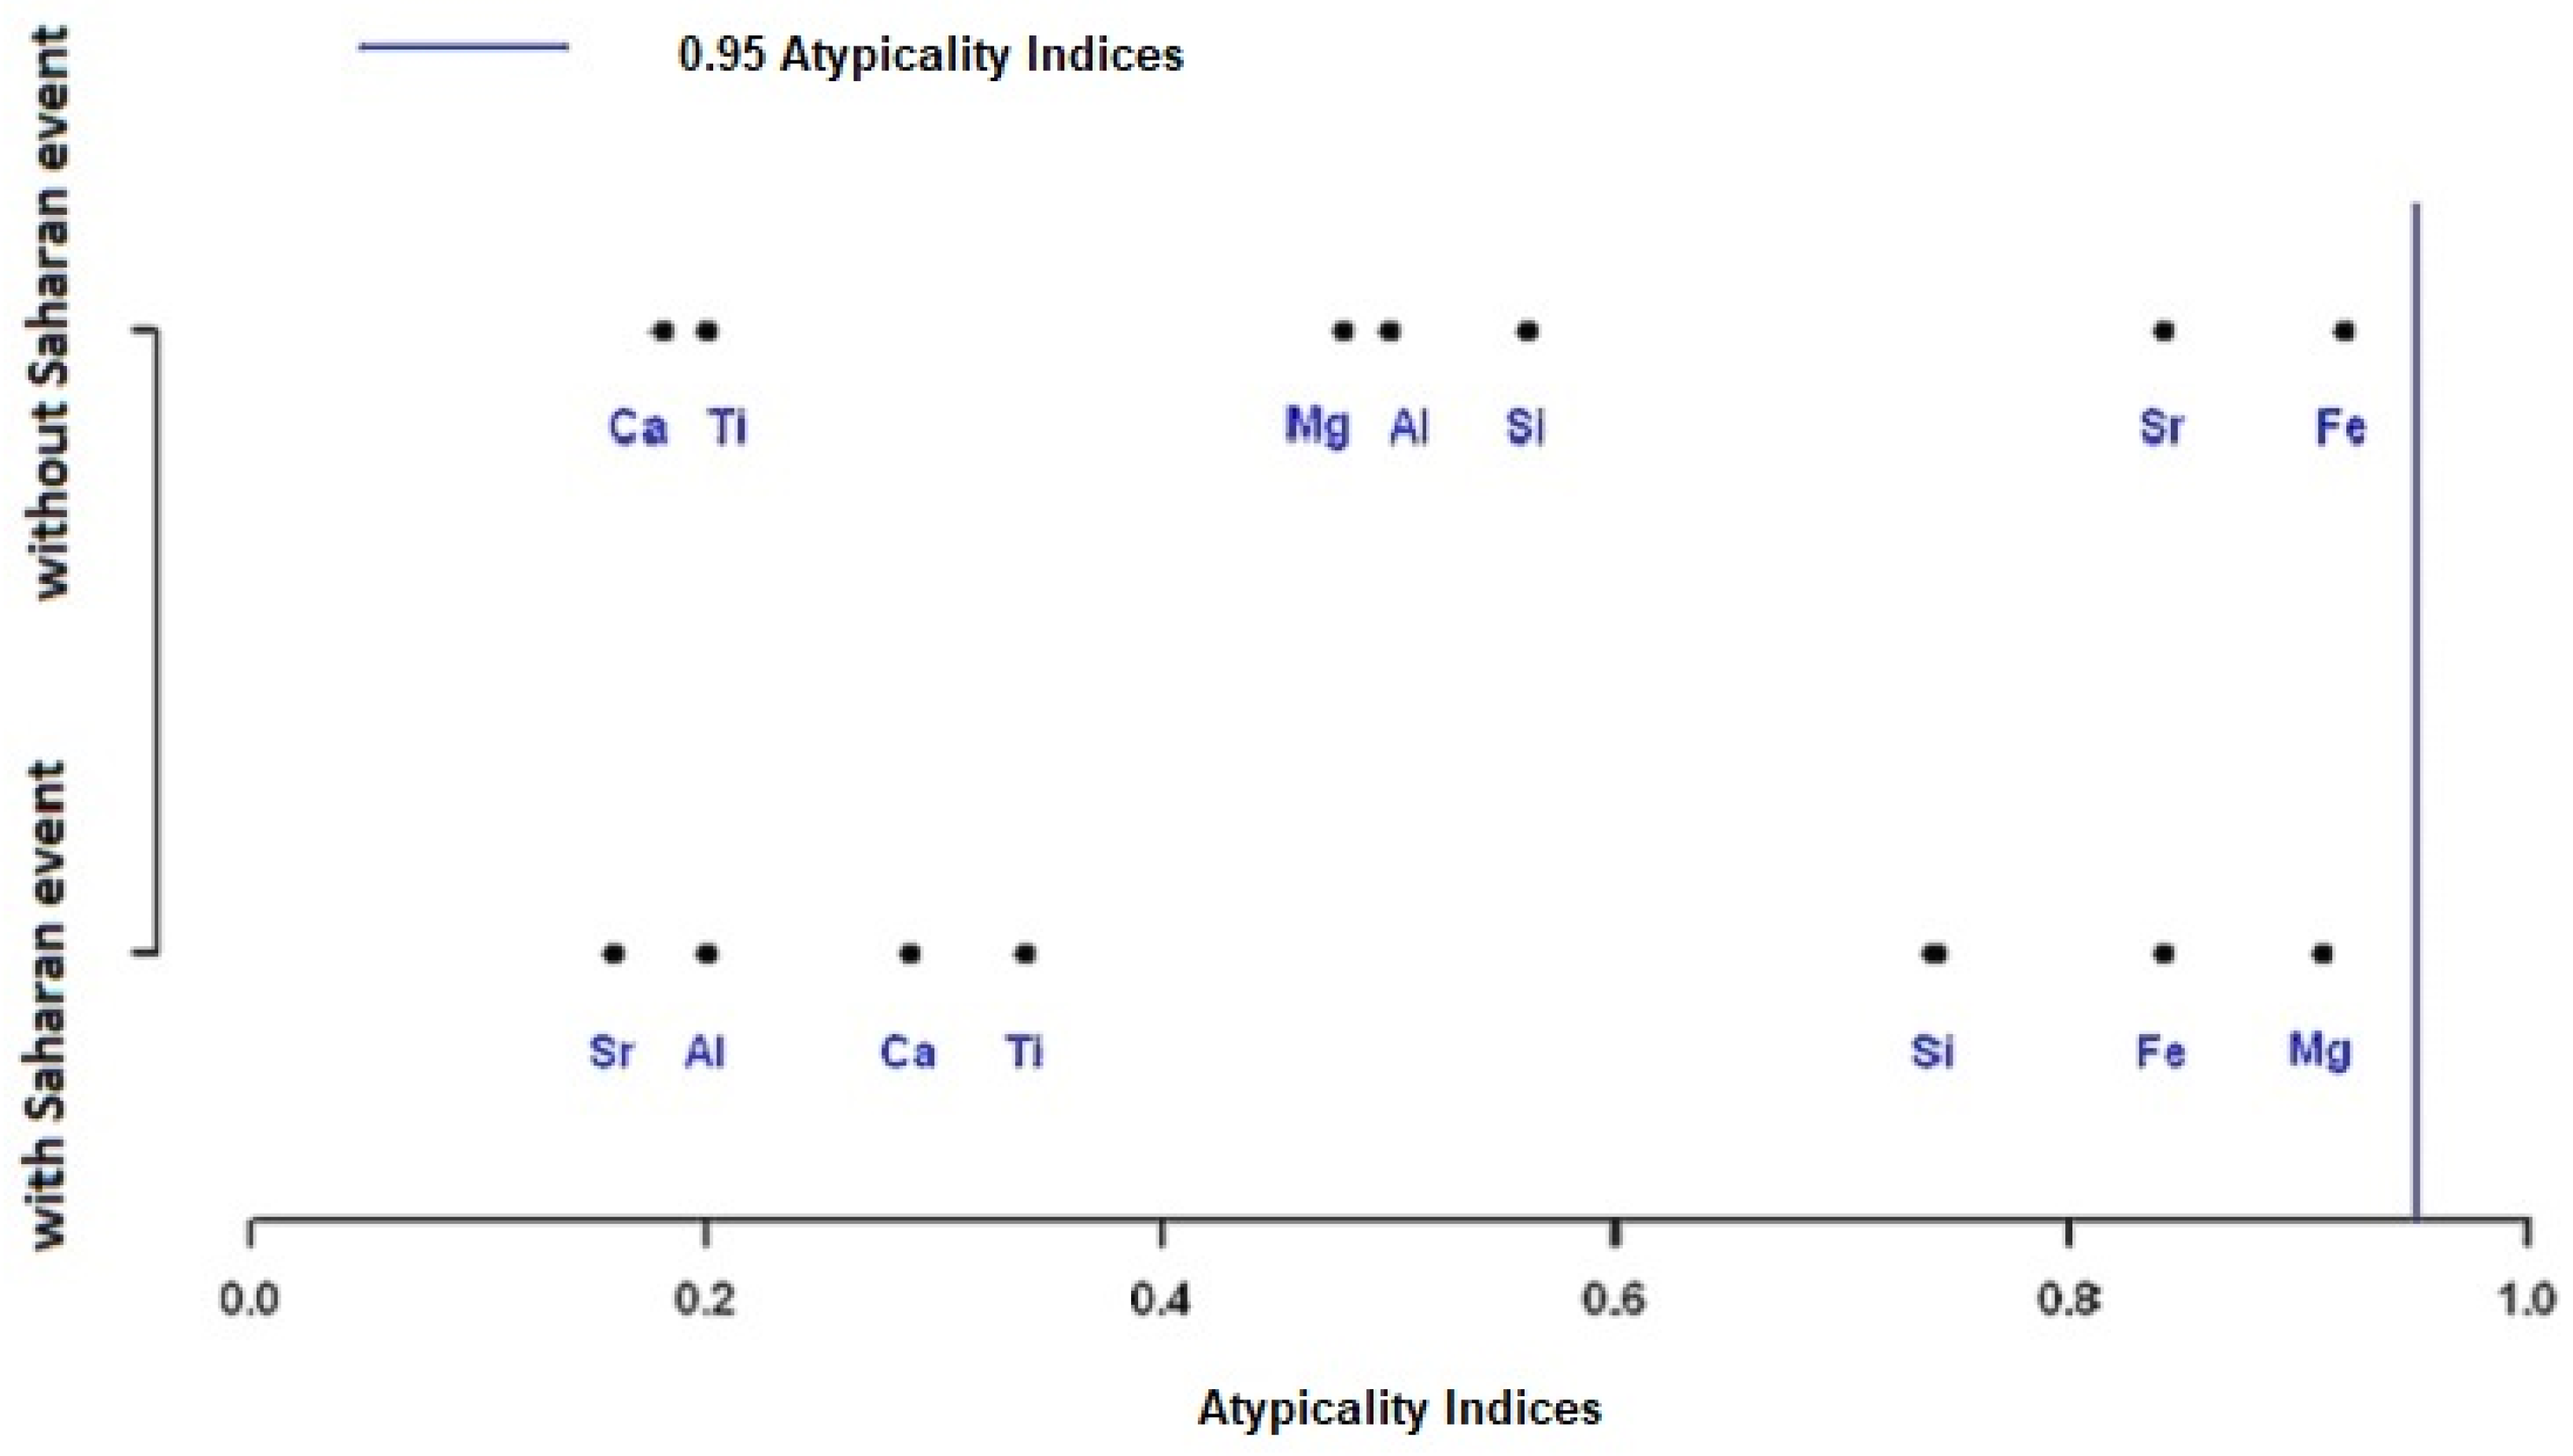
2.4. Testing Hypothesis of Normal Distribution and Atypicality Indices

The test hypothesis of normal distribution of Y , see Equation (6), was performed using the Anderson–Darling, Cramer–von Mises, and Watson tests as in Aitchison [48] (p. 143).
In order to identify possible outliers, atypicality indices were evaluated. The atypicality indices range from 0 to 1. The compositions with values of atypicality close to zero are close to the center of the distribution, while the compositions with values of atypicality close to 1 have an extremely atypical composition. In this study, compositions with atypicality indices above 0.95 were considered atypical. Further details can be found in Aitchison [48] (p. 173).

2.5. t-Test about Two Means and Correlation Test

The objective was to test whether the two samples relating to days with a Saharan event and days without a Saharan event differed significantly in their means or whether they could be considered as belonging to the same population. The t-test was applied to the log-ratios transformed dataset Y (see Equation (6)) relating to days with a Saharan event and days without a Saharan event. Moreover, the correlation coefficient between the above-mentioned isometric log-ratios relating to days with a Saharan event and days without a Saharan event was calculated and used as a measure of linear association between the two considered compositions. A correlation test was used in order to evaluate whether the calculated correlation coefficient differed significantly from zero [60,61]. Statistical power analysis was performed as in Cohen [62].

3. Results and Discussion

In order to evaluate the possible physical–chemical variations in mineral elements of PM due to a Saharan event, a compositional data analysis was applied to two compositional datasets of a suburban background site (with and without the contribution of Saharan event) [38]. The values for the element measured in days with the contribution of the Saharan event were Al = 0.76, Si = 1.78, Ca = 0.80, Fe = 0.43, Ti = 0.053, Mg = 0.36, Sr = 0.008, and Al = 0.41, Si = 0.93, Ca = 0.29, Fe = 0.235, Ti = 0.028, Mg = 0.144, Sr = 0.005 for PM10 and PM2.5, respectively. The values for the element measured in days without the contribution of the Saharan event were Al = 0.32, Si = 0.81, Ca = 0.89, Fe = 0.47, Ti = 0.024, Mg = 0.21, Sr = 0.006 and Al = 0.029, Si= 0.072, Ca = 0.031, Fe = 0.031, Ti = 0.006, Mg = 0.038, Sr = 0.001 for PM10 and PM2.5, respectively. The unit of measurement is mg/m3. The results are shown with respect to PM2.5/PM10.
The PM2.5/PM10 ratios for the considered elements in days without a Saharan event are displayed toward lower values of the diagram ranging between about 3.5% and 24% and with a mean value of about 11%. In days without a Saharan event, the coarse size fraction is the dominant component (Figure 1). Whereas the PM2.5/PM10 ratios relating to days with a Saharan event are displayed between 36% and 62%. The mean value of the PM2.5/PM10 ratio is about 50%. In days with a Saharan event, the coarse and the fine size fraction are comparable components. The two means are clearly separated; however, in order to prove that the two datasets are statistically distinct, a statistical analysis is necessary [49]. The two-part compositional dataset for days with a Saharan event and days without a Saharan event was transformed into ilr coordinates, and their normality was tested. Moreover, the atypicality indices were evaluated for the two considered compositional datasets to exclude possible atypical compositions.

3.1. Normality Tests and Atypicality Indices

The numerical results relating to the normality tests are shown in Table 1. These results are compared with critical values reported in the literature [63]. The distribution of ilr for days with a Saharan event follows a normal distribution at a significance level between 5% and 10%. In contrast, the distribution of ilr for day without a Saharan event follows a normal distribution at a significance level greater than 15%. Therefore, the hypothesis of normality cannot be rejected for each dataset.
The atypicality indices evaluated for the considered elements relating to days with a Saharan event and days without a Saharan event are reported in Figure 2. All the evaluated indices are below 0.95; thus, non-atypicality can be observed.

3.2. t-Test about Two Means and Correlation Test

The t-test was used to test whether there is a difference between the mean of ilr relating to days without a Saharan event and that of ilr relating to days with a Saharan event. The results show (see Table 2) that the two means above reported must be regarded as clearly distinct. The power of the t test was >90%. This inequality between the two means indicates that the considered mineral elements are distributed differently between coarse and fine size fractions (see Figure 3). Mineral elements are more abundant in the fine size fraction in the dataset relating to days with a Saharan event. This result can be explained considering that the PM size fractions relating to days with a Saharan event and the PM size fractions relating to days without a Saharan event have undergone different processes of either addition or subtraction of mineral matter. The processes of addition/subtraction of mineral matter either enriched the PM2.5 size fraction, depleted the PM10 size fraction, or induced both effects. These possible processes are highlighted by the differences in the means of the two considered compositions. In order to evaluate whether there exists a linear association between isometric log-ratios relating to days with a Saharan event and days without a Saharan event, a correlation test was used. The results show (see Table 2) that the correlation coefficient between the above-mentioned isometric log-ratios cannot be considered significantly different from zero. Thus, the hypothesis of linear association between the two compositions is rejected. This suggests that the two datasets related to days with a Saharan event and days without a Saharan event have to be regarded as clearly distinct with respect to their mineral element compositions. A related point to consider is that between compositions, only positive correlations can be deemed relevant: the correlation test was one-tailed.
The lack of linear association between the isometric log-ratios relating to days with a Saharan event and days without a Saharan event suggests that the two measured PM could have different origins.
Figure 3 reports the isometric log-ratio for the considered elements. The mineral element concentrations of PM are more dispersed for days without a Saharan event than for days with a Saharan event. This difference is highlighted from the isometric log-ratio and can be attributed to the different sources of mineral matter that concern days without a Saharan event and days with a Saharan event.
The selected elements are representative of mineral matter and related sources in an European context [24]. Mineral elements can be related to many sources of mineral matter such as road dust, dust from arable lands, desert dust, etc. The elements considered are representative of different mineral sources. Al, Si, Ti, and Fe are possibly related to mineral sources involving several clay minerals and quartz, which are indicative of a possible Saharan event contribution, whereas Ca, Sr, and Mg are possibly related to mineral matter involving either local or regional sources of re-suspended soil. As such, the distribution of the mineral elements in days with a Saharan event possibly reflects the mineral element concentrations of the local PM affected by the Saharan event. Further details about the geochemistry are reported in [38].
To evaluate the nature and level of the difference between the element concentrations for days with a Saharan event and days without a Saharan event, the perturbation difference [56] is calculated between the centers of the two compositional datasets. The center for the two compositions are (49.68, 50.32)(with Saharan event)% and (89.26, 10.74)(without Saharan event)% for days with a Saharan event and days without a Saharan event, respectively. The perturbation difference is (10.62, 89.38)(with Saharan event)-(without Saharan event)% suggesting that, relatively, the Saharan event has largely enhanced the fine size fraction. This result together with the statistical difference highlighted and reported above are in agreement with studies that have shown how the long-range transport of dust can influence the fine size fraction of PM [29,64,65,66].

4. Conclusions

The analysis of compositional data applied to PM simultaneous measurements provides a possible statistical validation of the hypothesis that during days with a Saharan event, there are important physical–chemical changes to the simultaneous size-segregated PM. These changes are highlighted by the presence of two different datasets (days with a Saharan event and days without a Saharan event), which are clearly distinct in composition. Therefore, during the Saharan event, at ground level, possible mechanisms of addition and/or subtraction of mineral matter with different origins take place within the size-segregated fractions of PM. These mechanisms (a) have led to the variation of the elemental composition on size-segregated PM fractions, (b) have modified the distribution of the considered mineral elements within the size-segregated PM fractions, and (c) have mainly enhanced the fine size fraction of PM.
The compositional analysis applied to the mineral element concentrations of PM10 and PM2.5 simultaneous measurement is an effective technique that can be used to study environmental sites affected by a Saharan event. The presented pilot study relates to a suburban environmental context for which the reported approach has been evaluated.

Author Contributions

A.S. provided the idea and designed the study. A.S., R.C. and V.S. illustrated the figures and wrote the manuscript. All authors have read and agreed to the published version of the manuscript.

Funding

This research received no external funding.

Institutional Review Board Statement

Not applicable.

Informed Consent Statement

Not applicable.

Data Availability Statement

The data presented in this study are available in Matassoni et al., 2011 [38] (p. 739).

Conflicts of Interest

The authors declare no conflict of interest.

References

  1. Caggiano, R.; D’Emilio, M.; Macchiato, M.; Ragosta, M. Experimental and statistical investigations on atmospheric heavy metals concentrations in an industrial area of Southern Italy. Nuovo Cim. C 2001, 24, 391–406. [Google Scholar]
  2. Solomon, S.; Qin, D.; Manning, M.; Chen, Z.; Marquis, M.; Averyt, K.B.; Tignor, M.; Miller, H.L. Contribution of Working Group I to the Fourth Assessment Report of the Intergovernmental Panel on Climate Change. In IPCC: Climate Change (2007): The Physical Science Basis; Cambridge University Press: New York, NY, USA, 2007; pp. 131–217. [Google Scholar]
  3. Perrino, C.; Canepari, S.; Cardarelli, E.; Catrambone, M.; Sargolini, T. Inorganic constituents of urban air pollution in the Lazio region (Central Italy). Environ. Monit. Assess. 2008, 136, 69–86. [Google Scholar] [CrossRef] [PubMed]
  4. Anderson, J.O.; Thundiyil, J.G.; Stolbach, A. Clearing the air: A review of the effects of particulate matter air pollution on human health. J. Med. Toxicol. 2012, 8, 166–175. [Google Scholar] [CrossRef] [Green Version]
  5. Stocker, T.F.; Qin, D.; Plattner, G.K.; Tignor, M.; Allen, S.K.; Boschung, J.; Nauels, A.; Xia, Y.; Bex, V.; Midgley, P.M. Contribution of working group I to the fifth assessment report of the intergovernmental panel on climate change 1535. In IPCC: Climate Change 2013: The Physical Science Basis; Cambridge University Press: New York, NY, USA, 2013. [Google Scholar]
  6. Heyder, J. Deposition of Inhaled Particles in the Human Respiratory Tract and Consequences for Regional Targeting in Respiratory Drug Delivery. Proc. Am. Thorac. Soc. 2004, 1, 315–320. [Google Scholar] [CrossRef] [PubMed]
  7. Kelly, F.J.; Fussell, J.C. Size, source and chemical composition as determinants of toxicity attributable to ambient particulate matter. Atmos. Environ. 2012, 60, 504–526. [Google Scholar] [CrossRef]
  8. Pope, C.A., III; Dockery, D.W. Health effects of fine particulate air pollution: Lines that connect. J. Air Waste Manag. Assoc. 2006, 56, 709–742. [Google Scholar] [CrossRef]
  9. WHO (World Health Organization 2006). Regional Office for Europe, & World Health Organization. In Air Quality Guidelines: Global Update, 2005: Particulate Matter, Ozone, Nitrogen Dioxide, and Sulfur Dioxide; World Health Organization: Geneva, Switzerland, 2006. [Google Scholar]
  10. WHO (World Health Organization 2012). Regional Office for Europe, & World Health Organization. In Health Effects of Black Carbon; World Health Organization: Geneva, Switzerland, 2012. [Google Scholar]
  11. Directive 2008/50/EC of the European Parliament and of the Council of 21 May 2008 on ambient air quality and cleaner air for Europe. J. Eur. Union 2008, 29, 169–212.
  12. Prodi, F.; Fea, G.A. A case of transport and deposition of Saharan event over the Italian peninsula and southern Europe. J. Geophys. Res. Ocean. 1979, 84, 6951–6960. [Google Scholar] [CrossRef]
  13. Prospero, J.M. African dust: Its large-scale transport over the Atlantic ocean and its impact on the Mediterranean region. In Regional Climate Variability and Its Impacts in the Mediterranean Area; Springer: Dordrecht, The Netherlands, 2007; pp. 15–38. [Google Scholar]
  14. Israelevich, P.E.; Ganor, P.; Alpert, P.; Kishcha, P.; Stupp, A. Predominant transport paths of Saharan event over the Mediterranean Sea to Europe. JGR-Atmos. 2012, 117, D02205. [Google Scholar]
  15. Viana, M.; Pey, J.; Querol, X.; Alastuey, A.; De Leeuw, F.; Lükewille, A. Natural sources of atmospheric aerosols influencing air quality across Europe. Sci. Total Environ. 2014, 472, 825–833. [Google Scholar] [CrossRef]
  16. Rodríguez, S.; Querol, X.; Alastuey, A.; Viana, M.M.; Mantilla, E. Events affecting levels and seasonal evolution of airborne particulate matter concentrations in the Western Mediterranean. Environ. Sci. Technol. 2003, 37, 216–222. [Google Scholar] [CrossRef]
  17. Ansmann, A.; Bösenberg, J.; Chaikovsky, A.; Comerón, A.; Eckhardt, S.; Eixmann, R.; Freudenthaler, V.; Ginoux, P.; Komguem, L.; Linné, H.; et al. Long-range transport of Saharan event to northern Europe: The 11–16 October 2001 outbreak observed with EARLINET. J. Geophys. Res. Atmos. 2003, 108, D24. [Google Scholar] [CrossRef]
  18. Papayannis, A.; Amiridis, V.; Mona, L.; Tsaknakis, G.; Balis, D.; Bösenberg, J.; Chaikovski, A.; De Tomasi, F.; Grigorov, I.; Mattis, I.; et al. Systematic lidar observations of Saharan event over Europe in the frame of EARLINET (2000–2002). J. Geophys. Res.: Atmos. 2008, 113. [Google Scholar] [CrossRef] [Green Version]
  19. Ganor, E.; Osetinsky, I.; Stupp, A.; Alpert, P. Increasing trend of African dust, over 49 years, in the eastern Mediterranean. JGR-Atmos. 2010, 115. [Google Scholar] [CrossRef] [Green Version]
  20. Escudero, M.; Querol, X.; Pey, J.; Alastuey, A.; Pérez, N.; Ferreira, F.; Alonso, S.; Rodrıguez, S.; Cuevas, E. A methodology for the quantification of the net African dust load in air quality monitoring networks. Atmos. Environ. 2007, 41, 5516–5524. [Google Scholar] [CrossRef]
  21. Mitsakou, C.; Kallos, G.; Papantoniou, N.; Spyrou, C.; Solomos, S.; Astitha, M.; Housiadas, C. Saharan event levels in Greece and received inhalation doses. Atmos. Chem. Phys. 2008, 8, 7181–7192. [Google Scholar] [CrossRef] [Green Version]
  22. Matassoni, L.; Pratesi, G.; Centioli, D.; Cadoni, F.; Malesani, P.; Caricchia, A.M.; di Bucchianico, A.D.M. Saharan event episodes in Italy: Influence on PM 10 daily limit value (DLV) exceedances and the related synoptic. J. Environ. Monit. 2009, 11, 1586–1594. [Google Scholar] [CrossRef] [PubMed]
  23. Ganor, E.; Stupp, A.; Alpert, P. A method to determine the effect of mineral dust aerosols on air quality. Atmos. Environ. 2009, 43, 5463–5468. [Google Scholar] [CrossRef]
  24. Viana, M.; Kuhlbusch, T.A.J.; Querol, X.; Alastuey, A.; Harrison, R.M.; Hopke, P.K.; Winiwarter, W.; Vallius, M.; Szidat, S.; Prévôt, A.S.H.; et al. Source apportionment of particulate matter in Europe: A review of methods and results. J. Aerosol Sci. 2008, 39, 827–849. [Google Scholar] [CrossRef]
  25. Harrison, R.M.; Yin, J. Particulate matter in the atmosphere: Which particle properties are important for its effects on health? Sci. Total Environ. 2000, 249, 85–101. [Google Scholar] [CrossRef]
  26. Thorpe, A.; Harrison, R.M. Sources and properties of non-exhaust particulate matter from road traffic: A review. Sci. Total Environ. 2008, 400, 270–282. [Google Scholar] [CrossRef] [PubMed]
  27. Gallero, F.J.G.; Vallejo, M.G.; Umbría, A.; Baena, J.G. Multivariate statistical analysis of meteorological and air pollution data in the ‘Campo de Gibraltar’region, Spain. Environ. Monit. Assess. 2006, 119, 405–423. [Google Scholar] [CrossRef]
  28. Caggiano, R.; Macchiato, M.; Trippetta, S. Levels, chemical composition and sources of fine aerosol particles (PM1) in an area of the Mediterranean basin. Sci. Total Environ. 2010, 408, 884–895. [Google Scholar] [CrossRef]
  29. Margiotta, S.; Lettino, A.; Speranza, A.; Summa, V. PM 1 geochemical and mineralogical characterization using SEM-EDX to identify particle origin–Agri Valley pilot area (Basilicata, southern Italy). Nat. Hazards Earth Syst. Sci. 2015, 15, 1551–1561. [Google Scholar] [CrossRef] [Green Version]
  30. Abuelgasim, A.; Farahat, A. Investigations on PM10, PM 2.5, and Their Ratio over the Emirate of Abu Dhabi, United Arab Emirates. Earth Syst. Environ. 2020, 4, 763–775. [Google Scholar] [CrossRef]
  31. Lundgren, D.A.; Hlaing, D.N.; Rich, T.A.; Marple, V.A. PM10/PM2. 5/PM1 data from a trichotomous sampler. Aerosol Sci. Technol. 1996, 25, 353–357. [Google Scholar] [CrossRef]
  32. Artıñano, B.; Salvador, P.; Alonso, D.G.; Querol, X.; Alastuey, A. Influence of traffic on the PM10 and PM2.5 urban aerosol fractions in Madrid (Spain). Sci. Total Environ. 2004, 334, 111–123. [Google Scholar] [CrossRef] [PubMed]
  33. Charron, A.; Harrison, R.M. Fine (PM2.5) and coarse (PM2.510) particulate matter on a heavily trafficked London highway: Sources and processes. Environ. Sci. Technol. 2005, 39, 7768–7776. [Google Scholar] [CrossRef] [PubMed]
  34. Pérez, N.; Pey, J.; Querol, X.; Alastuey, A.; López, J.M.; Viana, M. Partitioning of major and trace components in PM10–PM2.5–PM1 at an urban site in Southern Europe. Atmos. Environ. 2008, 42, 1677–1691. [Google Scholar] [CrossRef]
  35. Yin, J.; Harrison, R.M. Pragmatic mass closure study for PM1.0, PM2.5 and PM10 at roadside, urban background and rural sites. Atmos. Environ. 2008, 42, 980–988. [Google Scholar] [CrossRef]
  36. Kulshrestha, A.; Satsangi, P.G.; Masih, J.; Taneja, A. Metal concentration of PM2.5 and PM10 particles and seasonal variations in urban and rural environment of Agra, India. Sci. Total Environ. 2009, 407, 6196–6204. [Google Scholar] [CrossRef]
  37. Makkonen, U.; Hellén, H.; Anttila, P.; Ferm, M. Size distribution and chemical composition of airborne particles in south-eastern Finland during different seasons and wildfire episodes in 2006. Sci. Total Environ. 2010, 408, 644–651. [Google Scholar] [CrossRef]
  38. Matassoni, L.; Pratesi, G.; Centioli, D.; Cadoni, F.; Lucarelli, F.; Nava, S.; Malesani, P. Saharan event contribution to PM10, PM2.5 and PM1 in urban and suburban areas of Rome: A comparison between single-particle SEM-EDS analysis and whole-sample PIXE analysis. J. Environ. Monit. 2011, 13, 732–742. [Google Scholar] [CrossRef] [PubMed]
  39. Moreno, T.; Querol, X.; Alastuey, A.; Reche, C.; Cusack, M.; Amato, F.; Pandolfi, M.; Pey, J.; Richards, A.; Prévôt, A.S.H.; et al. Variations in time and space of trace metal aerosol concentrations in urban areas and their surroundings. Atmos. Chem. Phys. 2011, 11, 9415–9430. [Google Scholar] [CrossRef] [Green Version]
  40. Theodosi, C.; Grivas, G.; Zarmpas, P.; Chaloulakou, A.; Mihalopoulos, N. Mass and chemical composition of size-segregated aerosols (PM1, PM2.5, PM10) over Athens, Greece: Local versus regional sources. Atmos. Chem. Phys. 2011, 11, 11895–11911. [Google Scholar] [CrossRef] [Green Version]
  41. Voukantsis, D.; Karatzas, K.; Kukkonen, J.; Räsänen, T.; Karppinen, A.; Kolehmainen, M. Intercomparison of air quality data using principal component analysis, and forecasting of PM10 and PM2.5 concentrations using artificial neural networks, in Thessaloniki and Helsinki. Sci. Total Environ. 2011, 409, 1266–1276. [Google Scholar] [CrossRef] [PubMed]
  42. Lim, S.; Lee, M.; Lee, G.; Kim, S.; Yoon, S.; Kang, K. Ionic and carbonaceous compositions of PM10, PM2.5 and PM1.0 at Gosan ABC Superstation and their ratios as source signature. Atmos. Chem. Phys. 2012, 12, 2007–2024. [Google Scholar] [CrossRef] [Green Version]
  43. Srimuruganandam, B.; Nagendra, S.S. Source characterization of PM10 and PM2.5 mass using a chemical mass balance model at urban roadside. Sci. Total Environ. 2012, 433, 8–19. [Google Scholar] [CrossRef]
  44. Rogula-Kozłowska, W.; Rogula-Kupiec, P.; Mathews, B.; Klejnowski, K. Effects of road traffic on the ambient concentrations of three PM fractions and their main components in a large Upper Silesian city. Annals of Warsaw University of Life Sciences-SGGW. Land Reclam. 2013, 45, 243–253. [Google Scholar]
  45. Hsu, C.Y.; Chiang, H.C.; Lin, S.L.; Chen, M.J.; Lin, T.Y.; Chen, Y.C. Elemental characterization and source apportionment of PM10 and PM2.5 in the western coastal area of central Taiwan. Sci. Total Environ. 2016, 541, 1139–1150. [Google Scholar] [CrossRef] [PubMed]
  46. Speranza, A.; Caggiano, R.; Margiotta, S.; Summa, V.; Trippetta, S. A clustering approach based on triangular diagram to study the seasonal variability of simultaneous measurements of PM10, PM2. 5 and PM1 mass concentration ratios. Arab. J. Geosci. 2016, 9, 1–8. [Google Scholar] [CrossRef]
  47. Aitchison, J. The statistical analysis of compositional data (with discussion). J. R. Stat. Soc. Ser. B (Stat. Methodol.) 1982, 44, 139–160. [Google Scholar]
  48. Aitchison, J. The Statistical Analysis of Compositional Data; Chapman and Hall: London, UK, 1986. [Google Scholar]
  49. Pawlowsky-Glahn, V.; Buccianti, A. Visualization and modeling of sub-populations of compositional data: Statistical methods illustrated by means of geochemical data from fumarolic fluids. Int. J. Earth Sci. 2002, 91, 357–368. [Google Scholar] [CrossRef]
  50. Pawlowsky-Glahn, V.; Buccianti, A. Compositional Data Analysis: Theory and Applications; John Wiley & Sons: Hoboken, NJ, USA, 2011. [Google Scholar]
  51. Speranza, A.; Caggiano, R.; Pavese, G.; Summa, V. The Study of Characteristic Environmental Sites Affected by Diverse Sources of Mineral Matter Using Compositional Data Analysis. Condens. Matter 2018, 3, 16. [Google Scholar] [CrossRef] [Green Version]
  52. Speranza, A.; Caggiano, R.; Summa, V. A systematic approach for the comparison of PM10, PM2.5, and PM1 mass concentrations of characteristic environmental sites. Environ. Monit. Assess. 2019, 191, 738. [Google Scholar] [CrossRef] [PubMed]
  53. Weise, D.R.; Jung, H.; Palarea-Albaladejo, J.; Cocker, D.R. Compositional data analysis of smoke emissions from debris piles with low-density polyethylene. J. Air Waste Manag. Assoc. 2020, 70, 834–845. [Google Scholar] [CrossRef] [PubMed]
  54. Weise, D.R.; Fletcher, T.H.; Safdari, M.S.; Amini, E.; Palarea-Albaladejo, J. Application of compositional data analysis to determine the effects of heating mode, moisture status and plant species on pyrolysates. Int. J. Wildland Fire 2021. [Google Scholar] [CrossRef]
  55. R Development Core Team. R: A Language and Environment for Statistical Computing; R Foundation for Statistical Computing: Vienna, Austria, 2008; ISBN 3-900051-07-0. Available online: http://www.R-project.org (accessed on 1 July 2021).
  56. Aitchison, J. A Concise Guide to Compositional Data Analysis 2nd Compositional Data Analysis; Workshop CoDaWork’05 Universitat de Girona: Girona, Spain, 2005; Available online: https://ima.udg.edu/Activitats/CoDaWork05/A_concise_guide_to_compositional_data_analysis.pdf (accessed on 6 May 2019).
  57. Egozcue, J.J.; Pawlowsky-Glahn, V.; Mateu-Figueras, G.; Barceló-Vidal, C. Isometric logratio transformations for compositional data analysis. Math. Geol. 2003, 35, 279–300. [Google Scholar] [CrossRef]
  58. Pawlowsky-Glahn, V.; Egozcue, J.J.; Tolosana-Delgado, R. Modelling and Analysis of Compositional Data; John Wiley & Sons: Hoboken, NJ, USA, 2015. [Google Scholar]
  59. Aitchison, J.; Egozcue, J.J. Compositional data analysis: Where are we and where should we be heading? Math. Geol. 2005, 37, 829–850. [Google Scholar] [CrossRef] [Green Version]
  60. Fisher, R.A. Statistical methods for research workers. In Statistical Methods for Research Workers, 5th ed.; Oliver and Boyd: London, UK, 1934. [Google Scholar]
  61. Lee Rodgers, J.; Nicewander, W.A. Thirteen ways to look at the correlation coefficient. Am. Stat. 1988, 42, 59–66. [Google Scholar] [CrossRef]
  62. Cohen, J. Statistical Power Analysis for the Behavioral Sciences; Routledge: London, UK, 2013. [Google Scholar]
  63. Stephens, M.A. EDF statistics for goodness of fit and some comparisons. J. Am. Stat. Assoc. 1974, 69, 730–737. [Google Scholar] [CrossRef]
  64. Vanderstraeten, P.; Lénelle, Y.; Meurrens, A.; Carati, D.; Brenig, L.; Delcloo, A.; Offere, Z.Y.; Zaady, E. Dust storm originate from Sahara covering Western Europe: A case study. Atmos. Environ. 2008, 42, 5489–5493. [Google Scholar] [CrossRef]
  65. Dagsson-Waldhauserova, P.; Magnusdottir, A.Ö.; Olafsson, H.; Arnalds, O. The Spatial Variation of Dust Particulate Matter Concentrations during Two Icelandic Dust Storms in 2015. Atmosphere 2016, 7, 77. [Google Scholar] [CrossRef] [Green Version]
  66. Caggiano, R.; Sabia, S.; Speranza, A. Trace elements and human health risks assessment of finer aerosol atmospheric particles (PM 1). Environ. Sci. Pollut. Res. 2019, 26, 36423–36433. [Google Scholar] [CrossRef] [PubMed]
Figure 1. Distribution of PM2.5/PM10 ratios for the considered elements. The mean relating to days with a Saharan event is at about PM2.5/PM10 = 50.32% with the 95% C.I. (43.24%, 55.96%). The mean relating to days without a Saharan event is at about PM2.5/PM10 = 10.74% with C.I. (6.03%, 17.67%).
Pollutants 02 00001 g001
Figure 2. Atypicality indices for data relating to days with and without a Saharan event.
Pollutants 02 00001 g002
Figure 3. Distribution of data for isometric log-ratios. The mean of ilr relating to the compositional dataset of days with a Saharan event is at about 0.01 with the 95% C.I. (−0.17, 0.19). The mean of ilr relating to the compositional dataset of days without a Saharan event is at about 1.5 with the 95% C.I. (1.05, 1.95).
Pollutants 02 00001 g003
Table 1. Normality tests of ilr for the two considered datasets.
DatasetAnderson–DarlingpCramer–Von MisespWatsonp
without Saharan event0.2245>15%0.0375>15%0.0373>15%
with Saharan event0.4987>10%0.0996>10%0.0973[10–5%]
Table 2. t-test about two means and correlation test.
HypothesisTest ValueCritical ValueDegree of FreedomSignificance
μwith Saharan event = μwithout Saharan eventt = 6.655tc = 1.8418.690.0001
Correlation coefficient = 0r = 0.39rc = 0.5550.1935
Publisher’s Note: MDPI stays neutral with regard to jurisdictional claims in published maps and institutional affiliations.

