1. Introduction
Every human being on the surface of Earth is exposed daily to various levels of radiation. According to the Hellenic Atomic Energy Commission, the term “radiation” means the propagation of energy either in the form of particles (e.g., electrons) or in the form of waves (e.g., radio waves). Radiation sources can be natural or artificial. A natural source of radiation consists of natural radioisotopes, which can be found in soil, subsoil, air, and water. The main elements that have unstable isotopes or radioisotopes, emitting radioactivity, are uranium, potassium, and thorium. Radium belongs to the uranium series and produces radon as its decay product, which is a gas emitting radiation. Its inhalation is the second leading cause of lung cancer. It is fairly characterized by many as a “natural radioactive pollutant”.
Previously, special emphasis has been given to the study of radon in indoor environments (e.g., houses, caves, mines, etc.), where it is concentrated to a large extent. More and more published scientific papers related to this topic comment on the need to ensure the health and safety of employees and/or visitors. Many of them focus on radon concentration in both active and inactive underground mines. The purpose of this work is the collection and comparison of radon concentrations data in active and inactive sites, in accordance with applicable law, depending on the country in which the mine is located. In the context of this process, a list of all necessary measures in case of exceeding the limits is provided, in an effort to reduce radon concentrations and protect human health.
Apart from radon concentrations, this paper extensively comments on radiation exposure times as well as the concept of “dose” (equivalent, absorbed, effective) associated with the radiation time of employees, tourists, and visitors, focusing on workplaces, which are priority areas in generating or modifying guidelines.
2. Methodology
Data published in international scientific journals were reviewed in this work. Following a search in the literature, 82 publications related to the concentrations of radon in underground mines were selected from international scientific databases (ScienceDirect, Scopus, WorldWideScience). The 82 publications collected and processed concern 164 underground mines distributed in 29 countries around the world. The mining sites were firstly categorized into (a) active mines and (b) inactive mines. Out of these sites, 107, i.e., 65.24%, refer to active and the rest to inactive mining sites. As far as the inactive mining sites are concerned, 15 of those are already being reused for tourist purposes, while 3 others are about to be used for the same purpose. The next classification from the above data was into (a) uranium mines, (b) coal mines, and (c) other mines (e.g., salt, gold, silver, iron mines, etc.)
The results were then organized into three separate spreadsheet files (depending on the mining category). The central reference point in the spreadsheet tables was the presentation of radon concentrations in the underground mines. More specifically, the minimum, maximum, and average values were reported. Then, the correlation of radon concentration as a function of various parameters was analyzed. Radon concentrations and annual absorbed doses are useful for characterizing a mine as “safe” or “unsafe” for operation. Following the above procedure and in conjunction with the limits set by legislation, conclusions were drawn regarding the mining sites. These conclusions, along with measurements, are presented in the following sections. The maximum radon concentrations for each category of mines, illustrated in three bar charts, were also compared ([
1] and references within this work).
3. Description of the Mines
The radon concentrations in the air and water are generally small, meaning that living in the countryside does not, in most cases, pose a significant radiological risk. Radon, however, is concentrated in closed spaces such as mines, so working and presence in them, in general, is an additional risk. This risk is exacerbated by the fact that different indoor air quality may affect the distribution of radon daughters. In general, mining sites, particularly underground mines, are one of the most important causes of radiation exposure, which contributes greatly to the danger at work. This is because radon gas, as well as dust produced by ores, contains elements of the radioactive decay series of uranium and thorium, which are “transported” to the respective spaces by water or air circulation during mining processes. For this reason, radon measurements are carried out in mines to protect, prevent, and ensure public health.
The experimental determination of the radon concentration or/and its secondary products is increasingly the main task of a large percentage of works related to the field of radon research. The use of various detection systems available for the mining sites offers the possibility of monitoring according to the needs and the special measurement conditions.
3.1. Uranium Mines
Uranium ores are mined either by outdoor or underground methods, depending on the size, depth, longest horizontal dimension, and other characteristics of each ore. During ore mining and processing, miners are exposed to radiation due to uranium. In uranium mines, the radiological hazards of miners are mainly due to the inhalation of radon (222Rn) and its subsidiaries, which can contribute more than 50% to the total dose. Epidemiological studies reported that prolonged exposure of uranium miners to radon and its daughters may lead to lung cancer. The risks due to radiation in general, but also in uranium mines, are classified into two categories. “External hazards” occur mainly due to workers’ exposure to γ radiation emitted by uranium ores, while “internal hazards” occur due to inhalation of radon (222Rn) and its daughter radioisotopes (with a short half-life) originating from the 238U series [
2]. As for uranium ores, they contain natural uranium consisting of 238U (99.27%), 235U (0.72%), and 234U (0.005%). In terms of radiological protection, 238U and its daughter radioisotopes are a concern for the uranium mining industry, due to the abundance of 238U in natural uranium and their emitting radiation. The entire above-mentioned range of uranium subsidiaries found in uranium ore, depending on the age of the deposit scan, greatly affects the equilibrium factors of radon and its daughter radioisotopes [
3].
3.2. Coal Mines
Coal mining and coal combustion in thermal power plants are potentially the most important processes for creating technologically increased levels of natural radioactivity. The opening of large surface mines leads to accelerated radon emission from the deeper layers of Earth’s crust. Similarly, in coal mines, increased accumulation of radon can be caused due to its entry through cracks and fractures in the ground and especially through groundwater systems. Generally, the emission of hazardous gases into the atmosphere from coal mining activity is a common phenomenon. A large part of these gases emitted from the mining sites is dangerous due to their toxicity and flammability when they are found in certain concentrations in the atmosphere. The most flammable gases are those produced during the process of “transformation” of carbon-containing rocks. When carbon layers are formed, additional gases are released due to the mechanical destruction of the carbon and its low oxidation temperature. The rate of entry of different gases into the atmosphere from mining areas can vary greatly depending on the space, time, geological, and technological conditions. Although there is little information on radon emissions from coal mines (surface and underground mines), the UNCSEAR commission estimated that 30–800 TBq of radon is released annually from mines worldwide, resulting in cumulative annual active doses of 0.5 to 10 Sv per person, respectively. In the UNSCEAR 2000 report, the commission estimated that the average carbon concentrations of 40K, 238 U, and 232Th were 50, 20, and 20 Bq/kg, respectively. This estimation is based on the analysis of carbon samples from 15 countries, and it is particularly important to note that the price of some radionuclides is up to two orders of magnitude [
4].
3.3. Other Mines
Aside from uranium and coal mines, extensive research and studies have been carried out in other mines, which will be discussed in this section. This category includes mines of gold, salt, hematite, tin, lead, copper, iron, zinc, phosphorus, manganese, tungsten, and silver. Firstly, salt mines, a large subcategory due to their low radioactivity and other geological peculiarities, offer a unique possibility for their use in cave therapy. Knowledge of radon concentration levels in such underground environments is essential for its therapeutic purposes in various respiratory and rheumatic diseases. Gold, silver, lead, and zinc mines are also interesting categories. Due to natural radiation in these underground mines, the assessment of the health risks of workers is vital, and therefore is important to take all necessary measures to ensure safe working conditions. Finally, through the study of iron, copper, phosphorus, manganese, tungsten, tin, and hematite mines, the results of radon concentrations and doses were used to investigate the possible health effects of radon exposure for the wider community that is associated with the processing of these ores. Measurements were also made on a personal level for each employee individually, considering the time devoted to each job [
5,
6,
7].
4. Results
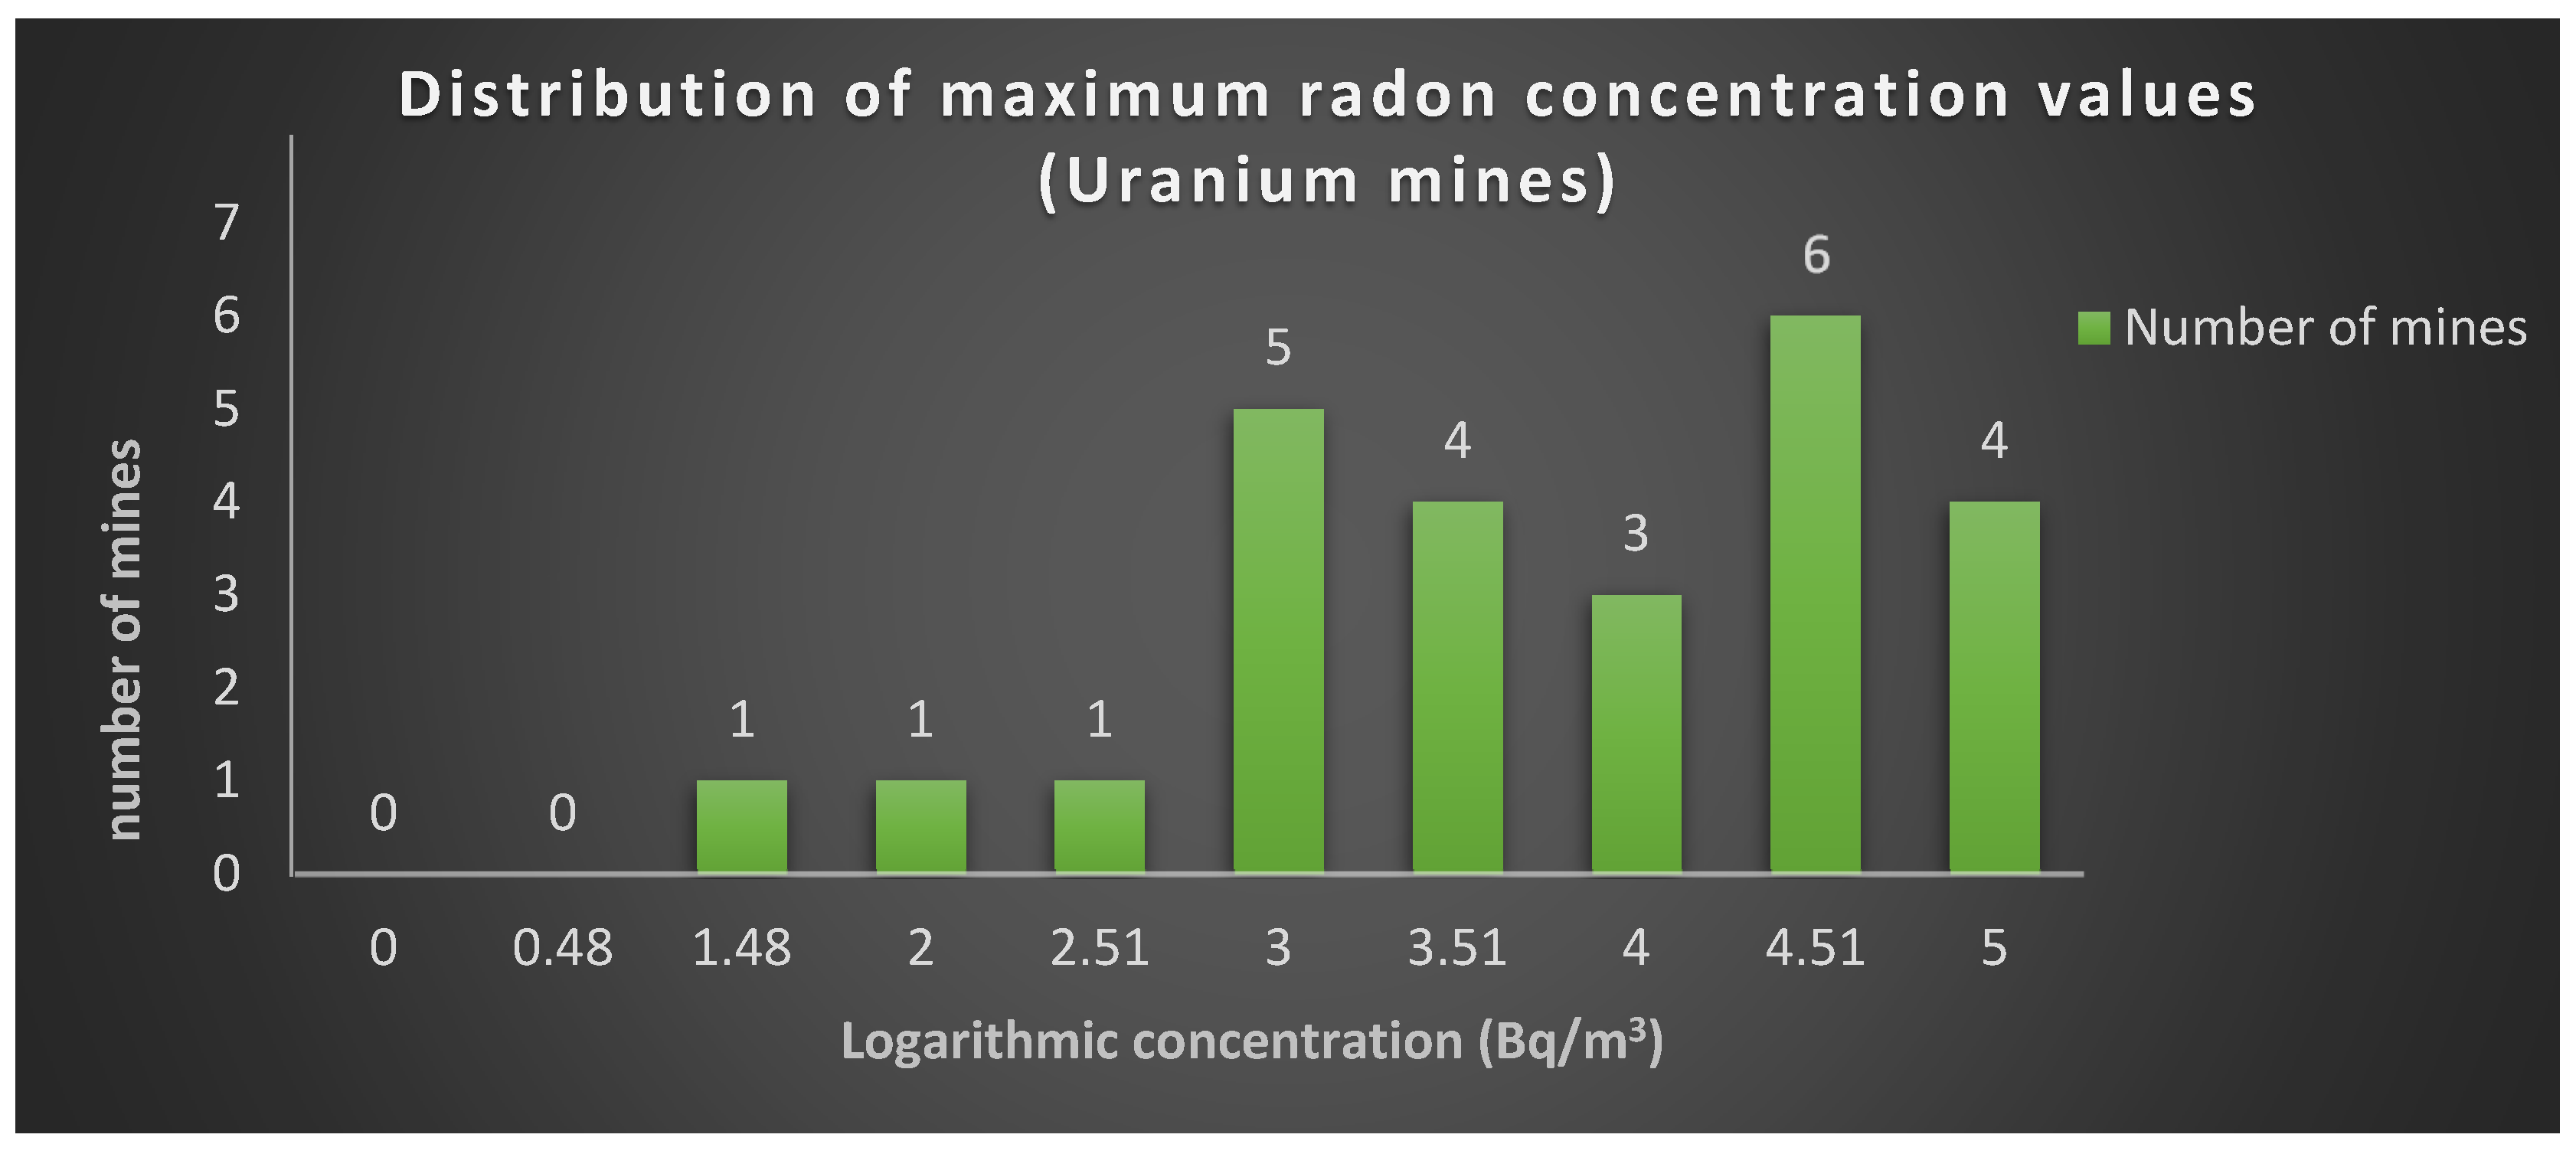
Starting with the uranium mines,
Figure 1 presents the results collected from 26 international publications. These publications refer to 25 uranium mines, the concentrations of which are presented in a bar chart.
According to
Table 1 and the following 10 groups, most uranium mines, and specifically 6 out of the 25 in this category, have concentrations ranging from 10,000 to 100,000 Bq/m
3 (logarithmic concentration 4.51). These concentrations are quite high, but at the same time, this is expected for uranium mines, as the presence of uranium is directly related to radon. In addition, there is a small number of mines (3 out of 25) that exhibit concentrations from 0 to 320 Bq/m
3, with the majority of the mines being above 320 Bq/m
3. The highest deviation between maximum and minimum radon concentrations in a mine occurred in the South Terras mine in England, with the lowest concentration at 41,667 Bq/m
3 and the highest at 3,932,920 Bq/m
3. The maximum value was measured in a shallow gallery of the mine, making it one of the highest levels recorded in Europe [
8].
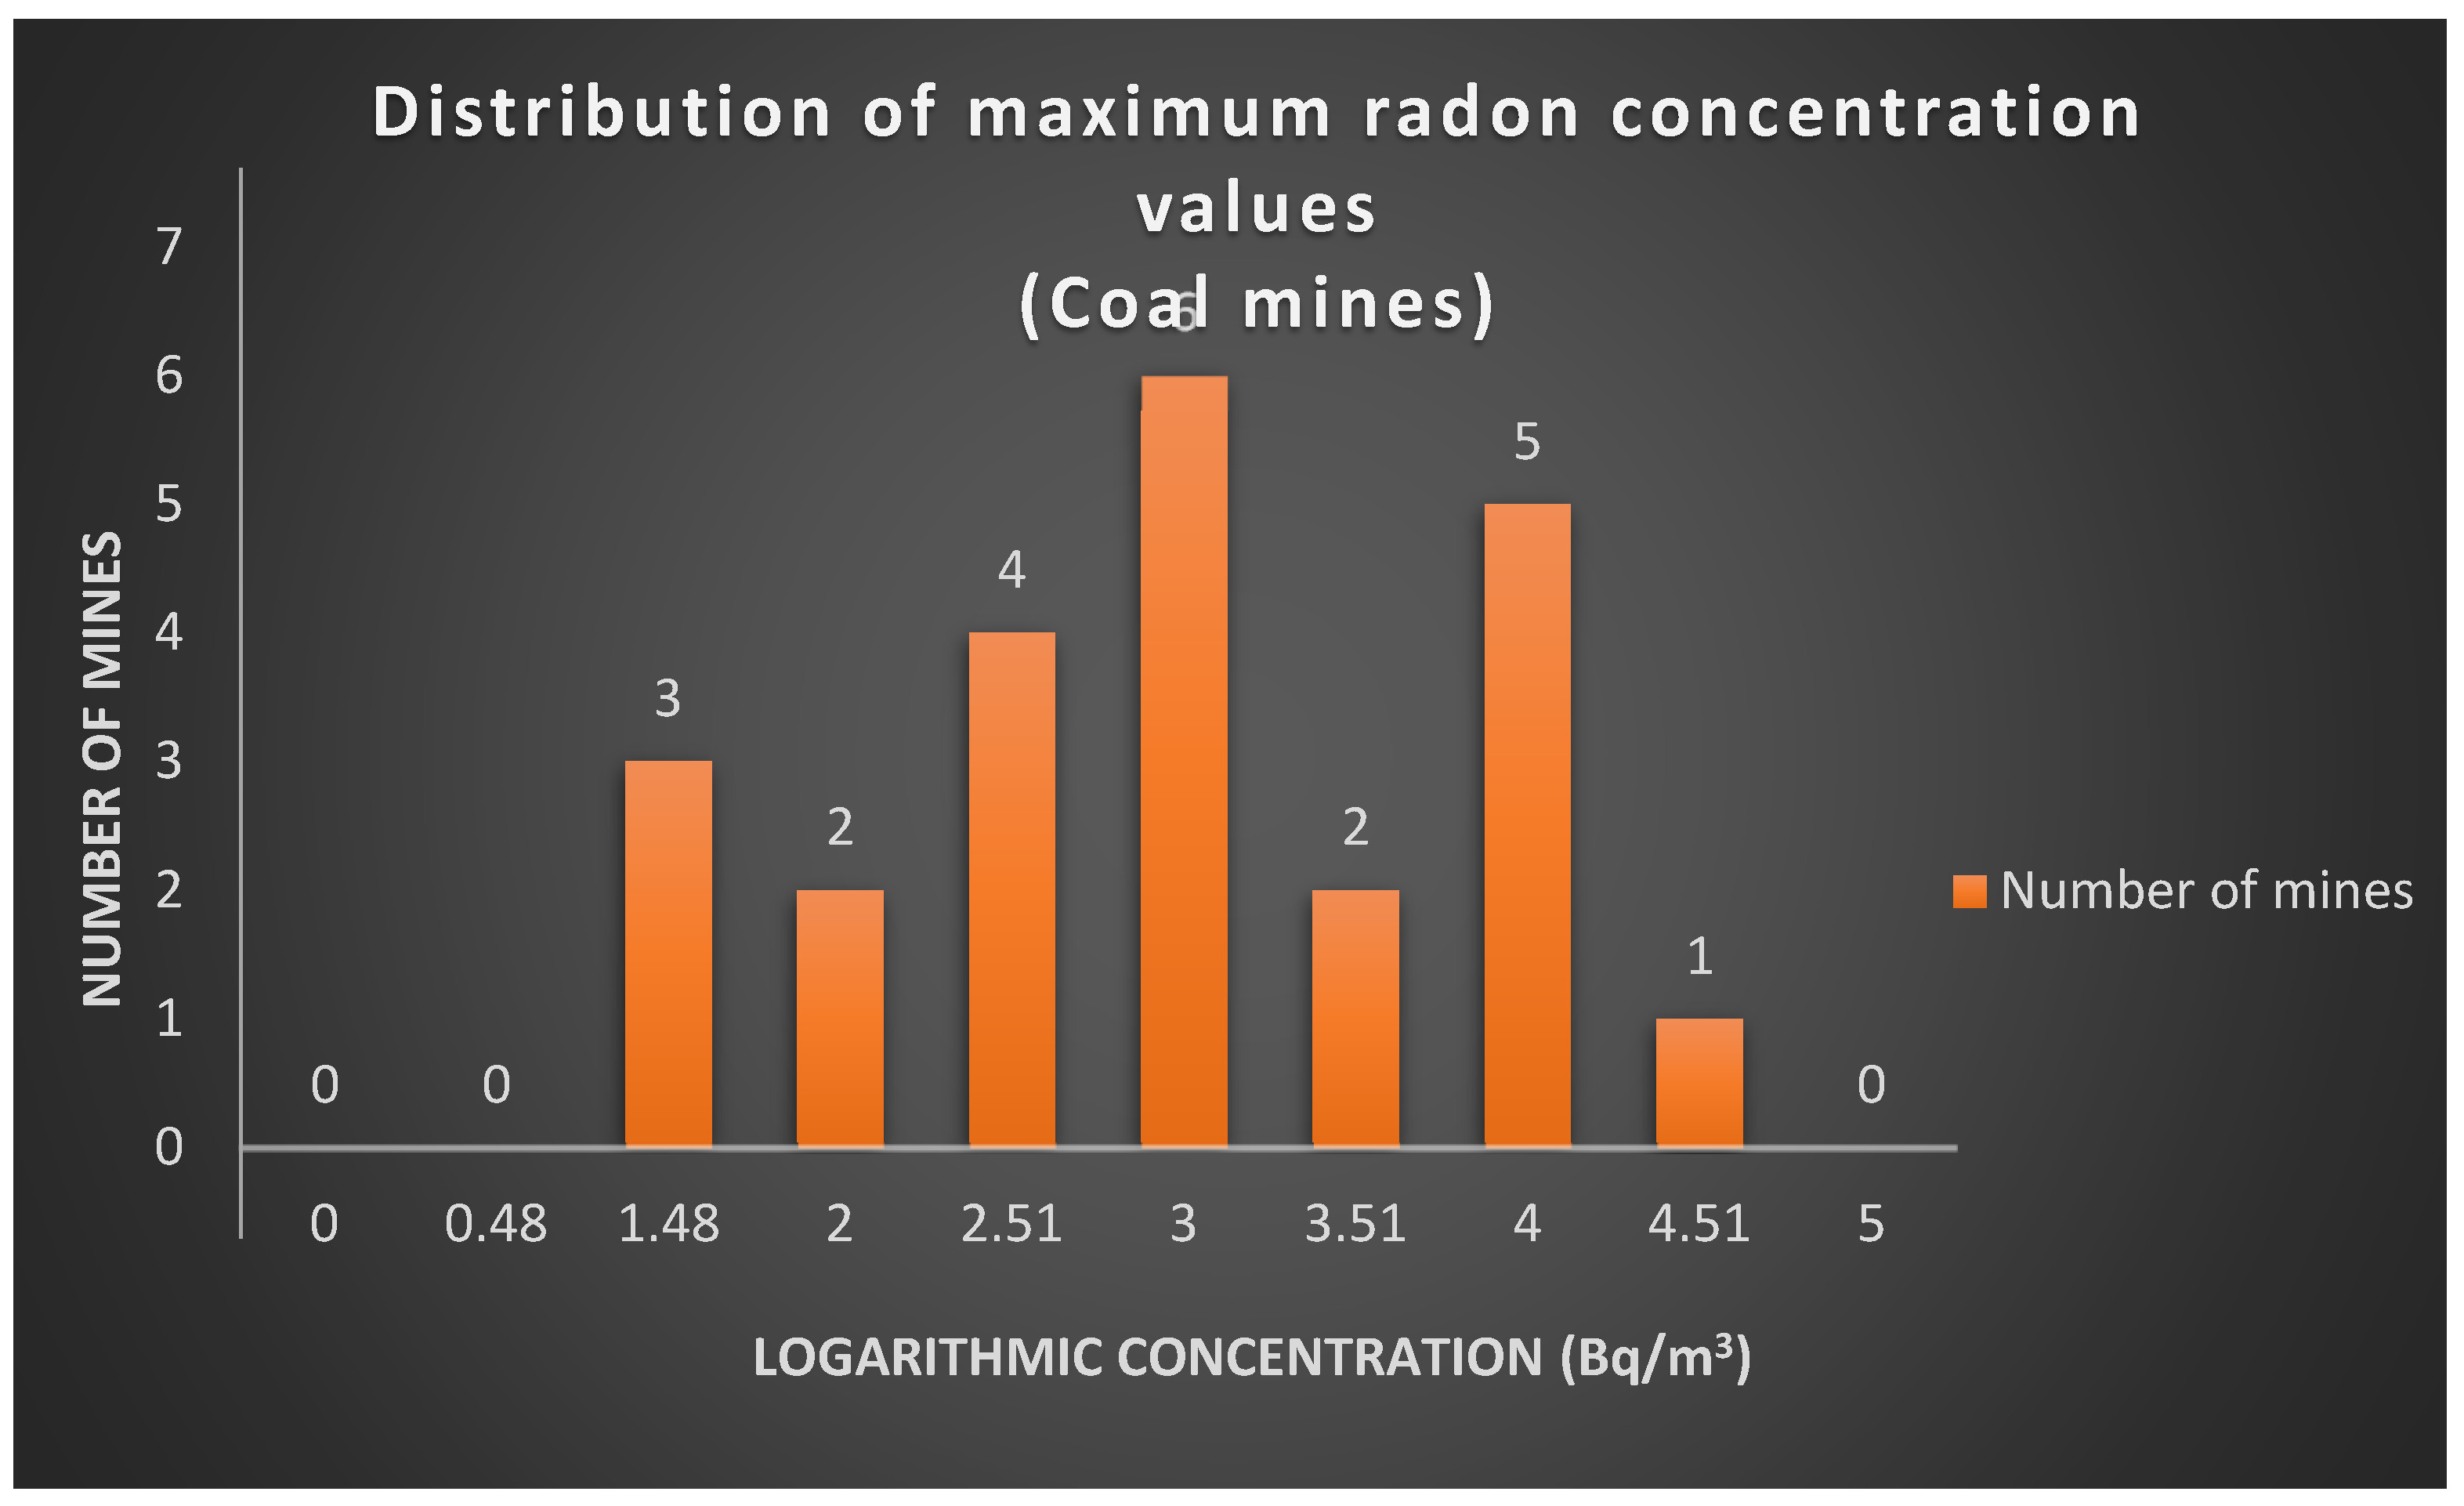
As far as the coal mines are concerned,
Figure 2 demonstrates the results collected from 21 international publications. These publications refer to 23 coal mines, the concentrations of which are presented in a bar chart.
From
Figure 2, it is observed that most coal mines, and specifically 6 out of the 23 in this category, have concentrations ranging from 320 to 1000 Bq/m
3 (logarithmic concentration 3). Given that these are the “maximum values” of these six mines, and after comparing them with the maximum concentrations in uranium mines, it is concluded that they are not very high. With “reference points” the concentrations between 320 and 1000 Bq/m
3, there is approximately an equal number of mines with values below and above that range (nine mines with concentrations below 320 Bq/m
3 and eight mines with concentrations above 1000 Bq/m
3). Therefore, for the coal mines category, there are cases of both “safe” and “unsafe” mining sites.
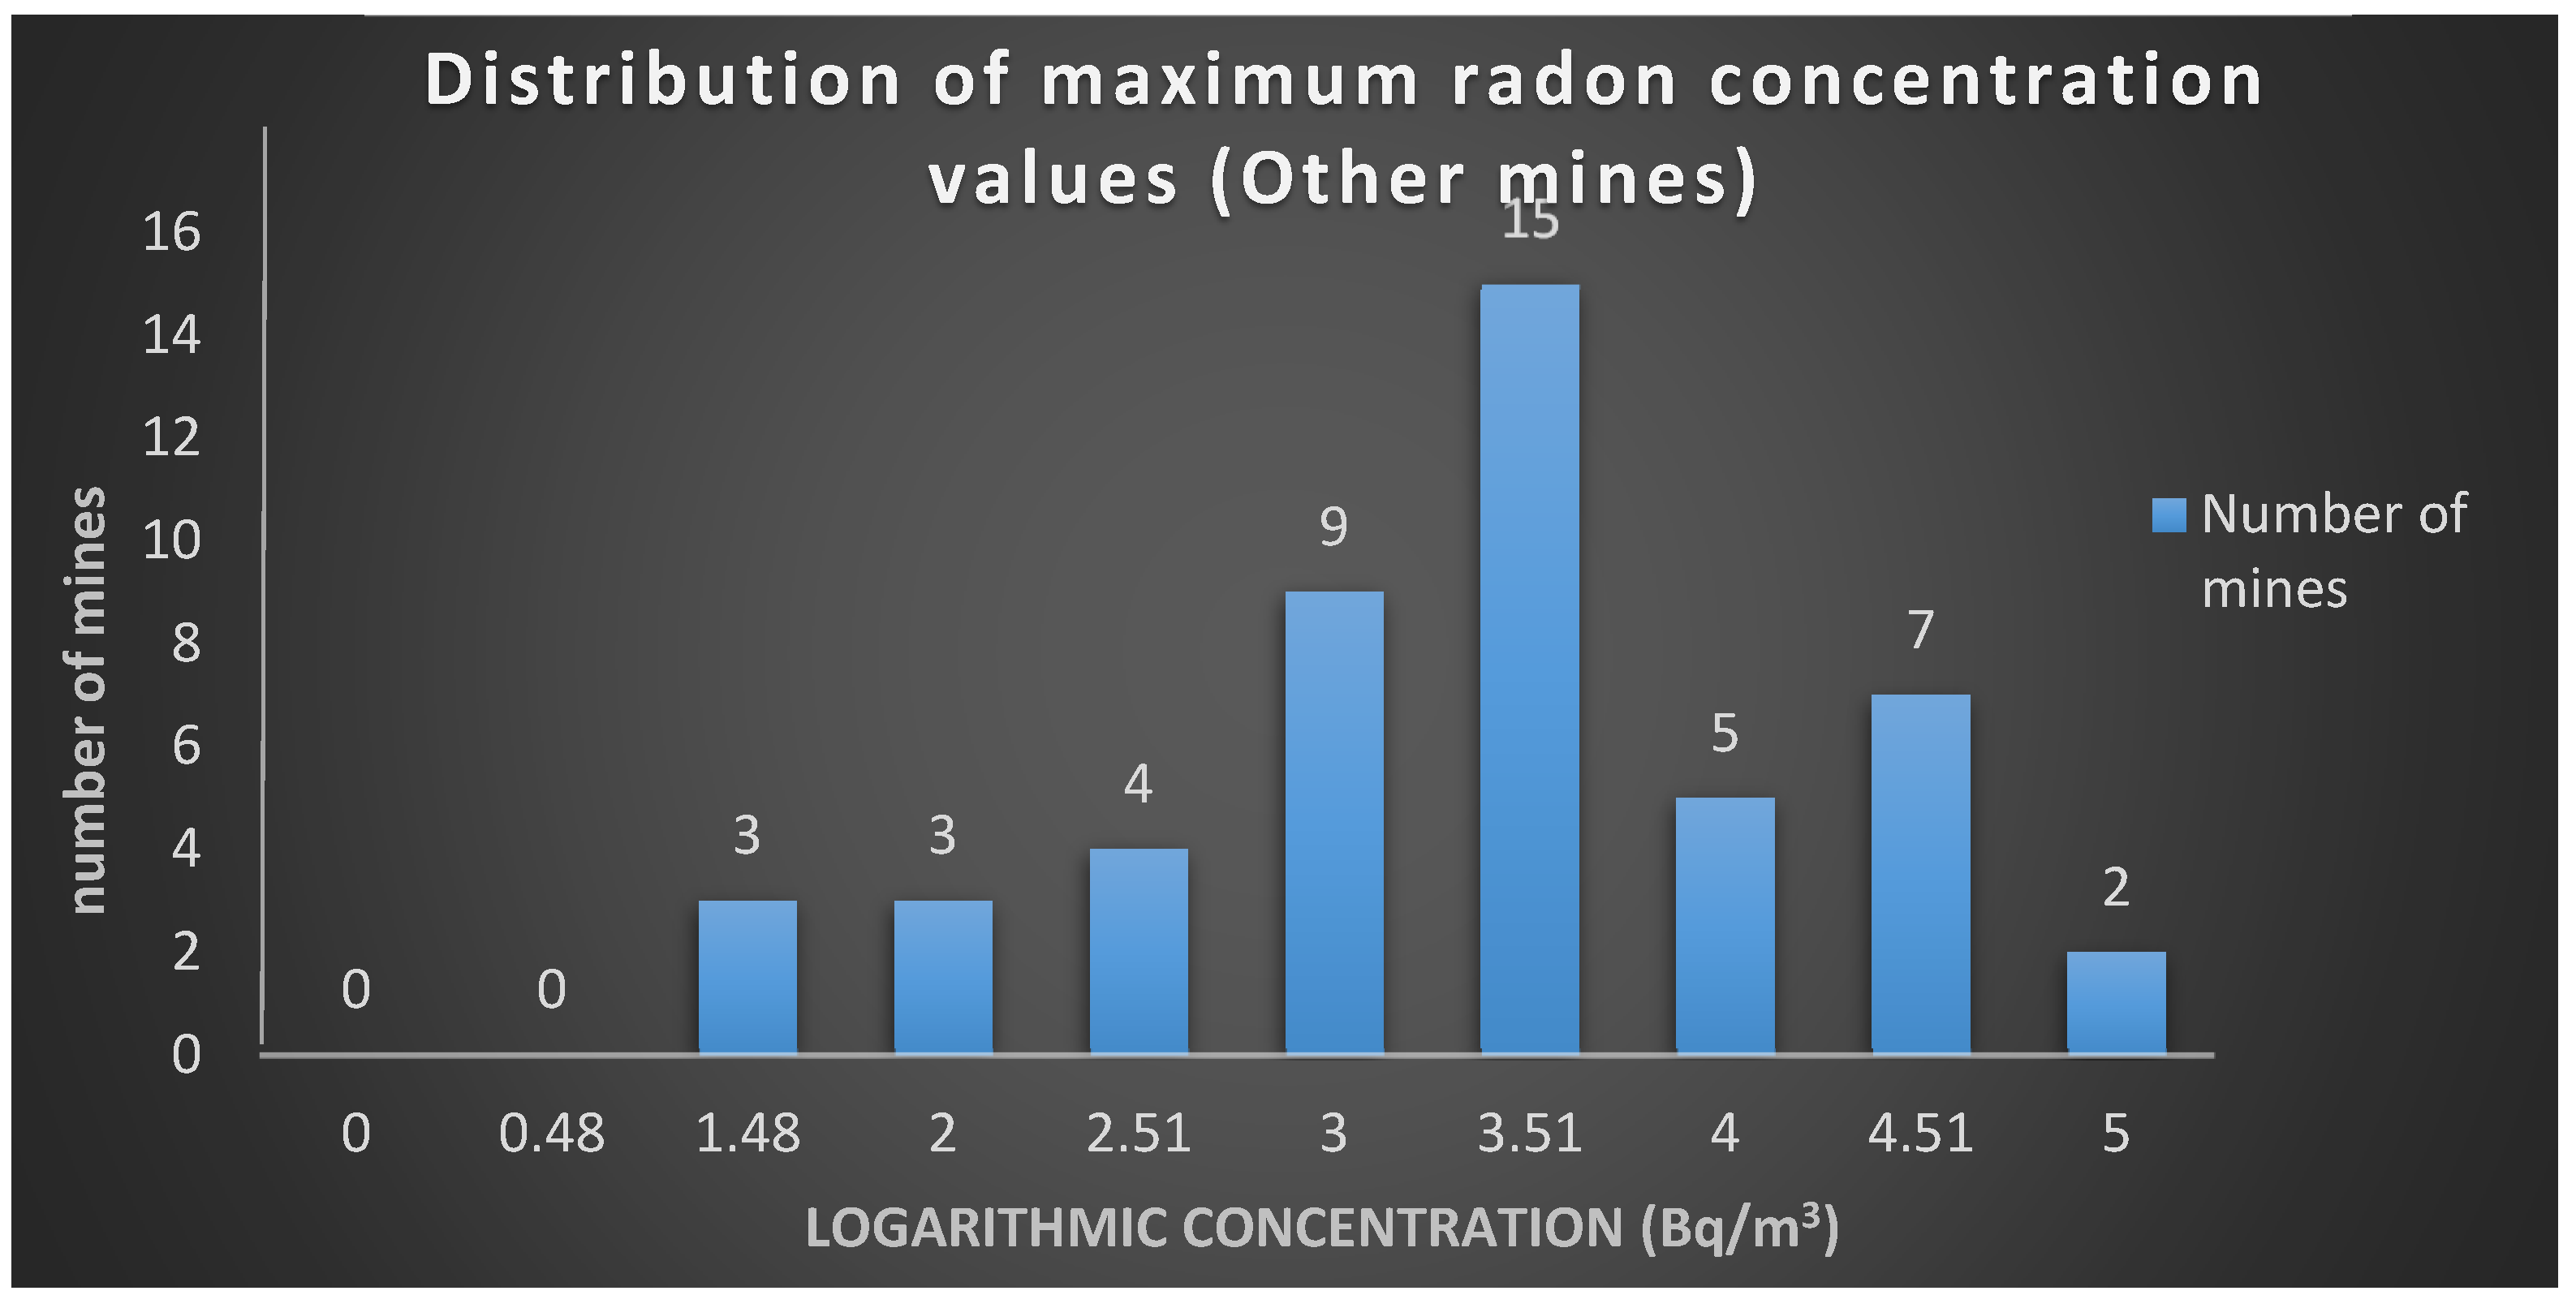
Last but not least, in the category of other mines, 35 international publications were studied and analyzed. As seen in
Figure 3, the concentrations of 48 mines are demonstrated. Most mines, and specifically 15 out of the 48 in this category, have concentrations ranging from 1000 to 3000 Bq/m
3 (logarithmic concentration 3.51). The majority of these mines (29 out of 48 mines) exhibit concentrations between 1000 and 100,000 (or more) Bq/m
3, which are quite high and can turn out dangerous to human health. With the lowest concentration at 1.37 Bq/m
3 and the highest at 7,100,000 Bq/m
3, the range of variation in radon concentrations in this mine category is also wide, as was the case in uranium and coal mines.
5. Conclusions
Groundwater in underground mines carries radon from the rocks to the mine but also transfers it to a considerable distance in the mine galleries. The highest concentrations of radon occurred during the summer, while the lowest occurred during the winter. The main external factor influencing seasonal changes in radon concentrations was the outdoor temperature. During winter, warmer air (compared with the atmosphere) inside the underground routes flows towards the atmosphere, taking radon with it, resulting in the reduction in radon concentrations inside the mine. On the other hand, during summer, high temperatures favor radon exhalation from the rocks, but at the same time, the low pressure inside the mine makes it harder for radon to “escape”, thus resulting in higher concentrations. Surfaces with vegetation showed higher exhalation densities, compared with barren ones, perhaps because the root structure increases soil porosity and moisture retention.
Coal mines showed lower radon concentrations than other mines. This is attributed to the high ventilation rate required to reduce methane and other gases, in order to prevent gas explosions. Uranium mines showed higher radon concentrations than other mines. As mentioned before, uranium is inextricably linked to radon. Radon is derived from radioactive uranium series; thus, more uranium means more radon in the mines. Radon concentrations inside the mines were 5–10 times higher than the values outside. Given the ability of radon to dilute in the air and dissolve easily in various liquids, lower values in its concentration would appear very often in the atmosphere outdoors. Well-ventilated areas along the tourist routes had the lowest values of all measured parameters. Generally, ventilation plays a major role in mines, since it reduces radon concentrations. Thus, higher ventilation rates resulted in lower radon concentrations, and lower doses (effective, absorbed, and equivalent). Radon concentrations varied with the season. In particular, in the rainy months, they were an order of magnitude lower (5 Bq/m−3) than concentrations in the drier months (45 Bq/m−3). This phenomenon can be attributed to the increased soil moisture, which fills the empty pores and increases the hydrostatic pressure, thus reducing the diffusion of soil gases such as 222Rn (Asimakou, 2021 and references within this work).


