1. Introduction
External dilution on underground open stoping exploitations is a matter of paramount importance for the proper operation and cost-effectiveness of the mining process. Ore dilution refers to the waste material (sterile or material of low useful content) that is not separated from the ore [
1]. Hence, it mixes and interferes with the ore, increasing the mined tonnage that requires handling, while decreasing its grade. Dilution can be defined as the ratio of the tonnage of waste mined and sent to the mill to the total tonnage. Several mathematical definitions have been formulated over time to define and to explicitly calculate the dilution rate as given by Pakalnis [
2]:
One of the issues to consider to manage and control external dilution is the proper design of the exploitation in terms of stability. The failures and over-breaks associated with poor stability conditions not only pose threat to the overall safety of the workers and the mine, but contribute to a great extent to the presence of waste inclusions within the mined ore. One of the traditional tools that have been developed to control such issues is the empirical stability graphs, as introduced by various researchers [
3]. Empirical stability graphs have proved to be very useful for the early assessment of an open stope’s stability condition. The determination of the ore external dilution rates is made possible through modifications that were made focusing on the phenomenon. Such estimates regarding the theoretical quantification of the over-break are an important step to the optimal design of the ore exploitation that can be readily available from the initial design stages of the project.
Typical stability graphs consist of two coefficients, related to the overall rockmass conditions and the extent of the mine opening. These factors are the stability number N (or its modified form N’) and the hydraulic radius HR. The stability number is calculated through this equation:
where A, B, and C are defined as the stress factor, the adjustment orientation factor, and the gravity factor, respectively, while Q’ is the modified rock mass quality index by Barton et al. [
4] in which J
w and SRF are both equal to 1.
A number of researchers had contributed to the development of the stability graph nomograms that actually assess whether the selected mining stope will remain stable or it will experience failures. Starting from Mathews [
5], who first introduced them, and Nickson [
6], one of the most notable and widely used stability graph nomogram is developed by Potvin [
7]. Such developments were continued by various other researchers, enriched by new datasets, such as the ones by Mawdesley et al. [
8] as well as Papaioanou and Suorineni [
9], which use the nomograms to further investigate other properties in the open stope exploitation.
Great mention should be made in the work of Le Roux and Stacey [
10] and Papaioannou and Suorineni [
9]. More specifically, by following similar methodologies, mathematical equations for the estimation of the ore external dilution rate, which are focused on each of the examined open stopes’ surfaces, and a very promising dilution-based stability graph approach are created.
Besides the above empirical design approaches, lately, the use of analytical codes has made the quick and reliable assessment of stability conditions possible in underground excavations. As such, the estimation of the over-break located in the stopes HW, FW, and crown area can be estimated and, consequently, so can the extent of the external dilution rate. This paper uses this approach to assess the extent of the failure and correlate the findings with the ones derived from the stability graphs. Several analyses have been conducted with the use of the Rocscience RS2 software package to produce a representative number of cases from worst to best conditions and from small to extensive mining stopes. With these parametric analyses, firstly, the stability condition, and, secondly, the open stopes’ walls over-break rates are evaluated and linked to the expected external dilution rates.
2. Finite Elements—Parametric Analysis
2.1. Introduction
The purpose of the parametric analysis that was employed was to “decode” the mechanism of the phenomenon across a variety of modelled conditions. In this sense, the sensitivity of the stope stability and failure extent can be assessed as a response to the changes in the values of key parameters. Furthermore, the direct comparison between the stability graph’s estimation and the results obtained by the models can also be made in various conditions in terms of the opening dimensions and the geotechnical conditions encountered in order to correlate their results and develop critical linkage between them. With this in mind, this analysis provides the opportunity to transition from the results of the empirical approaches to ones of the numerical modeling.
Furthermore, the RS2 is a finite element analysis software that provides the ability to make 2D analyses in a short computation time. Several researchers decided to use it in order to study corresponding topics. Furthermore, it allows the use of different types of design parameters by following the developments in the field of rock mechanics. Thus, in the context of the present paper, the uses are selected, considering that the potential of this software can overcome the initial difficulties by making appropriate assumptions.
2.2. Parameters: Values and Assumptions
The open stopes’ stability conditions are simulated and the ore external dilution is estimated in several cases where changes and differentiations in the values of key parameters are chosen. These parameters are the following, while the various changes analyzed are summarized in
Table 1:
Material properties of the surrounding rock;
Stopes’ geometrical characteristics;
Infill material between joints surfaces;
Number of joint sets;
Inclination of joint sets.
Based on all characteristics examined, a total of 18 models were developed and assessed in terms of stability performance and dilution characteristics. It is very important to analyze the selection criteria and some basic properties for the above parameters. First of all, two different material types are examined, as the differentiation of the geomechanical characteristics greatly affects the open stope’s stability performance. The first one is gneiss, a very compact and competent formation, with good geomechanical characteristics, while the second is marble formation, with weaker properties and potentially greater instability problems. Concerning the rock mass’s properties selected for the analysis, these were selected using a plethora of relevant empirical equations, reputable databases (e.g., RocProp), and logical assumptions. Thus, the basic material properties that were assigned to the rock mass of each material type are given in
Table 2.
Regarding the geometrical characteristics of the stope, the two main geometries were selected, as shown in
Table 3. Their difference concerns the overall size of the opening, inflicting different stress conditions in terms of the values and distribution to the surrounding rockmass. Moreover, given the 2D character of the finite element analysis, an assumption was taken that the strike length of the openings was 1000 m, reflecting the infinite nature of the plain strain analysis.
In addition, the number of the joint suggests that the rockmass has a significant effect on the open stope’s stability condition too. The distribution of discontinuities on the field and the interaction of the different joint sets can significantly affect the examined field’s tension distribution, leading to potential large-scale instability problems. The second examined category of this parameter includes one basic joint set and several shorter discontinuities with a random layout. The way this network is approached is considered to be highly innovative. More specifically, the random position and direction joints are approached through the application of a low-density Voronoi joint network. The formation of the combination of this system with the basic joint set visually presents the morphology of the desired random joints. Regarding the distance between adjacent joints, a typical value of 1.5 m was assigned.
Finally, the choice to place an infill material between the discontinuities’ surfaces, as well as the infill material’s properties, greatly affects the overall stability and failure mode in the open stope. As such, this was investigated using models that included such infillings contrary to plain models which lacked any such features.
2.3. Methodology of Overbreak Estimation
The estimation calculation of an open stope’s surface overbreak and, concurrently, the ore external dilution rate is accomplished through the RS
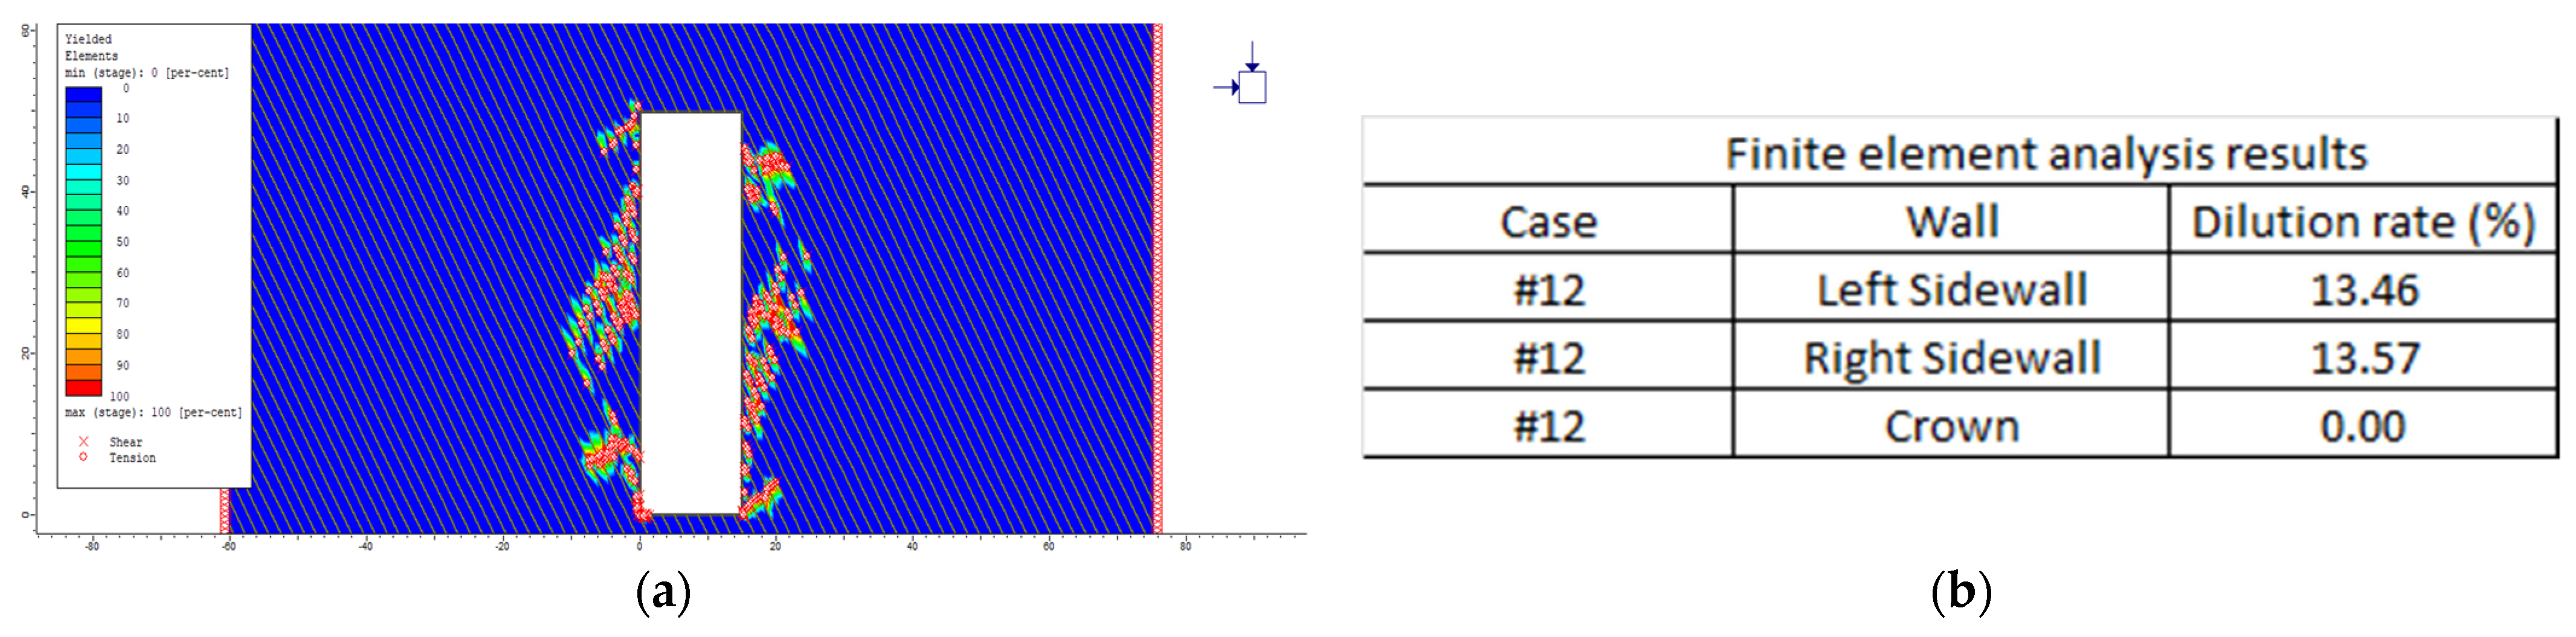
2 software output data. This software helps to predict the zones of the rock mass outside the stope’s boundaries, which potentially could fail on tension or/and shear (“Yielded Elements” distribution). The over-broken areas outside the stope’s boundaries are estimated considering the “Yielded elements” representation with the rock’s relaxation zones (“σ
3 ≤ 0” distribution) and the basic examined surface’s failure mechanism. Furthermore, due to the 2D analysis, it is considered that the properties’ output graphs remain constant in the third dimension. Supposing that the ore and barren material have the same specific weight, the ore external dilution rate of an examined open stope’s surface is calculated through the Equation (4):
3. Results
In the context of this short report of the original research, it is not possible to exhibit the full list of the final results. Thus, some important approaches which arose through the processing of the output data are presented in this section.
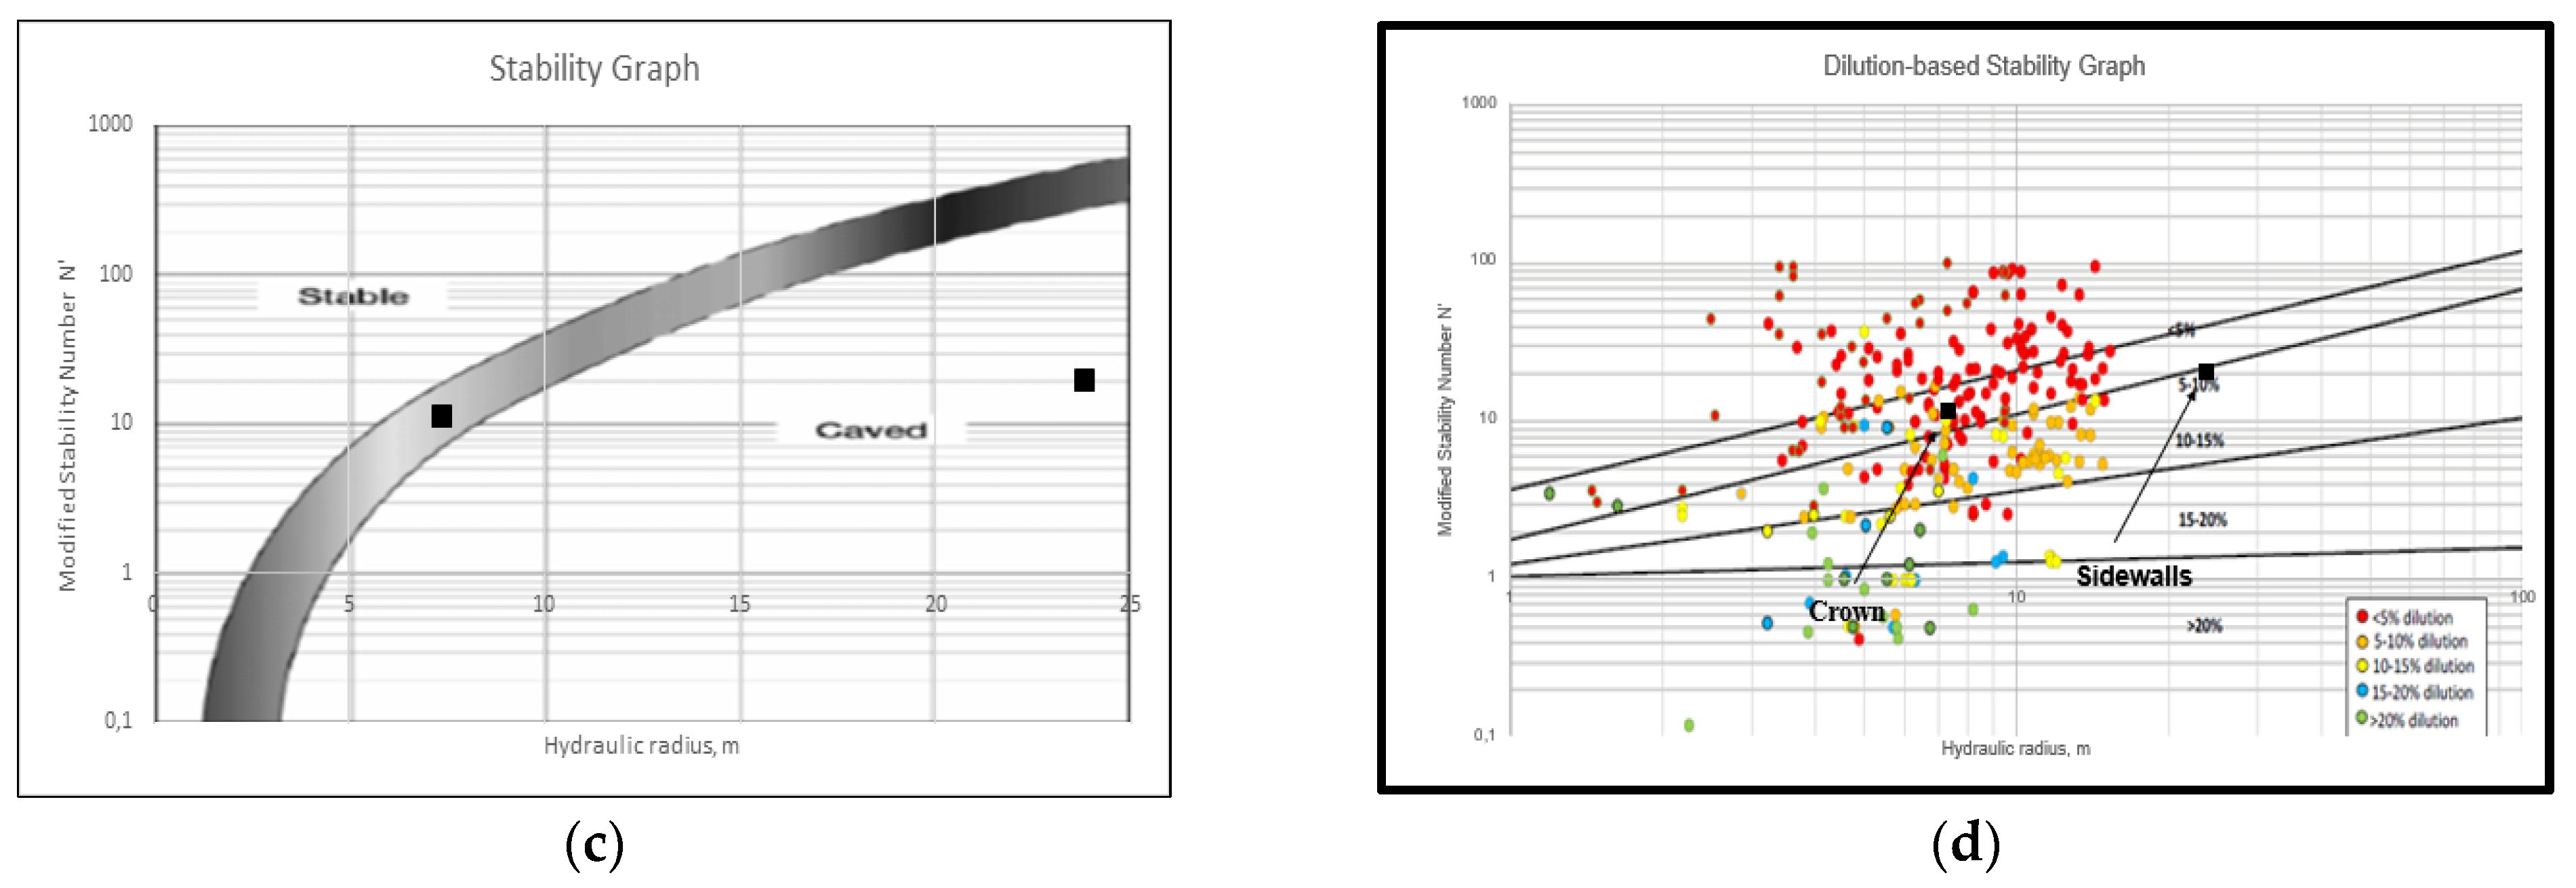
In
Figure 1, the “Yielded Elements” distribution (
Figure 1a), the ore dilution rates (
Figure 1b), and the results of the analysis through the examined empirical stability graphs (
Figure 1c,d) are shown for a selected case study (#12).
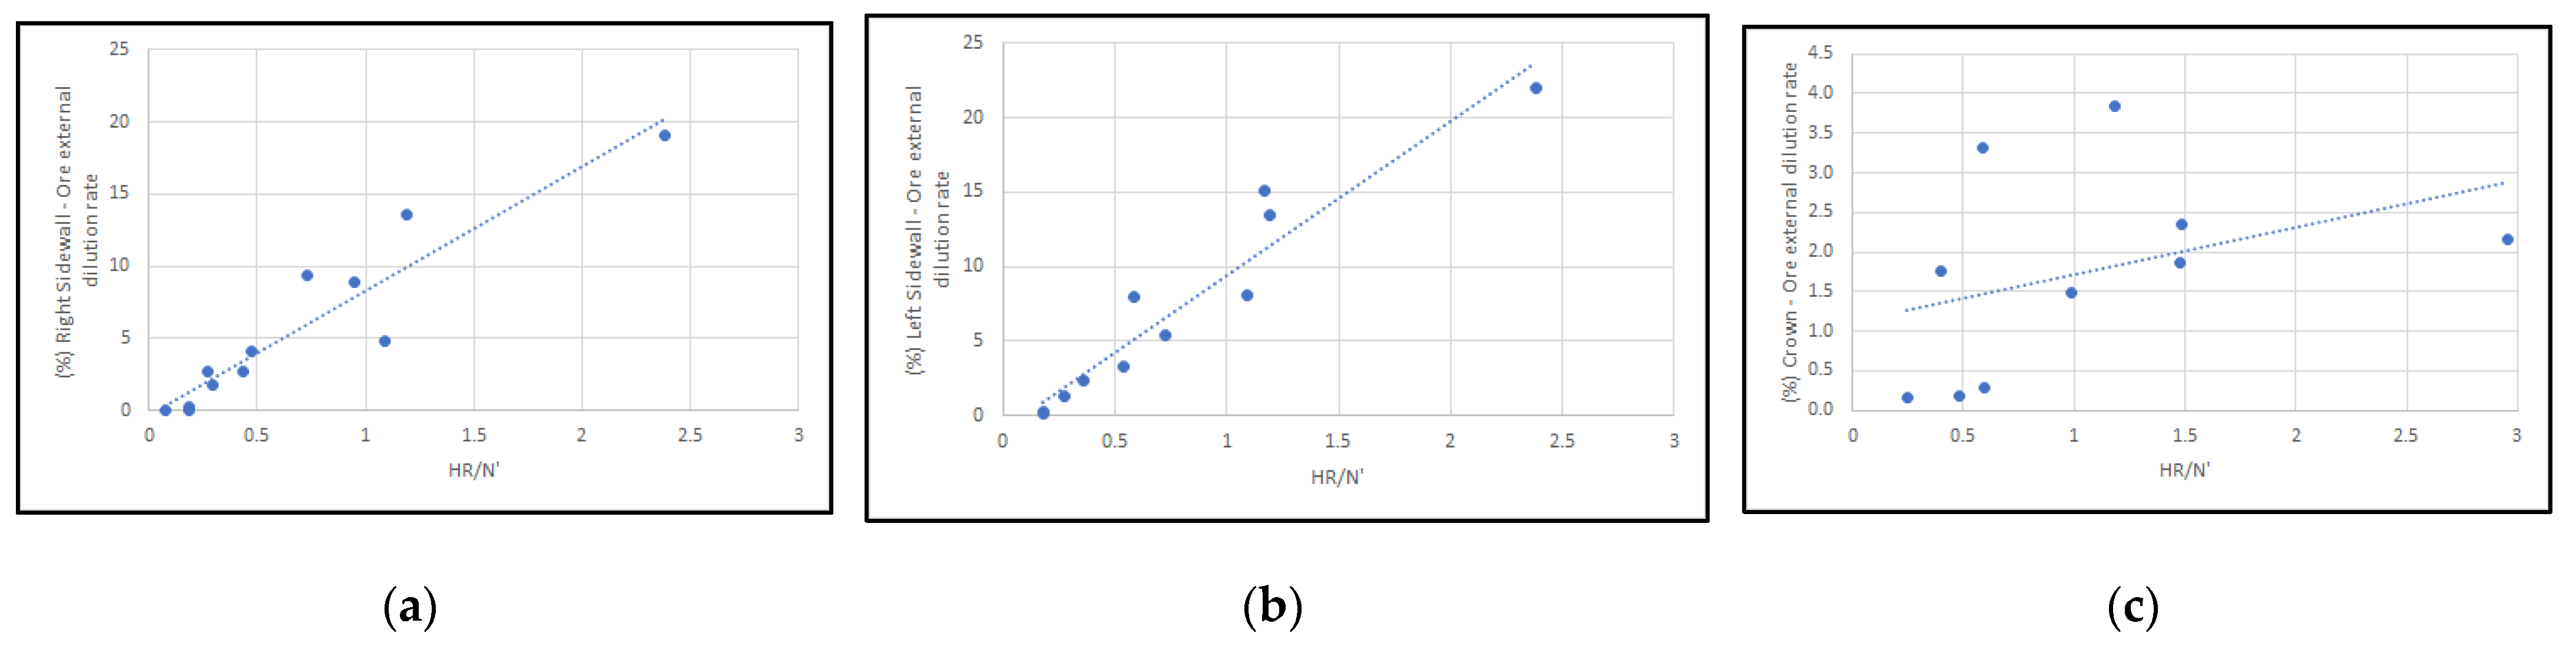
Using the output data and following similar methodology with Le Roux and Stacey [
10], a chart which correlates the estimated ore external dilution rates and the «HR/N’» ratio is created for each of the examined open stope’s surfaces (crown, left sidewall, right sidewall). Three equations for the estimation of the ore external dilution rates are formed by placing linear trend lines on these charts (
Figure 2), as given below:
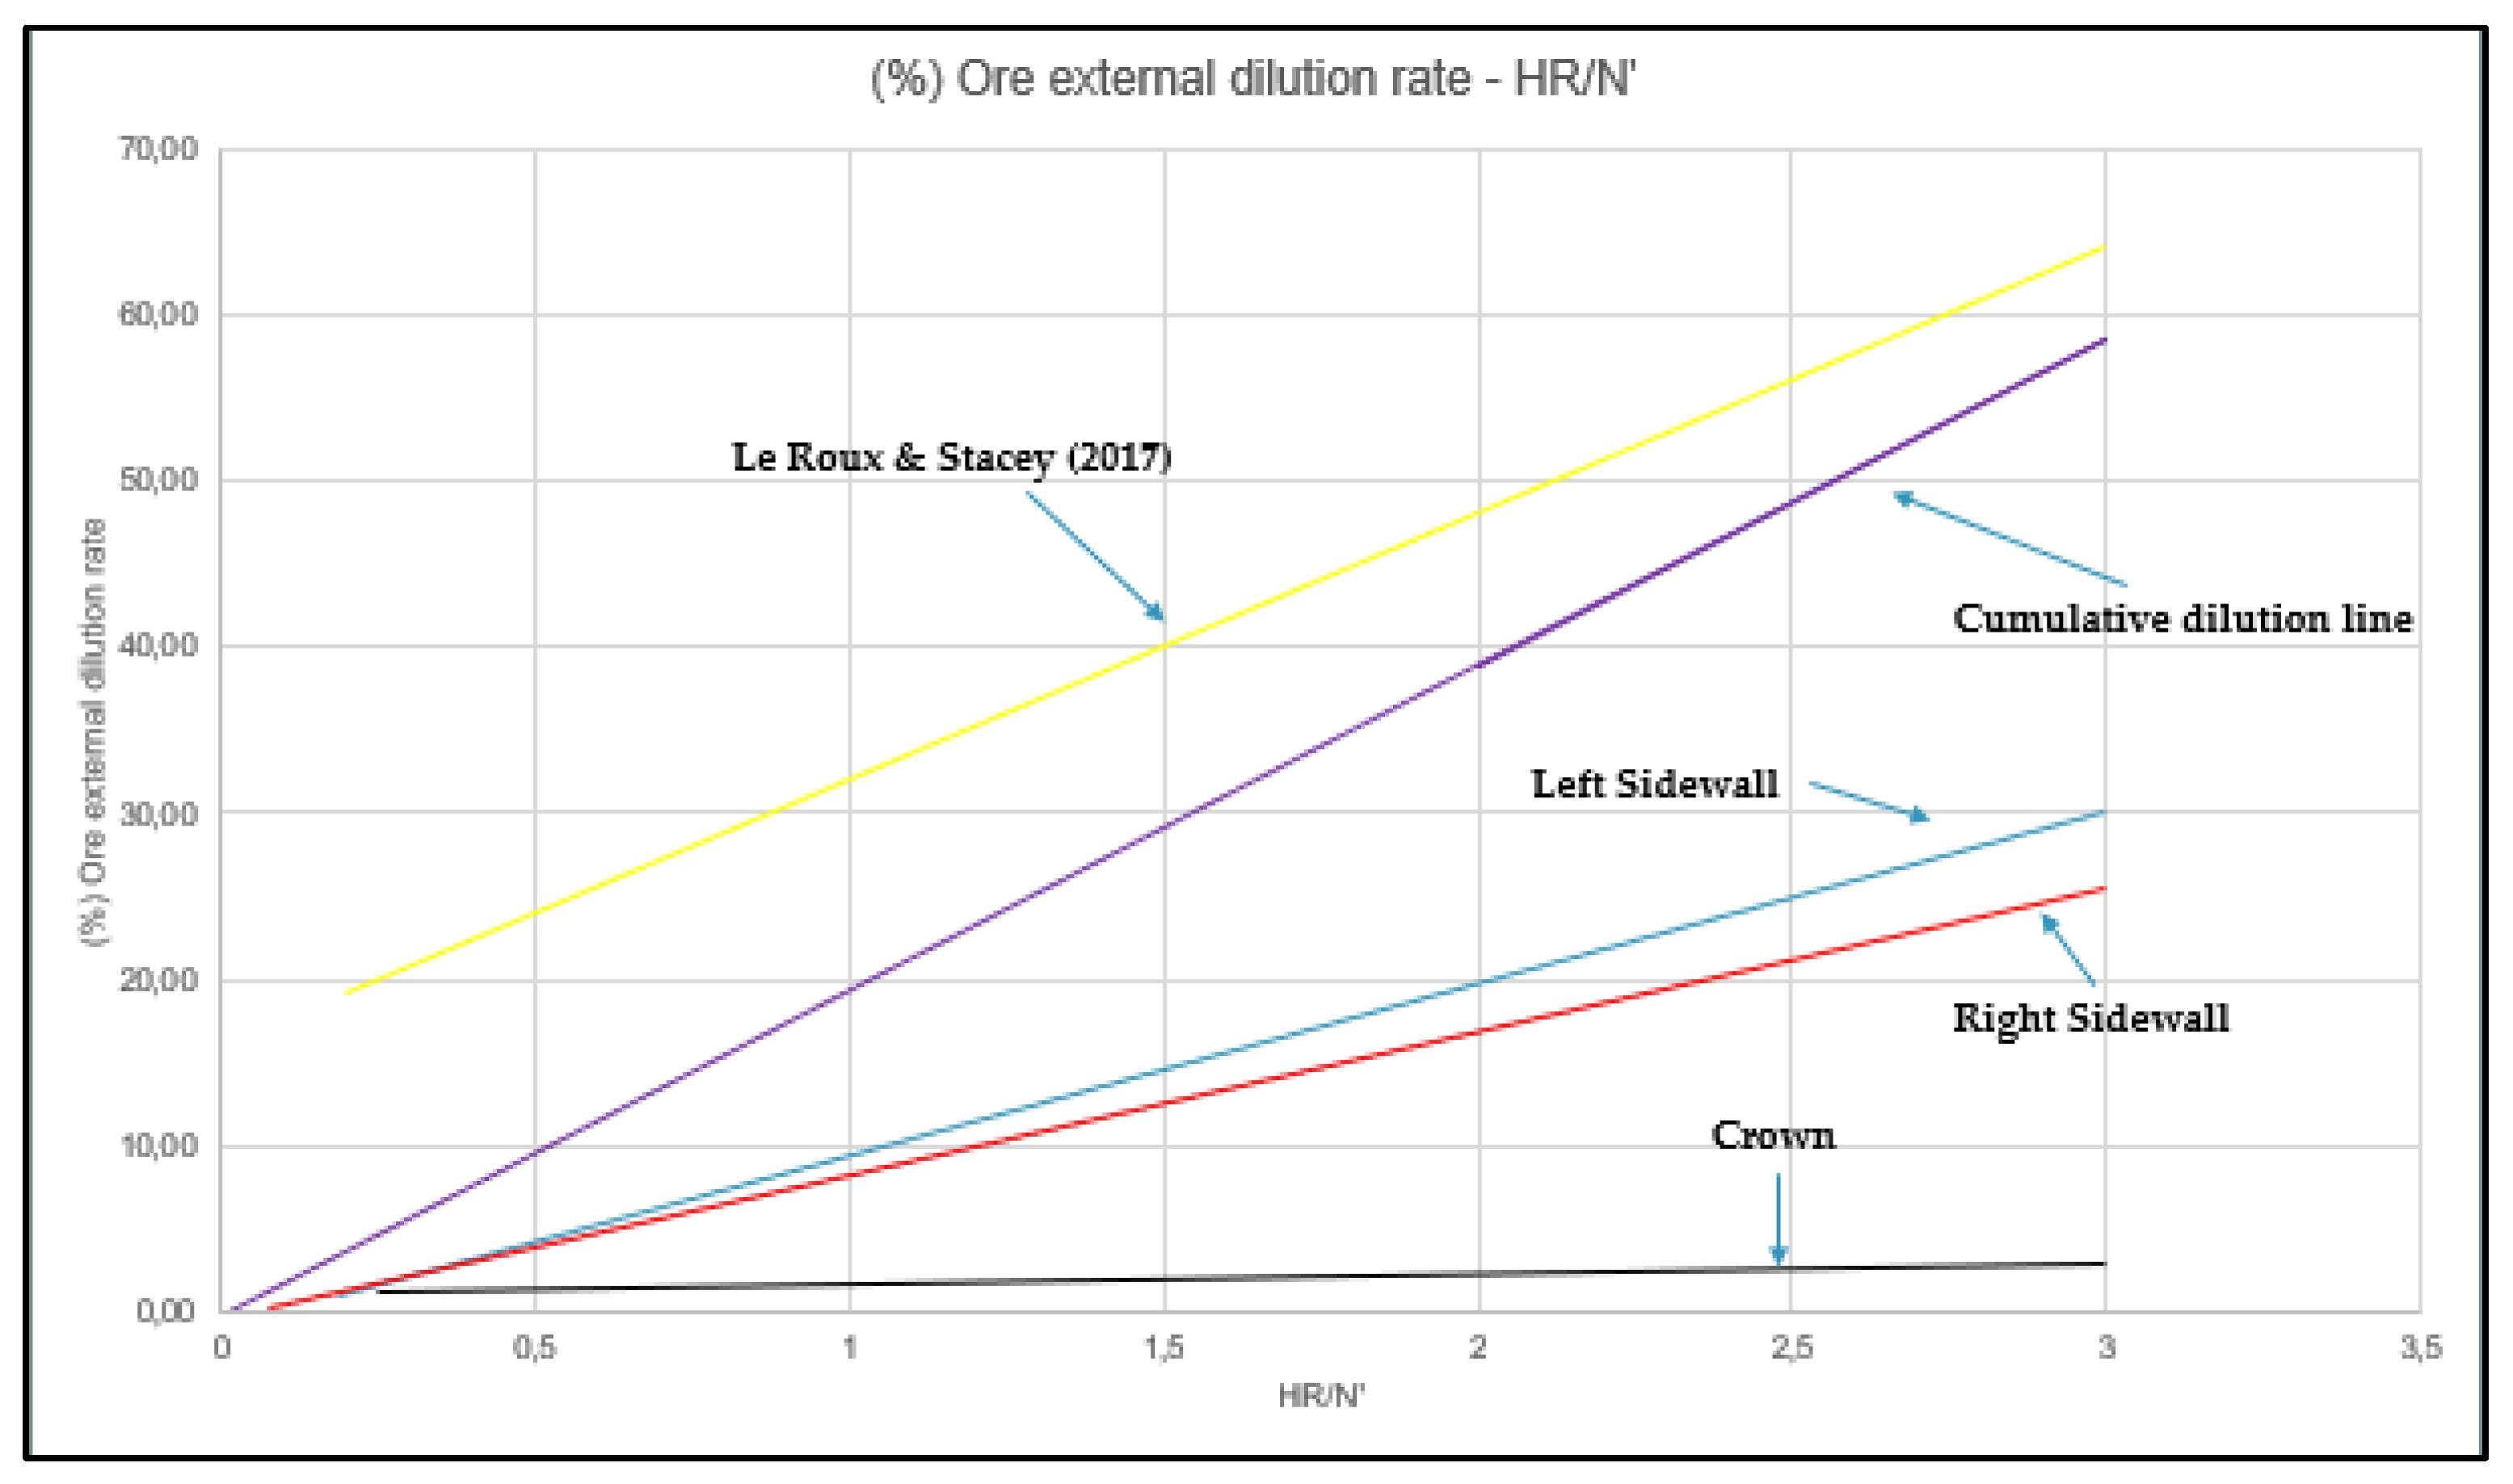
The model’s performance is validated against the findings and empirical proposals of Le Roux and Stacey (2017), and the results are presented in
Figure 3. As it can be seen, there is a considerable correlation between the two analyses, especially in the upper end of the HR/N’ parameters values (ratio’s upper limit value = 3). Provided that the crown’s dilution issues that were experienced in the analysis are resolved, then the correlation of these two approaches (the Le Roux and Stacey line and the cumulative dilution line) could be further improved. It is noted that these approaches are validated for ratio HR/N’ values between 0 and 3.
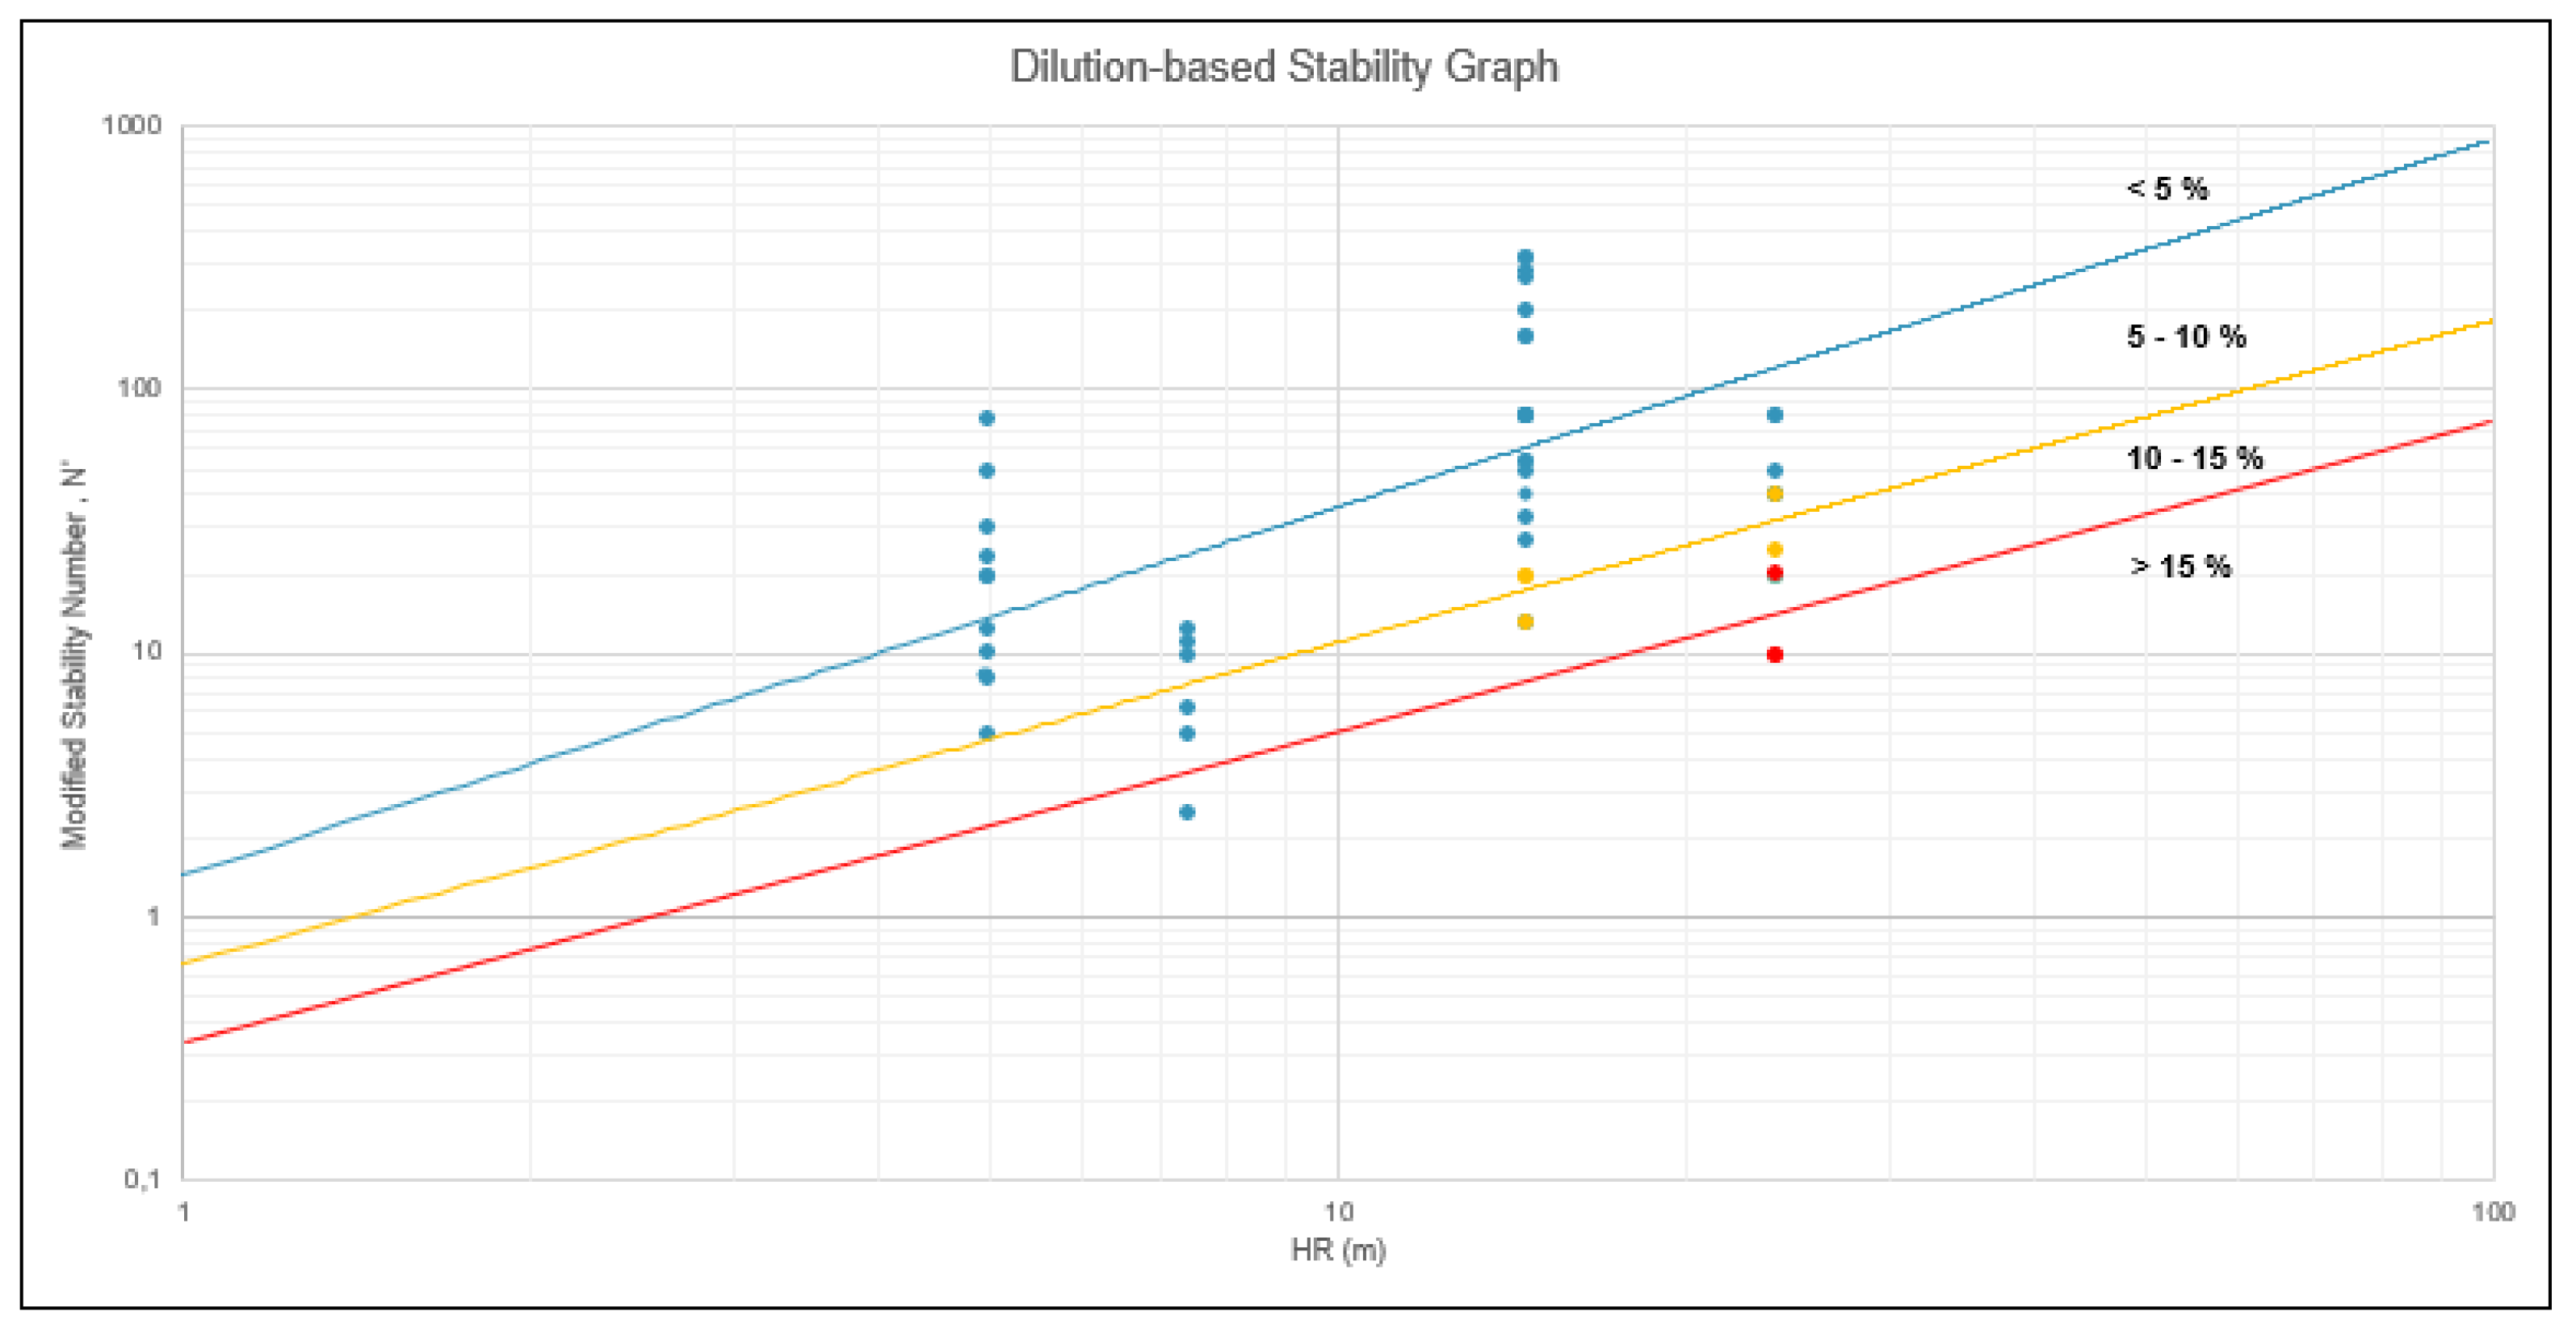
Furthermore, using the software results, and following similar methodology with Papaioanou and Suorineni [
9], a dilution-based stability graph approach is formed (
Figure 4). This special SG form makes it possible to estimate a potential ore external dilution rate caused by an open stope’s surface overbreak by using basic stability parameters (N’ and HR).
4. Discussion and Conclusions
Empirical models incorporate the lessons learned from a number of past cases and historic records. The stability graph models that have been presented by various researchers are broadly considered to have fairly accurate estimations for stability conditions of the open stope mining. Nevertheless, the use of numerical modelling can be further used to depict the stability conditions with great accuracy. This could allow for having quantified assessments in cases beyond the exact past examples, which could, thus, be beneficial in challenging conditions by further extending the applicability of such approaches. This is the very aim of the paper.
It has been found that the analysis presented yielded very satisfactory results for the two lateral surfaces of the open stoping area. Furthermore, their equations for the preliminary estimation of the ore external dilution showed a good fit and correlation with the scatter of the examined points of the charts. On the other hand, the results of the crown’s analysis presented a low correlation level with respect to the ones estimated from the empirical approaches. Nevertheless, in terms of the overall instability and dilution potential, the results obtained are directly comparable with the ones proposed by other researchers, especially for the upper values of the «HR/N’» ratio.
Nevertheless, it is necessary to carry out a broader verification analysis with the utilization of 3D numerical codes while also having more direct and explicit in situ field data. This could further calibrate and fine tune the proposed models in order to create a more accurate assessment of the expected ore external dilution rates.


