Abstract
This work aims to deliver the objective of developing an appropriate set of mathematical models and a relevant software program to calculate the voltage distribution and energy consumption of a Hall–Héroult reduction cell, together with a deeper understanding of the complex physical and chemical phenomena underlying the alumina electrolysis process. The work involves an analysis of the basic principles governing the alumina reduction process, the presentation of the sets of the applied mathematical equations to predict the main electrolysis bath physicochemical properties related to the cell voltage, the mass balance of the main cell material inputs and outputs, the energy consumption of the electrolysis cell and the estimation of the cell voltage distribution along the various cells consisting of elements. All the mathematical models were included in an easy-to-use software to enable the aluminium cell operators and engineers to introduce and retrieve all the necessary cell operational data and study the effect of the key process parameters on the cell energy performance.
1. Introduction
1.1. Overview
Aluminium exists in abundance in the earth’s crust, but due to its high affinity with oxygen, is found only in the form of alumina (Al2O3). A prerequisite for the electrochemical production of aluminium is that the alumina is melted or dissolved in an appropriate electrolyte. The considerably high melting point of alumina (2030 °C) was a major drawback for the development of an industrially applicable alumina electrolysis process. In 1886, Paul Héroult and Charles Hall independently patented the so-called Hall–Héroult process involving the electrolysis of alumina in alumina–cryolite (Na3AlF6) melts. The operating temperature of the cells was 1010 °C, corresponding to the melting point of cryolite. Up to now, despite many attempts to identify other suitable alumina solvents, cryolite remains the predominant solvent for alumina.
1.2. Electrolysis Cell Principles
The Hall–Héroult process constitutes the dominant process to produce aluminium. The fundamental principles of the process are to (i) dissolve alumina in molten cryolite, and (ii) electrolytically decompose alumina to produce aluminium [1]. The electrolytic process is carried out in the Hall–Héroult electrolysis cells shown in Figure 1, where the metal produced is deposited at the negative electrode (cathode), consisting of a liquid aluminium pool accumulated during electrolysis over the cathode electrode, while the oxygen produced from the decomposition of alumina is released at the carbon anode and carbon dioxide (CO2) is formed by their reaction [2,3].
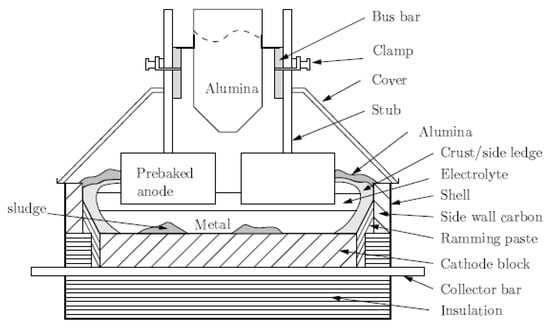
Figure 1.
Components of an aluminium electrolysis cell.
The electrolytic cells constitute rectangular steel shells, in which, an inner carbon lining contains the highly corrosive fluoride electrolyte and molten aluminium and is covered by thermal insulation lining. This last lining offers sufficient heat loss, which is required for forming a ledge of frozen electrolyte on the inner walls except for the bottom of the cell. This ledge preserves inner walls from erosion, while the cell’s bottom remains bare under the anodes in order to ensure sufficient electrical contact with the aluminium. Alumina is fed into the cells by a mechanical point feeding system that is placed in the centre of the cell between the two anode rows. Alumina is maintained in the range of 2–6 wt% by periodical feeding. A crust of frozen electrolyte and alumina covers the top of the cell around the anodes. The cells operate with a current of 70–200 kA and an average cell voltage of 4.1 volts.
The production of aluminium is material and energy-intensive. For the production of one ton of metal, the following inputs to the cell are necessary; 1.90–1.93 tons of smelter grade alumina, 0.4–0.47 tonnes of anode carbon, 15–30 kg of aluminium fluoride, 12.8–16.0 MWh of electrical energy [4].
The main reactions taking place in the cell during the alumina electrolysis are (i) the decomposition of alumina:
and the reaction of the carbon anode with oxygen:
Al2O3(sol) = 2Al(l) + 3/2 O2 (g)
C(s) + 3/2 O2(g) = CO2(g)
The process can be described by the following overall reaction:
Al2O3 (sol) + 3/2 C(s) = 2 Al(l) + 3/2 CO2 (g)
The overall reaction is endothermic and additional energy is needed in order to be performed. This is provided by the heat generated due to the electric resistance of the electrolyte and its heating from the cell current. The anode–cathode distance (ACD) is an essential operational parameter, determining the value of the electrolyte resistance and, therefore, the amount of the generated heat.
Due to the high reactivity of molten aluminium at the cell operating conditions the following aluminium reoxidation reaction takes place, resulting in the production of a lower quantity of aluminium compared to the foreseen theoretical value:
Al(l) + 3 CO2 (g) = Al2O3 (sol) + 3 CO(g)
Current Efficiency (CEcell) of the electrolysis cell is the ratio of the actual aluminium produced divided by the theoretical one. In modern industrial cells, the average current efficiency for metal production generally varies between 90% and 96% [5].
The addition of the two main electrolysis reactions, supposing that the current efficiency loss is only because of the reoxidation of aluminium by carbon dioxide, results in the following electrolysis equation, as modified by Pearson and Waddington [6]:
2 CEcell Al2O3 (s) + 3 C(s) = 4 CEcell Al(l) + 3 (2 CEcell − 1) CO2 (g) + 6 (1 − CEcell) CO(g)
Based on the Faraday law of electrolysis and according to chemical reaction (5), the electrolytic production and consumption of the various reaction components can be calculated in function of the cell current, electrolysis time and current efficiency as follows:
where MB is the molecular weight of the species, na = 3, the number of exchange electrons per mole of aluminium produced, F = 96,485 A s mol−1 the Faraday constant, Icell the cell current in Ampere, and CEcell the current efficiency.
mAl gen = MBAl/(na F) Icell t CEcell = 0.3356 10(−3) Icell t CEcell
mAl2O3cons = MBAl2O3/(na F) Icell t CEcell = 0.6341 10(−3) Icell t CE
mC cons = MBC/(na F) Icell t CEcell = 0.1220 10(−3) Icell t CEcell
mCO2 gen = MBCO2/(na F) Icell t (2 CEcell − 1) = 0.4105 10(−3) Icell t (2 CEcell − 1)
mCO gen = MBCO/(na F) Icell t (1 − CEcell) = 0.5226 10(−3) Icell t (1 − CEcell)
2. Electrolysis Cell Voltage Model
2.1. Components of the Cell Voltage
Cell voltage (Ucell) represents the entire voltage applied to the aluminium electrolysis cell. The total voltage drop is measured from the entrance to the exit of the cell between the busbars connected to the anode and cathode electrodes. The cell voltage is not usually a design parameter for aluminium electrolysis cells but it is one of the most important operating parameters of the electrolysis cell, and, in practice, together with the cell current are the only parameters measured continuously [7].
The cell voltage is critical regarding the heat and energy balance of the cell, because it provides the additional energy required to accomplish the electrolysis reaction and affects the electrolyte temperature. Subsequently, the cell voltage determines the thickness of the protective cell side ledge, while it affects the current efficiency, as it depends on the anode–cathode distance.
The cell voltage also depends on the alumina concentration in the electrolyte. The cell pseudo-resistance (Rp) is strongly dependent on the alumina concentration and is used, in most cases, for cell control rather than cell voltage, because pseudo resistance is not affected by the random fluctuations in the line current that cause variations in the cell voltage [8].
The pseudo resistance, given in micro-ohm, is defined by Equation (11):
where Ucell is the measured cell voltage (V), and Icell is the line current (A).
Rp = (Ucell − 1.65 V)/Icell
The cell voltage is important for the calculation of the specific energy consumption (SEC in kWh/kg Al) of the process through the simple equation [7,8]:
where Ucell is the cell voltage (V), and CEcell is the current efficiency, given as a fraction and not as a percentage.
SECcell = (2.98 Ucell)/CEcell
The high energy consumption and the low energy efficiency of the Hall–Héroult process is mainly caused by the high cell voltage that occurred in the aluminium electrolysis cells (~4.2 V), balanced against the decomposition voltage of alumina (1.183 V). Therefore, for deeper insight and optimisation of the electrolysis cell energy performance, it is important to study and analyse the various components of the cell voltage.
The total cell voltage is composed of three main types of voltage contributions [2]: (i) the theoretical minimum voltage required for alumina decomposition; (ii) the excess voltage due to electrode polarisation, and (iii) the voltage drops due to the resistance of the various cell components.
The cell voltage can be described by the equation:
where Ucell is the cell voltage, Ecell is the reversible (equilibrium) voltage, nac is the concentration overvoltage at the anode, naa is the reaction overvoltage at the anode, nca is the concentration overvoltage at the anode, Ububble is the bubble formation overvoltage, URbath is the ohmic voltage drop in the electrolyte, and Uext is the sum of cathode–anode and other external voltage drops.
Ucell = Ecell + ηac + ηaa + ηcc + Ububble + URbath + Uext
The decomposition voltage for alumina at 950 °C is 1.197 V but due to the electrode polarisation and the electrical resistance of various cell elements, the cell voltage is typically in the range of 4.1–4.5 V. The high cell voltage is one of the main factors contributing to the low energy efficiency of the electrolysis cell, but it cannot be significantly decreased without affecting the cell thermal balance, so as to ensure the provision of the required heat to accomplish the alumina electrolysis reaction.
2.2. Ecell the Reversible (Equilibrium) Voltage
The reversible potential or Nernst potential is defined as the voltage needed for maintaining the cell in equilibrium. For the primary alumina decomposition reaction, the reversible or equilibrium electrolysis potential can be calculated from the standard Gibbs energies and the activities of the reaction products and reactants according to the Nernst equation [9], as follows:
Erevcell = E° − (Rg T)/(n F) lnQ = −ΔG°/(n F) − (Rg T)/(n F) ln[(a(2)Al a(3/2)CO2))/(aAl2O3 a(3/2)C)]
Changing its sign to designate that energy is provided to the electrolysis cell, as it is conventionally used in industrial practice, and taking into consideration that the activities of Al(l) and C(s) are unity as they are pure condensed phases in their standard states and the activity of CO2(g), can also be assumed as unity as the nearly pure gas contacts the anode at approximately 1-atmosphere pressure [10], the Nernst Equation (14) becomes:
Erevcell = E° + (Rg T)/(n F) ln [1/(aAl2O3)] = ΔG°/(n F) − (Rg T)/(n F) ln(aAl2O3)
Based on this equation, the standard potential, E°, of the electrolysis reaction, is calculated from the standard Gibbs energy change of the cell reaction with all reactants and products at electrolyte temperature and at unit activities [11].
where n = 6 is the number of electrons transferred in the electrolysis reaction, and F = 96,485 J/V is the Faraday constant.
E° = ΔG°/(n F)
Assuming a linear increase in the standard Gibbs energy between T = 1000 K and 1400 K, based on the interpolation of thermochemical data retrieved from HSC 10, the Gibbs energy can be calculated from the equation:
and the standard potential of the electrolysis reaction for cells with carbon anodes, as a function of temperature, becomes:
ΔG°(kJ/mol) = 1099.1 − 0.3315 T (16)
E° = ΔG°(R)/(n F) = 1.898 − 5.726 10(−4) T
The Gibbs energy and the standard potential of the electrolysis reaction for temperatures varying between 1000 and 1400 K are presented in Figure 2a,b, respectively.

Figure 2.
(a) Gibbs energy in relation to temperature; (b) standard aluminium electrolysis potential in relation to temperature.
The standard Gibbs energy is positive, indicating that electrical energy must be provided to the cell for the electrolysis to take place. The standard cell potential decreases with temperature.
The reversible cell potential does not depend on the cell operating parameters, but only on the bath temperature and alumina bath concentration. Substituting the values of the physical constants in Equation (15), it can be calculated in accordance with the temperature and alumina activity from the equation:
Erevcell = 1.898 − (5.726 + 0.1436 ln(aAl2O3) 10(−4) T
The activity of alumina in the electrolyte can be calculated based on its concentration in the bath according to Equation (7):
where: ROS = Al2O3/Al2O3sat
aAl2O3 = a ROS + b ROS2 + c ROS3 + d ROS4
ROS is the saturation degree of the bath in alumina, [Al2O3] is the alumina concentration in the electrolysis bath, [Al2O3 sat] is the maximum solubility of alumina in the bath, and α = −0.03791, b = 2.364, c = −2.194 and d = 0.8686.
At 1200 K, the reversible potential for cells with carbon anodes is 1.211 V for electrolytes saturated with alumina. At 50% saturation, the reversible potential is 1.223 V. The decomposition voltage decreases with the increase in the alumina concentration and temperature.
In Figure 3a the value of alumina activity in relation to the bath alumina saturation is presented. The effect of temperature and alumina concentration on the cell reversible potential is shown in Figure 3b.
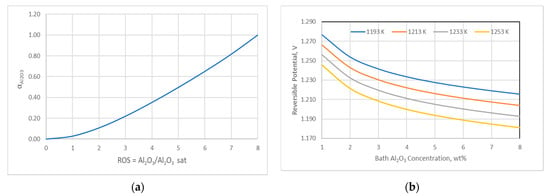
Figure 3.
(a) Alumina activity as a function of bath alumina saturation; (b) Effect of temperature and alumina concentration on the cell reversible potential.
The cell voltage increases with a decrease in the alumina activity, while it decreases with temperature increase. Under normal operating conditions, cell voltage does not deviate significantly from the designed cell voltage for the given cell design, but in cases where alumina concentration is below 2%, the anode effect occurs and the cell voltage can raise up to 80 V.
2.3. Concentration Overvoltage
In an aluminium reduction cell, the electrochemical reaction is performed more rapidly than the mass transport of the reacting species from the bulk solution to the electrode surface. The rate of the alumina electrolysis reaction is then dependent on the ability of the charge carriers to reach the carbon electrode surface. In order to enable the electroactive species to migrate through the concentration gradient and reach the electrode surface, a potential difference widely acknowledged as concentration overvoltage is required to be applied.
2.3.1. Anode Concentration Overvoltage
The anode concentration overvoltage appears between the carbon anodes and the electrolyte and can be calculated on the basis of the Nernst equation, as introduced by Haupin [10]:
where ia refers to the anode current density, and icc refers to the critical current density, namely the maximum current density reached prior to the normal anode reaction superseded by the anode effect. The critical current density is calculated according to the equation:
where
ηac = (Rg T)/(na F) ln[icc/(icc − ia)]
icc = (Ca CAl2O3 + Cb C2Al2O3)/(Ca CAEAl2O3 + Cb (CAEAl2O3)2) ia
Ca = 1.443 − 1.985 Rb + 1.131 Rb^2
Cb = 0.4122 − 0.2037 Rb
Rb = WNaF/WAlF3
The effect of the alumina concentration on the anode concentration overvoltage for various bath weight ratios is shown in Figure 4.
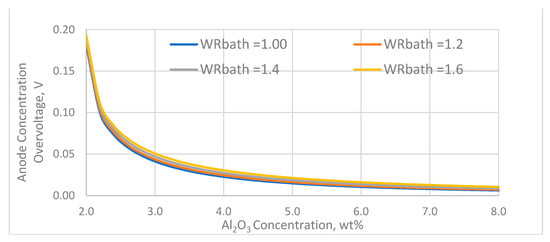
Figure 4.
The effect of Al2O3 concentration and bath ratio on anode concentration overvoltage.
The anode concentration overvoltage is low at alumina concentration above 3 wt% but increases rapidly when the alumina concentration approaches the value at which the anode effect occurs, which in this case is assumed to occur at 1.95 V. The variation of the bath weight ratio has little effect on the anode concentration overvoltage.
2.3.2. Cathode Concentration Overvoltage
A cathode concentration overvoltage is also established in the boundary layer between the electrolyte and the liquid metal cathode. This can be calculated from Equation (2):
where ic is the cathode current density and nα = 2.
ηcc = (Rg T)/(na F) [(1.375 − 0.125 Rb)/1.5] ln[ic/0.283]
The cathode concentration overvoltage is usually low and is almost linearly dependent on the bath weight ratio (Figure 5). Unlike the anode concentration overvoltage, it is independent of the critical alumina concentration.
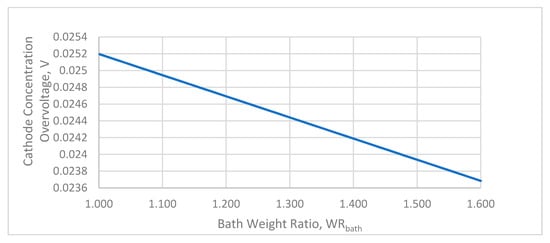
Figure 5.
The effect of the bath ratio on the anode concentration overvoltage.
2.3.3. Anode Reaction Overvoltage
The rate-determining step for the alumina electrolysis reaction refers to the mass transfer of the oxygen-containing anions derived from the bulk electrolyte solution to the carbon anode surface. The necessary potential difference required for the accomplishment of the reaction is generally known as the electrolysis reaction overvoltage. This overpotential is calculated according to Equation (7):
where io is the exchange current density (A/cm2):
ηaa = (Rg T)/(na F) ln[ia/io]
io = 0.0029 C0.56Al2O3
The reaction overvoltage is considered usually high (0.48–0.55 V) and deviations from these values can be observed because of variations in the alumina concentration and temperature. The reaction overvoltage is increasing with lower alumina concentration and higher temperature (Figure 6).
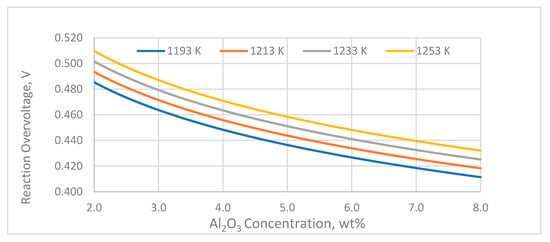
Figure 6.
Effect of temperature and alumina concentration on the reaction overvoltage.
2.4. Ohmic Voltage Drops
The electrical resistance of various cell components expressed as Ohmic Voltage Drops also contribute to the overall cell voltage. From all the cell elements, the only resistance which can change independently at a constant current density is the electrical resistance of the electrolyte. This can be performed either by changing the electrolyte’s composition or by changing the anode–cathode distance. The rest ohmic resistances are related to the cell design. These include the anode, made of three parts, the anode butt, the yoke and the connecting rod, the bubble voltage drop occurring at the surface of the anode, the cathode assembly and the contact resistances associated with the anode and the cathode assembly. The insulating materials are characterised by reduced electrical conductivity, so they have minor contributions.
2.4.1. Electrolyte Voltage Drop
The voltage drop over the electrolyte occurs between the anode and the cathode and derives from the electrical resistivity of the bath. The required energy to maintain the cell at the operating temperature is provided by the resistive heating of the electrolyte. Assuming a uniform current density over the cell horizontal section, the electrical resistance of the electrolyte can be calculated from Ohm’s law of electrical resistance. The ohmic voltage drop of the electrolyte is thus given by the equation:
where the distance ACD is the distance between the anode and the cathode, A is the total surface area of the anodes and κ is the electrical conductivity of the electrolyte.
Ubath = Icell/κbath * ACD/Aanodes
The electrical conductivity of the cryolite electrolyte is an important factor for the cell voltage and therefore for power efficiency, and is given by Equation (8):
where
ln κbath = Acond 1 + Acond 2 + Acond 3
Acond 1 = 1.977 − 0.0131 CxsAlF3 bath) − 0.0060 CaF2 bath − 0.020 CAl2O3 bath
Acond 2 = 0.0121 CLiF bath − 0.0106 CMgF2 bath − 0.0019 CKF bath
Acond 3 = −1204.3/TK
Specific electric resistance is calculated from the electric conductivity with the following equation:
ρbath = 1/κbath
The unit of the electrical conductivity is Siemens per meter (S/m or S/cm). Siemens (reciprocal Ω or eventually mho) is the unit of electrical conductance.
2.4.2. Bubble Voltage Drop
Due to the horizontal orientation of the bottom surface of the anodes, the gases produced during electrolysis accumulate beneath the horizontal anode surface, creating an insulating gas layer between the anode and electrolyte. The accumulated gas layer results in increasing the effective resistivity of the electrolyte, leading to voltage drop also known as bubble voltage drop [12].
The magnitude of the bubble voltage drop depends on the current density and the alumina concentration. Changes in the viscosity and the surface tension of the electrolyte are caused primarily because of variations in the alumina concentration and affect the bubble size and gas volume under the anode. Once the alumina concentration in the bath reaches the critical concentration at which the anode effect occurs, the anodes are fully covered by the reaction gaseous products increases significantly the electrical resistance of the bubble layer.
Hyde and Welch [13] introduced the following expression for determining the bubble voltage drop:
where κbath is the electrical conductivity of the electrolyte, δ is the bubble layer thickness (cm), and φ is the anode surface fractional gas coverage given by Haupin [10] as:
where CAl2O3 AE is the alumina concentration at which the anode effect occurs. Assuming the anode effect occurs when the alumina concentration gets close to 2 wt%, the relationship between the alumina concentration and the bubble voltage drop as a function of the alumina concentration is shown in Figure 7.
Ububble = (δ ia)/κbath * φ/(1 − φ)
δ = (0.5517 + ia)/(1 + 2.167 ia)
φ = φ1 + φ2
φ1 = 0.5090 + 0.1823 ia − 0.1723 ia2 + 0.05504 ia3
φ2 = (0.4322 − 0.3781 Rb)/(1 + 1.637 Rb) + (0.431 − 0.1437 (CAl2O3 − CAl2O3 AE))/(1 + 7.353 (CAl2O3 − CAl2O3 AE))
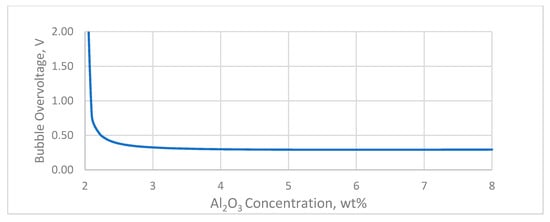
Figure 7.
Bubble overvoltage in relation to the alumina concentration.
As can be seen in Figure 7, the bubble voltage drop goes towards infinity when the alumina concentration gets close to the critical concentration where the anode effect occurs. At about 3% alumina concentration, it reaches a minimum that mainly depends on the magnitude of the anodic current density.
2.5. Cell Element Voltage Drop
The voltage drop of the various cell elements depends on the specific design of each cell and the cell current. However, approximate values of the electrical resistance of the cell elements could be considered according to Grjotheim and Welch (1988) [2], which are (i) over the whole anode array 0.35 V; (ii) over the cathode 0.35 V, and (ii) external bushbar 0.30 V, corresponding to a total voltage drop of up to 1 V. However, in modern cells this could be as high as 0.70 to 0.80 V (Figure 8).
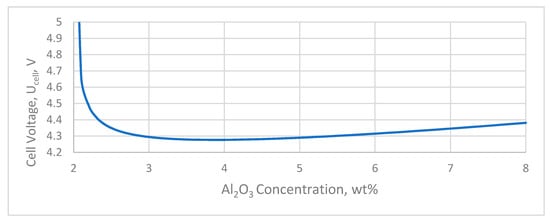
Figure 8.
Overall voltage drop towards Al2O3 concentration on bath.
2.6. Electrolysis Cell Energy Consumption
2.6.1. Theoretical Energy Consumption
The minimum energy and the minimum potential required for the accomplishment of the primary electrolysis reaction is calculated from the Gibbs free energy according to the equation:
E°cell = ΔG°ref/n F = Wel min/(n F)
The minimum energy and the potential at 1250 K and at standard conditions calculated from this equation are 3.52 kWh/kg Al and 1.183 V, respectively.
However, in the literature, the theoretical energy requirement for the aluminium electrolysis process is calculated based on the change of enthalpy and not on the change of Gibbs free energy [3]. The reason for this is that Gibbs free energy is the minimum energy required to carry out a chemical reaction and does not account for the heat required to maintain the cell under isothermal conditions. Thus, if the electrolysis was carried out at potential based on the free energy calculation, insufficient heat would be provided to the cell and the cell would cool unless external heat was supplied.
Analogous to the calculation of the electrolysis potential based on the change in free energy, the isothermal potential [14] can be calculated based on the enthalpy change of the electrolysis reaction:
E°cell iso = ΔH°ref/(n F)
In this case, the isothermal potential at 1250 K and at standard conditions for the primary electrolysis reaction is:
ETcell iso = −ΔH°ref(R)/12 F = 1.896 V
This value is 0.713 V higher than the minimum reaction potential. Ignoring other heat losses and energy requirements the theoretical energy for aluminium production is:
Wel iso = ΔH°Ref(R) = 549.12 kJ/(mol Al) = 5.65 kWh/(kg Al)
2.6.2. Energy Consumption of an Electrolysis Cell
The energy consumption in industrial prebake electrolysis cells ranges from 13 to 14 kWh/kg Al. This is about twice the theoretical energy as calculated by Equation (32) to maintain the cell under isothermal cell operation conditions.
The additional energy required to perform the electrolysis is due to the energy consumed by the various cell resistance components, which is equal to the heat generated in the cell. In this respect, the required electric power (Pcell) input to the electrolysis is calculated as:
Pcell = I2cell Rcell = Ucell Icell = (Ecell + ηac + ηaa + ηca + Ububble + URbath + Uext) Icell
Using the Faraday law of electrolysis, the rate of electrolytic aluminium production in the cell is:
m˙Al = MWAl Icell/(n F)
The Specific Energy Consumption to produce 1 kg of aluminium per hour is:
SECAl = Pcell/(m˙Al CE) = (Ucell Icell n F)/(MWAl Icell CE) = (n F Ucell)/(MWAl CE) = Ucell/(0.3356 CE)
Substituting the cell voltage with the cell voltage components, the specific energy consumption in kWh per kg aluminium can be calculated from the equation:
SECAl (kWh/kg Al) = 298 (Ecell + ηcc + ηaa + ηac + Ub + Ue)/(CE)
3. Electrolysis Cell Energy Balance Software
The global cell balance model was implemented in a computational algorithm, using the electrolyte physical property and the voltage distribution equations presented in Section 2.3 and Section 2.4 of this paper. The sets of model equations were integrated using Visual Basic computational code; the software application was named Hall–Heroult Electrolysis Cell Energy Balance. The model input parameters are given in Table 1.

Table 1.
Input parameters for the Hall–Heroult Electrolysis Cell Energy Balance model.
The output of the model includes the calculated cell voltage distribution and the distribution of the cell power consumption including the overall cell aluminium production and energy consumption (Table 2).

Table 2.
Outputs of the Hall–Heroult Electrolysis Cell Energy Balance model.
4. Conclusions
The World’s Aluminium smelters today use about 3.5% of the total global electric power consumption. In the current Hall–Heroult aluminium production process, there is a significant opportunity to further reduce energy requirements and environmental impact. The recent interest in environmental change clearly implies that energy and environmental policies should be more closely interrelated. A user-friendly interface was developed for the visual introduction of the model input parameters and presentation of the results. All the mathematical models were included in an easy-to-use software to enable the aluminium cell operators and engineers to introduce and retrieve all the necessary cell operational data and study the effect of the key process parameters on the cell energy performance.
Author Contributions
Conceptualization V.V.; methodology, V.V., A.P., M.T.; software, V.V.; validation, writing—review and editing, V.V., A.P. All authors have read and agreed to the published version of the manuscript.
Funding
This research received no external funding.
Institutional Review Board Statement
Not applicable.
Informed Consent Statement
Not applicable.
Data Availability Statement
Not applicable.
Conflicts of Interest
The authors declare no conflict of interest.
Abbreviation
| ACD | Anode–cathode distance (cm) |
| CEcel | Current Efficiency |
| MB | the molecular weight of the Chemical species |
| nα | 3 the number of exchange electrons per mole of aluminium produced, |
| F | Faraday constant (96,485 A s mol−1) |
| Icell | Cell current |
| mAl gen | mass of aluminium produced (kg/h) |
| mCO2 gen | mass of carbon dioxide produced (kg/h) |
| mAl2O3 cons | mass of alumina consumed (kg/h) |
| mC cons | mass of carbon consumed (kg/h) |
| Ucell | Cell voltage (V) |
| Rp | Cell pseudoresistance (μOhm) |
| SEC | Specific energy consumption (kWh/kg Al) |
| Ecell | Reversible (equilibrium) voltage (V) |
| ncc | Concentration overvoltage at the cathode (V) |
| naa | Reaction overvoltage at the anode (V) |
| nac | Concentration overvoltage at the anode (V) |
| Ub | Ohmic voltage drop in the electrolyte (V) |
| Ue | Sum of cathode–anode, and other external voltage drops (V) |
| ROS | Saturation degree of the bath in alumina |
| [Al2O3] | Alumina concentration in the electrolysis bath (%) |
| [Al2O3 sat] | Maximum solubility of alumina in the bath (%) |
| κ | Electrical conductivity of the electrolyte (S/cm) |
| CAl2O3 AE | Alumina concentration at which the anode effect occurs |
References
- Drengstig, T.; Ljungquist, D.; Foss, B.A. On the AlF/sub 3/ and temperature control of an aluminum electrolysis cell. IEEE Trans. Control Syst. Technol. 1998, 6, 157–171. [Google Scholar] [CrossRef]
- Grjotheim, K.; Welch, B.J. Aluminium Smelter Technology, 2nd ed.; Aluminium-Verlag: Düsseldorf, Germany, 1988. [Google Scholar]
- Grjotheim, K.; Kvande, H. Introduction to Aluminum Electrolysis, Understanding the Hall-Héroult Process, 2nd ed.; Aluminium-Verlag: Düsseldorf, Germany, 1993. [Google Scholar]
- Statistics. International Aluminium Institute, London, United Kingdom. Available online: https://www.world-aluminium.org/statistics (accessed on 16 March 2021).
- Totten, G.E.; MacKenzie, D.S. (Eds.) Handbook of Aluminum: Volume 2: Alloy Production and Materials Manufacturing; CRC Press: Boca Raton, FL, USA, 2003. [Google Scholar]
- Pearson, T.G.; Waddington, J. Electrode Reaction in the Aluminium Reduction Cell. Discuss. Faraday Soc. 1947, 1, 307–320. [Google Scholar] [CrossRef]
- Kvande, H.; Haupin, W. Cell voltage in aluminum electrolysis: A practical approach. JOM 2000, 52, 31–37. [Google Scholar] [CrossRef]
- Vassiliadou, V.; Paspaliaris, I.; Stefanidis, D.; Georgantonis, D. Energy Savings in Aluminium Electrolysis by Continual Monitoring and Control of the AlF3 Content of the Cryolitic Melt. In Energy Efficiency in Process Technology; Pilavachi, P.A., Ed.; Springer: Dordrecht, The Netherlands, 1993; Volume 52. [Google Scholar]
- Haupin, W.E. Principles of Aluminum Electrolysis. In Essential Readings in Light Metals; Bearne, G., Dupuis, M., Tarcy, G., Eds.; Springer: Cham, Switzerland, 2013. [Google Scholar] [CrossRef]
- Haupin, W.E. Interpreting the Components of Cell Voltage. In Light Metals; The Minerals, Metals & Materials Society: Warrendale, PA, USA, 1998; pp. 531–537. [Google Scholar]
- Bearne, G.; Dupuis, M.; Tarcy, G. Essential Readings in Light Metals: Volume 2, 1st ed.; Springer: Cham, Switzerland, 2016; ISBN 10-331948575X. Available online: http://books.scholarsportal.info/viewdoc.html?id=/ebooks/ebooks3/springer/2017-08-17/3/9783319481562 (accessed on 10 April 2021).
- Hives, J.; Thonstad, J.; Sterten, Å.; Fellner, P. Electrical Conductivity of Molten Cryolite-based Mixtures Obtained with a Tube-type Cell made of Pyrolitic Boron Nitride. In Light Metals; The Minerals, Metals & Materials Society: Warrendale, PA, USA, 1994; pp. 187–194. [Google Scholar]
- Hyde, T.M.; Welch, B.J. The Gas under Anodes in Aluminium Smelting Cells Part I: Measuring and Modelling Bubble Resistance under Horizontally Oriented Electrodes. In Light Metals; The Minerals, Metals & Materials Society: Warrendale, PA, USA, 1997; pp. 333–340. [Google Scholar]
- Drengstig, T. On Process Model Representation and AlF3 Dynamics of Aluminum Electrolysis Cells. Ph.D. Thesis, Norwegian University of Science and Technology, Trondheim, Norway, 1997. [Google Scholar]
Publisher’s Note: MDPI stays neutral with regard to jurisdictional claims in published maps and institutional affiliations. |
© 2022 by the authors. Licensee MDPI, Basel, Switzerland. This article is an open access article distributed under the terms and conditions of the Creative Commons Attribution (CC BY) license (https://creativecommons.org/licenses/by/4.0/).