Abstract
Endothelialization is required to maintain patency in tissue-engineered vascular grafts (TEVGs). Ligand surface functionalization is intended to induce the adhesion and spreading of Endothelial Cells (ECs). ECs surface adhesion occurs through the integrin-ligand interaction. Here, we propose a chemo-mechanical model, using COMSOL Multiphysics 5.5, to study the optimal ligand distribution in order to improve interaction under laminar blood flow. The proposed model elucidates the role of binding forces and flow velocities over cell spreading as a function of the relevant ligand concentration. This model can contribute to optimizing the surface functionalization of TEVGs for promoting successful endothelialization.
Published: 15 November 2020
1. Introduction
The main cause of death in the world is attributed to cardiovascular diseases (CVDs). Although its etiology is not fully identified, it is known that a degenerative process in the vascular wall changes the vessel elasticity, which, in turn, may promote thrombogenesis. Patients struggling with CDVs usually require surgical interventions, in which the diseased blood vessel is replaced with a vascular graft (VG). Commercially available VGs are often non-degradable, synthetic conduits made of polytetrafluoroethylene (PTFE) and Polyethylene terephthalate (PET) [1]. However, their patency rates are low in small-diameter applications or in non-laminar flows, thereby representing one of the main causes of failure. Tissue engineering and regenerative medicine arise as suitable strategies to overcome these limitations. In this approach, tissue-engineered vascular grafts (TEVGs) are manufactured from highly biocompatible materials, with the main goal of promoting the remodeling of the vascular wall upon implantation [2].
In vascular wall remodeling, endothelialization occurs when a lining of endothelial cells is formed over the TEVGs surface. This is one of the most important steps in recovering the function of the replaced artery due to the different roles of endothelial cells in maintaining homeostasis. For endothelialization, improving the attachment of endothelial progenitor cells (EPCs) from the bloodstream is an important event to assure long-term patency [3]. EPCs attachment and spreading depend on the interactions of both low affinity (LI) and high affinity (HI) integrins present in the cell membrane, with the underlying matrix. Once the HI integrins interact with a ligand, the lipid rafts on the membrane reorganize and LI becomes activated. As a result, large clusters of focal adhesion complexes are formed, which are responsible for an increase in the attached cell surface area [4,5].
Under native conditions, the extracellular matrix (ECM) of the vascular wall is rich in proteins with integrin-binding domains. However, most of the TEVGs lack the required ligands for integrin interaction. To address this issue, some authors have proposed their chemical surface modification with several molecules, including growth factors and adhesive peptides, such a RGD and CAG motifs, with the ability to interact with integrins [6]. There are several strategies to recognize the optimal peptide concentration to achieve sufficient integrin activation, including empirical methods such as cell seeding trough the analysis of cell adhesion and distribution. However, in this sense, mathematical modeling represents an advantage. This understanding is crucial to identifying the regimes under which cells can resist shear stress under laminar and turbulent flows, typically found in TEVGs with complex hemodynamic conditions. Here, we propose a multiphysics chemo-mechanical model to elucidate the role of binding forces and flow dynamics over cell attachment and spreading as a function of relevant ligand concentration. This model can contribute to optimizing surface functionalization of TEVGs for promoting successful endothelialization.
2. Materials and Methods
2.1. Mathematical Models
Binding forces and flow dynamics involved in endothelial cell adhesion were modelled with a multiphysics chemo-mechanical approach. We took into account the effect of the traction forces generated by the integrin-ligand complex on the surface of TEVGs and the fluid loading on the structure of a vascular endothelial cell. Here, we assumed an initial undeformed cell with a nearly spherical geometry before spreading.
2.1.1. Integrins Balance
Most integrins are initially found in a low affinity state in a bent configuration (concentration ) and are unable to interact with ligands on the intima surface of TEVG (substrate). Once they come in contact with the substrate, the integrins become activated in a high affinity state that exhibits a stretch configuration (concentration ) able to interact with ligands [7]. This binding phenomenon can be described by the existence of unbounded () and bounded high affinity integrins (), as a function of the fraction of available ligands ( between 0 and 1) with respect to as follows:
The assembly of high affinity integrins takes place in time due to cell membrane diffusion of low affinity integrins, given by the flux (Equation (3)) described by the Fick’s law. To evaluate the change of state, a mass balance considering both groups of integrins can be established by considering both diffusive and convective terms (Equation (4)). The cell cytoskeleton remodeling velocity due to kinesins gives the corresponding convection term with a field velocity [8].
At a maximum cell deformation (spreading), it is possible to assume that endothelialization has occurred and the amount of high affinity integrins is equal to the number of available integrins (), which are initially in their low affinity state ().
2.1.2. Cell Adhesion Mechanics
Endothelial cell adhesion occurs by traction forces created by bound high affinity integrins on the substrate. In two dimensions, these forces (per unit area) are defined by the substrate stiffness , the bound integrin concentration , the relative displacement , and the contact angle of the initial undeformed cell on the substrate (), as follows:
For the equations above, the contact angle is the spatial orientation of the contracting cytoskeleton fibers attached to the bound integrins during adhesion (cell spreading) [9]. This is shown in Figure 1a, along with the corresponding change in cell shape after deformation due to spreading (Figure 1b). As for the corresponding displacement is given by the length of the integrin-ligand complex x-component upon binding with respect to the angle [10].
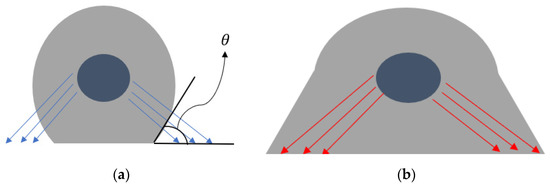
Figure 1.
Spreading of an endothelial cell due to integrin-ligand complexes: (a) initial undeformed state; (b) deformed state during spreading. The traction force vectors are shown along with the contact angle.
2.1.3. Laminar Blood Flow
Mass conservation (Equation (7)) and conservation of linear momentum (Equation (8)) were considered to model the laminar blood flow. In cylindrical coordinates, Equations (7) and (8) become those shown in (9).
where is the flow velocity, is the fluid density, is the pressure, is the dynamic viscosity of blood, and refers to external gravitational and volume forces affecting the fluid (assumed negligible).
2.1.4. Cell Structure Mechanical Behavior
Mechanical response of the cell structure to loadings is described by Equation (10), where is the constant density of the cell, is the displacement field, and T is the stress tensor.
2.1.5. Fluid-Structure Interaction on Cell Structure
The fluid loading on the cell domain was modelled according to a fluid-structure interaction (FSI) phenomenon described by Equation (11) [11].
2.2. Computational Approach
COMSOL Multiphysics 5.5® (COMSOL Inc., Stockholm, Sweden) was used to solve the equations above via the Finite Element Method. Table 1 summarizes the parameters used for the multiphysics model. The data shown as n/a refer to either empirical values from in vitro experiments or conditions given by the model.

Table 1.
List of parameters of the computational model.
2.2.1. Computational Domain
A two-dimensional geometry was considered to model the cell-matrix interaction between a single endothelial cell and the TEVG intima layer (Figure 2a). The diameter of a TEVG was scaled to 1:40 () regarding real dimensions () to represent close-up cell deformations. To model the expected physiological blood pressure in a 100 vessel, the average normal velocity was set to 30 cm/s, as it is normally found in small arteries [12].
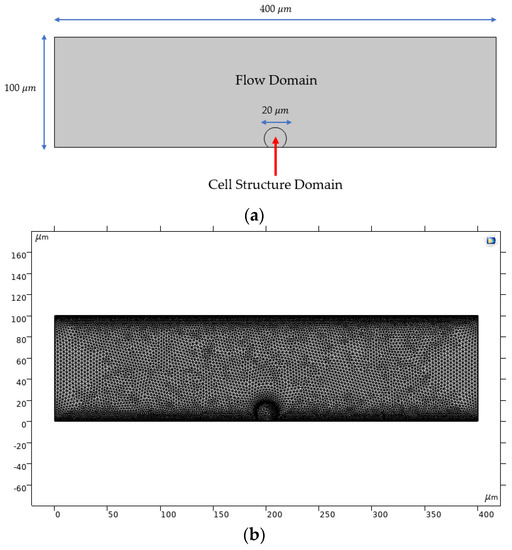
Figure 2.
Computational domain used for running multiphysics simulations: (a) dimensions of the two-dimensional computational domain; (b) optimized meshed geometry.
The assigned mesh for finite element simulations is a finer physics-controlled mesh with 19,288 domain elements and 738 boundary elements. A mesh convergence analysis confirmed that this meshing level led to variations below 2% for the fluid velocity in selected locations along the computational domain (data not shown).
2.2.2. Transport of Diluted Species
The Transport of Diluted Species module was used to model the changes in concentration for the LI and HI in the radial direction of the undeformed cell. Considered variables are the concentrations of both species (LI and HI) in different time steps evaluated along the central axis of the cell domain (point of symmetry). The boundary conditions were set as an inflow of in the cell contour, with a field velocity . An initial condition of zero concentration inside the whole domain of the cell was assumed. The computational model can be reduced to one species, considering that the change of concentration inside the cell domain predicts the increase in in time of the corresponding change in , which can be calculated by the difference between and in each time step for a selected location within the domain.
Besides, concentration values were converted to units of mol/m3 due to restrictions on input values (International System of Units) imposed by the software. In order to achieve that, the surface concentrations shown in Table 1 were divided by , assuming that 1 integrin corresponds to 1 mol.
2.2.3. Laminar Flow
Laminar Flow interface was used to model the blood flow. Blood was assumed as an incompressible non-Newtonian fluid, following the Carreau model described by Equation (12). The parameters of the model can be found in Table 1.
The initial conditions for components of velocity were set to 0 m/s for the x and y coordinates. The inlet boundary condition was defined by Equation (13) [11] as a normal inflow velocity for a transient study (t = time step in s). From this equation, a = 0.04 s2 and b = 0.1 s.
The outlet boundary condition was established according to a pressure drop based on the Hagen–Poiseuille Equation (Equation (14)). A physiological mean inlet pressure for an arteriole of 80 mmHg [15] was implemented to determine the pressure drop along the geometry. The non-slip condition was assigned for the walls.
2.2.4. Solid Mechanics
The solid mechanics domain is the cell geometry, including the edge where the cell was fixed to the flow domain. The assigned boundary conditions were a boundary load, corresponding to the traction forces and in the lower lateral edges of the cell (adhesion edges), and a fixed constraint in the attached edge of the non-deformed cell domain.
Mechanical properties of the cell were established with a hyperelastic neo-Hookean model and a plain strain approximation. The Lamé parameters were calculated with Equations (15) and (16), considering a Poisson’s ratio () of 0.45 (related to a standard neo-Hookean model) and an average Young´s modulus () of 80 kPa from the reported literature values for the structure of human cells (see Table 1 for reference).
2.2.5. Fluid-Structure Interaction
The Laminar Flow interface was coupled with the Solid Mechanics interface to evaluate the stresses and deformations developed by the cell geometry under blood flow as well as adhesion forces exerted by contracting fibers in the cytoskeleton related to the integrin-ligand complexes. The fixed geometry coupling type is the fluid loading on structure.
A moving mesh condition was included to account for transient deformations in the computational domain. The deforming domain was assigned to the flow domain with a default mesh smoothing type of Yeoh, with a stiffening factor equal to 10, and with no initial deformations. The prescribed normal mesh displacement was established at 0 m for all the external boundaries of the moving mesh domain, excluding the fixed constraint edge of the cell geometry.
2.2.6. Simulations
The maximum values for and were considered for the simulations (related to the full cell spreading with all integrins in their high affinity state). The analysis of integrin transport and FSI was carried out separately. Therefore, the FSI model was focused on the flow shear stresses, which can affect proper cell adhesion.
For the transport of integrins, a single-step time dependent-study was run between 0 s and 10 s with a step size of 0.1 s. Similarly, a time dependent-study with two steps was established for evaluating FSI. The first step is the flow parameters computation and the second one is the Solid Mechanics interface and FSI multiphysics. The time range was set from 0 to 20 with a step size of 0.1 . Finally, a parametric sweep was evaluated for different fractions of within the FSI study. The time selection was established based on convergence criteria after various simulation experiments.
3. Results
3.1. Integrin Activation
The diffusion of low affinity integrins through the cell membrane is shown in Figure 3, where, upon contact with the surface, the assembly of high affinity integrins occurs within 10 s, reaching up to 2.5 × 10²¹ mol/m3 (5 × 10¹⁵ in units of #/m2) concentration. The symmetrical radial diffusion in Figure 4 shows that, at the found concentration for high affinity integrins, a saturation level is reached. This indicates a maximum number of integrins available for ligand interaction.
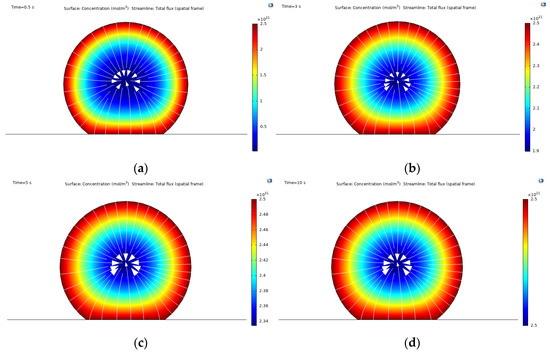
Figure 3.
Concentration field of high affinity integrins obtained from the mass transport simulations: (a) concentration at time t = 0.5 s; (b) concentration at time t = 3 s; (c) concentration at time t = 5 s; (d) concentration at time t = 10 s.
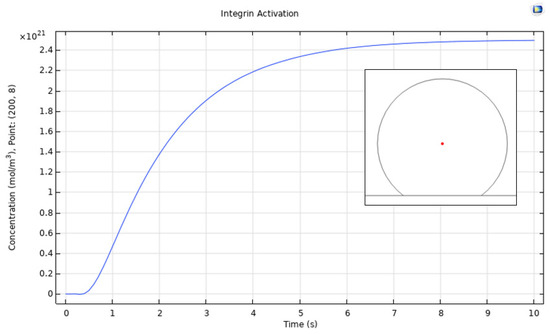
Figure 4.
Point evaluation for the integrin activation (change of state) process. The change of concentration was evaluated in the red point shown in the plot, thereby indicating symmetry for radial diffusion.
3.2. Cell Spreading and Attachment
Figure 5 shows a general overview of the FSI model simulations, involving the fluid loading on the cell structure by the blood flow and the binding forces given by the integrin-ligand interactions. As shown in Figure 5a, the pressure field remains constant within the fluid domain at 1.07 × 10⁴ Pa, which is given by the outlet pressure of physiological conditions.
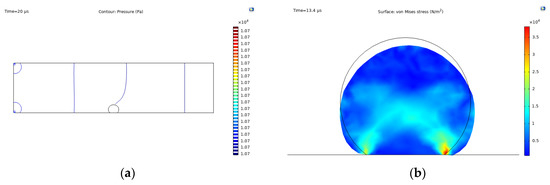
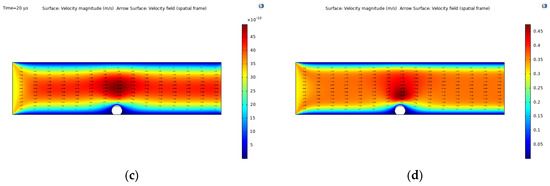
Figure 5.
Fluid-structure interaction simulation results: (a) pressure contour; (b) Max. von Mises stress, t = 13.4 s and fraction of ligands = 0.8; (c) time-dependent velocity field given by Equation (17); (d) constant velocity field given by .
Due to forces acting on the cell structure, spreading and attachment occurs, as shown in Figure 5b, where the cell deforms from an initial state (black line) to the state described by the filled contour. In this context, the cell presents two points of high stress distributions in the corners of the fixed constraint, reaching maximum values of over 3.5 × 10⁴ N/m2 at the right corner. The contracting fibers orientation is represented by the clear blue regions, forming an x-like pattern.
The velocity fields given by the laminar flow model under two different conditions are shown in Figure 5c,d. The first is the time-dependent velocity considered for the FSI coupling studied here, while the second shows a constant (stationary) average normal inflow velocity given by . The flow profile for both cases is nearly the same with an increase in the velocity when interacting with the cell domain due to a decrease in the vessel diameter. For the time-dependent case, the velocity magnitude reaches up to 48 × 10−10 m/s for a time scale in , while the stationary case reaches up to 0.48 m/s.
Figure 6 shows the von Mises stress values for the cell domain for different ligand fraction densities with respect to the concentration of HI (fixed to for the simulations). The results indicate that the stress distribution increases proportionally with . Similarly, a comparison with the initial undeformed state reveals that cell deformation and spreading increases for higher ligand fractions. The relationship of ligand fractions and the maximum stress values are shown in Figure 7 for a fixed time of t = 10 s and .
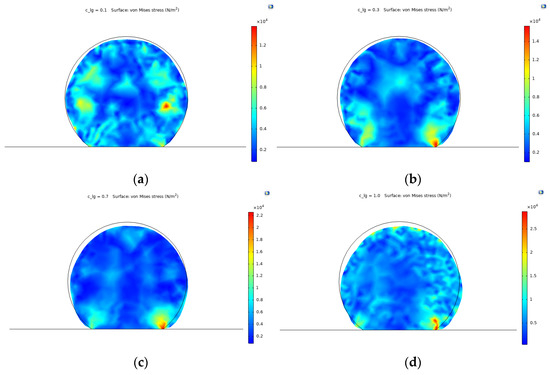
Figure 6.
Von Mises stress values for different ligand fractions () at time t = 10 . (a) = 0.1; (b) = 0.3; (c) = 0.7; (d) = 1.0.
Figure 7.
Parametric sweep of max. von Mises stress for different ligand fractions.
4. Discussion
According to our results, upon activation, the maximum high affinity integrins on endothelial cells reach 5 × 10¹⁵ in units/m2. To remain attached to the surface, the adherence force should exceed the one generated by the flow at a physiological pressure, i.e., about 3.5 × 10⁴ N/m2. Otherwise, the cell will detach, and endothelialization process will not occur. This phenomenon should be considered carefully, as the cells attached to the surface might create a change in the vessel diameter that alters the blood flow and velocity profile. Here, we consider a blood flow velocity that reaches up to 48 × 10−10 m/s for a time scale in µs. Our simulations predicted that 70% of the total number of integrins should be available for interaction if the attached cells are to resist the forces exerted by the blood flow and the possible changes in the velocity profile. This ligand concentration also correlates with an increase in the cytoskeleton deformation related to the cell spreading required for endothelialization, as previously reported by Vernerey et al. (2014) [7]. This can be explained in light of Equation (2), which describes the chemical equilibrium between bound integrins and ligand receptors. This equation states that, under normal circumstances, bound integrins will never reach an absolute value of 100% regarding HI. This mathematical relationship describes the endothelialization process, which reflects a continuous activation-deactivation process of integrins given by actin polymerization in the cytoskeleton. Therefore, saturation is not expected, and adhesion and detachment might occur simultaneously. The parametric sweep of max. von Mises stress for different ligand fractions shows that, when the ligand density is equal to the number of HI, the stress values (and corresponding cell deformation) increase constantly. As endothelial cells are adherent, and their functional phenotype is acquired once complete attachment is reached, an increased cell deformation is required to promote endothelial cell functionality.
In order to achieve higher deformations and a faster attachment, one might expect to increase indefinitely. However, for optimizing surface functionalization in TEVGs, a standard calibrated value for is crucial for further reproducibility and high performance under physiological conditions. With that in mind, von Mises stress values for different ligand fractions contribute to predict either cell adhesion or detachment when cells are under blood flow with a determined number of available ligands on the TEVG surface.
For a value of 0.1, the stress distributions reflect a potential detachment under blood flow, given that there is no stress concentrations toward the lower edges of the cell, moving rather to higher values toward the right section of the cell domain (Figure 6a). When increases to 0.3, the points of higher stress distribution develop toward the lower edges of the cell. This reflects a higher attachment probability but with low spreading due to small deformations and relevant stress distributions around the upper region of the cell domain (Figure 6b).
For values of 0.7 and 1.0 (i.e., 70% of availability), the range of stress distribution increases significantly, reaching values higher than 2 × 10⁴ Pa, which are related to higher deformations in the geometry and increased spreading/attachment. For a of 0.7, the surface distributions are relatively homogenous with the maximum stress values focused toward the points of attachment given by the binding forces of integrins (Figure 6c). Finally, for a of 1.0, the deformation is significant, and the spreading takes place uniformly over the surface of the cell, represented by the clear blue regions (Figure 6d). However, the blood is a complex extracellular matrix with a variety of components including proteins and other cells. Ligand interaction might therefore occur not only with endothelial cells but also with other elements such as platelets, leukocytes, and red blood cells with integrins in their membrane surface. Although most of the adhesive molecules currently used for TEVGs surface functionalization are specific for endothelial cells adhesion, it is important to recognize protein adsorption over the TEVG surface and unspecific interactions with other receptors present in different cells. In this way, future work should include a minimum occupancy range of ligands by other elements including other cell types and protein adsorption from the bloodstream.
5. Conclusions
Computational simulations were used to evaluate two different stages involved in the cell adhesion of endothelial cells within an adhesive functionalized TEVG. On the one hand, the integrin activation to its high affinity stage was represented through a mass transport model, which was dependent on both the mobility of low affinity integrins and the cytoskeleton remodeling velocity/motion governed by kinesins. On the other hand, simulations predicted an attachment/detachment and spreading phenomena of cells under physiological blood flow. The results indicated a directly proportional relationship between high affinity integrin availability and ligand concentration, underlying the attachment traction forces. This can be further explored for optimizing the surface functionalization of TEVGs by controlling the fraction of ligand receptors on the corresponding substrate. Due to current convergence restrictions imposed by the software, no direct relationship between the mass transport model and FSI model was established. However, future studies aim to refine model parameters, geometry, and solver conditions for a more precise mechanistic description of the expected cell adhesion in real time.
Author Contributions
Conceptualization, M.A.R.-S., J.C.C., and J.C.B.; methodology, J.S.B. and A.R.; software, J.S.B. and A.R.; validation, J.C.C. and J.C.B.; formal analysis, J.S.B., M.A.R.-S., A.R., and J.C.C.; investigation, J.S.B., M.A.R.-S., and A.R.; data curation, J.S.B., M.A.R.-S., N.S. (Natalia Suarez), and A.R.; writing—original draft preparation, J.S.B., M.A.R.-S., A.R., N.S. (Natalia Suarez), and N.S. (Nestor Sandoval); writing—review and editing, C.M.-C., J.C.C., and J.C.B.; visualization, J.S.B., M.A.R.-S., and A.R.; supervision, C.M.-C., J.C.C., and J.C.B.; project administration, C.M.-C., J.C.C., N.S. (Nestor Sandoval), and J.C.B. All authors have read and agreed to the published version of the manuscript.
Funding
This research received no external funding.
Conflicts of Interest
The authors declare no conflict of interest.
References
- Pashneh-Tala, S.; MacNeil, S.; Claeyssens, F. The Tissue-Engineered Vascular Graft—Past, Present, and Future. Tissue Eng. Part B Rev. 2016, 22, 68–100. [Google Scholar] [CrossRef] [PubMed]
- Liu, T.; Liu, S.; Zhang, K.; Chen, J.; Huang, N. Endothelialization of implanted cardiovascular biomaterial surfaces: The development from in vitro to in vivo: Endothelialization of Implanted Cardiovascular Biomaterial Surfaces. J. Biomed. Mater. Res. 2014, 102, 3754–3772. [Google Scholar] [CrossRef] [PubMed]
- Sánchez, P.F.; Brey, E.M.; Briceño, J.C. Endothelialization mechanisms in vascular grafts. J. Tissue Eng. Regen. Med. 2018, 12, 2164–2178. [Google Scholar] [CrossRef] [PubMed]
- Mezu-Ndubuisi, O.J.; Maheshwari, A. The role of integrins in inflammation and angiogenesis. Pediatr. Res. 2020. [Google Scholar] [CrossRef] [PubMed]
- Sun, X.; Fu, Y.; Gu, M.; Zhang, L.; Li, D.; Li, H.; Chien, S.; Shyy, J.Y.-J.; Zhu, Y. Activation of integrin α5 mediated by flow requires its translocation to membrane lipid rafts in vascular endothelial cells. Proc. Natl. Acad. Sci. USA 2016, 113, 769–774. [Google Scholar] [CrossRef] [PubMed]
- Ren, X.; Feng, Y.; Guo, J.; Wang, H.; Li, Q.; Yang, J.; Hao, X.; Lv, J.; Ma, N.; Li, W. Surface modification and endothelialization of biomaterials as potential scaffolds for vascular tissue engineering applications. Chem. Soc. Rev. 2015, 44, 5680–5742. [Google Scholar] [CrossRef] [PubMed]
- Vernerey, F.J.; Farsad, M. A mathematical model of the coupled mechanisms of cell adhesion, contraction and spreading. J. Math. Biol. 2014, 68, 989–1022. [Google Scholar] [CrossRef] [PubMed][Green Version]
- Howard, J. Mass, Stiffness, and Damping of Proteins. In Mechanics of Motor Proteins and the Cytoskeleton; Sinauer Associates Inc.: Sunderland, MA, USA, 2001; Chapter 3; p. 30. [Google Scholar]
- Jean, R.P.; Chen, C.S.; Spector, A.A. Finite-element analysis of the adhesion-cytoskeleton-nucleus mechanotransduction pathway during endothelial cell rounding: Axisymmetric model. J. Biomech. Eng. 2005, 127, 594–600. [Google Scholar] [CrossRef]
- Dai, A.; Ye, F.; Taylor, D.W.; Hu, G.; Ginsberg, M.H.; Taylor, K.A. The Structure of a Full-length Membrane-embedded Integrin Bound to a Physiological Ligand. J. Biol. Chem. 2015, 290, 27168–27175. [Google Scholar] [CrossRef] [PubMed]
- Megali, G.; Pellicanò, D.; Cacciola, M.; Calarco, F.; De Carlo, D.; Laganà, F.; Morabito, F.C. Modeling Interface Response in Cellular Adhesion. In Proceedings of the COMSOL Conference 2009, Milan, Italy, 14–16 October 2009. [Google Scholar]
- Campbell, N.A.; Reece, J.B. Circulation and Gas Exchange. In Biology, 8th ed.; Wilbur, B., Ed.; Pearson Benjamin Cummings: San Francisco, CA, USA, 2008; p. 906. [Google Scholar]
- Vitello, D.J.; Ripper, R.M.; Fettiplace, M.R.; Weinberg, G.L.; Vitello, J.M. Blood Density Is Nearly Equal to Water Density: A Validation Study of the Gravimetric Method of Measuring Intraoperative Blood Loss. J. Vet. Med. 2015, 1–4. [Google Scholar] [CrossRef] [PubMed]
- Shibeshi, S.S.; Collins, W.E. The rheology of blood flow in a branced arterial system. Appl. Rheol. 2005, 15, 398–405. [Google Scholar] [CrossRef] [PubMed]
- Dinnar, U. Cardiovascular Fluid Dynamics; CRC Press: Boca Raton, FL, USA, 1981; ISBN 978-0-8493-5573-8. [Google Scholar]
- Ding, Y.; Xu, G.-K.; Wang, G.-F. On the determination of elastic moduli of cells by AFM based indentation. Sci. Rep. 2017, 7, 45575. [Google Scholar] [CrossRef]
- Sato, M.; Levesque, M.J.; Nerem, R.M. An Application of the Micropipette Technique to the Measurement of the Mechanical Properties of Cultured Bovine Aortic Endothelial Cells. J. Biomech. Eng. 1987, 109, 27–34. [Google Scholar] [CrossRef] [PubMed]
- Félétou, M. Introduction, Part 1: Multiple Functions of the Endothelial Cells—Focus on Endothelium-Derived Vasoactive Mediators. In The Endothelium; Morgan & Claypool Life Sciences: San Rafael, CA, USA, 2011; Chapter 1. [Google Scholar]
Publisher’s Note: MDPI stays neutral with regard to jurisdictional claims in published maps and institutional affiliations. |
© 2020 by the authors. Licensee MDPI, Basel, Switzerland. This article is an open access article distributed under the terms and conditions of the Creative Commons Attribution (CC BY) license (https://creativecommons.org/licenses/by/4.0/).