Proceeding Paper

Bubble Behavior on Horizontal and Vertical Carbon Anode Surfaces in Cryolite Melt Applying a See-Through Cell †

Department of the Materials Science and Engineering, Norwegian University of Science and Technology NTNU, NO-7491 Trondheim, Norway
*
Author to whom correspondence should be addressed.
Presented at the 1st International Electronic Conference on Metallurgy and Metals, 22 February–7 March 2021; Available online: https://iec2m.sciforum.net/.
Mater. Proc. 2021, 3(1), 8; https://doi.org/10.3390/IEC2M-09238
Published: 18 February 2021
(This article belongs to the Proceedings of The 1st International Electronic Conference on Metallurgy and Metals)

Abstract

:
Gas bubble behavior on a carbon anode in a cryolite melt has been studied by visual observation using a see-through cell. The bubble phenomena studied have included growth, coalescence, and detachment during electrolysis. Two different anode designs were tested, an anode with a horizontal facing-downwards surface and an anode with a vertical surface. At the horizontal anode, it was found that one large bubble was formed by the growth and coalescence of smaller bubbles, and finally, the large bubble detached periodically. For the vertical anode surface, many smaller bubbles were formed and detached randomly. The bubble diameter was decreasing with increasing current density for both anodes.

1. Introduction

The primary anode product in Hall–Héroult process is CO2/CO gas mixture. Gas present at the anode surface contributes to an increased cell voltage. The extra potential drop in an industrial cell due to the presence of bubbles is about 0.15–0.35 V out of a typical total cell potential of ~4.5 V [1]. To obtain faster gas bubble release, slotted anode designs were introduced. Anode bubble behavior for different anode designs and materials has been typically studied industrially and also at laboratory scale. The current work examines more closely the bubble behavior for anodes typically used to study reaction kinetics and mass transport, anode effect phenomena, current efficiency, carbon quality properties, etc. Studying bubble behavior in more detail is of importance because bubble behavior is relevant due to all the above-mentioned features. On the horizontal laboratory-scale anodes, the bubble life cycle is consistent and periodical, but with the industrial anodes, typical behavior is less periodic with a release of large bubbles [2].
Several researchers [3,4,5,6,7] have studied the bubble life cycle, which includes processes such as bubble nucleation, bubble growth, bubble coalescence, and bubble detachment on a downward-facing horizontal carbon anode surface applying a transparent cell capturing images from the side openings combined with the observation from above [3,4], side openings [5,7], and side and bottom openings [6]. It was reported that small individual spherical bubbles were formed at the horizontal anode surface (ø 9 mm). The bubbles grew and coalesced to form larger bubbles, eventually covering the majority of the anode surface [3,4]. After reaching maximum size, the bubble slid toward the edge of the anode, where it was detached and rose vertically. After bubble detachment, the bubble-free part of the anode surface was available for a new process cycle of bubbles nucleation, growth, coalescence, and detachment. Bubble behavior was also observed on a vertical anode surface in only a few studies. Cassayre et al. [3,4] studied bubble formation on the vertical side of a graphite anode cylinder at lower current densities (0.05–0.2 A cm−2). It was found that bubble nucleation occurs on specific nucleation sites. The number of nucleation sites grew with the increase in current density. Spherical-shaped bubbles grew and coalesced until reaching 2–3 mm in diameter and then detached and escaped vertically. The surface coverage was found to be very high, and the small bubbles appeared stuck to the anode.
The aim of the current work was to study bubble formation and detachment for a horizontal (facing downward) electrode surface and a vertical electrode surface. Video recordings during electrolysis using the different anode designs were performed in a see-through cell. Results obtained in this work can not be directly applied to an industrial setting, but increased knowledge of the bubble behavior is useful for further improvement of gas release and especially in laboratory-scale studies applying these types of anode designs.

2. Experimental Part—Materials and Methods

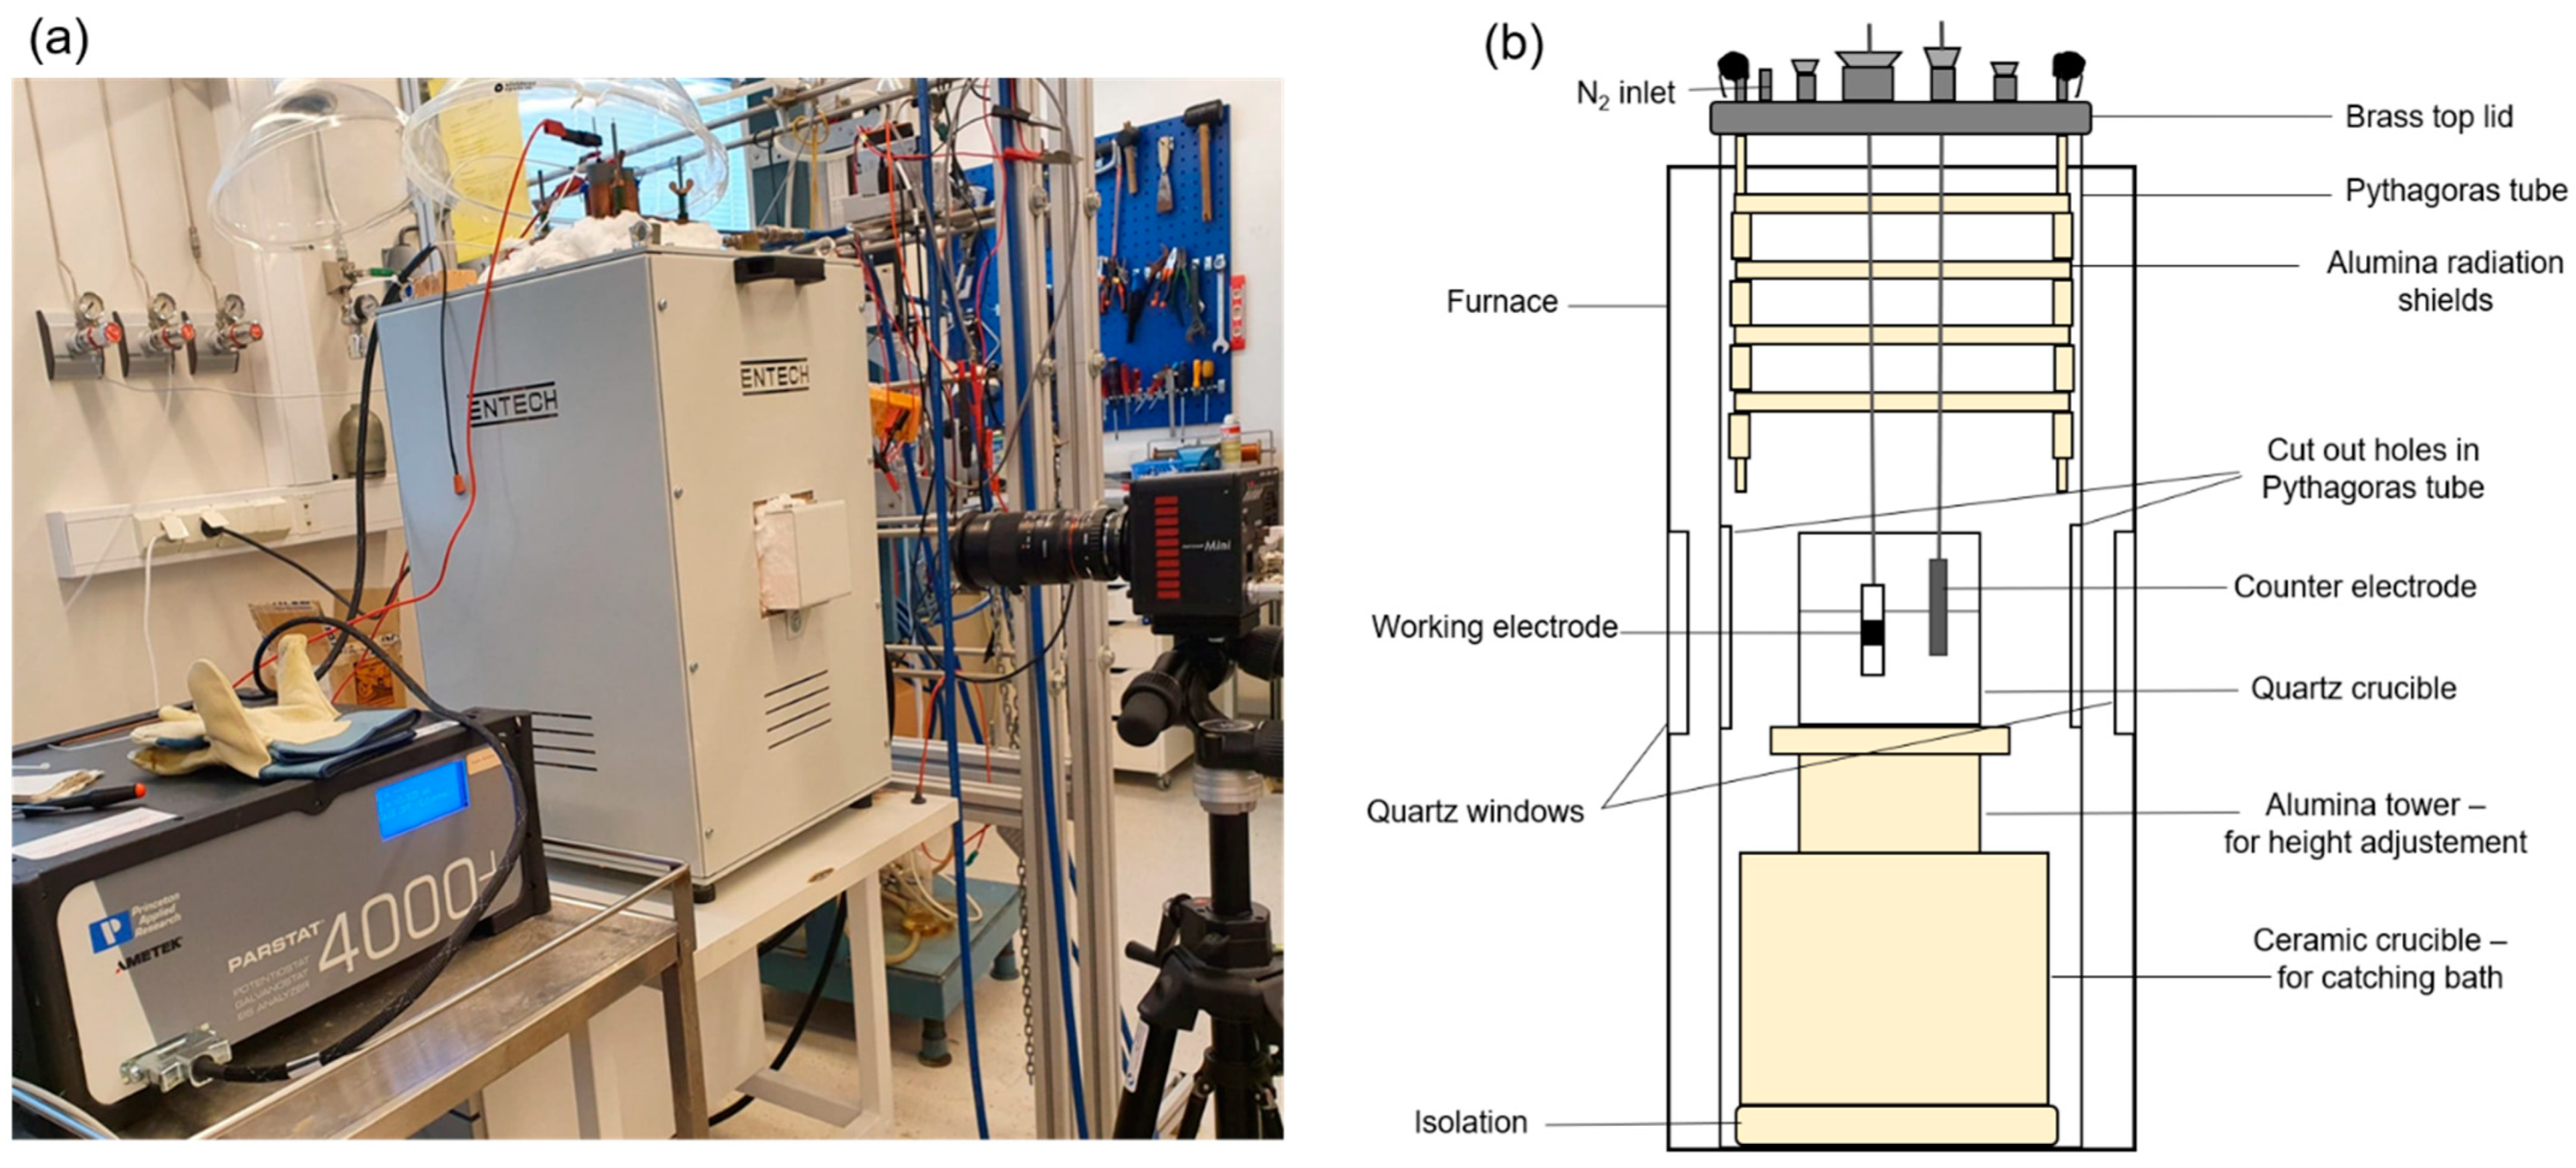
2.1. See-Through Cell

The experiments were conducted in the see-through furnace shown in Figure 1a. Figure 1b shows a principle sketch of the experimental setup. Video recording was performed from the side. The furnace has two side openings that are closed with lids. The lids are removed and replaced with quartz windows only during video recording in order to reduce heat loss. The quartz crucible rested on an alumina tower construction, which was used to adjust the height level of the crucible. The alumina tower was placed in a ceramic crucible whose function was to catch the bath in case of crucible breakage during the experiment.

2.2. Bath Composition and Temperature Control
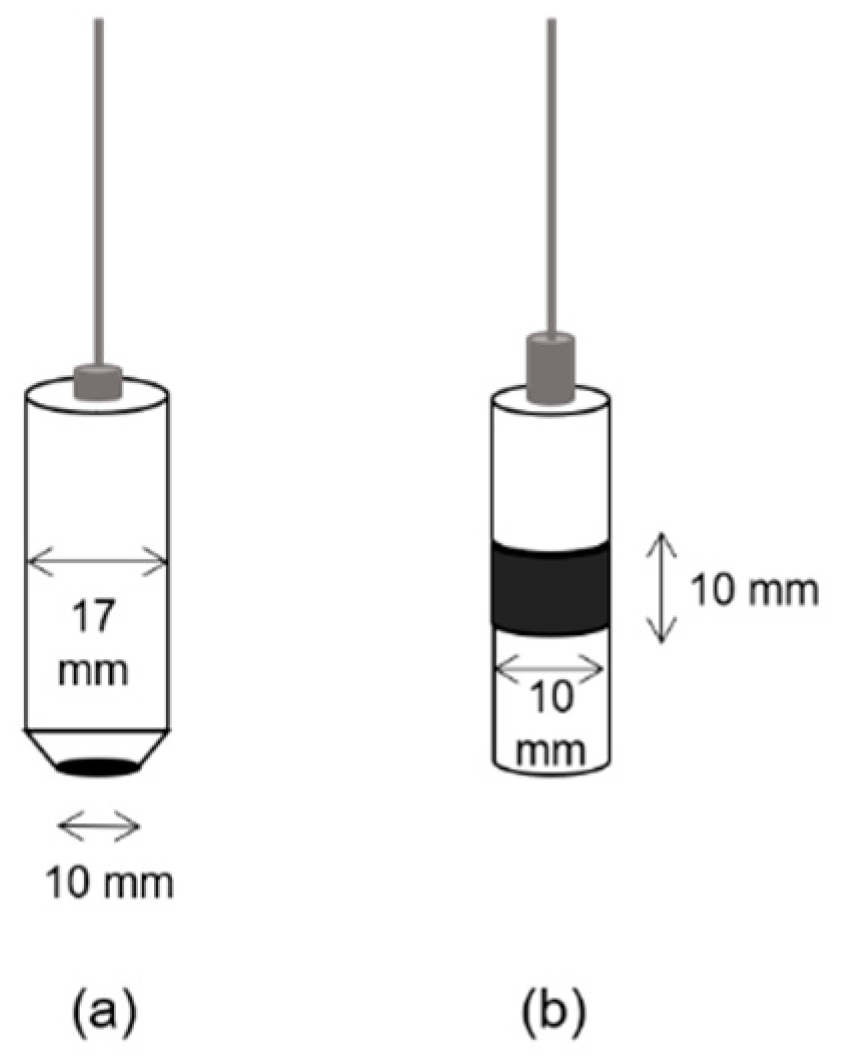
Experiments were performed in a cryolite bath at a temperature of 890 ± 10 °C. The bath composition used in this study is listed inTable 1. The calculated liquidus temperature was 838 °C (Appendix A). The superheat was intentionally kept this large in order to avoid bath freeze due to frequent openings of the furnace side lids and to prolong the video recording time. The bath was contained in the quartz crucible with a wall thickness of 2 mm. The crucible lifetime was a maximum 5–6 h, including the heating process, which took around minimum 2 h. The quartz crucible normally broke down due to a formation of holes in the quartz wall at the bath meniscus. Upon heating, when a temperature of 890 °C was achieved, the side lids of the furnace were removed and replaced with the quartz windows. After some time (approx. 20–30 min), the bath started to freeze on the quartz walls due to heat loss. This was associated with reduction in bath temperature. The quartz windows were removed and replaced with the side lids. If necessary, the set point of the furnace power supply was increased by 5–10 °C. After 15 min, the side lids were removed and the quartz crucible and bath were checked for transparency in order to continue the experiment.

2.3. Anode Design

Two anode designs, one with and horizontal and one with vertical surface, and with the same dimensional length (10 mm), were applied. The horizontal anode and the vertical anode are shown in Figure 2. Both anodes were made as described in [8]. A purified graphite material (Schunk Tokai Scandinavia, AB, Trollhättan, Sweden) was the active electrode material. Boron nitride (BN) (BN5000, Kennametal, UK) was used for anode shielding. The immersion depth of both anodes in the bath was around 3.5 cm. As a counter electrode, a stainless steel (SS) rod with a diameter of 5 mm was used. The SS rod was immersed around 4 cm into the bath, which gave an area of approx. 6.5 cm2.

2.4. Experimental Methods

Electrochemical measurements were performed using a PARSTAT (Princeton Applied Research) potentiostat and a 20 A booster (KEPCO). A two-electrode system was used. A reference electrode was not applied due to space limitations in the cell and the disturbance of the video image. Electrolysis was performed at constant cell voltage and at constant current. Current vs. time measurements for the horizontal anode were transformed into frequency spectra by using a Fast Fourier Transform algorithm in Sigview software-spectrum and signal analysis. The signals were transformed into the frequency domain to evaluate how the power of the signal was distributed over a range of frequencies to determine the dominant frequency. The sampling rate (Fs) was 5 Hz; consequently, the spectrum had a frequency range from zero to Fs/2, 0–2.5 Hz.
A Photron Fastcam Mini AX camera was used for the video recording. Two different frame rates were used, 60 fps (frames per second) for the recording of the bubble behavior for both anode designs, and 125 fps for the vertical anode. Recording with the higher rate was used in order to be able to capture fast events like coalesence. A Photron Fastcam Viewer 4 (PFV4) software was used for the control of the Photron high-speed camera, data saving, and image processing.

3. Results and Discussion

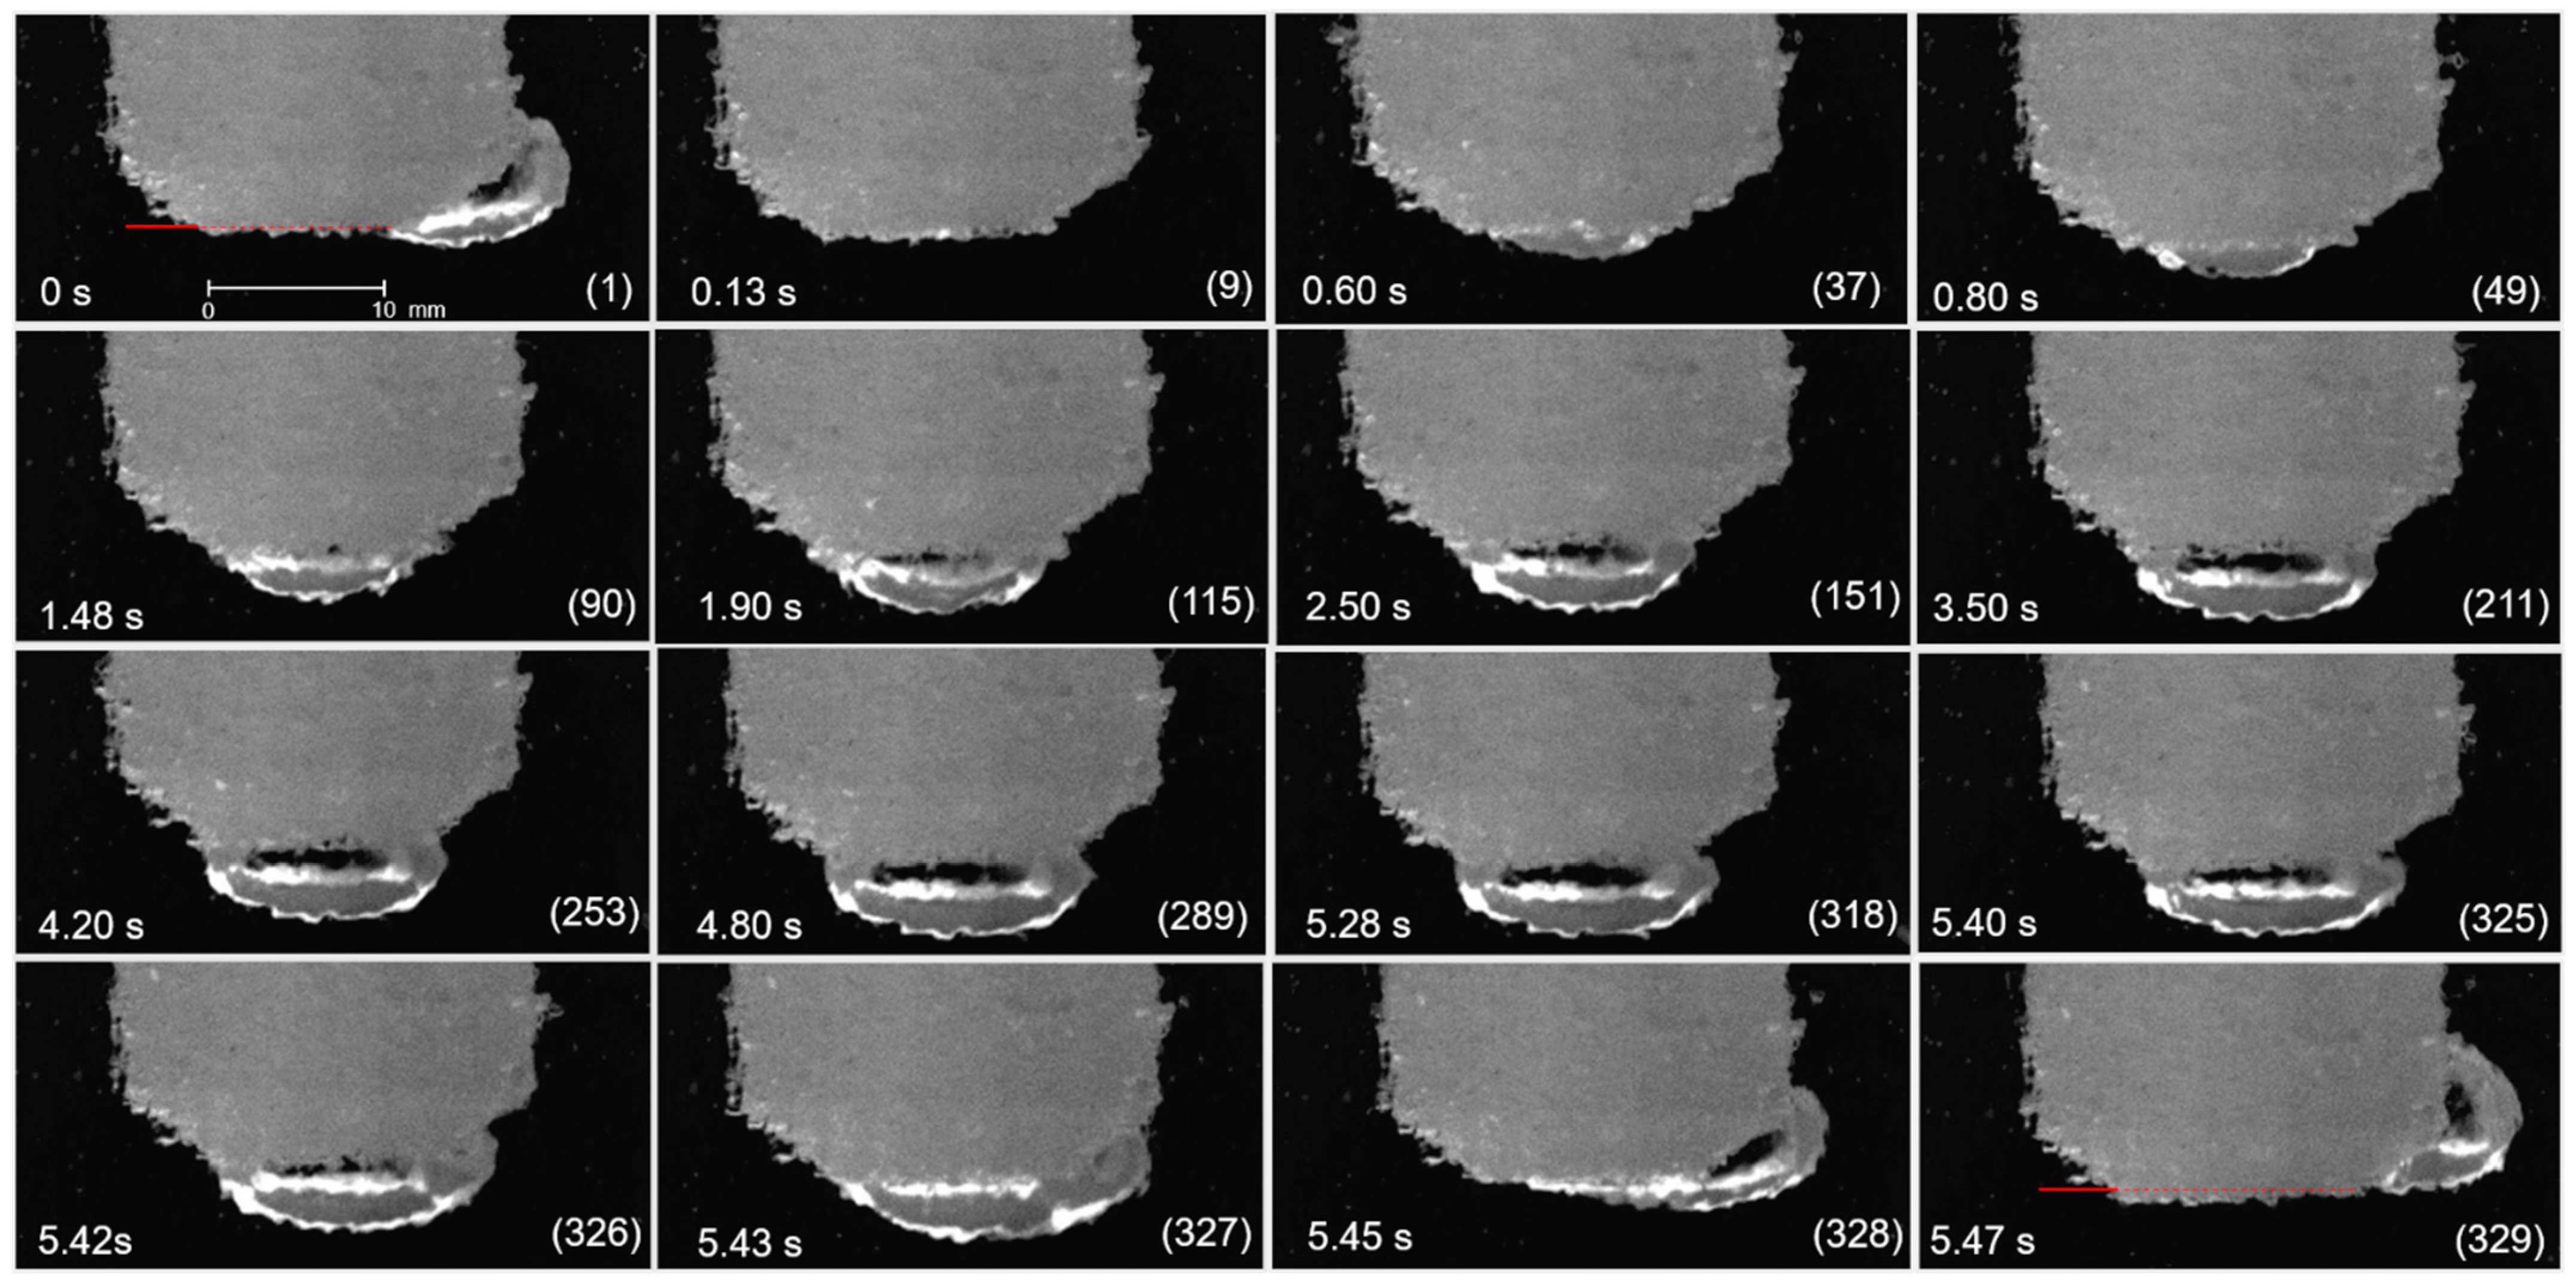
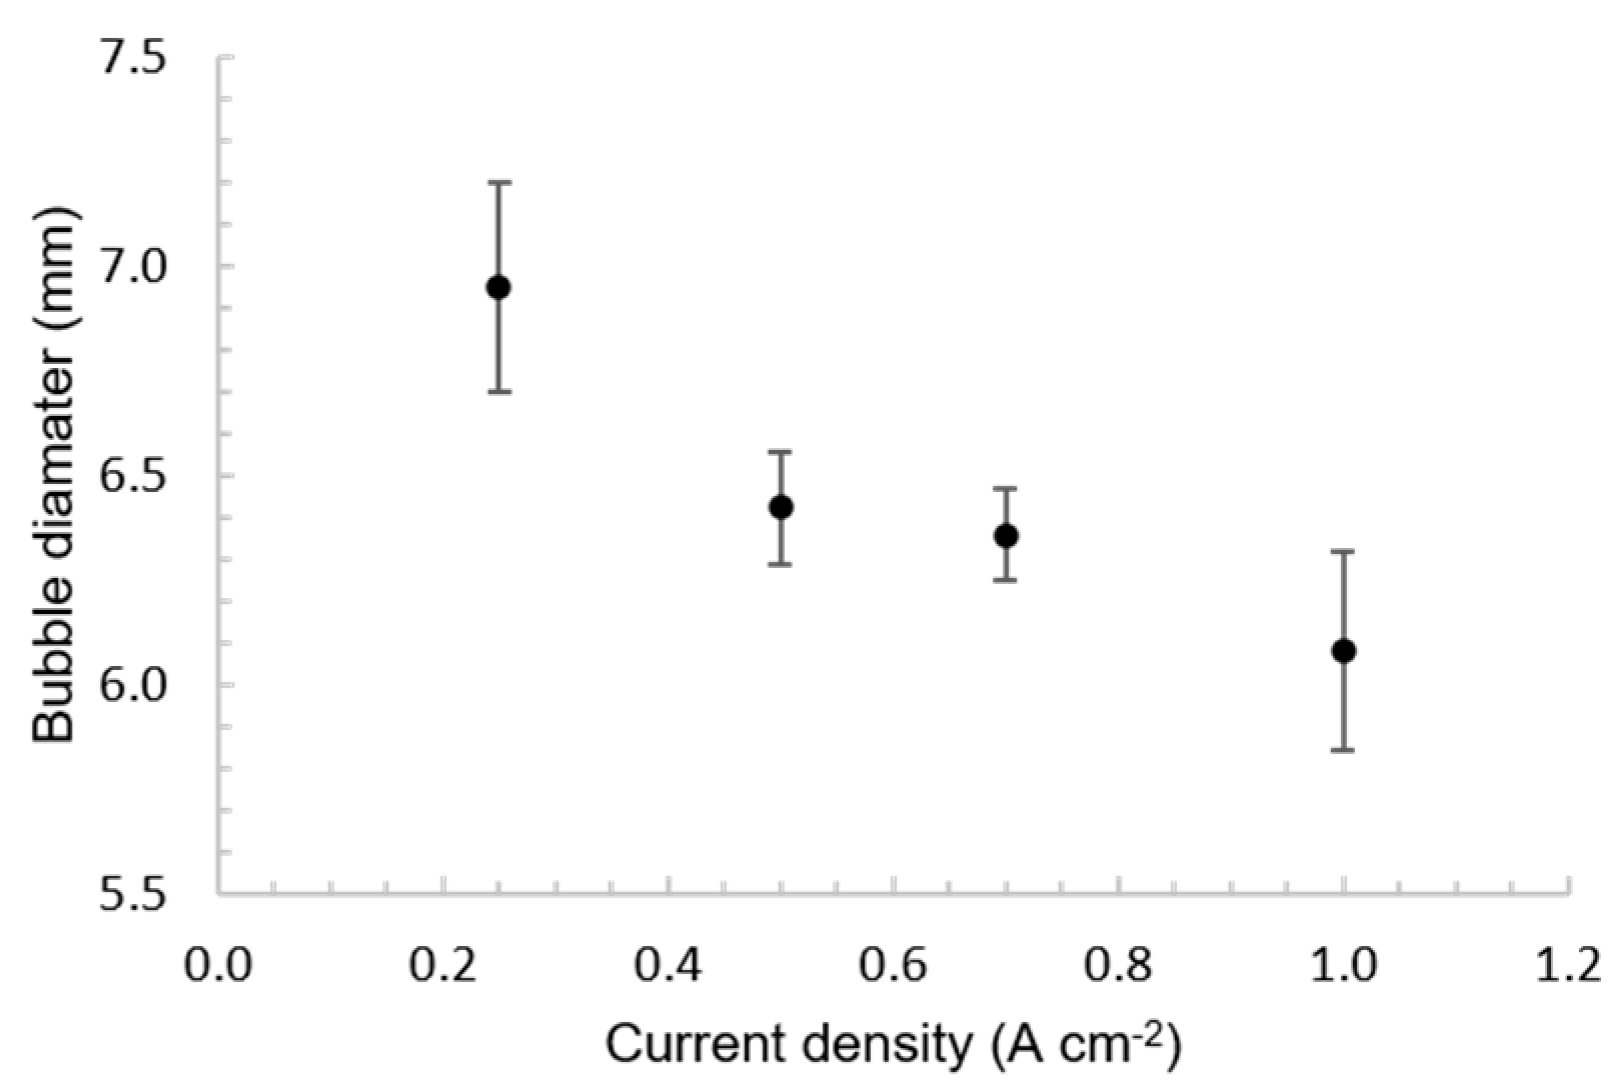
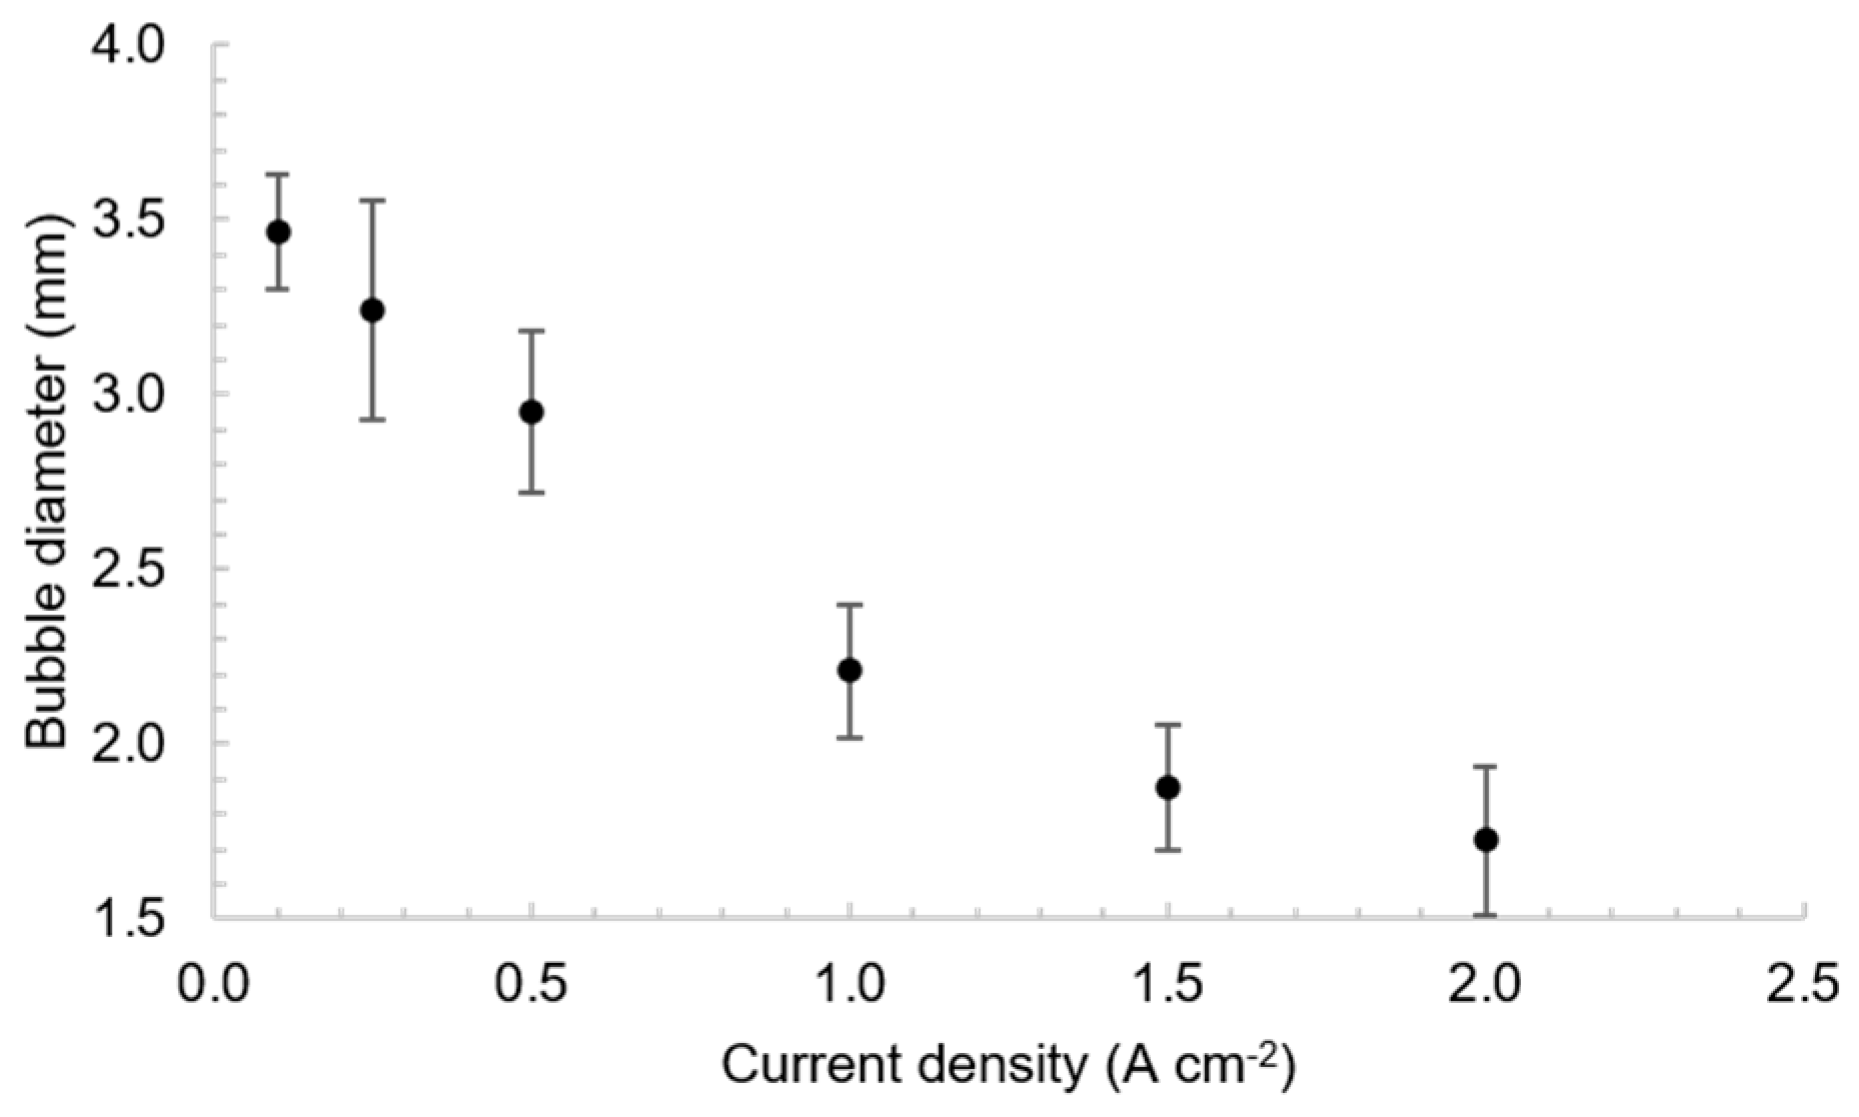
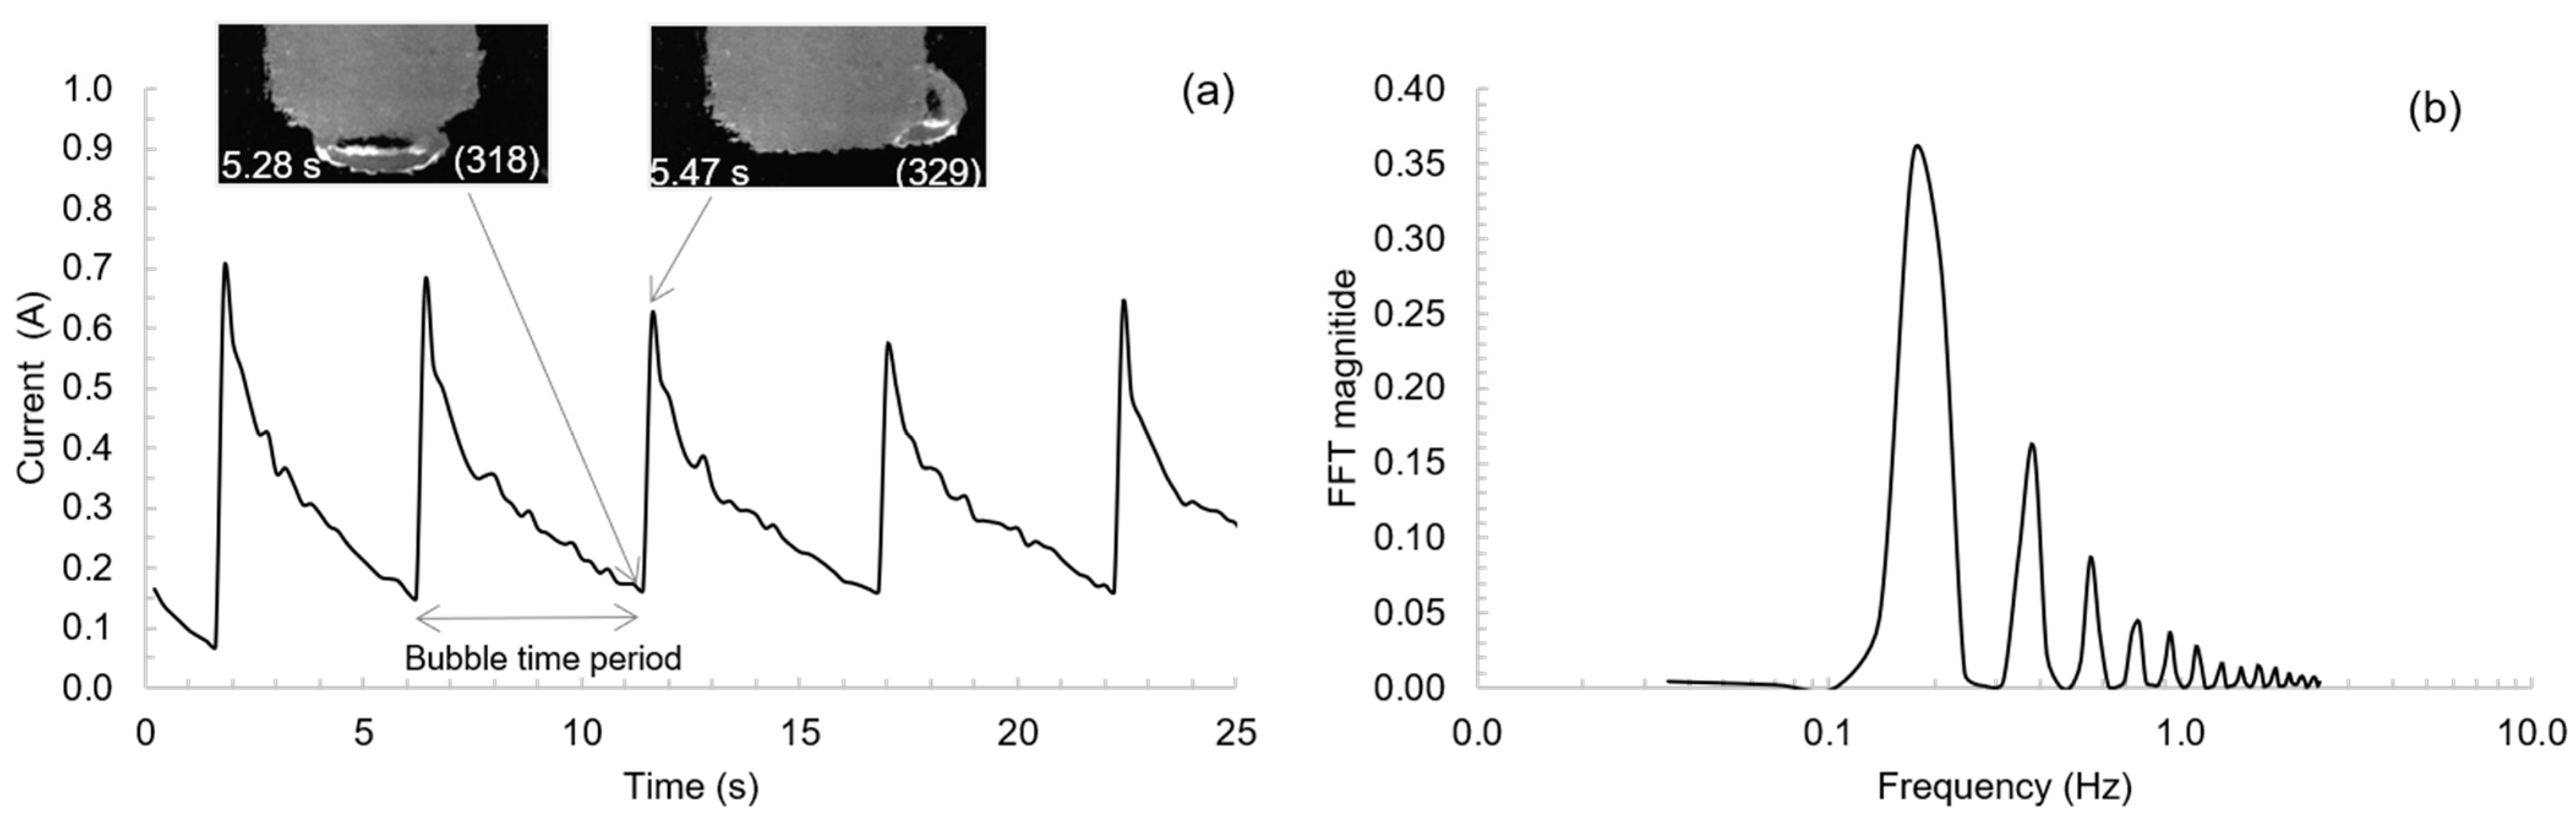
3.1. Bubble Behavior on the Horizontal Anode

Figure 3 shows one bubble life cycle, which includes the bubble nucleation, growth, coalescence and bubble detachment during electrolysis at a constant cell voltage of 1.5 V. The corresponding average current density was 0.4 A cm−2. The beginning of the bubble cycle was considered to be when the anode surface was free of a large bubble, which was the situation right after the bubble from the previous cycle was detached (frame (1)). It was found that one cycle lasted 328 frames. Since the video recording was obtained with the speed of 60 fps, one frame corresponds to (1/60) second. Thus, the bubble cycle time was found to be 5.47 s. There was no possibility with the current set up to position the camera to observe the bottom of the horizontal anode straight from below. Therefore, the bubble nucleation and coalescence were difficult to observe. Growth of the bubbles and detachment as one big bubble were well observed from the side. The bubbles grew to a size as large or slightly larger than the horizontal carbon surface, before it started to slide toward the edge (frame 325) and was detached (frame 329).
In Figure 4a, the details of the characteristic saw-tooth curve of the current-time data are shown. When a bubble was detached, a sharp jump in current occurred and the current obtained its highest value. When bubbles nucleated, grew, and coalesced, the current density decreased almost linearly while bubbles covered more and more of the surface. At the time of detachment of a big bubble, the surface was never totally free of bubbles. In Figure 3 at frames (1) and (329), the carbon surface is indicated with the red dashed line. While one large bubble was sliding toward the edge to be detached, the smaller bubbles were already nucleating and growing at the left part of the anode surface. From frame (329) and to a certain extent frame (1), it can be seen that the bubble layer is thicker on the left side than at the tail of the departing bubble. Bubbles strongly affect the potential components at gas-evolving electrodes. For areas where bubbles almost blocked the electrode surface, the current was close to zero, but for areas where bubbles did not block the electrode surface, the current density was greater than the average [9]. Frame (318) corresponds to the smallest current measured; i.e., when a big bubble almost covers the whole anode surface. Frame (329) corresponds to the highest current value, i.e., the time of detachment of a large bubble. From Figure 4a the bubble cycle time was found to be around 5.5 s and is very close to 5.47 s found from Figure 3. Figure 4b shows the FFT analysis of current-time data, which gave a dominant frequency of 0.18 Hz, corresponding to a bubble cycle time of 5.5 s. This confirms that the dominant frequency equals the bubble release frequency.
The thickness of the bubble was determined as the vertical distance between the anode surface and the bubble surface just before the bubble started to slide toward the edge of the anode for its detachment. For the horizontal anode at a current density of 1 A cm−2, the thickness of the bubble was found to be around 4.6 mm. Most studies suggested that the bubble layer thickness is around 5 mm in both laboratory and industrial cells [3,4,5,10]. Cassayre et al. [4] observed that the bubble layer under a graphite anode (ø 9 mm) slightly decreased with current density, and its thickness was in the interval 4.2–5.0 mm for a current range in the interval 0.2–1.6 A cm−2.
The average bubble diameter after bubble detachment from the horizontal surface as a function of current density is presented in Figure 5. The bubble diameter was calculated as an average value of 10 bubbles at each current density. The bubble diameter decreased with increasing current density, from around 7 mm at 0.25 A cm−2 to around 6 mm at 1 A cm−2. Cassayre et al. [3,4] measured the bubble diameter before its detachment from the surface and also found that the bubble diameter decreased with increasing current density. This was explained by less pronounced coalescence at higher current densities and the fact that bubbles escaped before covering the anode and grow to full size. Cassayre et al. [3,4] also found that with increasing current density the bubbles became smaller and formed at a higher frequency. An increase in current density and a corresponding increase in potential lead to an increase in the number of nucleation sites, i.e., smaller and a higher number of bubbles are formed. These bubbles coalesce into one large bubble, and the bubble cycle time is shorter. Bubble-induced convection increases with increasing current density as more bubbles are released from the surface. The increased convection promotes easier detachment of the bubbles and also contributes to the formation of smaller bubbles.

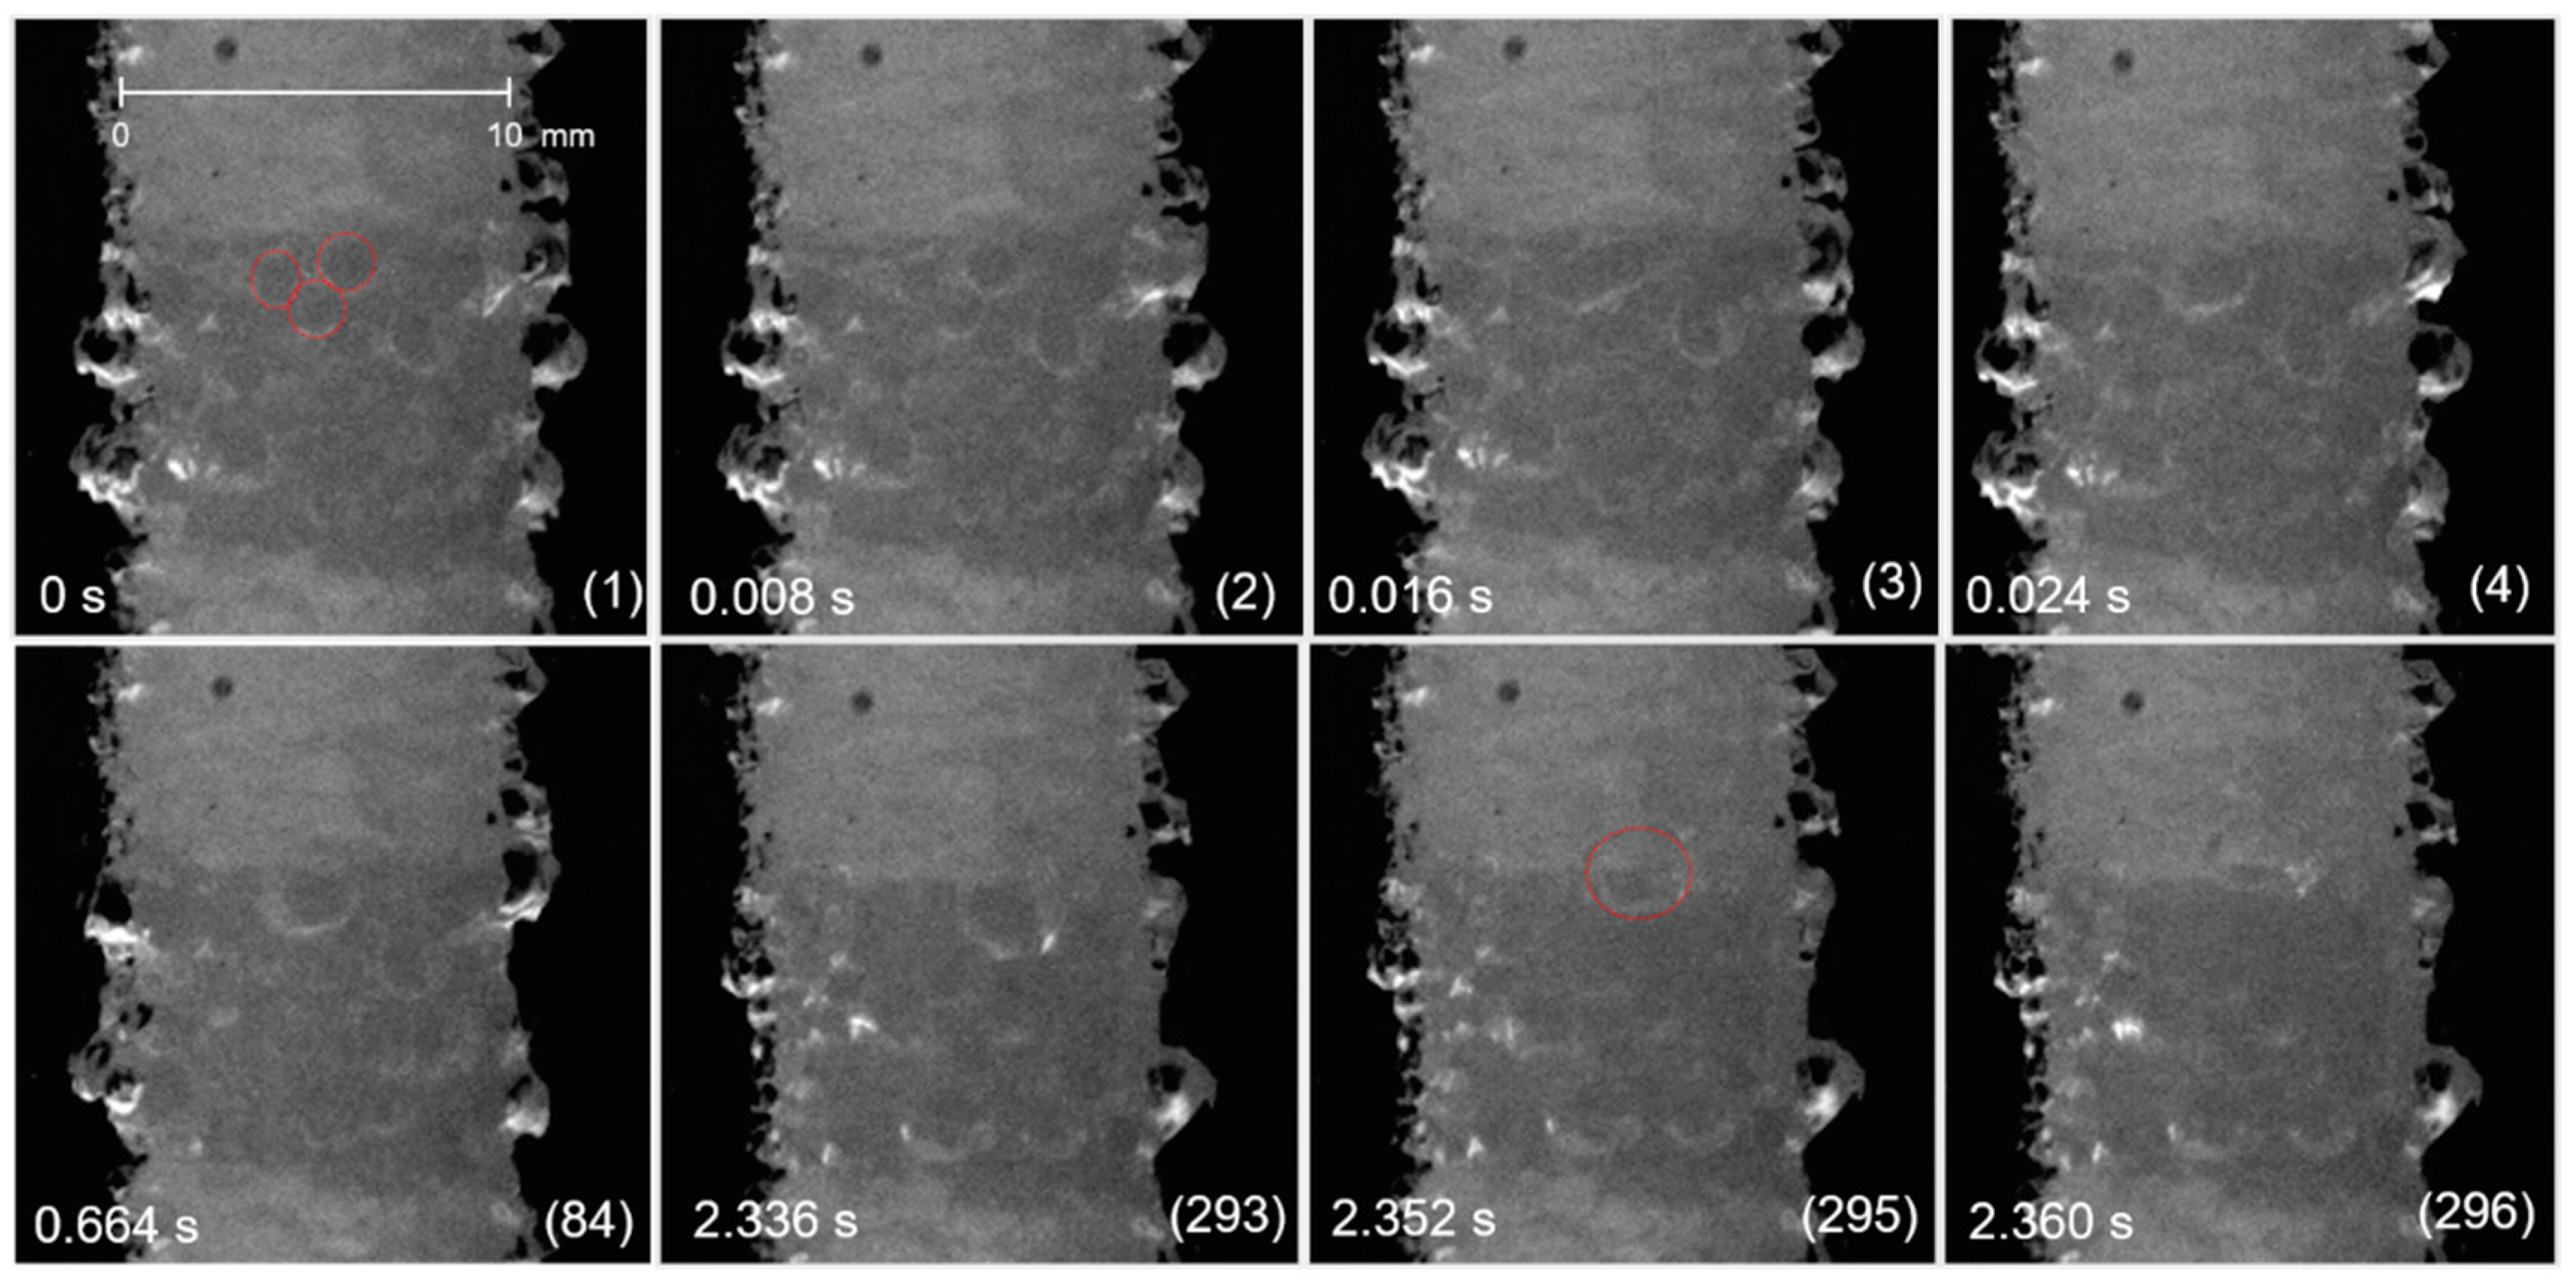
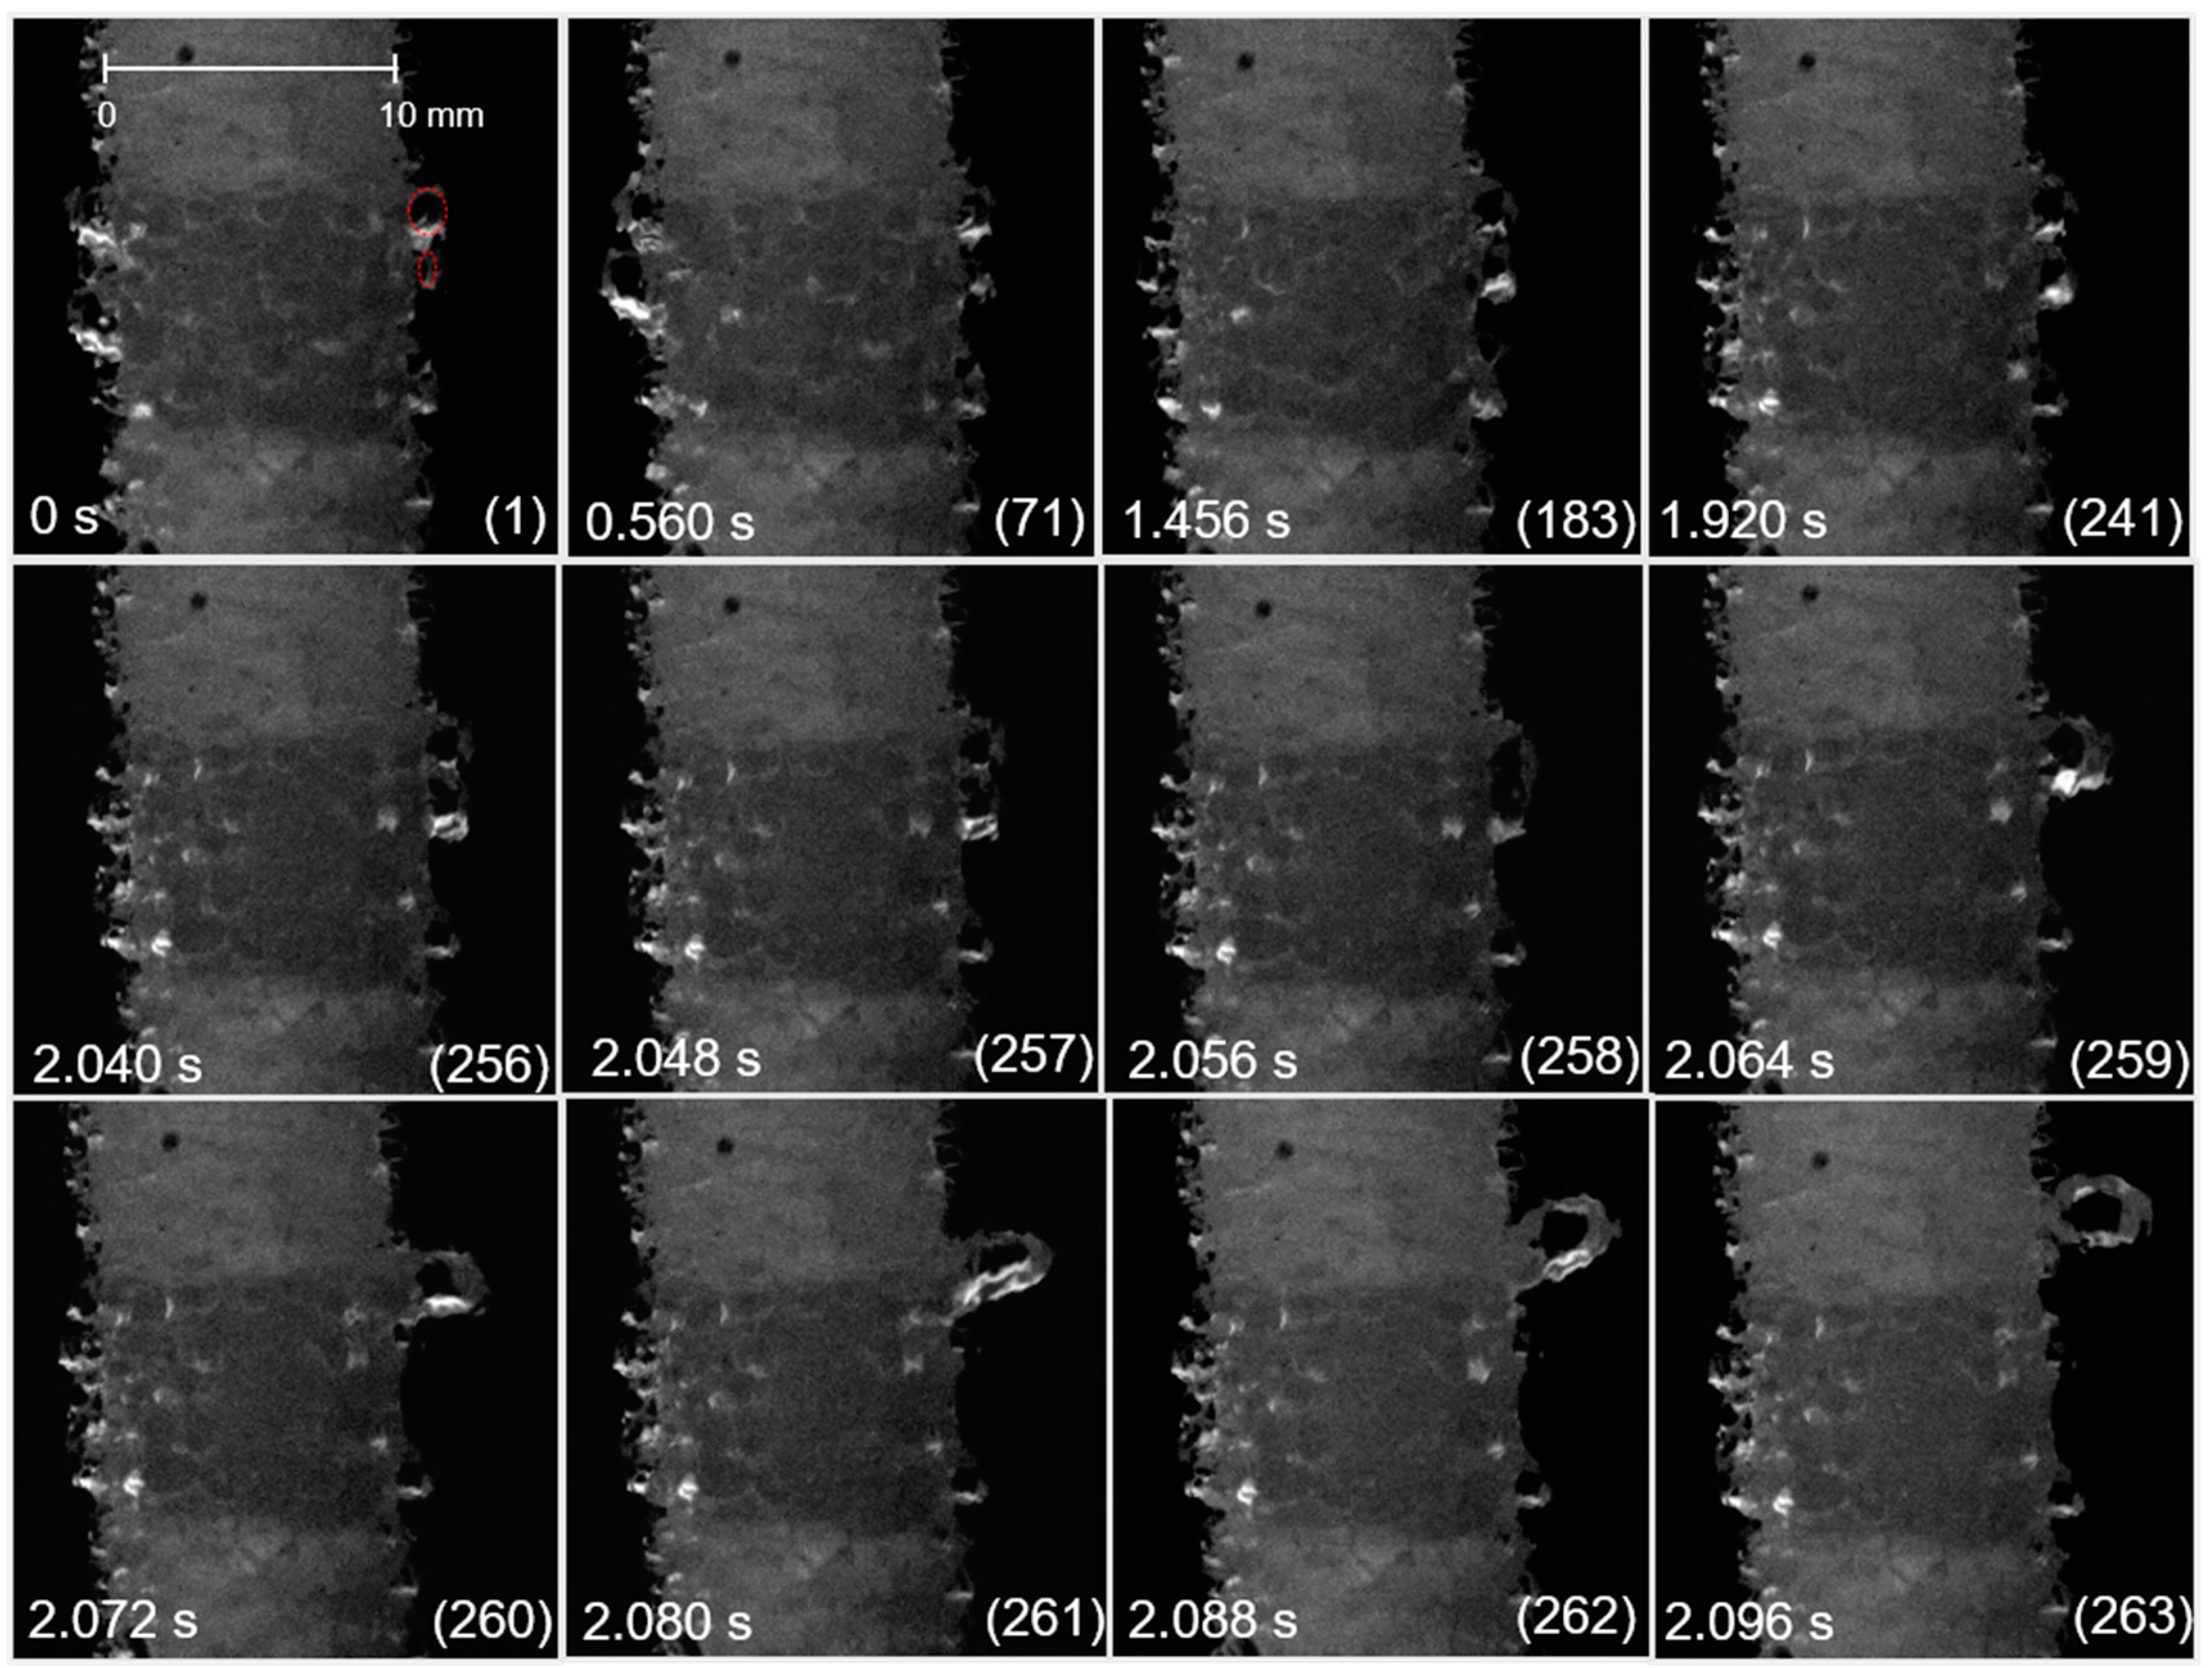
3.2. Bubble Behavior on the Vertical Anode

The bubble life cycle (nucleation, growth, coalescence, and detachment) at a vertical surface was studied in detail at low current density, 0.1 A cm−2, and with a slightly higher frame rate, 125 fps. At this current density, convection is low in comparison to higher current densities, and the transparency of the melt was at its best due to the small amount of dispersed bubbles in melt. The images are shown in Figure 6 and Figure 7. The bubble formation occurs at specific nucleation sites. No periodic pattern was in bubble growth and coalescence, making the bubble life cycle more of a random process. It was observed that some bubbles formed at the surface were coalescing with other bubbles, either with bubbles positioned nearby or with bubbles sliding upwards along the vertical anode surface. It was also observed that some bubbles were not coalescing, either detaching from the surface immediately or resting at the surface for a random amount of time before detaching. It was observed that for the bubble to leave the surface, it had to grow to a certain size. The measured diameter of detached bubbles for a current density of 0.1 A cm−2 was in the range of 3.3 mm to 3.6 mm. If the bubble became entrapped at the boron nitride/carbon boundary, the resting time radically increased, as discussed below in relation to Figure 7.
Figure 6 shows the fast process of coalescence of two bubbles into one bubble and the fast detachment of that bubble. The upper bubble rested at the anode surface for around 1 s when a smaller bubble was formed below (frame (1)). Both bubbles were growing and the lower bubble was approaching the upper bubble. The diameter of both bubbles was measured in frame (256) and was found to be 2.0 mm for the upper bubble and 2.5 mm for the lower bubble. In frame (257), it can be seen that the lower bubble was approaching the upper bubble. Frame (258) represents the intermediate stage in the coalescence process. In frame (259), the new bubble had obtained its final shape. The coalescence process is fast, taking place in about three frames corresponding to 0.024 s. The bubble diameter after coalescence was 3.3 mm. Immediately after coalescence, the new bubble had gained enough buoyancy to be able to detach from the anode surface. The detachment process starts in frame (260). The bubble is completely detached in frame (263), and the diameter after detachment was 3.4 mm.
Figure 7 shows the fast process of coalescence of three bubbles into one bubble. The diameter of three bubbles was measured to be around 1.5 mm, frame (1). Frame (3) represents the intermediate stage in the coalescence process. In frame (4), the new bubble has obtained its shape and a diameter of 2.7 mm. The coalescence process is fast, taking place in about two frames corresponding to 0.016 s. After coalescence, the bubble was resting and growing at the boundary between boron nitride (BN) and carbon anode (C). The bubble detachment is observed in frame (295), where the bubble is rising. The bubble diameter after detachment was 3.3 mm. The long resting of the bubble at the BN/C boundary could be explained by the work of Åsheim et al. [11], who predicted that gas bubbles can be entrapped at the boundary due to better wetting of the BN by the cryolite in comparison to carbon. Such a bubble needs probably extra time to grow to a certain size because it is in the contact with the BN. It probably also needs to grow bigger in size to be able to detach. However, no clear evidence for this was found because the size of the bubbles was in the same size range as bubbles detached from other places on the carbon surface.
The average bubble diameter after detachment from the vertical surface as a function of current density is presented inFigure 8. It was calculated as an average value of 10 bubbles at each current density. The bubble diameter decreased with increasing current density, from around 3.5 mm at 0.1 A cm−2 to around 2 mm at 1.7 A cm−2. The increase in current density and thereby the corresponding increase in potential give a higher driving force for the nucleation of relatively more bubbles. The bubble-induced convection is more efficient for the vertical anode than for the horizontal anode due to the smaller bubbles formed on the vertical anode as well as the bubble rising along the vertical surface. The larger flow makes bubble detachment easier.

4. Conclusions

The bubble diameter decreased with the increasing current density for both the horizontal and the vertical anode. Explanations for these observations are the larger number of nuclei formed at higher potential and the more efficient bubble-induced convection.
At the horizontal facing the downwards surface, the bubbles grew and coalesced to form one large bubble, which then grew larger and finally started to slide toward the edge of the anode surface for detachment. Even though the big bubble detached, the surface was never free of bubbles for the current density of 0.4 A cm−2 studied.
At the vertical anode surface, many smaller bubbles were formed and detached randomly. Coalescence of two and three bubbles into one bigger bubble was observed on the vertical anode surface. The coalescence process happened quite quickly, in about 20 ms from initiation to the final bubble shape was established. Some intermediate stages in the coalescence process were captured.

Author Contributions

N.S. performed all the experimental work and wrote the manuscript. E.S. supervised the work. All authors have read and agreed to the published version of the manuscript.

Funding

The research was funded by the Norwegian University of Science and Technology, NTNU.

Conflicts of Interest

The authors declare no conflict of interest.

Appendix A

For this study applying a see-through cell, it was crucial to introduce additives to the cryolite based bath in order to reduce the liquidus temperature and with it to increase the service time of the quartz crucible. The following empirical equation was used for the calculation of the liquidus temperature [12]:
t = 1011 + 0.14(mas%AlF3) − 0.071(mass%AlF2)2.5 + 0.0051(mass%AlF3)3 − 10(mass%LiF3) +
0.736(mass%LiF)1.3 + 0.063((mass%AlF3) * (mass%LiF))1.1 − 3.19(mass%CaF2) + 0.03(mass%CaF2)2 +
0.27((mass%AlF3) * (mass%CaF2))0.7 − 12.2(mass%Al2O3) + 4.75(mass%Al2O3)1.2
Equation (A1)agrees reasonably with other literature data [13].

References

  1. Zhao, Z.; Wang, Z.; Gao, B.; Feng, Y.; Shi, Z.; Hu, X. Observation of Anodic Bubble Behavior Using Laboratory Scale Transparent Aluminium Electrolysis Cells. In Light Metals 2015; Hyland, M., Ed.; Springer: Cham, Switzerland, 2015; pp. 801–806. [Google Scholar] [CrossRef]
  2. Einarsrud, K.E. A Treatise on Interpolar Transport Phenomena. Ph.D. Thesis, Norwegian University of Science and Technology, Trondheim, Norway, 2012. [Google Scholar]
  3. Cassayre, L.; Utigard, T.; Bouvet, S. Visualizing gas evolution on graphite and oxygen-evolving anodes. JOM 2002, 54, 41–45. [Google Scholar] [CrossRef]
  4. Cassayre, L.; Plascencia, G.; Marin, T.; Fan, S.; Utigard, T. Gas Evolution on Graphite and Oxygen-Evolving Anodes During Aluminium Electrolysis. In Light Metals 2006; Galloway, T.J., Ed.; TMS: Warrendale, PA, USA, 2006; pp. 379–383. [Google Scholar]
  5. Xue, J.; Øye, H.A. Bubble behaviour: Cell voltage oscillation during aluminium electrolysis and the effects of sound and ultrasound. In Light Metals 1995; Evans, J., Ed.; TMS: Warrendale, PA, USA, 1995; pp. 265–271. [Google Scholar]
  6. Zhao, Z.; Wang, Z.; Gao, B.; Feng, Y.; Shi, Z.; Hu, X. Anodic Bubble Behavior and Voltage Drop in a Laboratory Transparent Aluminum Electrolytic Cell. Metall. Mater. Trans. B 2016, 47, 1962–1975. [Google Scholar] [CrossRef]
  7. Huang, Y.; Wang, Z.; Yang, Y.; Gao, B.; Shi, Z.; Hu, X. Anodic Bubble Behavior in a Laboratory Scale Transparent Electrolytic Cell for Aluminum Electrolysis. Metals 2018, 8, 806. [Google Scholar] [CrossRef]
  8. Stanic, N.; Jevremovic, I.; Martinez, A.M.; Sandnes, E. Bubble Evolution on Different Carbon Anode Designs in Cryolite Melt. Metall. Mater. Trans. B 2020, 51, 1243–1253. [Google Scholar] [CrossRef]
  9. Leistra, J.; Sides, P.; Leistra, J. Hyperpolarization at Gas Evolving Electrodes. II. Hall/Heroult Electrolysis. Electrochim. Acta 1988, 33, 1761–1766. [Google Scholar] [CrossRef]
  10. Cooksey, M.; Taylor, M.; Chen, J. Resistance due to gas bubbles in aluminum reduction cells. JOM 2008, 60, 51–57. [Google Scholar] [CrossRef]
  11. Åsheim, H.; Eidsvaag, I.A.; Solheim, A.; Gudbrandsen, H.; Haarberg, G.M.; Sandnes, E. The Influence of Polarisation on the Wetting of Graphite in Cryolite-Alumina Melts. In Light Metals 2020; Springer: Cham, Switzerland, 2010; pp. 608–619. [Google Scholar]
  12. Grjotheim, K.; Kvande, H. Introduction to Aluminium Electrolysis: Understanding the Hall-Héroult Process, 2nd ed.; Aluminium-Verlag: Düsseldorf, Germany, 1993. [Google Scholar]
  13. Haupin, W. The Liquidus Enigma. In Light Metals 1992: Proceedings of the Technical Sessions Presented by the TMS Light Metals Committee at the 121st TMS Annual Meeting, San Diego, California, 1–5 March 1992; Cutshall, E.R., Ed.; Minerals, Metals & Materials Society: Warrendale, PA, USA, 1991; pp. 477–480. [Google Scholar]
Figure 1. (a) See-through furnace and experimental cell setup, (b) principle sketch of the interior of the furnace.
Materproc 03 00008 g001
Figure 2. Anode designs with the same dimensional length of 10 mm; (a) the horizontal anode with surface area 0.79 cm2, where boron nitride edges were chamfered by an angle of 45 degrees and (b) the vertical anode with surface area 3.14 cm2.
Materproc 03 00008 g002
Figure 3. Cycle of one bubble formed and detached from the horizontal surface during electrolysis at a constant cell voltage of 1.5 V with an average current density of 0.4 A cm−2. Frame numbers are given in brackets. The frame rate was 60 fps. Frame (1) is defined as 0 s and shows the situation right after a large bubble from the previous bubble cycle is detached from the anode surface. The horizontal dashed red line in frames (1) and (329) represents the vertical position of the carbon anode surface. A scale bar is shown in frame (1), and the bar indicates the horizontal position of the carbon anode surface.
Materproc 03 00008 g003
Figure 4. The horizontal anode; (a) Current vs. time data at constant cell voltage of 1.5 V and details of the saw-tooth curve. Frame (318) represents the situation when the smallest current is measured, and frame (329) represents the situation when the highest current is measured. (b) FFT spectra of current-time data.
Materproc 03 00008 g004
Figure 5. Bubble diameter after detachment from the horizontal surface as a function of applied current density.
Materproc 03 00008 g005
Figure 6. The process of coalescence of two bubbles (marked with red dashed line) into one bigger bubble and its immediate detachment from the vertical surface during electrolysis at a constant current density of 0.1 A cm−2. The frame rate was 125 fps. Frame numbers are given in brackets. Frame (1) is defined as 0 s. A scale bar is shown in frame (1).
Materproc 03 00008 g006
Figure 7. The process of coalescence of three bubbles (marked with red dashed line) into one larger bubble and its entrapment at the boundary between BN and C during electrolysis at a constant current density of 0.1 A cm−2. Frame rate was 125 fps. Frame numbers are given in brackets. Frame (1) is defined as 0 s, indicating the start of the coalescence process. A scale bar is shown in frame (1).
Materproc 03 00008 g007
Figure 8. Bubble diameter after detachment from the vertical surface as a function of applied current density.
Materproc 03 00008 g008
Table 1. Cryolite bath composition.
wt%SpecificationProducer
Al2O33γ-aluminaMerck
AlF315sublimed “in house”Industrial grade
LiF15purumRiedel-de-Haën
CaF25precipitated pureMerck
Cryolite62synthetic, purity > 97%Sigma-Aldrich
Publisher’s Note: MDPI stays neutral with regard to jurisdictional claims in published maps and institutional affiliations.

