Abstract
Digital image analysis is used, among other things, to see how an object’s surface changes over time. This technology can be applied to metal forming. A complete literature review of the recent advances in the application of such image analysis to metal forming processes is presented. We analyze how researchers apply the technique to different tests (tensile, bending, or fatigue tests), observing the advantages it presents compared to conventional methods, as well as the advances that have been made regarding the methodology used throughout the last years, including an analysis of the different existing patterns and their application procedures. We found that the image analysis has great applicability and that, in addition, the data obtained through it have high reliability when compared with numerical results. In the paper, the advantages of using Digital Image analysis applied to metals characterization are reviewed, and some examples of using this technique are also presented.
1. Introduction
The beginnings of the application of the Digital Image Correlation (DIC) method date back 35 years, having its most significant advances in the last decade. Several advantages can be associated to the application of DIC:
- Easy experimental setup.
- Relatively inexpensive equipment.
- Easy implementation to a diversity of materials and samples.
- Wide applicability with adjustable time resolutions.
- Implementation without direct contact with the sample.
- High precision can be achieved at nanometer scale.
Thanks to these factors, the use of this method prevails over its competitors in a variety of areas such as materials science, biomechanics and engineering: civil, mechanical, geotechnical, geotechnical and aerospace.
In essence, the DIC method consists of taking digital images of a specimen over a given time, which are compared with an initial capture, in order to evaluate the displacements and deformations suffered by the specimen while tensile stress is applied to it. In order to perform this evaluation, the sample must first be subjected to one or several coatings that generate a high contrast, generally a white background with black mottling on its surface. The analysis is performed by applying correlation algorithms, taking as reference a certain region of the initial image and comparing it with the result obtained from the same region in the deformed image, determining a displacement vector for the processed region.
Despite its wide application in various materials, both plastics and composites, in this work we focus on its application to metals, analyzing the results obtained with this method when studying the plastic deformation process of these materials.
Most of the metals used today are alloys that combine their properties to obtain materials with better properties, mainly making them lighter and stronger. Metal alloys have very interesting properties for engineering, which means a wide range of applications in structures, products and machinery. The most outstanding properties achieved are resistance to oxidation, high and low temperatures, high resistance to fatigue, high toughness and ductility, which have been achieved thanks to the enormous technological development. Alloys are not the only advance in the optimization of metallic materials, there are also other factors involved such as the application of hardening treatments, surface finishes and the discovery of new elements.
With the emergence of these new metallic materials, there is a need to study their characteristics in-depth, in order to be able to apply them optimally in the industry, since by knowing their capabilities, a correct use can be defined, thus generating products that meet the necessary requirements. This is why more specific methods are developed for the characterization of materials, such as DIC, which focuses on the study of the plastic deformations of materials, since up to now stress-strain analyses were carried out by means of the universal testing machine, which applies a static force to the material at very low speeds, which also leads to very small strain rates, even more in high-strength metals.
The results obtained by this type of testing then yield the stress-strain graph ( vs. ) without taking into account the dimensional changes that occur on the surface of the specimen as a consequence of the application of the load. These dimensional changes, in the case of metals, may not exceed its elastic zone and may be reversible or irreversible if it reaches its plastic zone.
2. State-of-the-Art
The main purpose of the analysis of the DIC method is to study how it has been used in experimental tests carried out on metals, through the information obtained in articles and experimental and research works.
For the analysis of the information collected, the documents were classified according to the elements considered most relevant to the implementation of the DIC method:
- Depending on the preparation of the material.
- Depending on the measuring equipment.
3. Preparation of the Material
This section shows the main processes for the preparation of samples of metallic material to be analyzed by DIC.
3.1. Application of Paints
The paint application on the specimens for the DIC method is established due to the need to create contrast on the surface of the specimen and to be able to analyze more easily the deformations that occur on it. Initially, the application of paint was performed by placing random black dots on a white background along the entire surface of the specimen, as shown by Frankovský, Virgala, Hudák, and Kostka [1] during their research.
Later Oliferuk, Maj, and Zembrzycki [2], propose a different application of the black paint on the white base, so that, instead of applying a random pattern over the entire surface, a pattern of dots (markers) is generated in the central part of the specimen that they call “calibration zone”, creating a rectangle of 25 × 10 mm with a separation between dots of 1.3 mm, as seen in Figure 1.
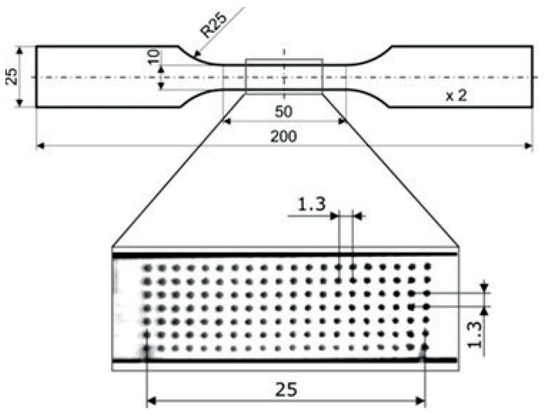
Figure 1.
Geometry of the specimen and points (markers) in the calibration zone proposed by Oliferuk et al. [2].
One of the greatest innovations achieved with the DIC method is observed in the study of curved parts, originating what is now known as 3D DIC, however, this involves the use of at least two cameras and therefore a greater expense in equipment, which is why Sesé, Díaz, and Siegmann [3] combine two methods, 2D DIC and Fourier Profilometry (FP) to make use of a single camera and thus determine deformations in the X, Y and Z directions. In this work, the piece is prepared with a base of white paint and a mottled red color, in order to generate contrast with the blue stripes projected by the FP method (Figure 2). The results of this research were compared with existing commercial equipment for the application of 3D DIC, getting results with a very high level of agreement, with differences of less than 5% between the results.
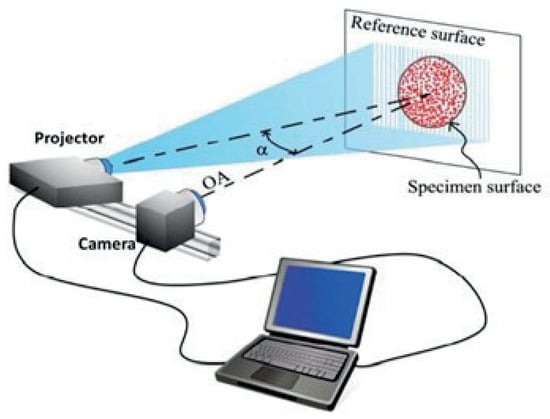
Figure 2.
Illustrative schematic of the setup used for Fourier Profilometry (FP)+2D-Digital Image Correlation (DIC) proposed by Sesé et al. [3].
Similarly, Nowak and Maj [4] propose a new way to perform image correlation through the 2D DIC method, taking as reference this time, the pixels generated by the paint pattern. The process consisted of applying a layer of soot to the sample on which white spray paint was sprayed, after which an “area of interest” was selected, which would correspond to the calibration area previously proposed, in this case with a smaller size, being this of 9 × 4 mm. The images were taken in gray-scale, so the information collected through the pixels was translated according to an intensity scale ranging from black with the value of 0 to white with the value of 255. To better visualize the process, Figure 3 shows an image zoom, selecting a square subset of the area of interest.
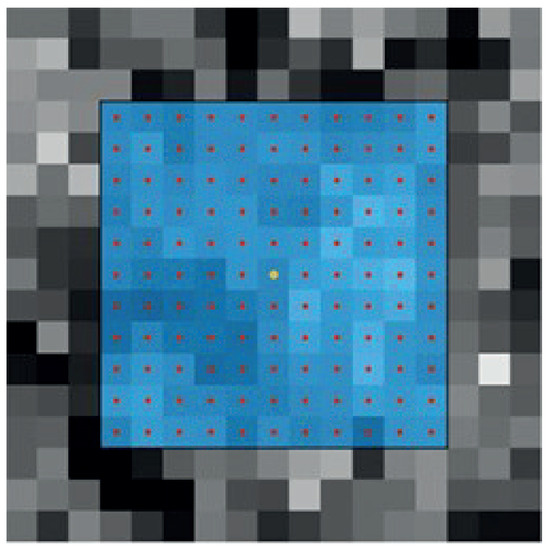
Figure 3.
Subset of the area of interest used in the method proposed by Nowak and Maj [4].
More recently, Oberg, de Oliveira, Goulart, and Anflor [5] showed how the configuration of the pattern of spots on the sample affects the accuracy of the DIC method, since, according to previous studies, it was determined that patterns composed of larger spots resulted in an increase in random errors, while patterns composed of smaller spots produced both random and systematic errors. Another study shows that the greater the number of stains, the more accurate the results obtained, however, the techniques commonly used so far for the application of the patterns, such as spraying by gun and spray painting, still did not offer an appropriate control in the characteristics of the pattern. Oberg et al. [5] were inspired to generate a pattern for DIC analysis, which would allow control of a given spot size and spot distribution. The developed method consisted of marking the surface of the material with random dots using a prototype CNC marking machine, specially designed for this purpose, which consists of a base that holds an ink marker.
The permanent point is moved over the surface of the material using servo motors, according to specific coordinates. In this case, a 1.0 mm marker was used to reproduce the numerically generated dots from the computer, achieving an average dot size of between 0.6 and 0.1 mm Figure 4. The number of points, in this case, was 40% over the surface, taking as a reference the studies of Lecompte, Sol, Vantomme, and Habraken [6] in the area.
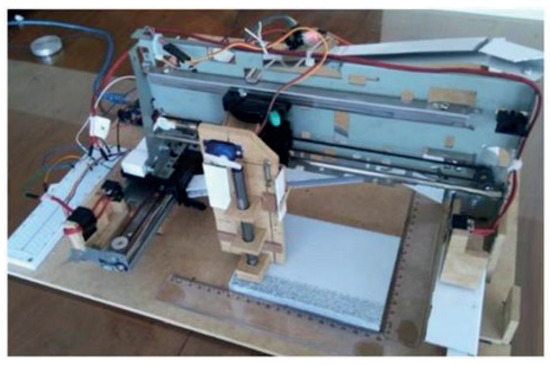
Figure 4.
CNC marking prototype proposed by Oberg et al. [5].
To determine the effectiveness of this new method, a comparison was made with respect to a sample marked with spray paint. The results can be seen in the histograms shown in Figure 5, where the left side of the graph represents black, while the right side represents white. It can be observed that histogram N1 presents pronounced peaks both on the left and on the right, which represent tones closer to black and white, while histogram N2 presents a very prominent peak on the right side, indicating a strong presence of white.
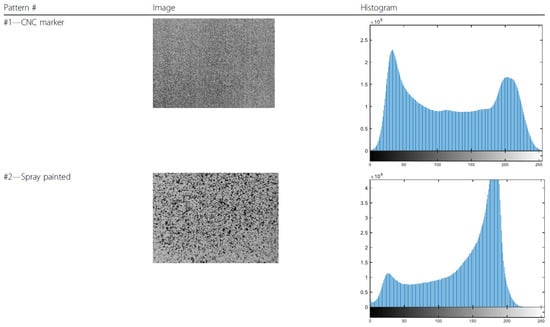
Figure 5.
Comparison of the application of random patterns between spray painting and using a CNC marker proposed by Oberg et al. [5].
This indicates that the CNC marker presents a more equitable distribution of the tones, which is also possible to control, since it is numerically generated, while the randomness of the spray application gives us a different histogram each time it is applied.
The real difference between the applications can be clearly observed in the results obtained through the DIC analysis (Figure 6), where the comparison of the results clearly shows how the CNC marker achieves continuity in the displacement zones, while the other two applications show a loss of data, reflected in the empty spaces, which are presumably due to a lack of randomness or to the low density of marked points.
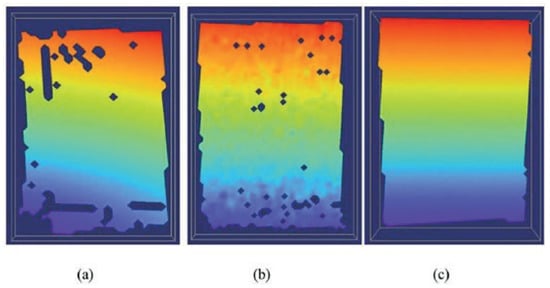
Figure 6.
Comparison between the resulting displacement zones analyzed by DIC in: (a) a spray-painted pattern, (b) hand-placed and (c) with the marker.
3.2. Application of Particles
Contrary to the application of paints, generally, the placement of particles is used to generate uniformity on the surface of the part to be analyzed by DIC through the use of thermal cameras, thus seeking to generate a high emissivity on it. In other cases, digital images are still used as a reference, only that the paint is replaced by powders to generate contrast on the surface of the sample.
The most commonly-used powder for thermal analysis with DIC is soot, which has been used for years as observed in the tests performed by Oliferuk et al. [2], who coated one side of the sample with this powder to ensure a high and homogeneous emissivity. The emissivity of a material is measured through its emissivity coefficient (), which indicates the capacity of a material to radiate thermal energy, ranging from 0 to 1. In the case of soot, its emissivity coefficient is 0.95.
Similarly, Driemeier, Moura, Machado, and Alves [7], use another powder in the DIC analysis, but in this case, to generate contrast in the random pattern, covering the sample with toner powder on a white paint base. The objective of these researchers was to generate a high-quality pattern, so they apply a numerically created dot design, which allowed them to control the random diameter and dot spacing. In addition, the marks were assigned a circular shape to minimize errors associated with preferential directions.
More recently, Pieczyska et al. [8] used paint combined with metallic microparticles to coat the material specimen to ensure high precision mechanical measurements. To apply the DIC method, they propose the use of a virtual extensometer in the central part of the specimen with dimensions 7 × 4 mm, in the direction of load application.
Similarly, Musiał, Nowak, and Maj [9] prepared the material applying a combination of methods by first coating the test tube with soot, then spraying it with small dots of white paint. They generated a high contrast in the specimen to perform the DIC analysis using a monochromatic camera. The tests were performed on two different types of specimens as shown in Figure 7, uniaxial tension specimens (a) and single shear specimens (b), both with a given Region Of Interest (ROI) of 6 × 4 mm and 10 × 3 mm respectively.
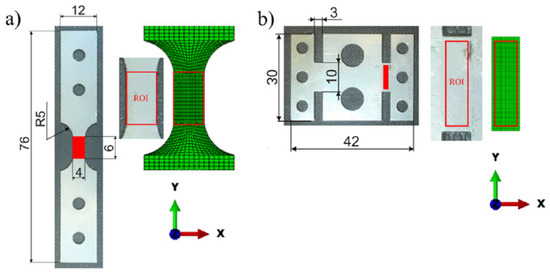
Figure 7.
(a) Geometry of the uniaxial tension specimen and (b) geometry of the single shear specimen, both with their corresponding Region Of Interest (ROI) and in green the comparison with the Finite Element Analysis (FEA) proposed by Musiał et al. [9].
4. Measuring Equipment
The DIC application process is currently performed using integrated equipment running its own software, but however, some researchers choose to create their own equipment configuration.
4.1. Measurement by Non-Integrated Equipment
Initially, the application of the DIC method was carried out using an equipment configuration selected by the researchers according to their needs and the results they wished to obtain. Basically, this configuration consisted of a universal testing machine, a camera and a computer where the results obtained were analyzed. Thus, López et al. [10], to perform the DIC analysis, they used a high-speed camera (Marlin F146B, Allied Vision, Stradtroda, Germany) and an LED light source that they placed over the camera to improve the contrast of the images. The sample is positioned perpendicular to the camera while it is subjected to compression stress using an Instron electromechanical universal testing machine. The images obtained were analyzed on a computer using Vic-2D software.
Similarly, Oliferuk et al. [2], added a Phoenix infrared camera to their equipment configuration, since they also wanted to perform a thermal analysis by DIC. To achieve this, the cameras had to be positioned facing each other, with the specimen in the middle, since the specimen has a different surface preparation depending on the type of analysis to be performed, as shown in Figure 8.
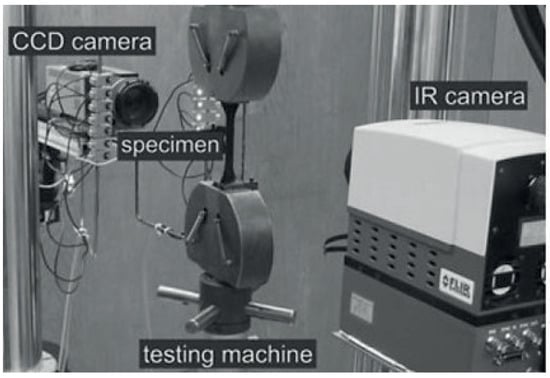
Figure 8.
Equipment configuration proposed by Oliferuk et al. [2].
In this case, the universal testing machine used was an MTS 858 (MTS Systems Corporation, Eden Prairie, USA). Data were analyzed using Matlab equations. Driemeier et al. [7] used an equipment configuration (Figure 9), integrated by an Instron model 3369 universal testing machine and, to improve the quality of the images they do not use a lamp, but a Visual Instrumentation Corporation model 900445 illumination set (Lancaster, USA). They also used two Nikon D90 (Tokio, Japan) digital cameras, whose images were analyzed through two software: first the 7D software and then they applied a code created by the authors to calculate the equivalent stress through Matlab.
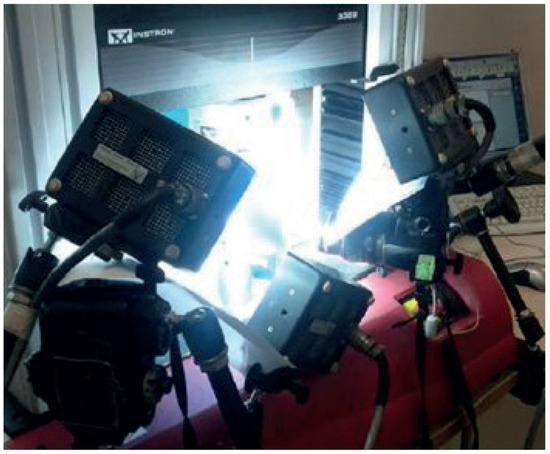
Figure 9.
Equipment configuration proposed by by Driemeier et al. [7].
Diaz et al. [11] applied an axial cyclic load to the specimen using an Instron 8501 (Instrom, Norwood, USA) universal testing machine. The DIC method images were taken through two Point Grey GRAS-50S5M cameras (Flir Systems, Orlando, USA) in a stereo configuration similar to Driemeier et al. [7]. The cameras were also equipped with high-magnification lenses to capture the material failure in detail. The images were recorded with the 3D-VIC Snap software and then analyzed by the VIC-3D software from Correlated Solutions.
Following this line, Nowak and Maj [4] used an equipment configuration similar to Oliferuk et al. [2], but in their case, they change the arrangement of the cameras operating in different wavelength ranges, one in the visible range (Manta G-125B, Allied Vision Technologies, Stadtroda, Germany) and the other in the infrared range (ThermaCam Phoenix, Matrox Electronic Systems Ltd., Dorval, Canada). They also add a long-pass optical filter, which reflects all radiation to the visible range camera and transmits more than 90% of the radiation to the infrared camera. To perform the tensile test through the universal testing machine (MTS 858, MTS Systems Corporation, Eden Prairie, USA), they attach special grips to it to prevent heat transfer between the equipment and the specimen, as shown in Figure 10. The authors also create the ThermoCorr software to perform the DIC analysis of both the digital and thermal images together, since the test data were collected in both chambers simultaneously.
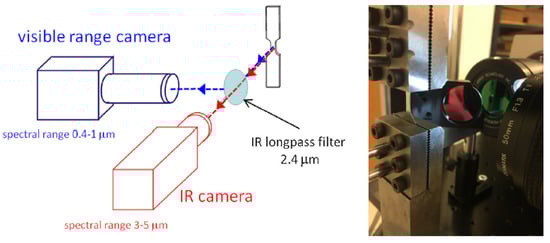
Figure 10.
Schematic and photograph of the equipment configuration proposed by Nowak and Maj [4].
4.2. Measurement Using Integrated Equipment
Since the beginning of the last decade, integrated systems have been implemented to perform DIC analysis, with the idea of standardizing the execution of the method, achieving higher quality and accuracy of the results. Frankovský et al. [1] used an advanced system for 3D DIC analysis that integrated hardware and software, called Q-400 and Istra4D, respectively, belonging to the company Dantec Dynamics.
Farahani et al. [12]) applied high-resolution 3D DIC using the VIC-3D HR system, which allows the analysis of deformations and displacements in X, Y, and Z. This system includes two high-resolution charge-coupled cameras (CCD) placed in an arrangement similar to Driemeier et al. [7], but in this case, aligned in the same plane by being on the same base, as can be seen in Figure 11. The cameras also had a C-Mount Rodagon 150/5.6 lens and were placed in front of the specimen at a distance of 1 m. They also made use of an external light source, using a halogen lamp, while the specimen was tensioned by a standard MTS-812 servo-hydraulic testing machine. The software used for the DIC analysis that integrates this system is VIC-3D. To obtain better resolution of the results and avoid distortions, the system uses a calibration template consisting of a pattern of 12 × 9 points located with a separation of 2.5 mm, which is subjected to DIC analysis and then proceed to the analysis of the specimens.
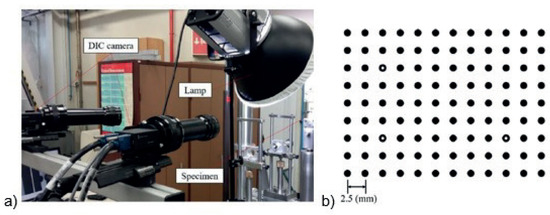
Figure 11.
(a) VIC-3D HR system with halogen lamp and (b) system calibration template.
4.3. Measuring Equipment
After the literature review, a trend was observed in the use of the Manta G-125B (Allied Vision Technologies, Stadtroda, Germany) camera in the case of non-integrated equipment. This trend arises because this type of camera facilitates DIC analysis, since it is a monochromatic camera and the sample is generally prepared in this same color range, a better contrast is achieved between the usually white background and the points on it, which are typically black.
As for the integrated equipment, the leading systems are the ARAMIS 4M and the Q-400, the latter of which has even been used in experiments carried out recently. The main advantage of these systems compared to the configuration of independent equipment is that their calibration is performed directly through the same software that performs the DIC analysis and they also have their own calibration templates, as opposed to the non-integrated ones, where the researchers have had to generate their own calibration templates. Something similar happens with the illumination systems, which are already included in the integrated ones and also have a high range of mobility, which is not so easy to match with additional equipment in the non-integrated ones.
One of the main disadvantages of the DIC method is directly related to the camera or cameras used to take images, since, depending on the quality of the images taken, high resolution is necessary to avoid loss of information. This is why lenses are attached to the cameras according to the specifications of the test, these are generally of magnification in order to obtain a better resolution and sharpness of the images, in addition, to avoid the loss of information during the test.
5. Conclusions
The application of the DIC method is very varied and is given mainly by the characteristics that researchers wish to study in the material. It is for this reason that most of the methodologies used are proposed by the authors themselves, even creating their own application software.
According to the information, it is believed that the maximum potential of this technique has not yet been reached, and that in many cases it is still experimental without having, for the most part, a regulation to support it. For this reason, researchers in this field are encouraged to generate a regulation that facilitates the application of the DIC method and also makes the comparison of the results obtained by this technique more feasible.
Finally, it is important to highlight the great applicability of this method in the characterization of metallic materials, especially in fields where they cannot be properly simulated through numerical analysis, as is the case of nonlinear behavior. This applicability is due to the good results obtained by DIC, which is mainly due to the fact that this method takes into account the real conditions that the material goes through and the procedure itself.
Author Contributions
All authors have contributed equally to this review. All authors have read and agreed to the published version of the manuscript.
Funding
This research received no external funding.
Conflicts of Interest
The authors declare no conflict of interest.
References
- Frankovský, P.; Virgala, I.; Hudák, P.; Kostka, J. The use the of digital image correlation in a strain analysis. Int. J. Appl. Mech. Eng. 2013, 18, 1283–1292. [Google Scholar] [CrossRef][Green Version]
- Oliferuk, W.; Maj, M.; Zembrzycki, K. Determination of the Energy Storage Rate Distribution in the Area of Strain Localization Using Infrared and Visible Imaging. Exp. Mech. 2015, 55, 753–760. [Google Scholar] [CrossRef]
- Sesé, L.; Diaz, F.; Siegmann, P. Integratio of Fringe Projection and 2D Digital Image Correlation for the measurement of 3D displacements and strains. Opt. Pura Apl. 2017, 50, 25–35. [Google Scholar] [CrossRef]
- Nowak, M.; Maj, M. Determination of coupled mechanical and thermal fields using 2D digital image correlation and infrared thermography: Numerical procedures and results. Arch. Civ. Mech. Eng. 2018, 18, 630–644. [Google Scholar] [CrossRef]
- Oberg, M.B.A.M.; de Oliveira, D.F.; Goulart, J.N.V.; Anflor, C.T.M. A novel to perform a thermoelastic analysis using digital image correlation and the boundary element method. Int. J. Mech. Mater. Eng. 2020, 15, 1. [Google Scholar] [CrossRef]
- Lecompte, D.; Sol, H.; Vantomme, J.; Habraken, A. Analysis of speckle patterns for deformation measurements by digital image correlation. Proceedings of SPIE—The International Society for Optical Engineering, Nîmes, France, 13–15 September 2006; Volume 6341. [Google Scholar]
- Driemeier, L.; Moura, R.T.; Machado, I.F.; Alves, M. A bifailure specimen for accessing failure criteria performance. Int. J. Plast. 2015, 71, 62–86. [Google Scholar] [CrossRef]
- Pieczyska, E.A.; Maj, M.; Golasiński, K.; Staszczak, M.; Furuta, T.; Kuramoto, S. Thermomechanical studies of yielding and strain localization phenomena of gum metal under tension. Materials 2018, 11, 567. [Google Scholar] [CrossRef] [PubMed]
- Musiał, S.; Nowak, M.; Maj, M. Stress field determination based on digital image correlation results. Arch. Civ. Mech. Eng. 2019, 19, 1183–1193. [Google Scholar] [CrossRef]
- López-Alba, E.; López-García, R.; Dorado, R.; Díaz, F. Aplicación de correlación digital de imágenes para el análisis de problemas de contacto. In Proceedings of the XIX Congreso Nacional De Ingeniería Mecánica, Castellon, Spain, 2012; Volume XIX. [Google Scholar]
- Díaz, J.G.; Gonzáles, G.L.; González, J.A.O.; de Freire, J.L. Analysis of mixed-mode stress intensity factors using digital image correlation displacement fields. In Proceedings of the 24th COBEM, International Congress of Mechanical Engineering, Curitiba, Brazil, December 2017. [Google Scholar]
- Farahani, B.V.; Belinha, J.; Amaral, R.; Tavares, P.J.; Moreira, P. A digital image correlation analysis on a sheet AA6061-T6 bi-failure specimen to predict static failure. Eng. Fail. Anal. 2018, 90, 179–196. [Google Scholar] [CrossRef]
Publisher’s Note: MDPI stays neutral with regard to jurisdictional claims in published maps and institutional affiliations. |
© 2021 by the authors. Licensee MDPI, Basel, Switzerland. This article is an open access article distributed under the terms and conditions of the Creative Commons Attribution (CC BY) license (https://creativecommons.org/licenses/by/4.0/).