1. Introduction
In any biomaterial, numerous populations of different micro-cells are present, which need to be separated depending on their purpose. The food and pharmaceutical industries use techniques to separate and diagnose pathogens from substrates. Today, biomedical bacteria are isolated from peripheral blood [
1]. The separation of infected cells or viruses from healthy cells using microfluidic techniques is on the rise [
2]. Cell counting is another important process in medical science that is needed to generate reports on the number of cells present in respective areas. It is natural for particles to move randomly in a flow [
3]. At the macro level, particles form an annulus at the end of their flow in a 1 mm-diameter pipe. This happens because particles migrate in response to the inertial forces acting on them within the flow [
4]. When a fluid moves, it experiences force in the opposite direction because of its viscosity; this force is called a viscous drag force. This force is dominant for more viscous fluids but is very slight for less viscous fluids [
5].
In a straight channel, the velocity profile is parabolic, which means that the velocity is at its maximum at the center and at its minimum near to the wall. This difference in velocity causes particles near the center to move toward the wall [
6]. The force that arises due to velocity difference is called the shear gradient lift force, F
L. As the particle moves toward the wall, the wall exerts a reaction force that is directed opposite to the F
L; this force is called the wall lift force F
WL [
7]. Particles equilibrate near the wall where these two forces balance each other [
8]. In a channel with a curve, particles experience an additional force called the Dean drag force. When a particle moves along the curve, due to high inertia, particles at the center tend to move radially outward near the outer wall of the curve, creating a pressure gradient in the radial direction of the channel [
9]. Due to this movement, a reaction occurs near the walls, and particles near the wall tend to recirculate toward the center of the channel, creating two counter-rotating vortices [
10]. These vortices in which particles rotate are called Dean vortices. The circulation of particles in these vortices is categorized as Dean flow or secondary flow [
11]. More Dean forces will cause more secondary flow. The secondary flow is quantized by a dimensionless quantity called the Dean number. The Dean number depends on various parameters of the channel [
12]. The Dean number of a straight channel is zero because it does not curve, and Dean force arises due to curvature in the channel. For a rectangular channel, particles are focused where F
L and F
WL balance each other [
13]. Since these forces arise due to differences in the magnitude of the velocity, their magnitudes differ at different points in the channel [
14]. Microparticles tend to move toward walls, and then secondary motion starts in which they adopt the path toward longer channel walls [
15]. For a rectangular channel, if the Re is very low, the number of focusing positions reduces to four, and when the curve is introduced, the number of equilibrium positions is reduced further [
16].
Particle migration occurs in two stages. The first is fast migration and the second is slow migration. In channels with a high aspect ratio, particles tend to move toward the height of the channel, and in channels with low aspect ratio, they tend to move toward the width of the channel. This means that particles are always directed toward the longer side of the channel [
17]. For square channels, it has been observed in previous studies that a shear gradient forms along all four sides and should be of equal magnitude [
18]. Erythrocyte- and monocyte-sized particles were completely separated in this research based on the above-mentioned forces and had sizes of 9 μm and 16 μm, respectively [
19]. These are two cells that are essential for a complete blood count test in blood diagnostics. Streams develop in the flow through the microchannel [
20]. In inertial microfluidics, the manipulation of particles is significantly influenced by the interaction between inertial lift forces and curvature-induced Dean drag [
21]. While previous studies have explored inertial focusing in both spiral and straight channels, many methods require sheath flows. COMSOL Multiphysics 6.3 is a software that is widely used to simulate continuous flow fields in microchannels without the presence of particles [
22]. It enables accurate modeling of fluid dynamics by considering factors such as channel geometry, fluid properties, and flow conditions. By varying the channel geometry, flow conditions, and particle properties, simulations can identify the optimal parameters for achieving the desired separation and focusing outcomes [
23]. Numerical modeling is important for understanding the underlying physics and assessing performance [
24]. PDMS devices are frequently used in research settings to fabricate prototypes and conduct initial testing, primarily due to their ease of production and affordability [
25].
This work presents a novel hook-shaped square cross section microchannel that utilizes controlled Dean vortices to create distinct equilibrium positions for erythrocyte and monocyte particles based on their sizes. This design facilitates efficient, sheathless separation through size-dependent inertial migration. The separation process is quantified using particle trajectory analysis and experimental imaging. This innovative design not only enhances sorting efficiency but also simplifies integration into lab-on-chip platforms for diagnostics and biomedical applications.
2. Numerical Solution
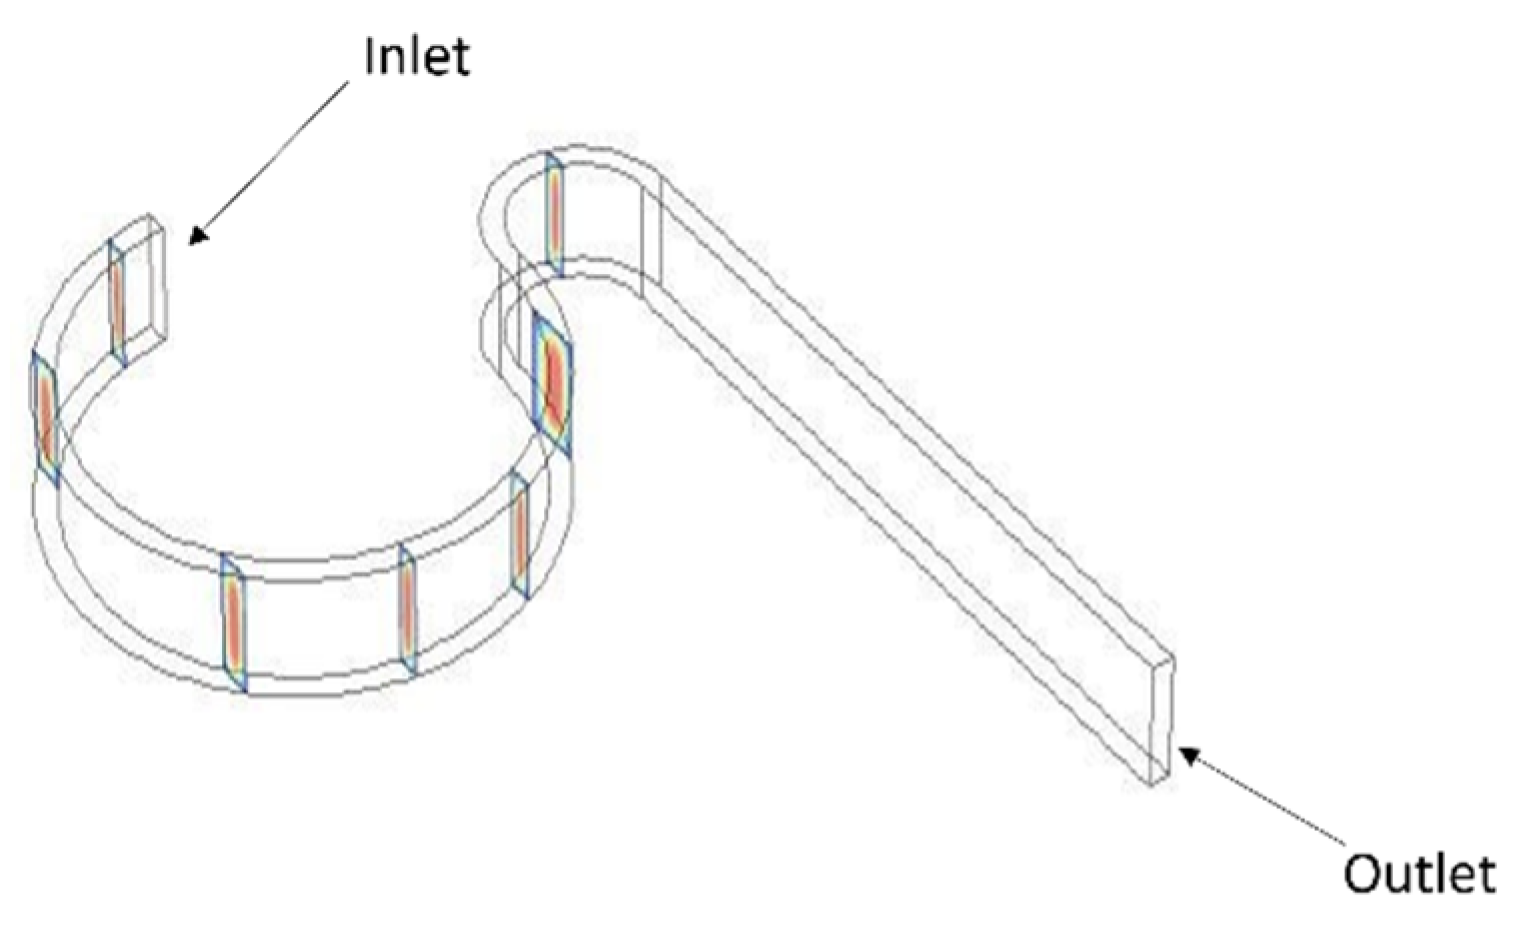
The computational simulations were conducted using the Finite Element Method (FEM) in COMSOL Multiphysics 6.3, with the microchannel geometry designed in CREO 3.0 as shown in
Figure 1. The simulation domain was defined for a laminar flow regime, which is appropriate for low-Reynolds-number conditions (Re < 1). A steady-state analysis was performed under the assumptions of incompressible, Newtonian fluid behavior, utilizing fluid properties similar to those of blood serum (density = 1025 kg/m
3, viscosity = 1.2 mPa·s). At the channel inlet, a fully developed laminar velocity profile was applied, with flow rates varying from 10 μL/min to 300 μL/min. The outlet boundary condition was set to a fixed pressure of 0 Pa, and no-slip boundary conditions were imposed on all channel walls. In the particle-tracing module, particles were introduced at the inlet with zero initial velocity, allowing them to accelerate naturally with the carrier fluid. The simulations analyzed the effects of hydrodynamic forces such as inertial lift and Dean drag on particle trajectories, facilitating a detailed examination of focusing behavior under varying flow and geometric conditions. The Navier–Stokes equation is used in the first module, and a Newtonian formulation is used in the second module.
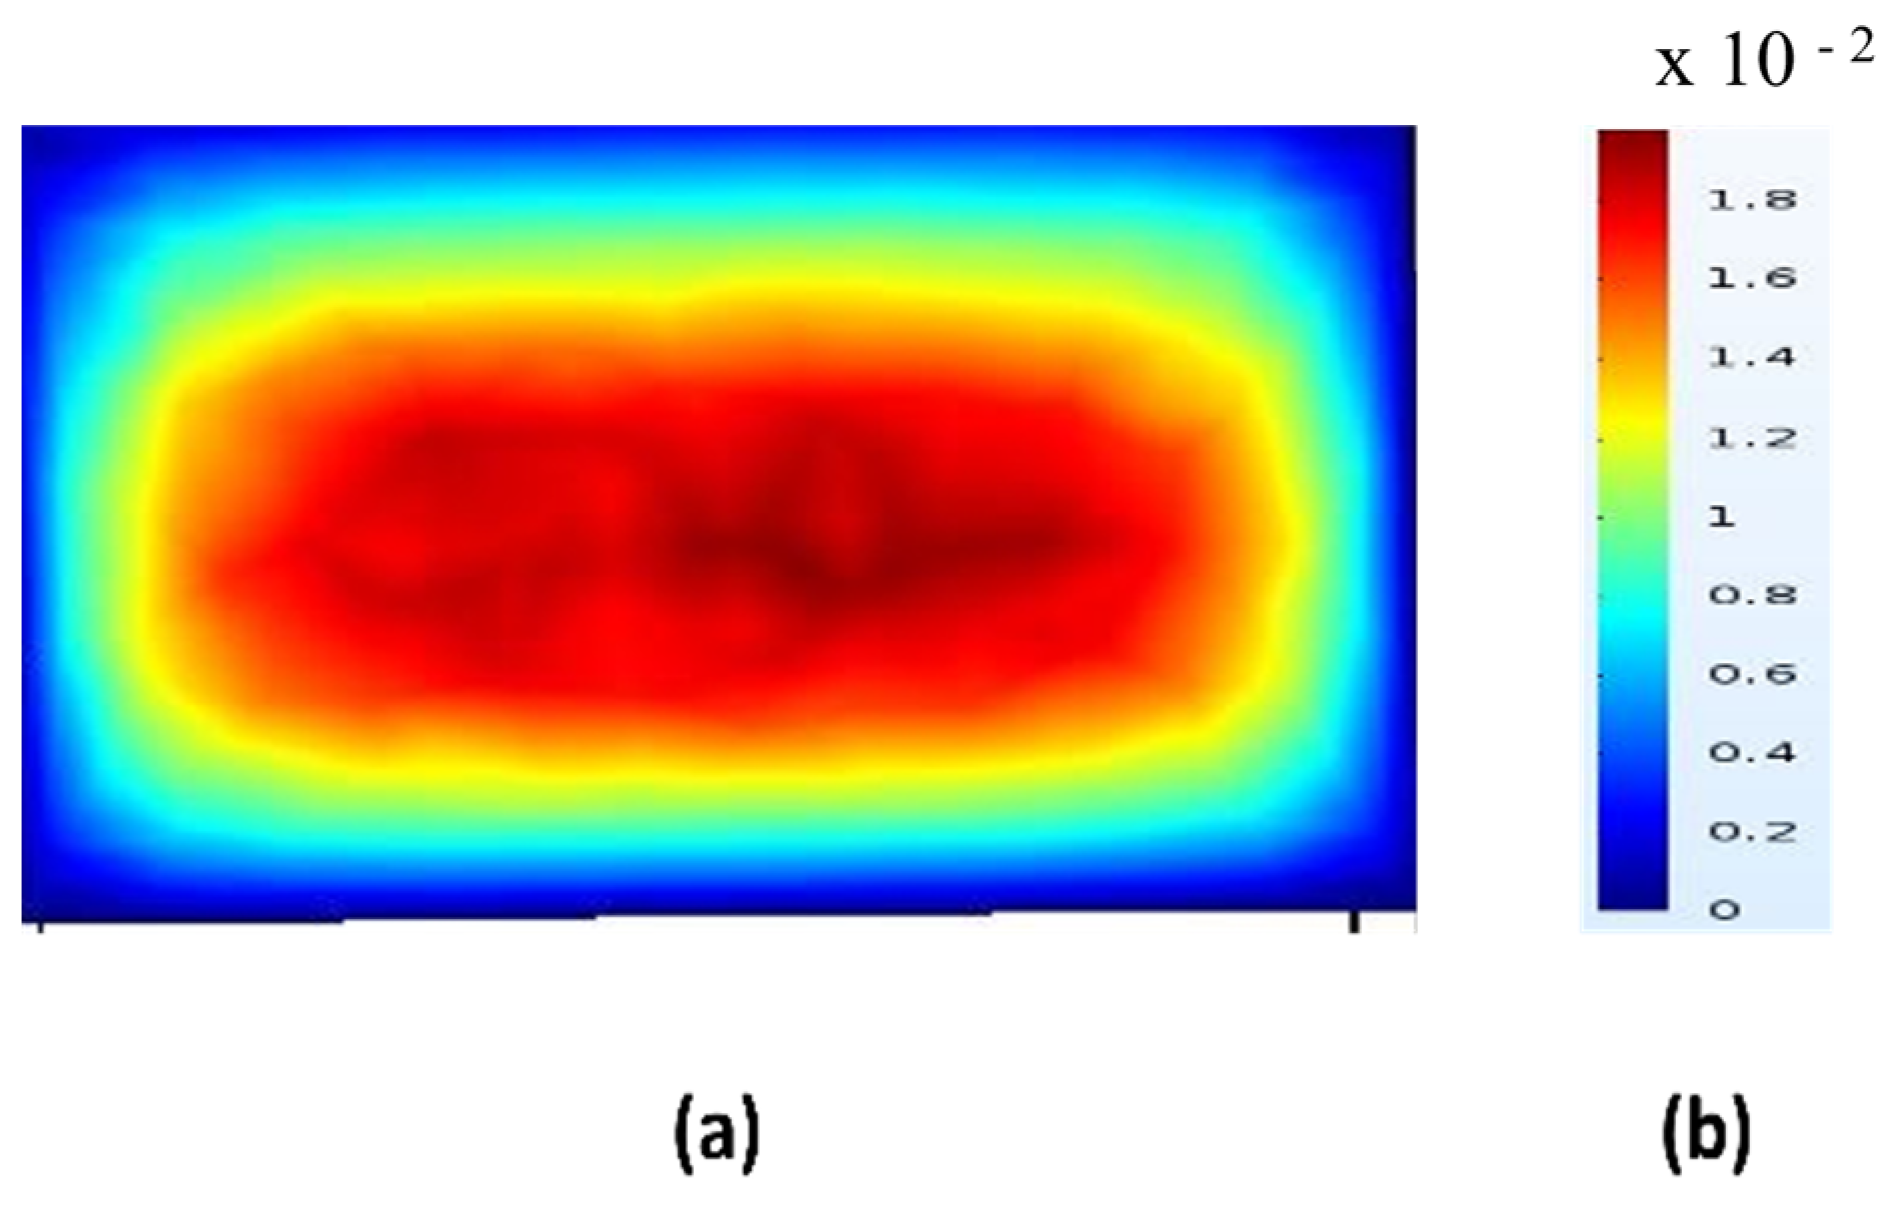
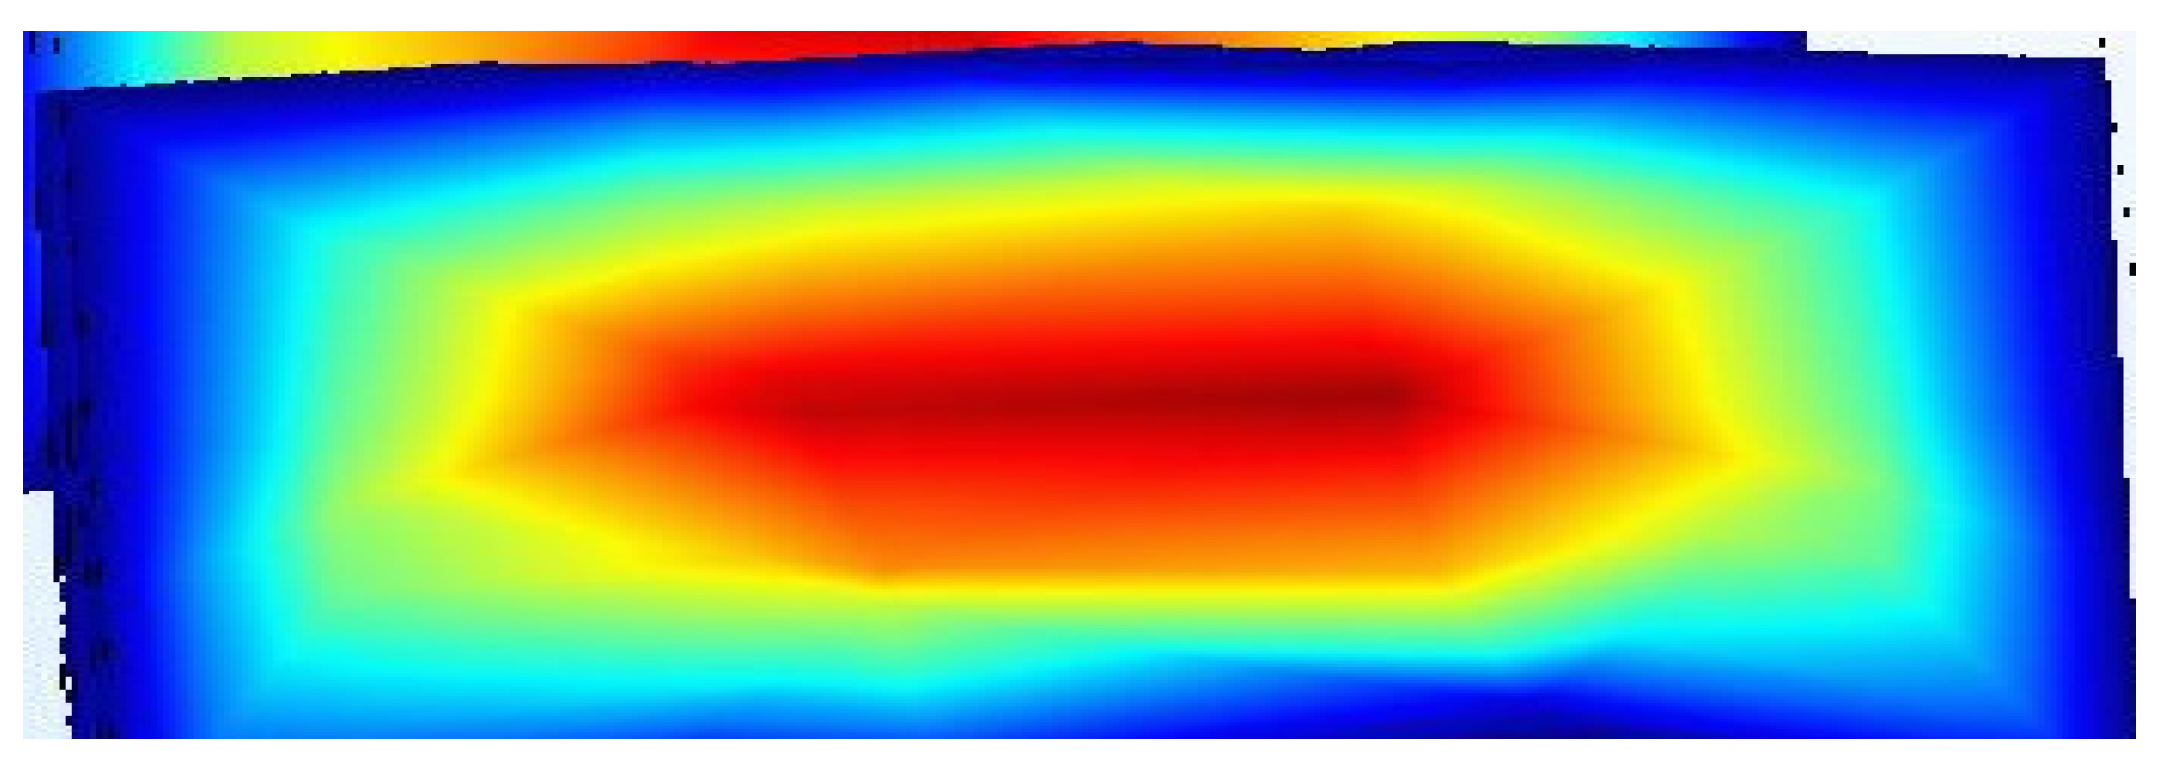
The velocity distribution shown in the colored square significantly influences the lateral migration and final equilibrium positions of particles within the microchannel. In inertial microfluidics, particles experience lift forces due to velocity gradients in the flow, specifically shear-induced and wall-induced lift forces. The red central region of the figure represents areas of higher velocity flow, typically found at the core of the channel, while the blue zones near the walls indicate lower velocities. This velocity gradient generates shear across the channel width, causing particles to migrate away from high-shear (near-wall) regions toward specific equilibrium positions that vary based on their size and shape. In curved microchannels, Dean vortices and secondary flows interact with these lift forces. The combination of these forces results in particles concentrating at well-defined, positions in curved geometries, which is crucial for sorting and alignment applications. Thus, the velocity profile illustrated in this square not only confirms the flow behaviour necessary for inertial focusing but also clarifies the mechanisms driving the consistent movement of particles toward predictable equilibrium positions in the microchannel.
3. Characterization
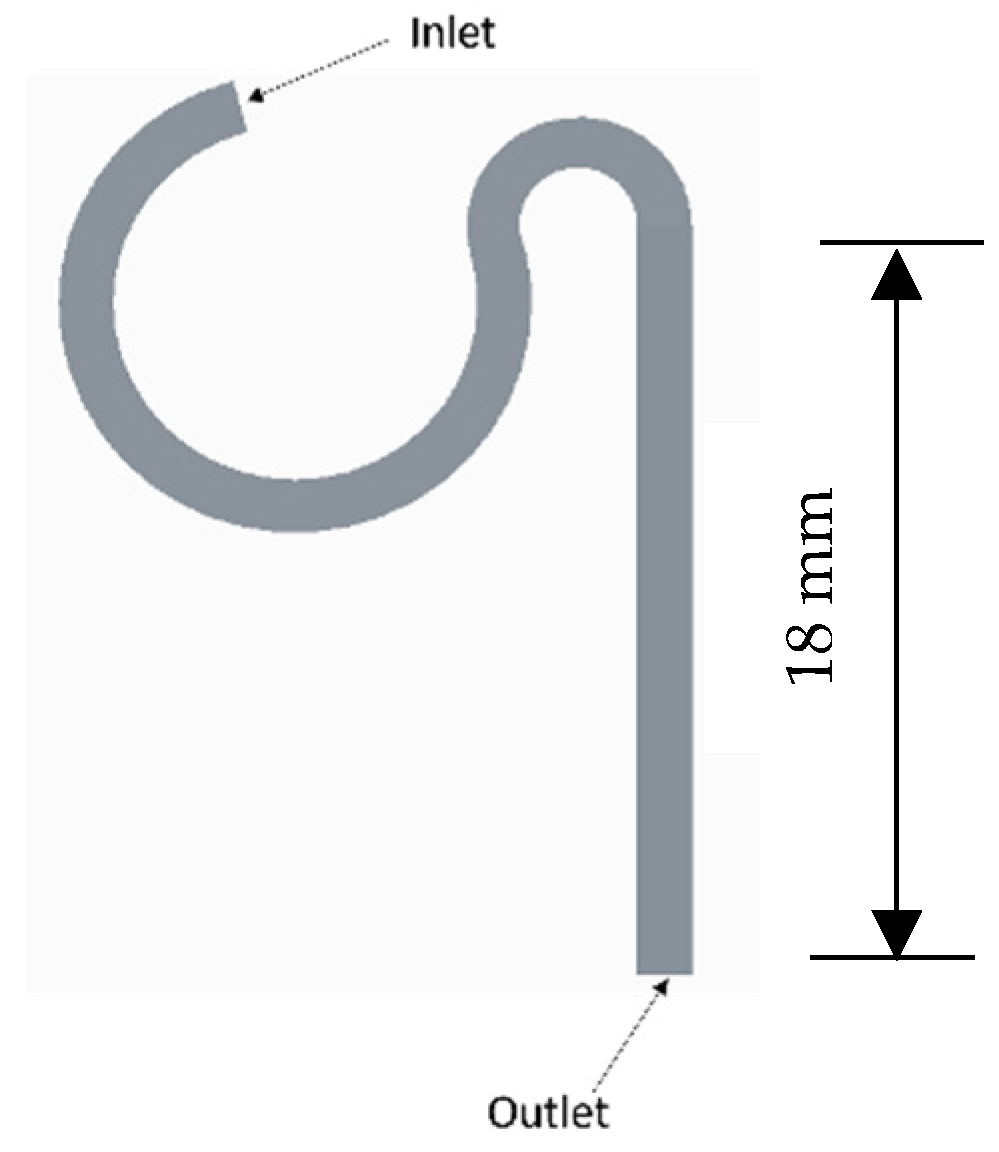
During the characterization phase, the microchannel’s geometry was systematically refined to optimize particle separation while minimizing its dimensions. Initially, the channel width was reduced in increments of 50 μm, with the flow rate held constant. After determining the minimum effective sorting width, the height was adjusted to maintain an aspect ratio close to 1. For each geometric variation, simulations were conducted to assess separation efficiency by measuring the lateral distance between particle streams. These simulations helped identify the optimal channel dimensions that achieved both the shortest length and maximum throughput without sacrificing sorting performance. The final channel design as shown in
Figure 3 was tested at flow rates ranging from 10 μL/min to 300 μL/min to assess particle focusing stability and determine the critical flow rate for optimal performance.
4. Results and Discussion
The flow rate and hydraulic diameter, D
h, are key parameters that govern many other parameters of the channel.
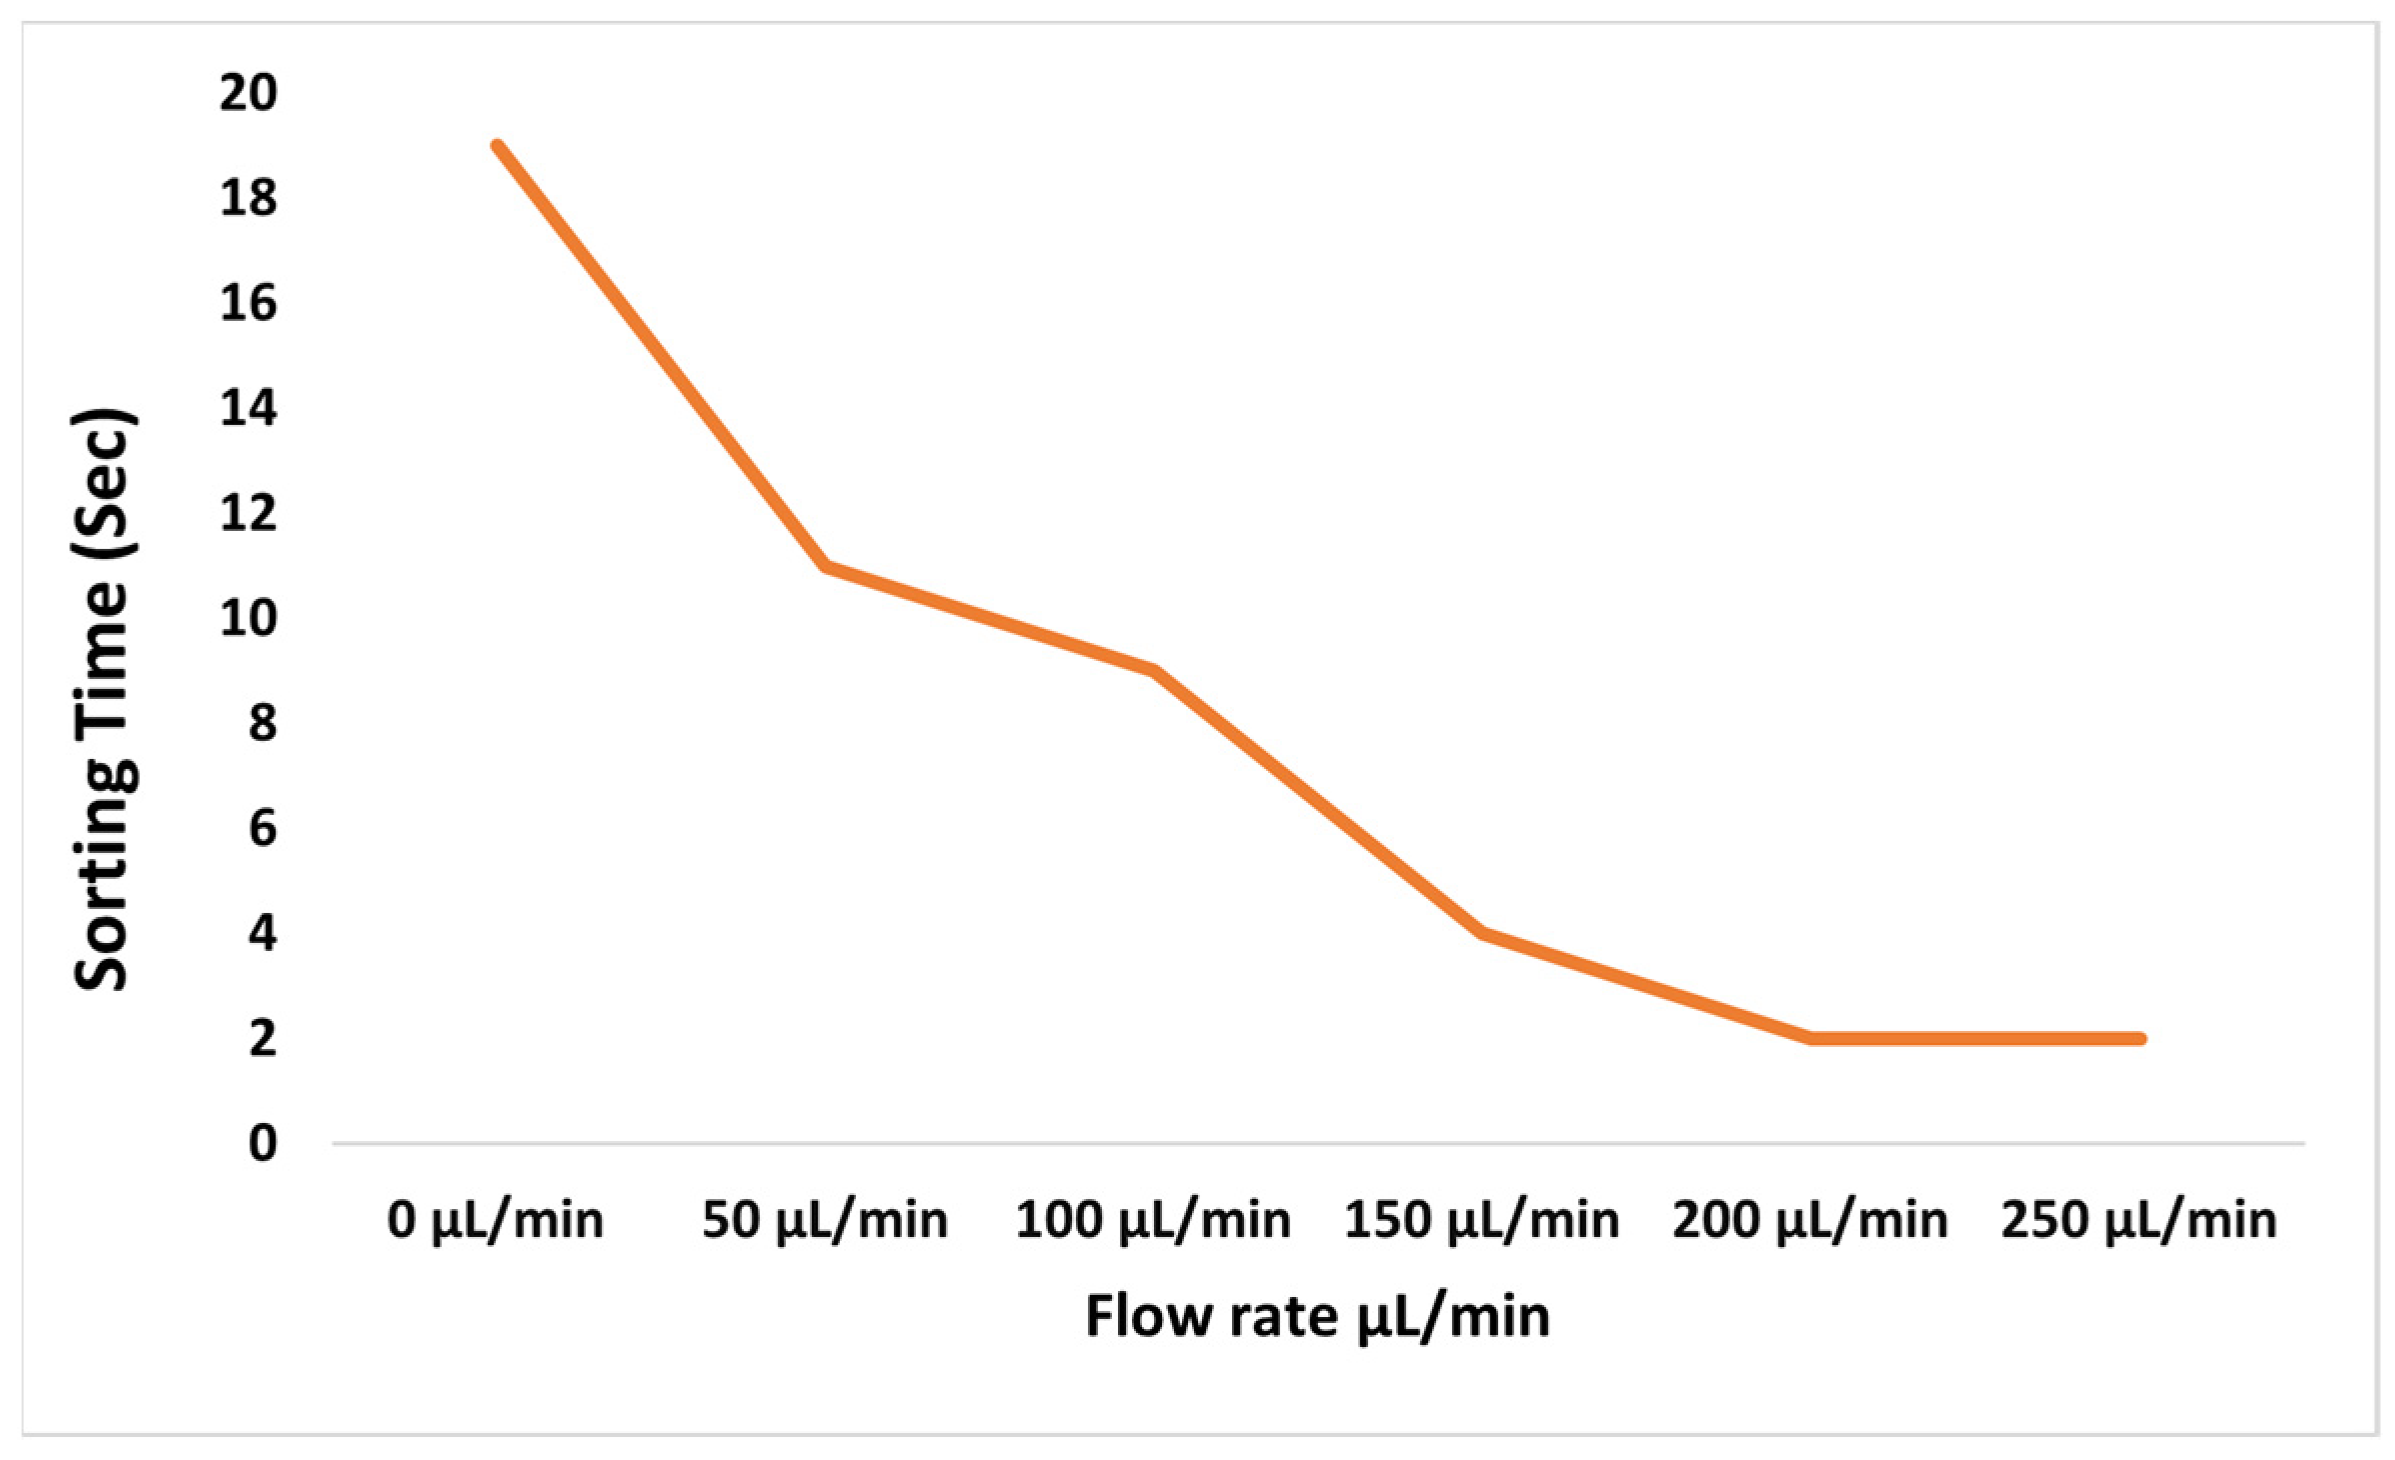
Here, Q is the flow rate, H is the height of the channel, W is the width of the channel, Re is the Reynold’s number, and De is the Dean’s number. The flow rate was varied in the final design to determine the maximum and minimum range of the flow rate for which sorting occurs. It was observed that as the flow rate increased, the particles were sorted more quickly.
This occurred because of the difference in the velocities at different flow rates, which further affected the governing forces.
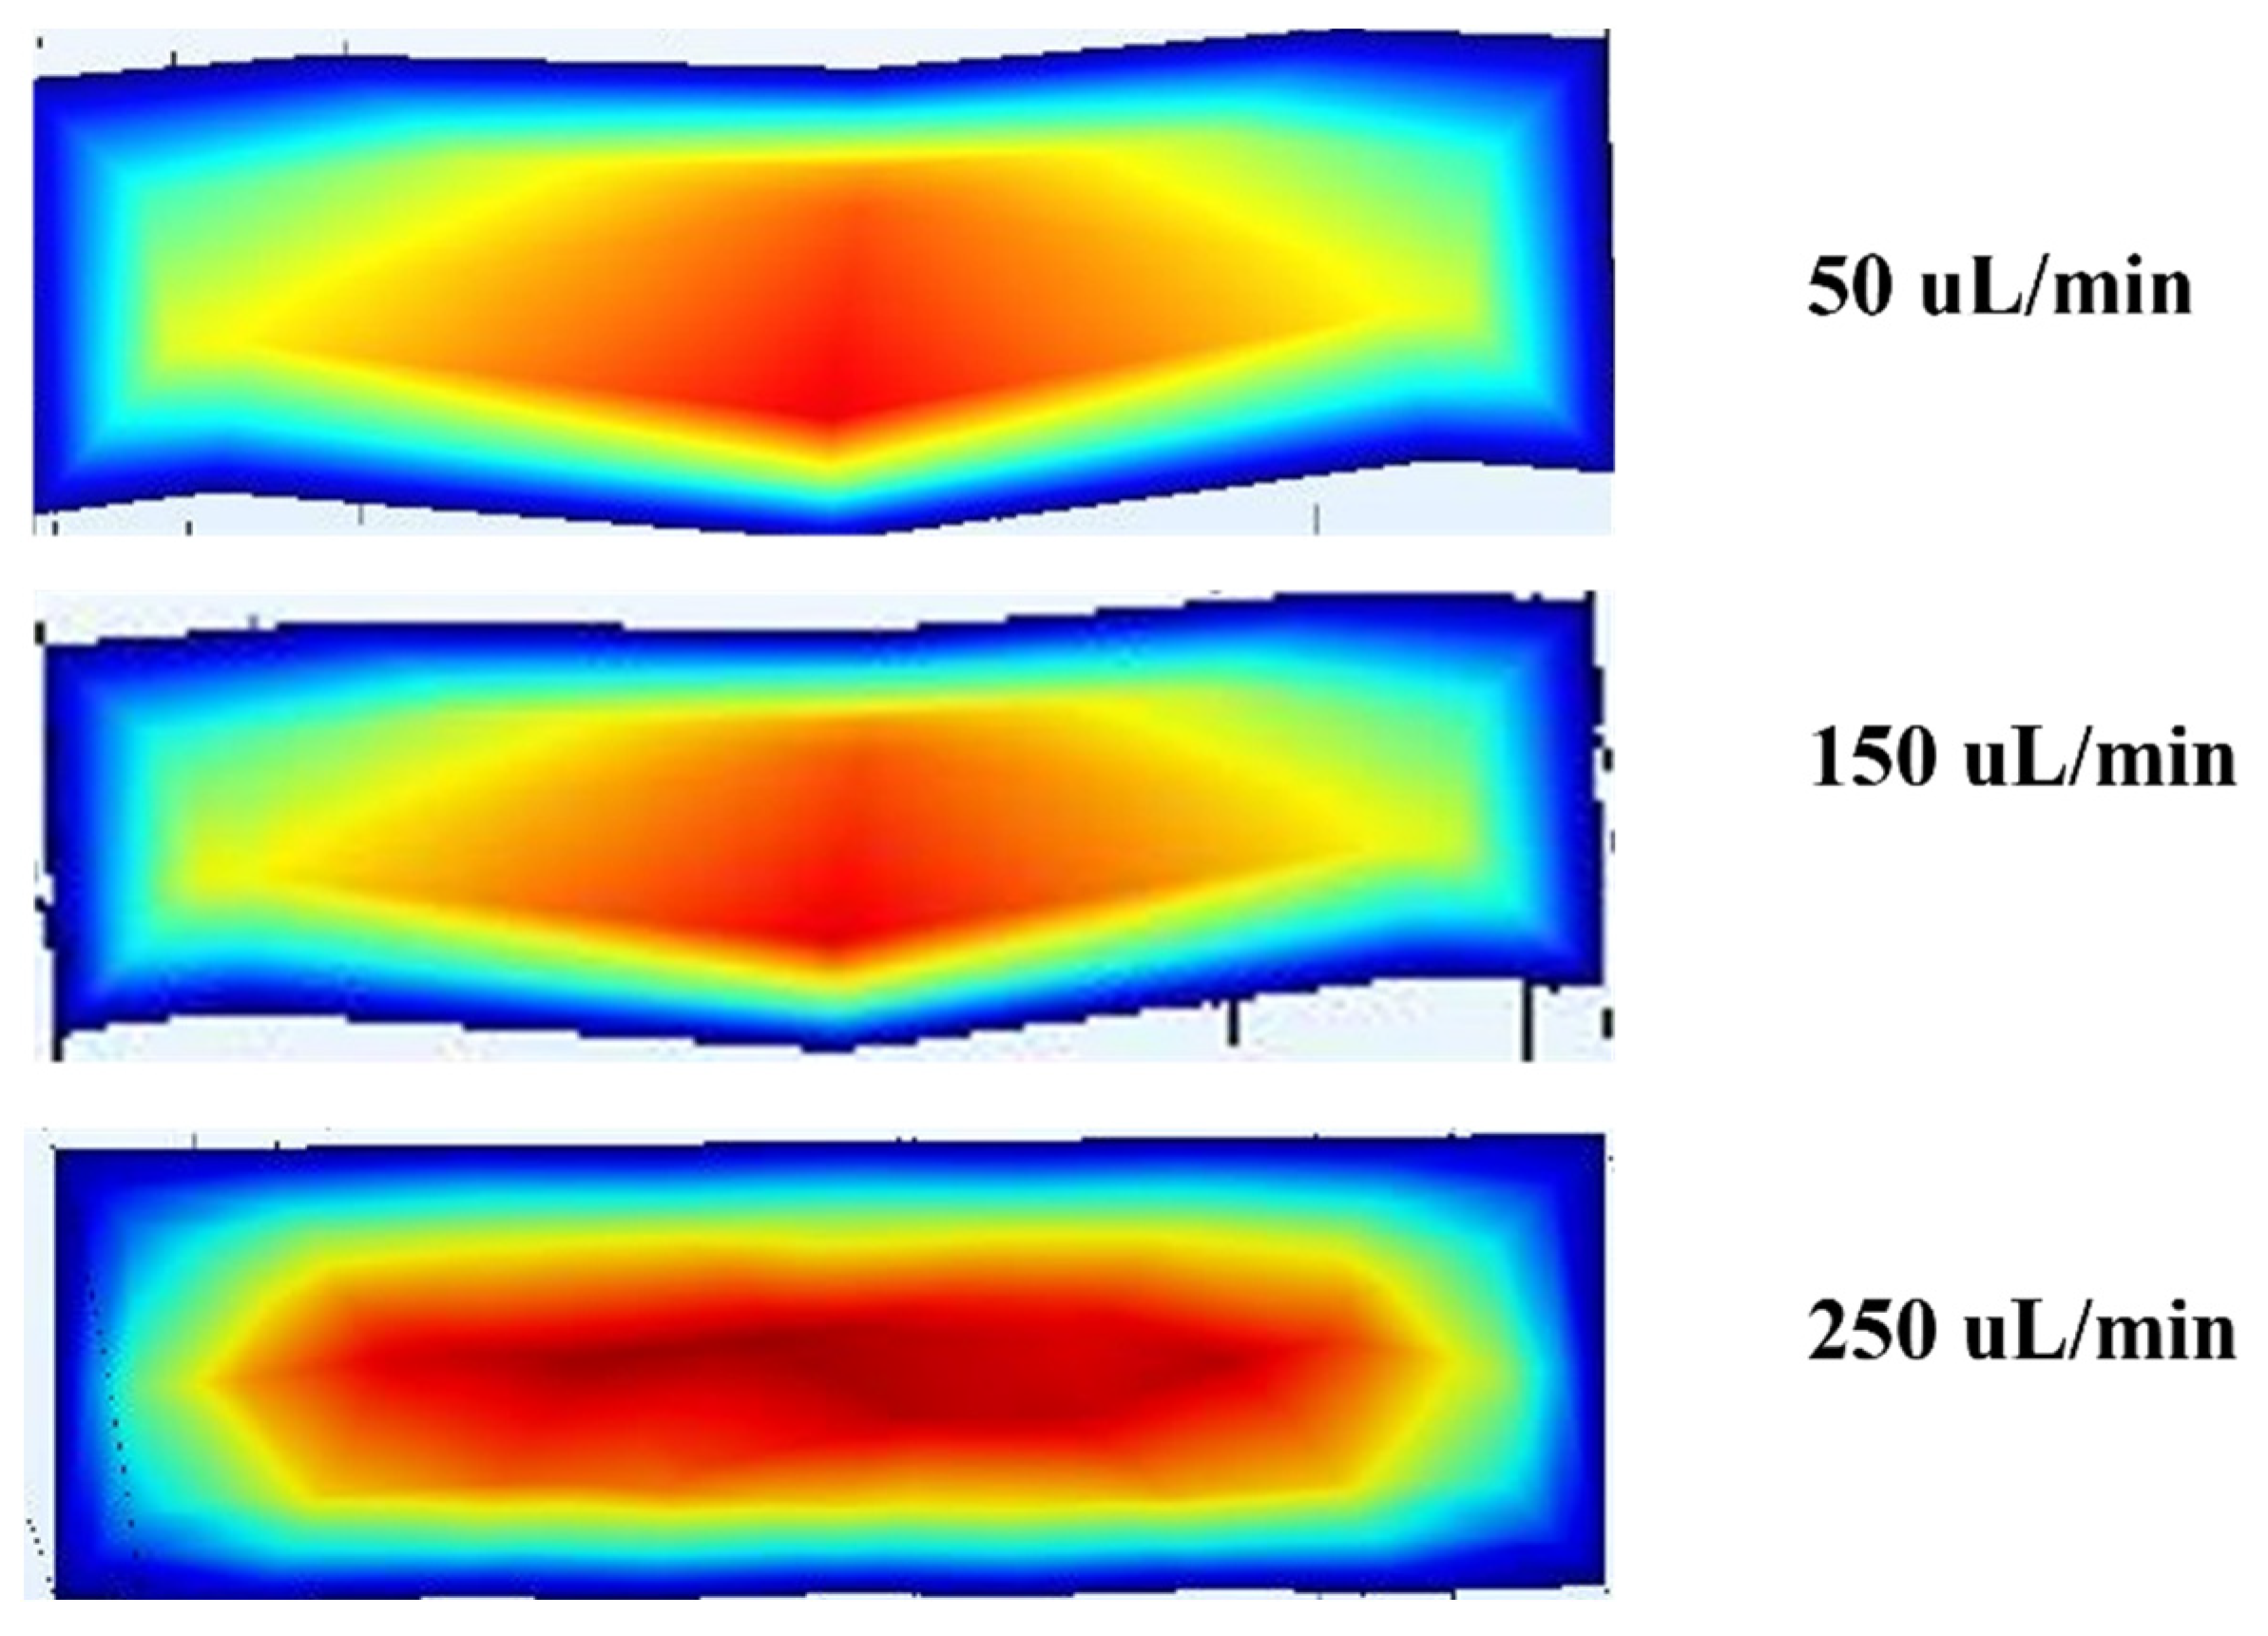
Figure 4 shows the differences in velocity profiles at different flow rates; there is an increase in velocity of 10.6% between 50 and 150 μL/min and a 31.41% increase from 150 to 250 μL/min as shown in
Figure 5. The overall change was 42.01% for a fixed design.
The simulation results show a well-developed laminar flow, with the highest velocity observed at the channel centre (shown in red) and a gradual decrease toward the walls (shaded blue). This parabolic velocity distribution aligns with the expected behaviour in inertial microfluidic regimes, where the no-slip boundary condition at the walls causes fluid velocity to approach nearly zero. The resulting velocity gradient is significant, as it generates shear-induced lift forces that contribute to the lateral migration of particles toward equilibrium positions.
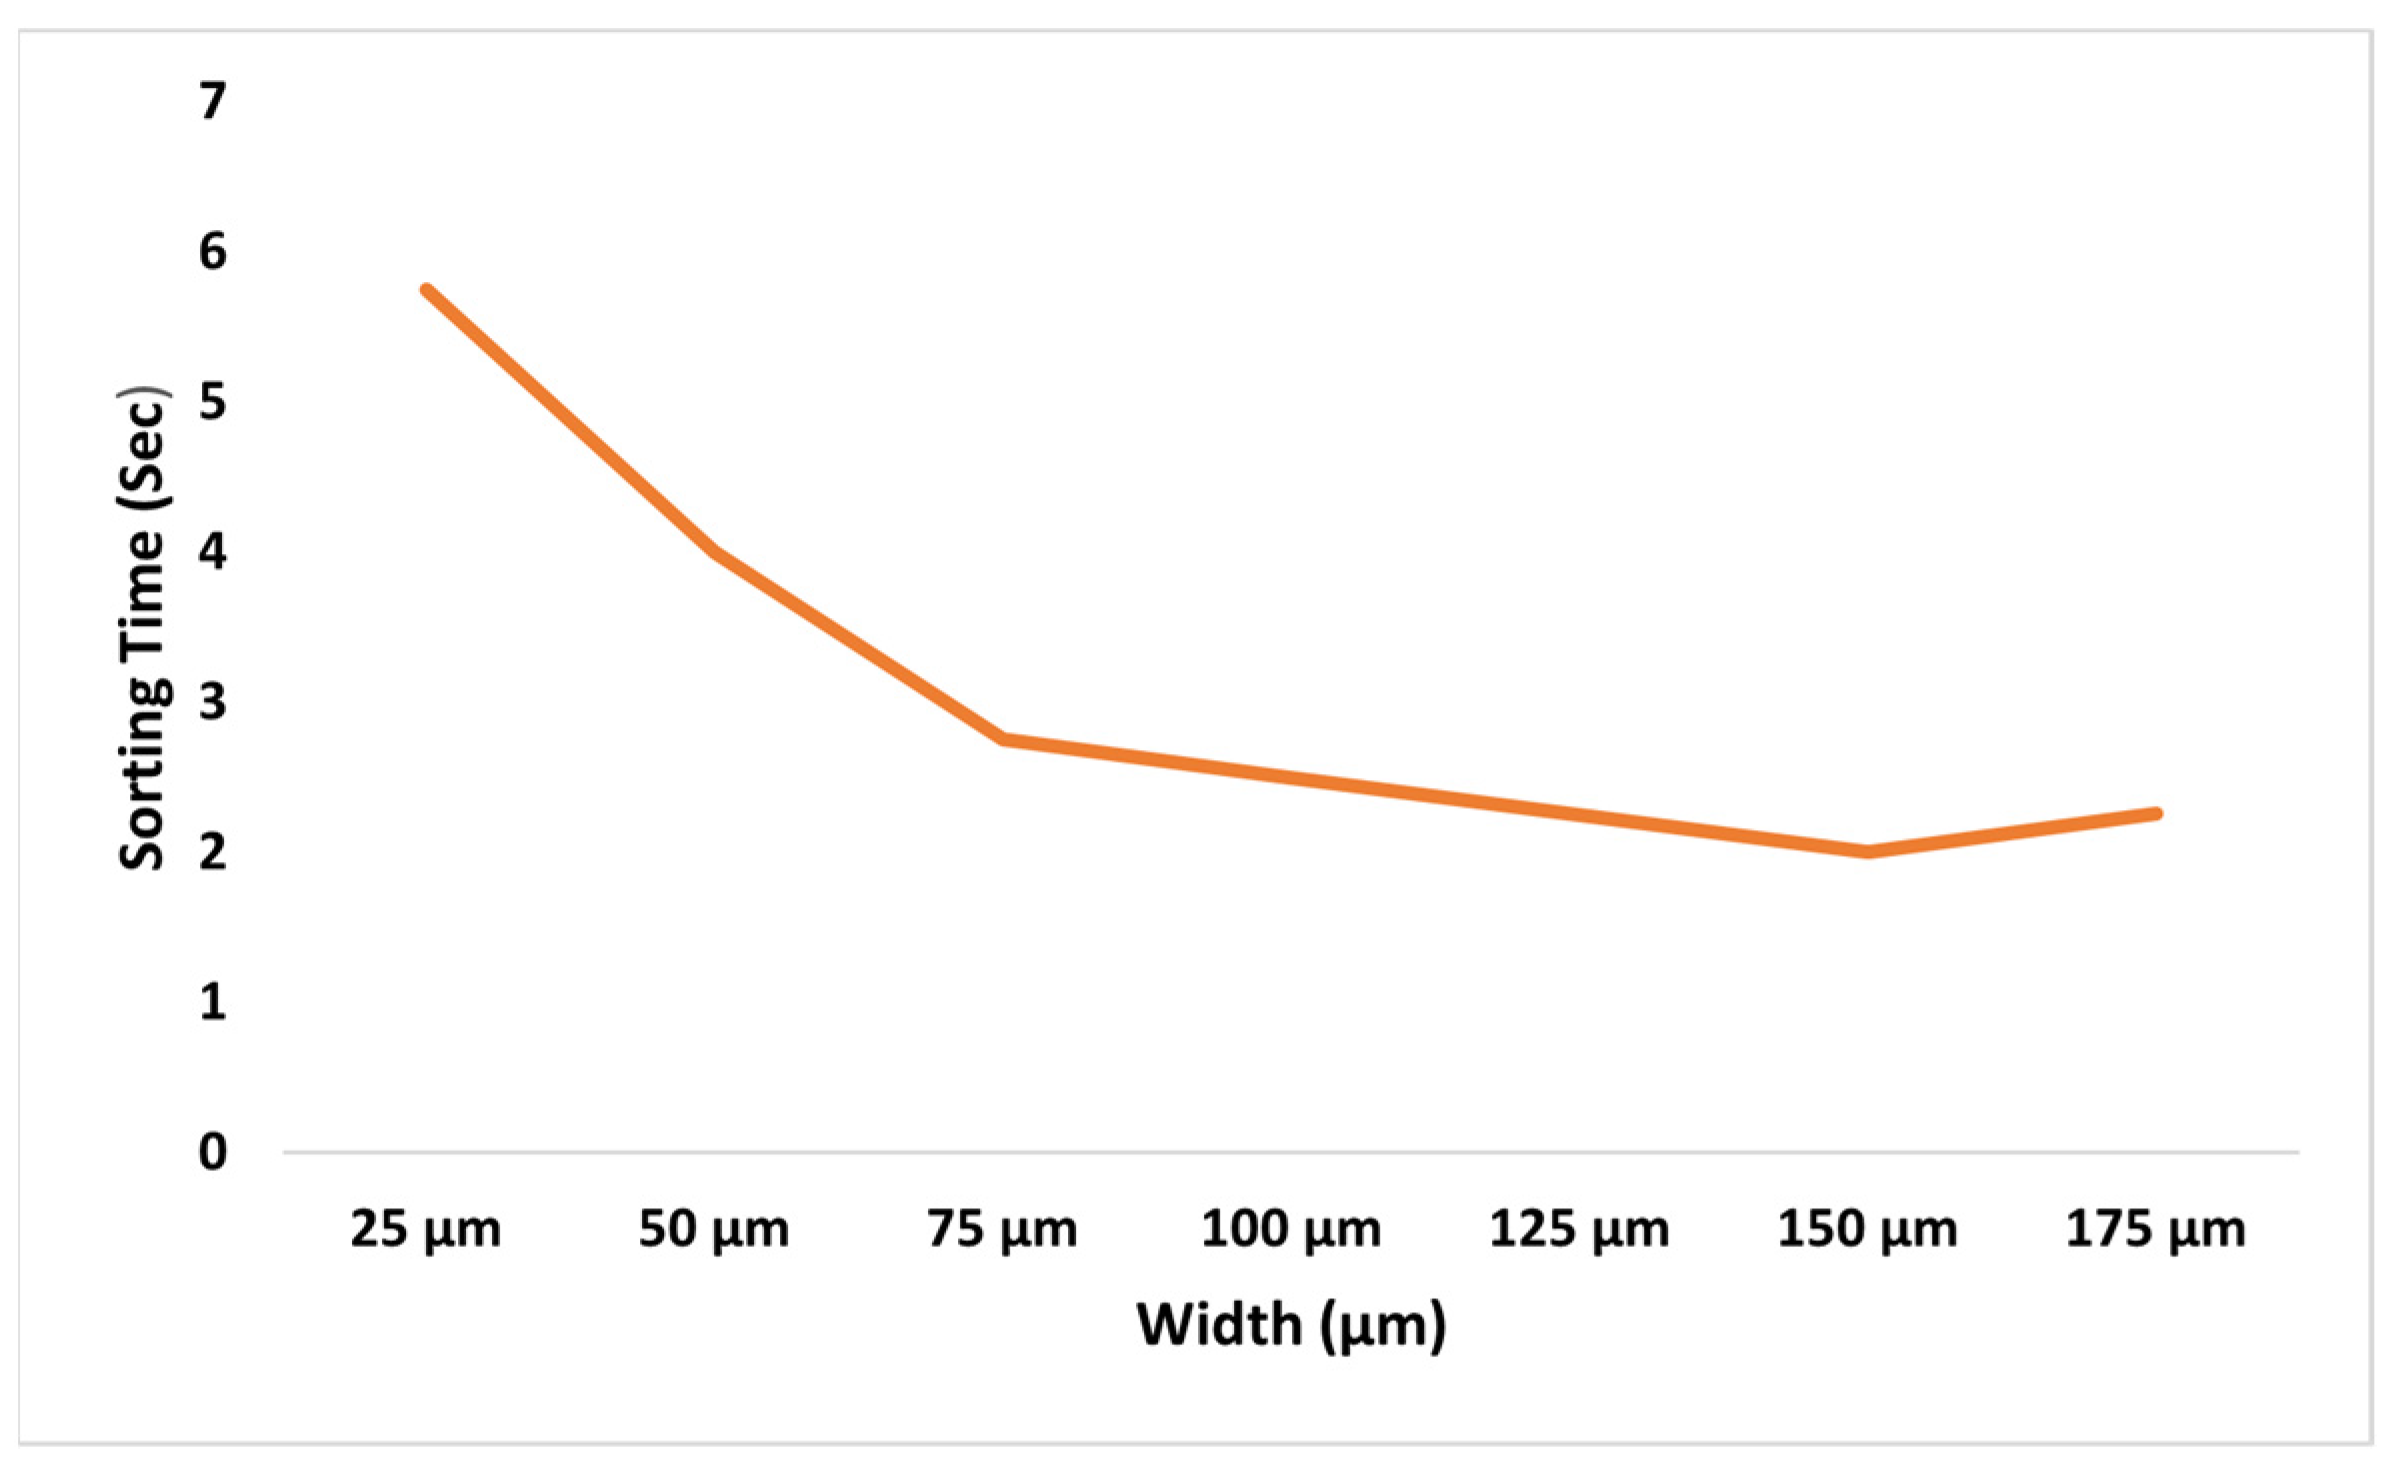
In our first attempt to reduce channel width, particles equilibrated themselves in wider channels faster than in narrow channels. In other words, particles migrated toward the wall earlier in the 150 μm wide channel than in the 250 μm wide channel as shown in
Figure 6.
When particles are observed in channels of different widths at a constant flow rate, certain differences in the velocity field at the center of the channel will arise.
In
Figure 7, the streamline pattern clearly shows the fluid flow path and potential trajectories for suspended particles. The velocity field, represented by a colour gradient, reveals increased shear near the centre and walls, with red areas indicating peak velocities. As the flow rate increases, the inertial forces acting on the particles become more pronounced, accelerating their lateral migration. This figure reinforces the experimental observation that higher flow rates result in sharper particle focusing, which is essential for applications like cell sorting and counting.
In
Figure 8, the simulation shows two counter-rotating vortices created by the curvature of the channel and the centrifugal force acting on the fluid. In this cross-sectional view, the color scale represents the velocity magnitude, showing higher velocities near the inner wall and lower velocities near the outer wall. These secondary flows, known as Dean vortices, apply a cross-sectional drag force on the particles, altering their trajectories and shifting the equilibrium focusing positions. The combined effects of Dean drag and inertial lift forces improve particle separation efficiency, which is a significant advantage in curved channel designs used for size-based sorting in microfluidic systems.
The estimated difference in velocity between 150 μm and 250 μm was 3.74% as shown in
Figure 7 and
Figure 8. Increasing the width increased the cross-sectional area and hydraulic diameter. According to eq no. 4, increasing the hydraulic diameter caused an increase in the Dean number. A larger Dean number indicates a greater focus on particles until a critical value is reached.
When particles are rotating in Dean vortices, their velocity is referred to as the Dean velocity, U
Dean.
According to Equations (5) and (6), as De increases, UDean and FD both increase. A greater magnitude of FD causes particles to rotate more and easily settle at a critical value. Hence, particles moving in wider channels tend to have a greater hydraulic diameter and, therefore, more De; consequently, particles take less time to equilibrate in wider channels. The wider the channel, the shorter the sorting time.
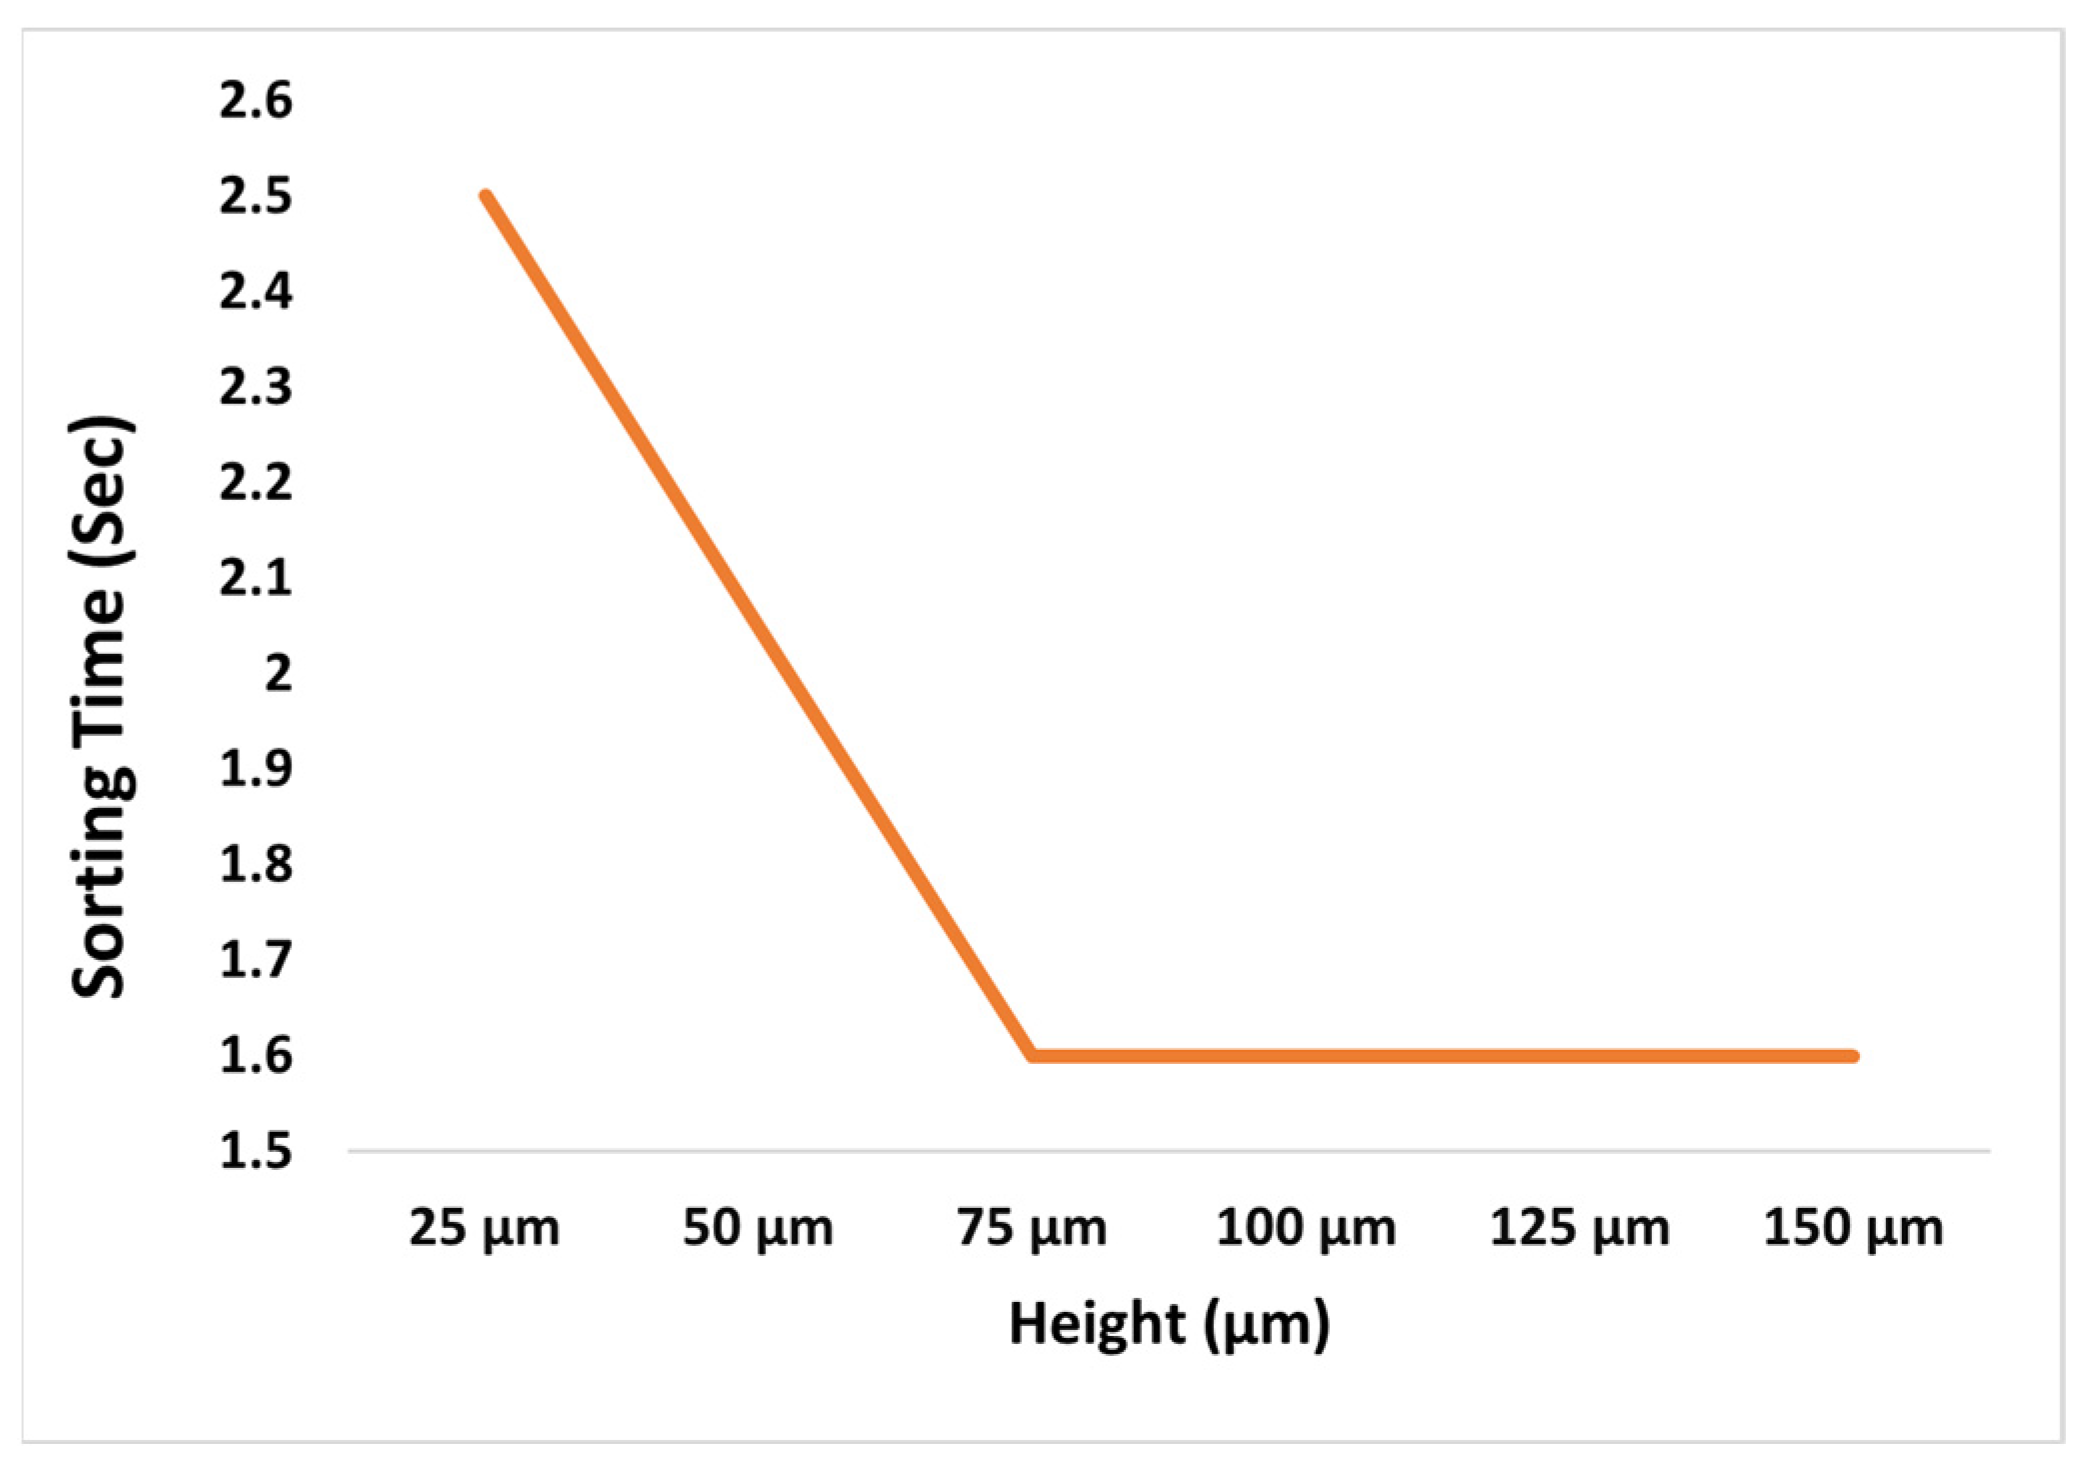
Height is not a critical dimension, which means that the sorting quality does not change significantly as the height changes as shown in
Figure 9. When simulations were performed above the final height, particles took the same amount of time to sort.
As discussed above, the flow rate is a major parameter that affects other major parameters, so when the other affected major parameters (Re and De) are plotted against the flow rate, both show an ascending effect. The lines cross each other at a certain point. At this point, the value of De is called the critical Dean number. The particles are best sorted at this number, i.e., this is the point at which the distance between the large and small particle streams is maximized). The critical Dean number of a specific channel changes with the flow rate, provided that Re and Dh are fixed.
Figure 10 shows that both lines bisect each other near 150 μL/min. The values are as follows: De
critical = 0.375, Re
critical = 0.073, and Q
critical = 150 μL/min.
The distance between the streams of particles of 8 μm and 20 μm quantifies cell sorting. A greater distance between particles indicates better sorting; a smaller distance between particles indicates a lower mixing probability. When the ratio of distance between particles and total width was taken at different flow rates, the highest ratio was at 150 μL/min as shown in
Table 1.
Again, these data show that where Re and De bisect each other, when plotted against Q, that value of De is a critical value because above this flow rate and Dean number, particles start to mix with each other. When the increase in De is too great, the particles rotate too much, and they mix with each other instead of separating. To assess the channel’s ability to separate particles other than those that are in the range of 8 μm to 20 μm in size, particles with a 2:1 size ratio were injected into the channel at the critical flow rate. The ratio of the distance between the streams to the channel’s total width was then calculated as shown in
Table 2.
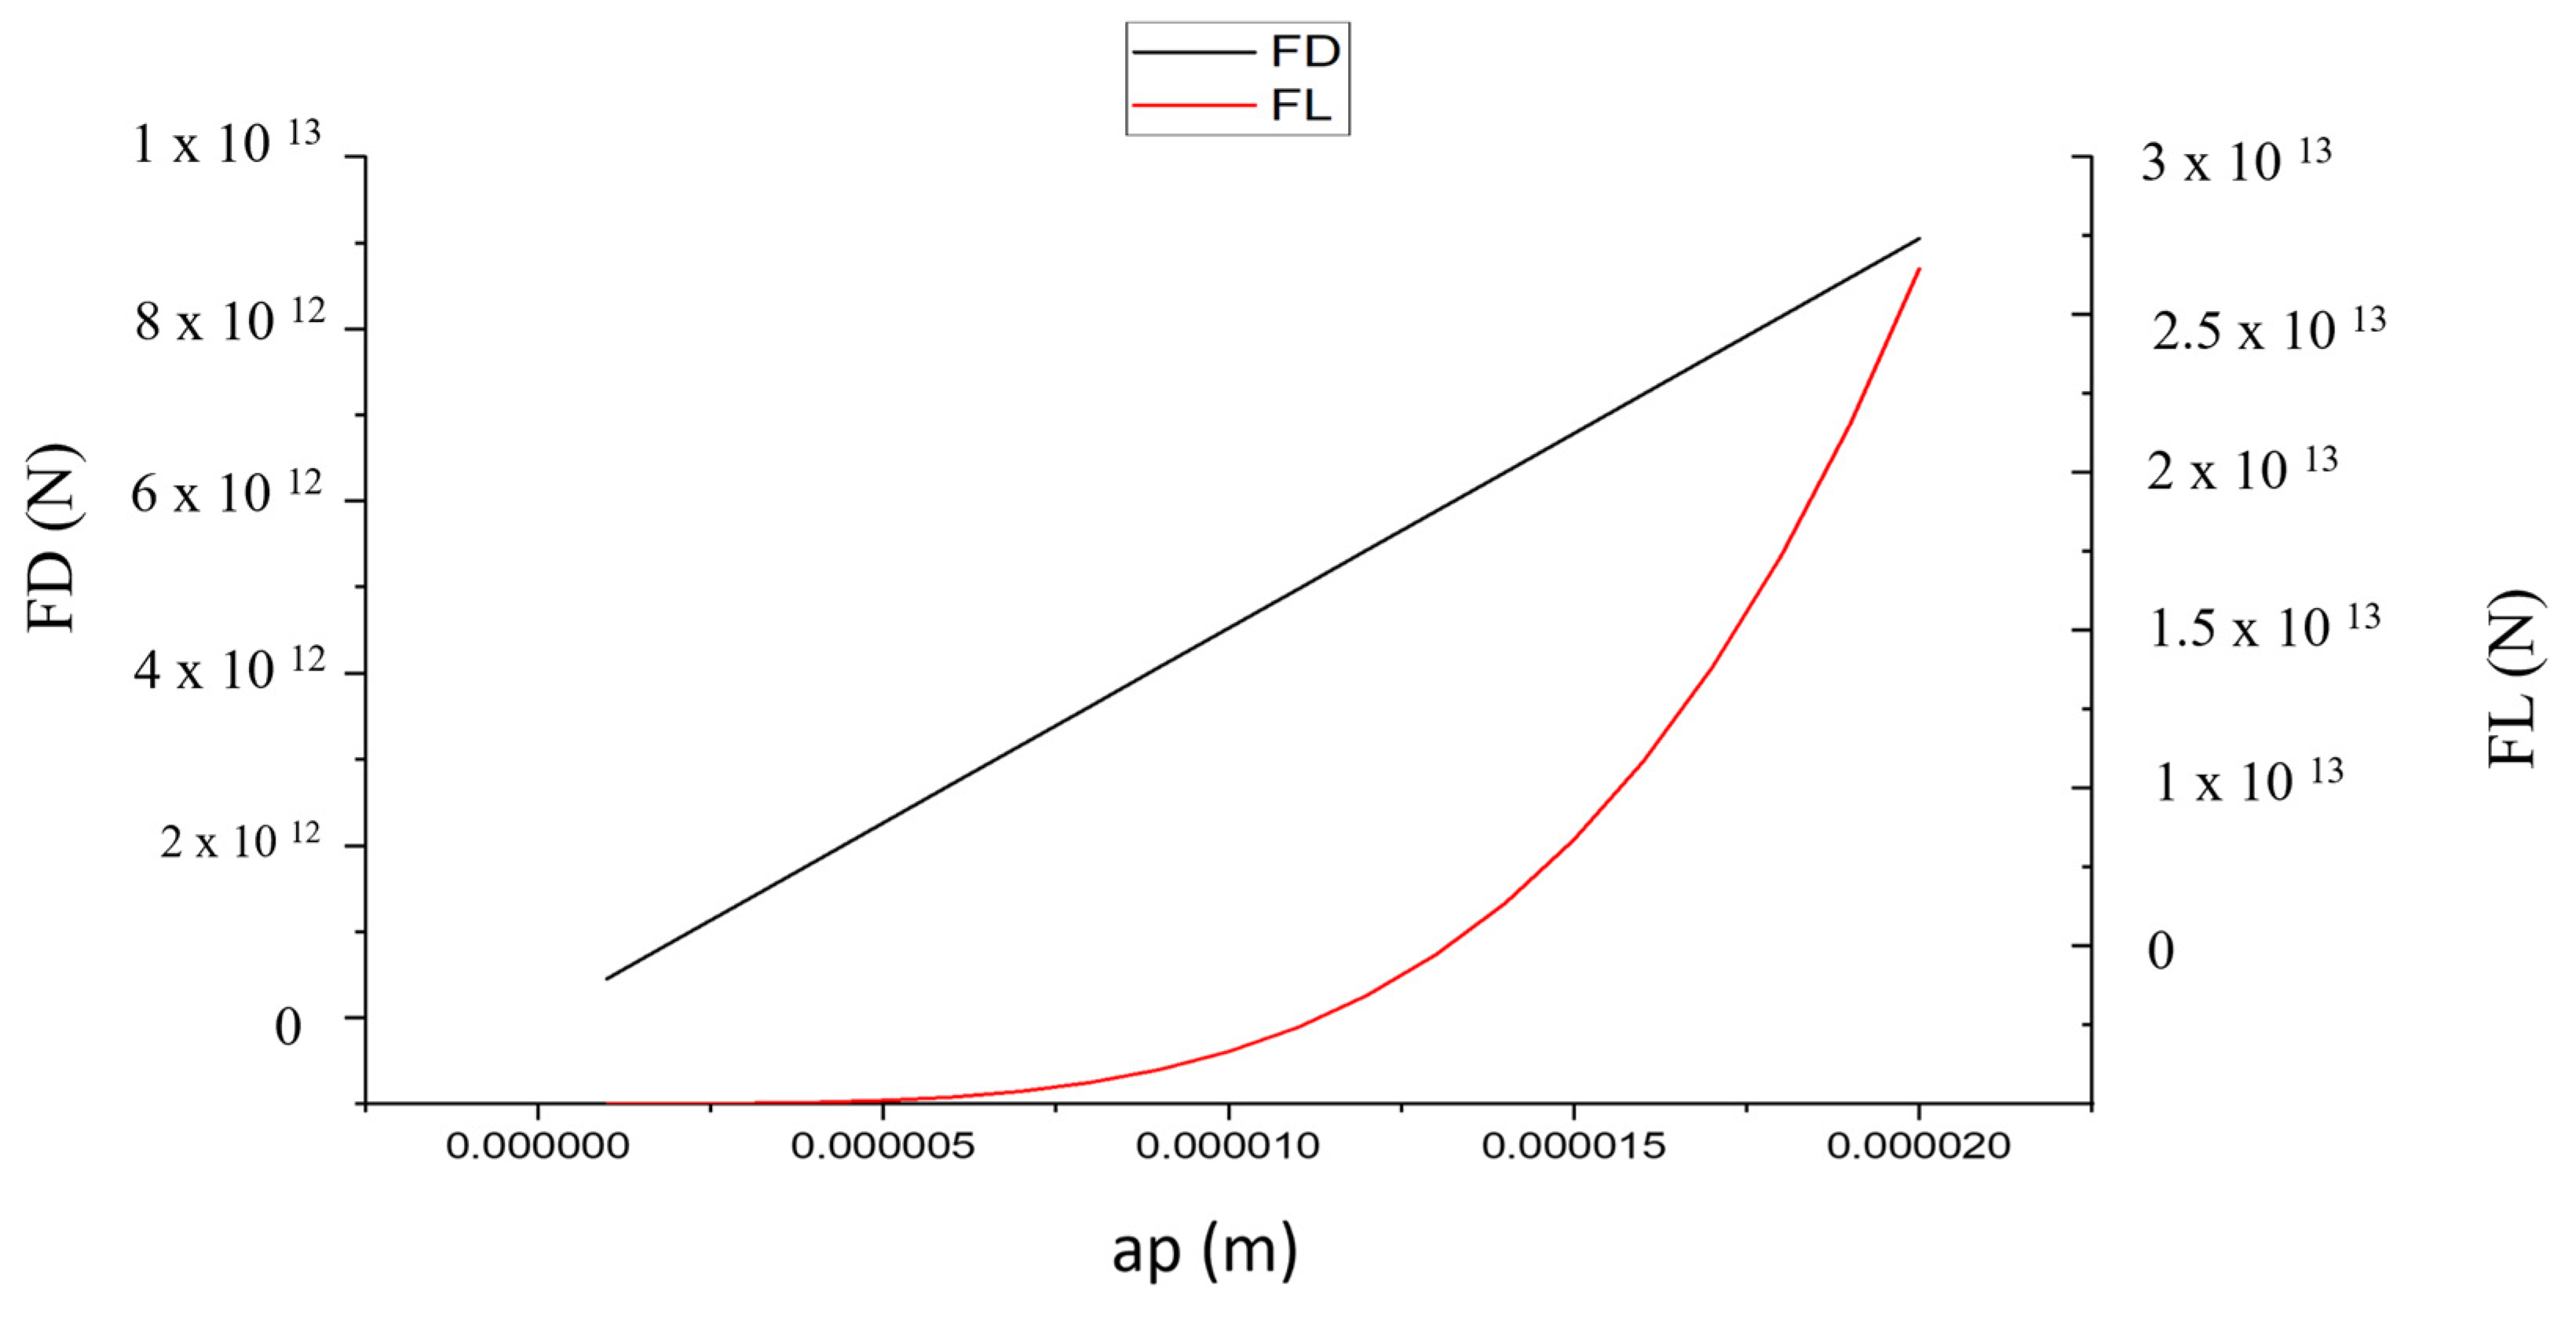
Figure 11 illustrates that as the particle size increases, F
L increases rapidly and F
D values increase rapidly. F
L increases with a
p4, while F
D increases with a
p.
Here, ρ represents density, G denotes the shear rate, and CL stands for the lift coefficient.
5. Experimental Analysis
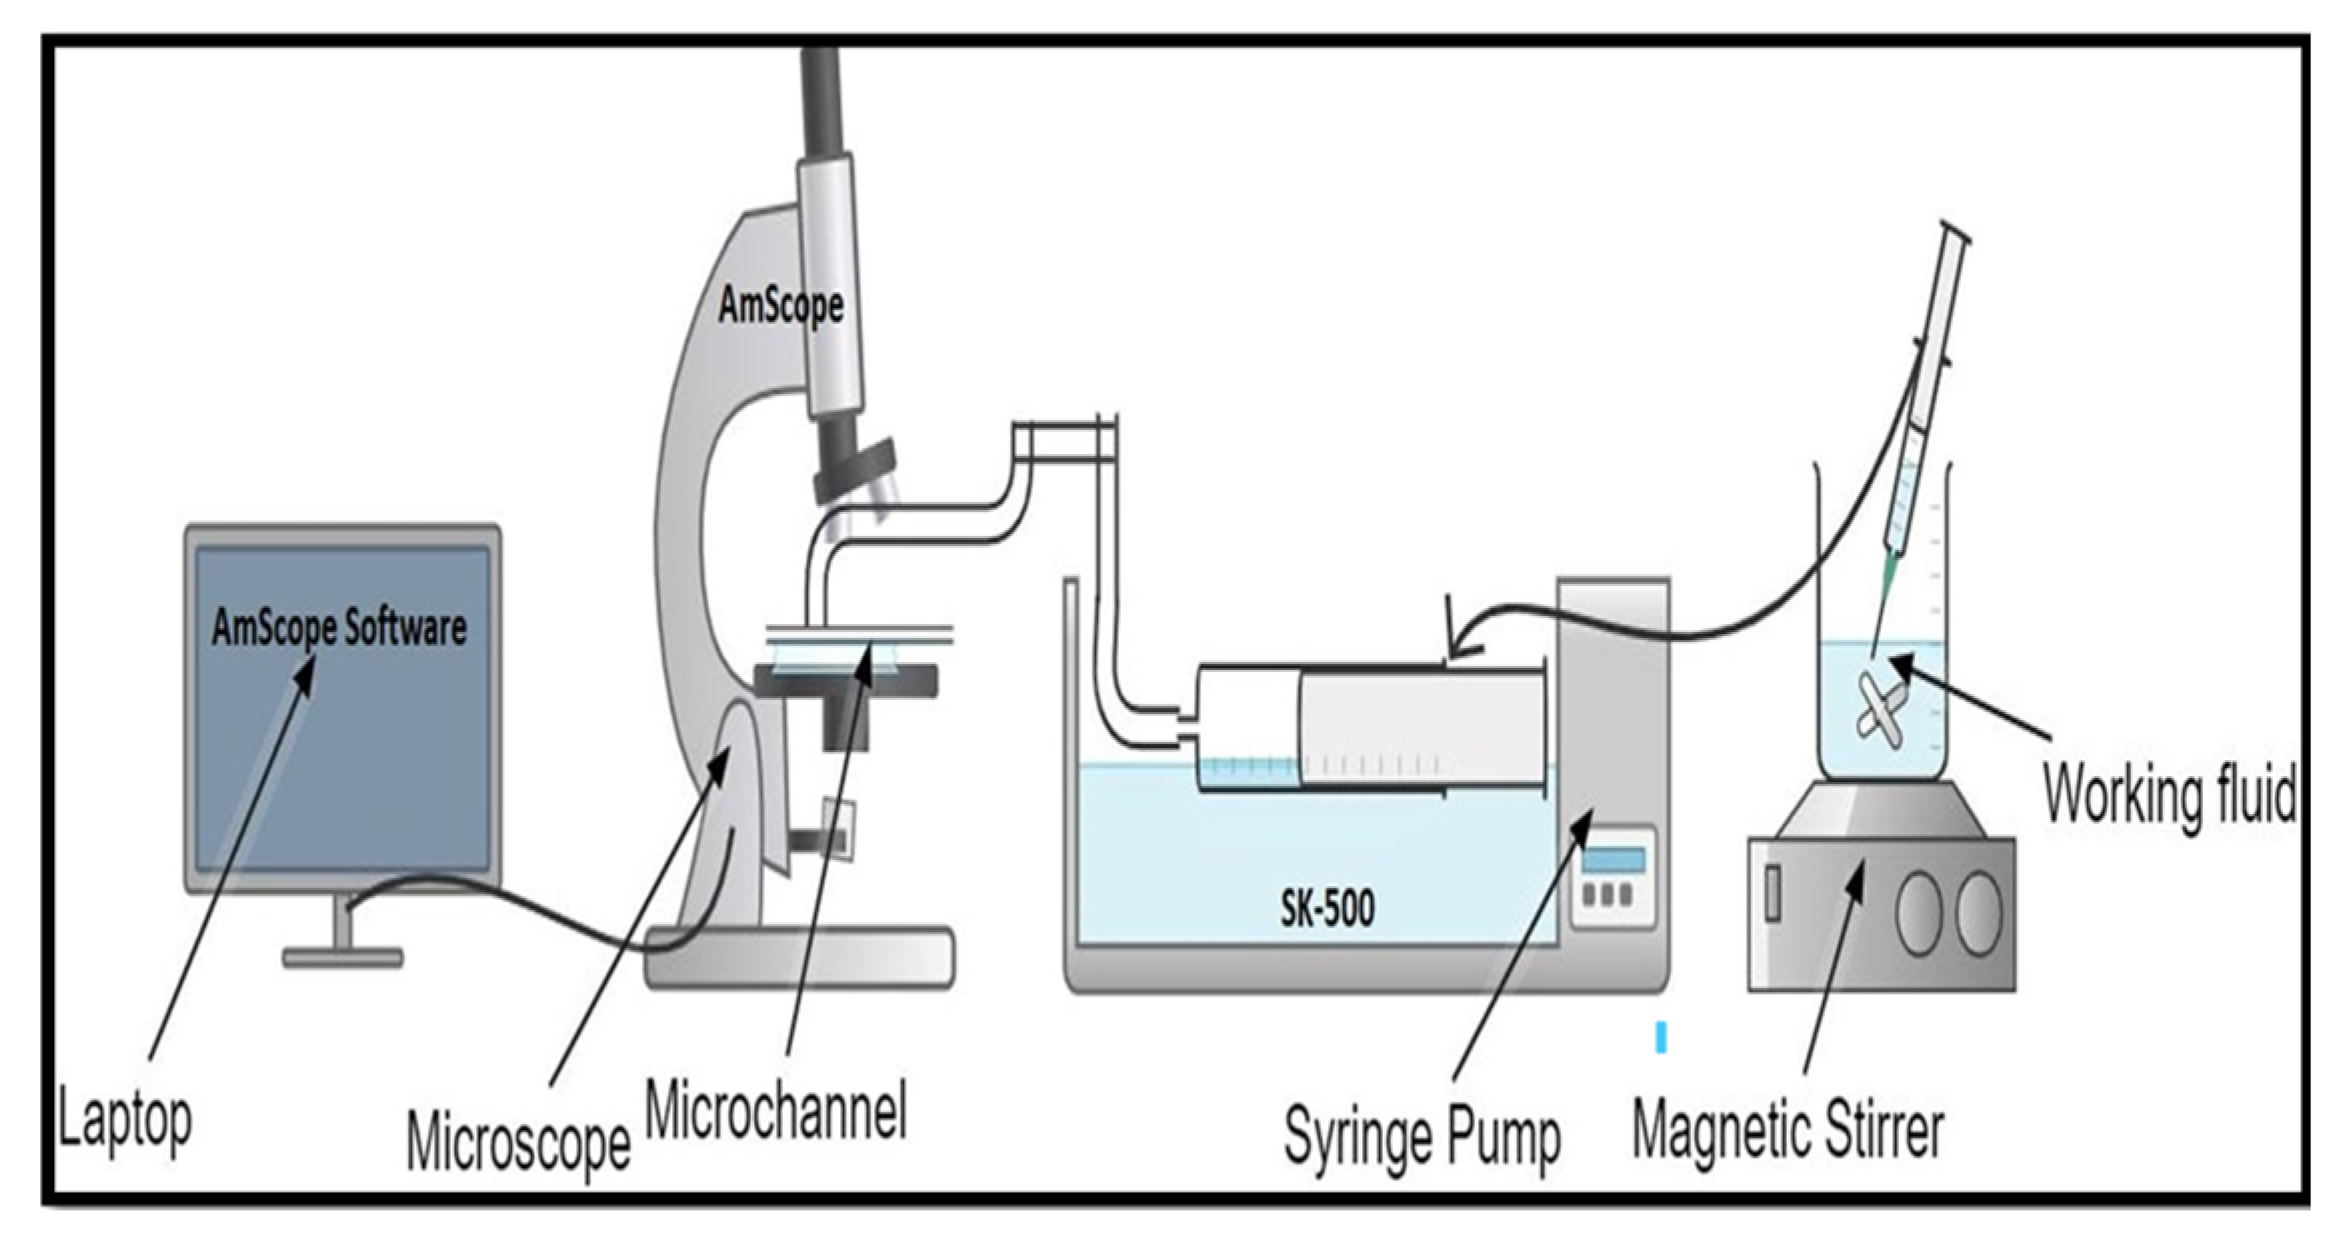
To test the computational results, experiments were performed on microchannels of various dimensions using the experimental setup depicted in
Figure 12. Microchannel chips were manufactured with transparent acrylic material and the behavior of 8 μm and 20 μm particles in a fluid whose density matches blood at room temperature was observed under a digital microscope, and the results were recorded. The fluid containing particles was made to flow in the channel of the acrylic chip using a syringe pump at a controlled flow rate. It was observed that particles tend to focus into different streams at an optimum flow rate under the influence of natural forces and tend to mix below and above this flow rate.
Figure 13 depicts particles in a channel at different flow rates.
Bigger particles seem to travel to the outer walls of the channel, whereas smaller particles travel toward the inner walls, as observed in the computational results. It is evident from the above figure that the particles are at the maximum distance from each other at 150 μL/min in both experimental and computational analyses as shown on
Table 3.
The distance between the separated streams was measured and is presented in the following table.
It is concluded that as a result of an increase in the hydraulic diameter of the channel, the Dean drag increases to such a value that the particles are distended, and a better sense of focusing and sorting can be easily observed by the values obtained in the table for the 150 μm square-sized microchannel. This design has the ability to focus and sort particles when infused with a ratio of 2 between them, provided that the particles involved are no bigger than 20 μm and the flow rate remains above and equal to 150 μL/min.
6. Simulation and Experimental Validation
To validate the computational results, experimental tests were performed using 8 µm and 20 µm particles in fabricated microchannels with transparent acrylic. Both the simulation and experiments used the same flow rates ranging from 50 to 250 µL/min. A comparison of the results is shown in
Figure 14, which plots the ratio of the distance between focused particle streams to the total channel width.
In the right-hand plot, the orange bars represent 8 µm particles, while the blue bars indicate 20 µm particles. These size distinctions are essential for interpreting the performance of our inertial microfluidic device at varying flow rates. The plots demonstrate how the distance between particles (normalized by the total channel width) changes with increasing flow rate. Notably, the 20 µm particles (blue) show greater separation due to stronger inertial lift forces compared to the smaller 8 µm particles (orange), especially at 150 µL/min. This difference in behaviour based on particle size confirms the device’s size-based sorting capability and underscores the sensitivity of focusing performance to both flow rate and particle size.
In both the simulation and the experiment, the maximum separation between particle streams occurred at 150 µL/min, identifying this as the critical flow rate for effective sorting. The simulation predicted a maximum separation ratio of approximately 0.59, whereas experimental validation closely followed with a peak value of 0.48 in a 150 µm microchannel. Minor discrepancies between the two can be attributed to experimental limitations such as surface imperfections, channel roughness, and flow instabilities. The simulated results, where stream separation improves with flow rate up to 150 µL/min and then declines, are consistent with the Dean number effect. The experimental results for two channel widths (150 µm and 250 µm) show similar trends at 150 µL/min. The larger channel (150 µm) yields greater separation (≈ 0.49) due to increased sorting, validating the simulation trend.
This alignment between the simulation and experiment confirms that the proposed device design can effectively focus and sort cells based on inertial migration and Dean flow principles. The consistent trends in both analyses reinforce the reliability of the numerical model and the effectiveness of the fabricated design.
7. Conclusions
The focus of the particles largely depends on the input flow rate, particle size, and hydraulic diameter. Velocity is directly dependent on Qin, and Re, which is an integral part of the fluid dynamics of any flow, also depends on velocity. The focus behavior is quantified by De, which depends on Re. Therefore, Q is a key parameter. It was calculated that there was an increase of 10.6% in the velocity between 50 and 150 μL/min and a 31.41% increase from 150 to 250 μL/min. The overall change was 42.01% for a channel with fixed parameters. The hydraulic diameter of the channel is a key parameter for particle focus. In wider and higher channels, particles tend to be easier to sort.
Larger particles focus easily because FL and FD equilibrate the particle; smaller particles continue to rotate because FD is much larger than FL. The distance between particle streams increases as the flow rate increases to a critical value, after which the particles start mixing with each other. For this channel, a critical flow rate (150 μL/min), Dean number (0.0375), and maximum stream separation ratio (0.5897) were achieved.
A very large De causes mixing because the FD increases too much, and a huge amount of FD ensures that the particles continue to rotate. Particles are always drawn to the longer dimension. We found that 20 μm is the largest particle size that could be sorted with this design. If particles take a lot of time to sort, this can cause the loss of the input sample. Regarding the focus of each particle, the critical flow rate and De vary with the cross-sectional dimensions and length of the channel. The best experimental results were obtained after 150 μL/min. By adjusting the key parameters, an efficient cell separation design can be proposed. This study presents a compact, curved microchannel that operates without sheath flow, which is validated through numerical modeling and practical implementation. This design is suitable for continuous-flow cell separation in biomedical diagnostics, blood analysis, and lab-on-chip systems.
Future work will focus on extending this design to focusing, counting and separation of particle of different types, optimizing it’s parameters for synthetic or live cells/particles, and integrating real-time detection modules to create fully automated counting and sorting systems for separation particles.
