1. Introduction
Lifecycle assessment was carried out on the Australian iron ore mining and mineral processing sector. Greenhouse gas (GHG) emissions are about 12 kg CO
2 per one ton of iron ore (energy input: 153 MJ/t). Loading and hauling contribute to about 50% of the total GHG emissions [
1]. To reduce GHG emissions at this step means to reduce unvaluable material to be transported and processed. High selectivity and the implementation of a sorting step during exploration/ore body modelling and excavation are necessary.
Based on their iron ore mineralogy, iron ores are classified into anhydrous and hydrated iron oxide ores, iron carbonate, and iron silicate ores. All of these types can be massive, layered, nodular, hard, soft, and/or brittle [
2,
3].
The increasing industrial need for iron, high-standard socio-economic and environmental regulations in mining and processing industries, and a decrease in the supply of massive compact high-grade magnetite ores have necessitated the unlocking of low-grade iron ore, lumps, fines, and mine waste dumps.
Against this background, processing industries are challenged to reduce operational and capital costs. This can be achieved by improving production capacities and reducing energy and water consumption. Moreover, flexible, modular flow sheets can be provided for the preconcentration of economic materials at the coarsest grain size and downstream optimization until the metallurgical steps [
2,
3]. Beneficiation starts with crushing followed by washing, fine classification, and jigging. Grinding for liberating the valuable iron oxide particles is followed by classification, gravity and magnetic concentration, and flocculation of iron ore slimes. To achieve an agglomeration of iron (ore) concentrates, the iron oxide slime undergoes inverse flotation, magnetic separation, calcination, desliming, and gravity and magnetic concentration [
4]. The process engineer thus needs the most comprehensive data on the iron oxides and gangue (mineralogy, texture, grain size, and physicochemical properties).
This paper presents a summary of a comprehensive analysis of various iron oxide ore types coming from the Takab complex in northern Iran and for a banded iron ore drill core from South Africa [
5,
6]. We applied optical microscopy, scanning electron microscopy (SEM), electron microprobe analysis (EMPA), electron backscatter diffraction, dual-energy X-ray transmission (DE-XRT), computed tomography (CT), and whole rock geochemistry to access most relevant processing data.
2. Textures and Mineralogy (Optical and SEM)
Detailed information regarding the geological setting and the analytical methods are available in [
5,
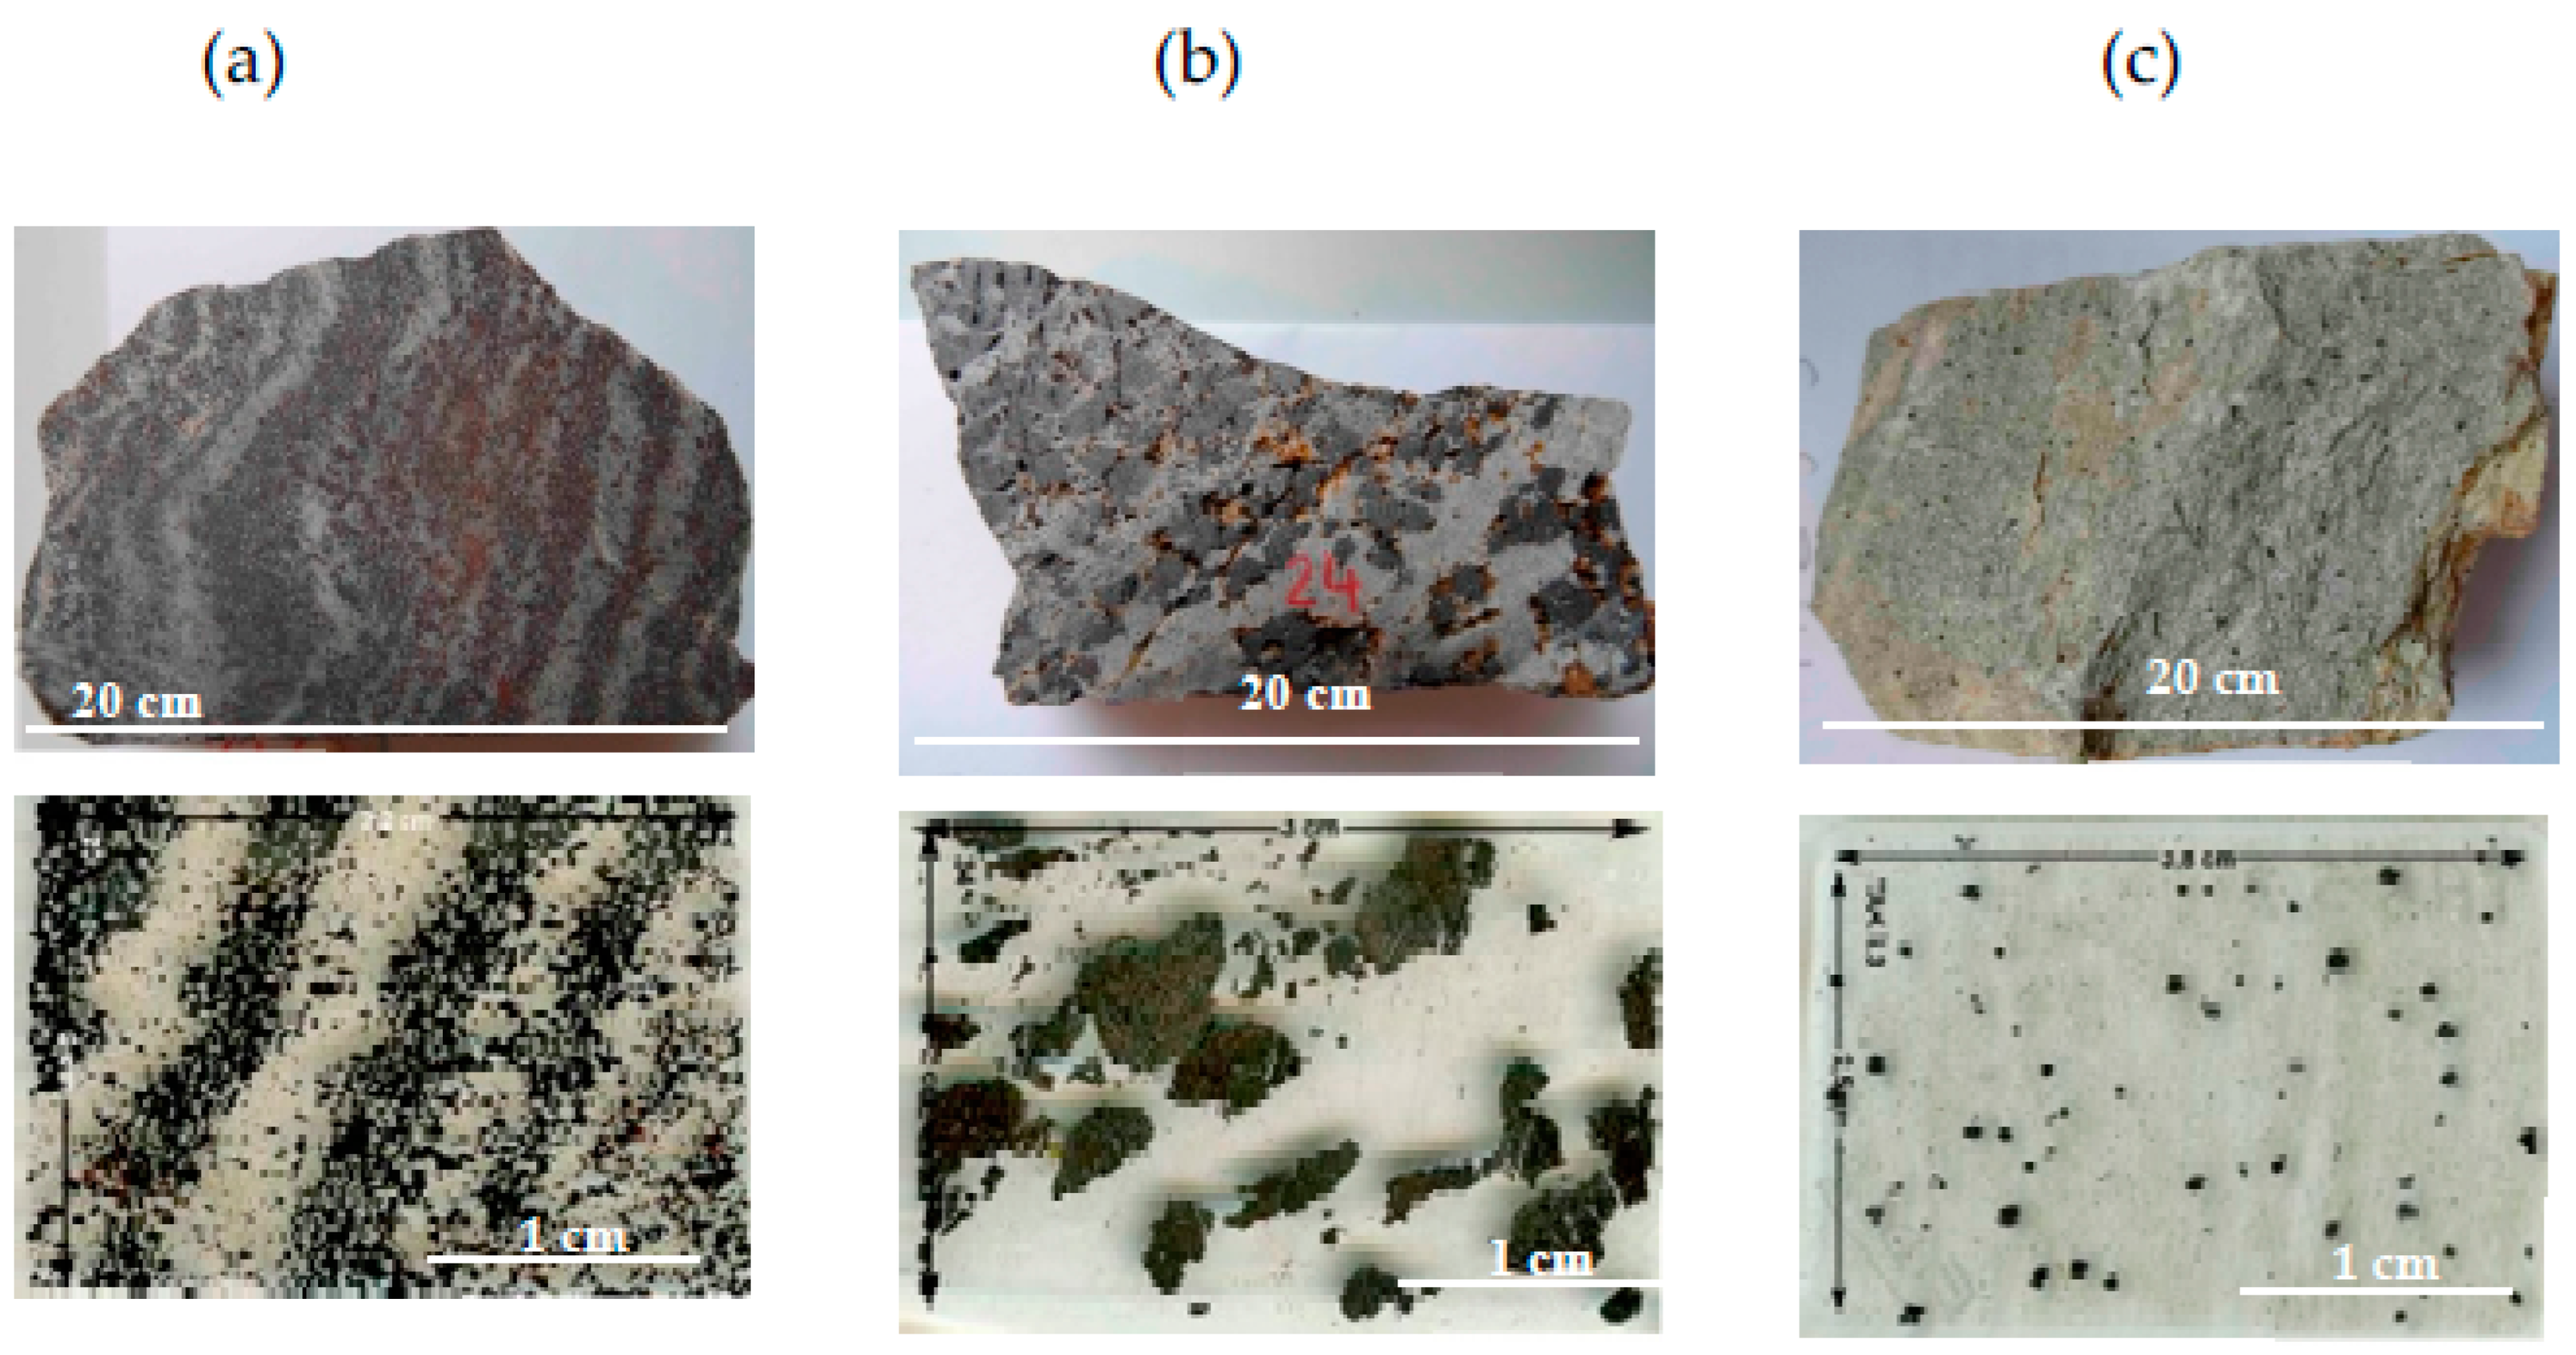
6]. The iron oxide ores present massive, banded, nodular, and disseminated textures in an essentially silicate matrix. All iron ore types are hosted in schisteous rocks. Iron oxides are aligned perpendicularly to deformation (
Figure 1a–c). The iron ore consists of magnetite, mainly occurring as centimetric to decimetric bands in folded micaschists. Magnetite also occurs as mm sized nodules and disseminated particles (400 μm–1.5 mm) in the matrix. Hematite may form thin rims around magnetite and trellis or fill microfractures in magnetite. Goethite, the hydrous form, may occur interstitially to magnetite.
The gangue of the three ore types is composed of quartz, K-feldspar ± mica for the banded ore, and quartz for the nodular and disseminated ores. Quartz is deformed and shows either 120° triple junctions or lobate grain imbrications. Inclusions in magnetite are zircons, monazite, apatite, rhodochrosite, and uraninite. This inclusion mineralogy indicates low contents of actinides and phosphorous. Barite occurs mainly in the matrix.
3. Magnetite Chemistry (EMPA)
Magnetite is rich in Mn (893–3360 ppm, rarely up to 10,609 ppm in nodular ore). Ti contents are low (15–200 ppm) and occasionally at 575–1022 ppm in banded ore and 945–1940 ppm in disseminated ore. V is < 100 ppm, except in disseminated ore (118–200 ppm). Mg ranges from ~50 to 300 ppm. Cr is mostly in the range of 14–98 ppm, and Ni and Cu are near or below the detection limits [
5,
6]. Ca is mostly below 50 ppm and up to 218 ppm in banded ore. Si (≤300 ppm) can rarely reach 1071 ppm in banded ore. Erratic values may reflect nugget effects from inclusions (see [
6]).
4. Bulk Rock Chemistry
The complete chemical analyses are published in [
5,
6]. The banded iron ore is composed of 55 wt.% of total iron (Fe
2O
3) and 0.6 wt.% FeO. It is hosted mainly in the iron oxides. About 44 wt.% of SiO
2 is hosted in quartz. The nodular iron ore shows higher total iron (67 wt.% Fe
2O
3) and FeO (17 wt.%) than the banded ore, and it is lower in SiO
2 (30 wt.% in quartz). Both ore types have similar Al
2O
3 (0.15 wt.%) and CO
2 (0.2 wt.%) hosted in clay minerals and carbonates, respectively. Low S contents (0.03 wt.%) occur in Pb- and Cu-sulfide inclusions. MnO (2 wt.%) is incorporated in iron oxides or occurs as Mn-Ba oxides. Barium (1990 ppm) occurs as barite or Ba-oxides. Pb (1026 ppm) and Zn (936 ppm) are related to micrometric PbS and ZnS inclusions in magnetite. Hazardous As, Cd, Cr, Th, and U are below 100 ppm. Phosphorous (P
2O
5) can reach 0.12%, or it is below the detection limit. The disseminated ore hosts about 6 wt.% of total iron (Fe
2O
3), with about 1 wt.% FeO. Al
2O
3 reaches 14 wt.%. The ore is rich in SiO
2 (70 wt.% in quartz and mica), 7.4 wt.% K
2O, and 0.25 wt.% Na
2O, indicating the presence of feldspars and micas. Barium (2450 ppm) is included in feldspars and barite. Zr (250 ppm) is related to zircons.
5. Dual-Energy X-ray Transmission (DE-XRT) and Computed Tomography (CT)
Sample blocks of the iron ore types as described above were analyzed. The methods and detailed results are presented in [
5]. In addition, a piece of drill core of banded iron ore from a South African deposit mainly composed of hematite was analyzed (
Figure 2, [
5]).
A comparison of the content of heavy materials obtained through the different methods is shown in
Table 1. In this comparison, all applied methods measure different quantities. The chemical composition obtained through X-ray fluorescence (XRF) and inductively coupled plasma mass spectrometry (ICP-MS) is taken as the ground truth. DE-XRT gives the fraction of materials with a high atomic number. According to the chemical analysis of the samples [
5], this fraction consists mainly of iron oxides, while the fraction of low atomic number materials is mostly made of quartz and aluminum silicates. The analysis of the reconstructed CT volume data set yields the volume fraction of the phase rich in iron oxide. For the sample blocks from Iran, this corresponds to the iron oxide content. However, for the drill core, this phase is not made entirely of iron oxide as it also contains a considerable amount of silica. Therefore, to obtain the iron content from the CT scan, calibration through chemical analysis is necessary [
5].
DE-XRT and CT data show that iron-rich and iron-poor samples can be distinguished. Smaller variations in iron-rich samples seem to be erroneous.
While no method can give the ‘true’ iron content, all can be calibrated using ICP-MS data. For analyses in an exploration campaign, the methods applied here allow access to a rough estimate of contents of light, heavy, and very heavy materials. For samples where phases are rich in heavy materials (i.e., materials with a high atomic number) and also contain some lighter materials, as is the case for the banded iron ore drill core presented here, calibration with a portable XRF or laboratory chemical analyses are required when analyzing CT data.
While CT may require additional calibration when determining the iron content for samples, it also provides structural information, as it allows for the examination of cross-sections of samples. Moreover, the spatial distribution of bands, nodules, and pores becomes visible. The orientation of the layers can be estimated if suitable GPS data are available. Using DE-XRT, only limited structural information may be available for thin samples.
6. Conclusions
Sorting parameters must be determined using representative samples in laboratories. Mineralogical analyses (Microscopy, SEM, EMPA) and chemical analyses (XRF, ICP-MS) are the base of all studies to evaluate the resource and to select samples for DE-XRT and CT. These analyses give major information on grain size ranges and grain sizes of the valuable iron oxides. They allow for the categorization of the iron oxide for optimal processing. On this basis, parameters for automated mineralogical and chemical analyses (drill core scanners, e.g., ANCORELOG (
https://www.dmt-group.com/ancorelog.html (accessed on 4 November 2023))) can be established for implementing an optimal exploration and excavation plan.
DE-XRT and CT give information regarding the composition of the ore types. CT allows for obtaining structural information to which XRT or microscopy have limited access. Ordinary CT, i.e., with a single X-ray spectrum, does not reveal the iron content itself, but it is useful for obtaining the volume fractions of phases with high and low iron content. Alternatively, it is suggested to use dual-energy CT to directly determine the iron content. XRT can be used in continuous automated mode, while CT can be performed for selected samples in a mine workshop or external laboratory. For a first approach for sorting valuables from gangue, this can save time in comparison to chemical analysis. Still, laboratory test analyses are indispensable for defining a protocol for field applications. Fast and rough estimation of iron oxide distribution and ratios of economic to barren material will contribute to reducing GHG emissions and energy and water consumption along the mining and processing chain. Lifecycle assessments should start at the early exploration state to fully integrate automatized drill core data and evaluate their efficiency.
Author Contributions
Conceptualization, B.O. and C.W.; methodology, C.W., O.B., N.R., R.W. and C.B.; software, R.W., M.H., I.M. and G.N.; data curation, C.W.; writing—original draft preparation, C.W., B.O. and R.W.; review and editing, R.W. and C.B., supervision, B.O.; project administration, B.O. and C.W.; funding acquisition, B.O., C.W. and M.H. All authors have read and agreed to the published version of the manuscript.
Funding
The studies were funded by the “ANCORELOG” project (Grant N° 17028) from the European Institute of Innovation and Technology (EIT), a body of the European Union under Horizon 2020, the EU Framework Program for Research and Innovation. Furthermore, grants were provided by the Sorbonne Université (Paris, France), the French national TRIGGER project, and Campus France (Gundishapur project N°40624TK, French Iranian research program).
Institutional Review Board Statement
Not applicable.
Informed Consent Statement
Not applicable.
Data Availability Statement
Not applicable.
Acknowledgments
E. Delairis is thanked for sample preparation.
Conflicts of Interest
The authors declare no conflict of interest.
References
- Haque, N.; Norgate, T. Life cycle assessment of iron ore mining and processing. In Iron Ore 2015: Mineralogy, Proccessing and Environmental Sustainability; Lu, L., Ed.; Elsevier Ltd.: Oxford, UK, 2015; Volume 66, pp. 615–630. [Google Scholar]
- Indian Bureau of Mines. Monograph of Iron Ore; IBM Press: Nagpur, India, 1997. [Google Scholar]
- Indian Bureau of Mines. Iron, and Steel—Vision 2020; Aqua Process: Nagpur, India, 2011. [Google Scholar]
- Sahoo, R.K.; Acharya, B.C.; Naik, B.C.; Misra, S.K. Mineralogical characteristics of some off-grade iron ores of Orissa, India. In IIM, Proceedings of the International Symposium on Beneficiation and Agglomeration, Bhubaneswar, India, 16–18 January 1991; Regional Research Laboratory: Bhubaneswar, India, 1980. [Google Scholar]
- Bauer, C.; Wagner, R.; Orberger, B.; Firsching, M.; Ennen, A.; Garcia Pina, C.; Wagner, C.; Honarmand, M.; Nabatian, G.; Monsef, I. Potential of Dual and Multi Energy XRT and CT Analyses on Iron Formations. Sensors 2021, 21, 2455. [Google Scholar] [CrossRef] [PubMed]
- Wagner, C.; Villeneuve, J.; Boudouma, O.; Rividi, N.; Orberger, B.; Nabatian, G.; Honarmand, M.; Monsef, I. In Situ Trace Element and Fe-O Isotope Studies on Magnetite of the Iron-Oxide Ores from the Takab Region, NorthWestern Iran: Implications for Ore Genesis. Minerals 2023, 13, 774. [Google Scholar] [CrossRef]
| Disclaimer/Publisher’s Note: The statements, opinions and data contained in all publications are solely those of the individual author(s) and contributor(s) and not of MDPI and/or the editor(s). MDPI and/or the editor(s) disclaim responsibility for any injury to people or property resulting from any ideas, methods, instructions or products referred to in the content. |
© 2023 by the authors. Licensee MDPI, Basel, Switzerland. This article is an open access article distributed under the terms and conditions of the Creative Commons Attribution (CC BY) license (https://creativecommons.org/licenses/by/4.0/).


 ,
, 

