Abstract
This paper proposes hybrid LSTM-DES models that combine traditional forecasting methods with recurrent neural network techniques. We experimented with these proposed models using four passenger datasets from different regions of Thailand. Additionally, we compared their performance with several individual forecasting models, including the Double Moving Average (DMA), Double Exponential Smoothing (DES), and Holt–Winters methods (both additive and multiplicative trends), as well as long short-term memory (LSTM) recurrent neural networks. Our proposed hybrid model builds upon previous work with improvements in hyperparameter tuning using the GRG nonlinear optimization method. The results demonstrate that the hybrid LSTM-DES models outperformed all individual models in terms of both accuracy and demand variation. The reason behind the success of the hybrid model is that it works well with both linear and nonlinear trends, as well as the seasonality of certain periods. Furthermore, the forecast results for train passengers will serve as input variables to estimate the future revenue of train travel programs in various regions, including rail tourism. This information will help identify which regions should receive increased focus and investment by the train tourism program. For example, if the forecasted number of passengers in the northern region is high, the State Railway of Thailand will promote and improve infrastructure at the train station and nearby tourist attractions.
1. Introduction
Tourism plays an important role in building the economy, socio-culture, and image of many counties around the world, and it has a remarkable effect on global economic development [1]. According to Statista’s global tourism industry report, in 2023, the global tourism revenue reached approximately USD 9.9 trillion [2]. The contribution of the tourism industry led to an increase in a destination’s competitiveness in the long run [3]. Therefore, improving tourism destination development and infrastructure may generate tourist volume and tourism demand, which subsequently require planning and policy making for predicting future economic development [4]. Specifically, improvement in a touristic destination, such as transportation and hospitality services [5], can optimize resource allocation and create pricing strategies.
The transportation system is recognized as a critical component of the tourism industry that influences touristic destinations. Railways, airlines, highways, and cruise ships, among others, are key to the accessibility of transportation systems [6]. According to Wang, Niu, and Qian (2018) [7], appropriate transportation can promote destination marketing and strategies that influence the attractiveness of touristic destinations. Moreover, different modes of transportation services offer diverse characteristics such as economy, speed, convenience, and safety, which leads to a variety of effects on tourism. In particular, railway transportation is considered essential to trade openness, which directly and indirectly affects tourism development in urban and station locations [8]. In other words, traveling by train has a lower environmental effect and reduces emissions compared with other forms of transport. In addition, this mode of transport has been related to tourism since the nineteenth century and early years of the twentieth century, and it is a popular mode of transport for travelers [9]. Thus, understanding railway transportation for tourism can assist in predicting sustainable performance parameters such as economic and environmental perspectives, which catalyze improvement in the quality of railways. This is important for the future and marketing perspectives.
Prior research demonstrates that traveling by train is an important form of transportation in Asian countries such as China, Taiwan, and Thailand [9,10]. In particular, Thailand is acknowledged as an emerging country, with a strong and growing service sector (50% of the GDP) mainly focused on tourism. Specifically, Thailand’s sector is projected to reach approximately USD 5.3 billion in 2025, accounting for a 33% year-on-year increase and contributing 9.4% to 11.6% national GDP growth from 2023 to 2033 [11]. Therefore, the Thai government seeks to encourage the tourism sector by enhancing the performance of various transportation options, including railway transportation. Railway transportation is one of the most attractive modes for both general passengers and tourists because it is the most affordable and offers frequent trips between cities across the country. In Thailand, railway tourism has been developed to improve the touristic experience, relate travel to nostalgia, and provide a taste of history, such as the history of the Thai–Burma railway. This route represents a period of the Second World War and features a bridge over the river [12]. In improving the experience of tourists, the government is especially interested in promoting train tourism programs throughout all regions. Specifically, developing infrastructure, including railway transportation for tourism, is one of the Thai government’s principal goals.
The purpose of developing and upgrading transportation infrastructure such as the State Railway of Thailand (SRT) is to increase the number of train tourists and revenue by seamlessly connecting the railway system with other modes of transport [13]. The objective is to enhance the convenience of multiple-city sightseeing journeys for train tourists. However, to ensure the success of this initiative, it is essential to understand the trends in both passengers and tourists in each region and nationwide. One promising approach to this challenge is to forecast passenger trends by leveraging novel forecasting techniques such as machine learning (ML) or deep learning (DL). This introduces a new way to analyze tourist behavior for the SRT. Forecasting passenger trends could help the SRT to better understand tourist behavior and develop appropriate policies to enhance train tourism for both local and foreign passengers. The rest of this paper is divided into four sections. Section 2 describes relevant theories, such as the concept of train tourism and various forecasting techniques. Additionally, this section identifies the research gap. Section 3 presents the conceptual framework and provides a detailed description of research methodologies. Section 4 analyzes and synthesizes the experimental results from the previous section, focusing on both forecasting and economic performance. Finally, Section 5 summarizes the overall findings of this research and highlights potential future perspectives.
2. Literature Reviews
This section establishes three topics: the concept of train tourism, forecasting techniques, and relevant prior work. All details are described below.
2.1. Concept of Train Tourism
The State Railway of Thailand (SRT) has adopted a policy to encourage local and foreign passengers to travel on trains by implementing an attractive tourism program. The SRT aims for this vision “To become logistics and connectivity platform to fulfill stakeholders’ expectations” [13], which means that all stakeholders, including passengers, will be fulfilled in their travel expectations when traveling by train in Thailand. In addition, the SRT has a rail transport network that covers all regions of Thailand and connects with neighboring countries, such as Laos and Malaysia. The details above demonstrate that all tourists traveling by train will feel comfortable and enjoy their journeys.
However, to achieve success in train tourism, it is not enough to focus solely on establishing a seamless rail network across the country; it is equally important to understand passenger trends and behavior when using trains for travel. Some previous studies have proposed research methodologies for analyzing passenger behavior. First, one study [14] proposed an economic/mathematical model to optimize rail route planning in a way that serves passenger demand and maximizes profit from tourism. The model considered all relevant risks that could occur on tourist routes. The results revealed that the proposed models could suggest appropriate tourist routes based on existing infrastructure. Developing tourism for economic diversification in regions not suited to this sector requires fundamental changes to previous ways of operating, including new approaches to business creation, capacity building, education and knowledge exchange, networking, and public/private interactions [15]. Another study [16] developed a novel model combining the Theory of Planned Behavior and quality factors. The model assessed the relationship between passengers’ service quality and their intention for future trips. The results illustrated that train service quality and travel quality significantly impact the intentions of high-speed railway tourists. These two studies are good examples of understanding and synthesizing passenger behavior using different tools.
Even though there have been some studies on train tourist behavior, few have focused on the impact of passenger trends on future tourism programs. Passenger trends can help the SRT propose appropriate tourism programs for each rail route. One interesting solution to capturing passenger trends during different periods is the implementation of forecasting techniques. The next section will describe, in more detail, the concept of relevant forecasting techniques and explain why forecasting is important for understanding passenger trends, specifically for train passengers.
2.2. Forecasting Techniques
This study focuses on time-series forecasting techniques, analyzing the pattern of historical monthly data from the SRT, which exhibits both linear and nonlinear trends, and seasonal variations during certain periods. Based on the performance of forecasting techniques in prior studies [17,18,19], we are interested in developing hybrid forecasting models that combine traditional statistical techniques with machine learning techniques. We begin by providing more details about some traditional statistical techniques that are frequently used to forecast time-series data, followed by a description of the characteristics of the machine learning technique. For traditional statistical techniques, Double Moving Average (DMA), Double Exponential Smoothing (DES), and Holt–Winters Exponential Smoothing (ES3) are implemented. Additionally, long short-term memory (LSTM) is utilized as one of the most popular machine learning techniques for forecasting future demand.
2.2.1. Traditional Statistical Techniques
Double Moving Average (DMA)
This technique is similar to the Simple Moving Average (SMA) technique but involves calculating a second average using the first set of moving averages. The DMA technique performs well with linear trends in time-series data. The structure of the DMA technique is outlined in Equations (1)–(5) [20].
where
Level (Lt) = (2Mt) − Dt
Ft+n = Lt + nSt
K = considered period k;
Ft+n = forecast value at time t with n steps.
Double Exponential Smoothing (DES)
This technique is an extension of the Simple Exponential Smoothing (SES) technique. However, there are a few key differences between the two. SES is suitable for time-series data characterized by high uncertainty, meaning the data can undergo drastic changes within short periods. Conversely, the Double Exponential Smoothing (DES) technique is designed to handle both linear trends and uncertainty in time-series data, without accounting for seasonal patterns. Additionally, DES requires two smoothing constants, alpha (α) and beta (β). This technique is also commonly referred to as “Holt’s Linear method”. The structure of the DES technique is presented in Equations (6)–(9) [21].
Level (Lt) = αYt + (1 − α)(Lt−1 + St−1); 0 ≤ α ≤ 1
Slope (St) = β(Lt − Lt−1) + (1 − β) St−1; 0 ≤ β ≤ 1
Ft+n = Lt + nSt
α = smoothing constant for Lt;
β = smoothing constant for St;
Ft+n = forecast value at time t with n steps.
Holt–Winters Trend and Seasonality (ES3)
This model is an extension of the DES technique, but its structure differs from those of other Exponential Smoothing (ES) techniques. Commonly known as Triple Exponential Smoothing (ES3), this technique incorporates three main parameters: level (α), trend (β), and seasonal (γ) [22,23]. This technique is particularly effective for univariate input factors [23,24]. Furthermore, the level and seasonal components can be modeled using either additive or multiplicative data patterns. The details of the ES3 structure [21] are presented in Equations (10)–(17).
Additive combination:
Level (Lt) = α(Yt − St−p) + (1 − α)( Lt−1 + Tt−1); 0 ≤ α ≤ 1
Trend (Tt) = β( Lt − Lt−1) + (1 − β) Tt−1; 0 ≤ β ≤ 1
Seasonal (St) = γ( Yt − Lt−1 − Tt−1) + (1 − γ) St−p; 0 ≤ γ ≤ 1
Ft+n = Lt + nTt + St−p+n
Multiplicative combination:
Trend (Tt) = β(Lt − Lt−1) + (1 − β) Tt−1; 0 ≤ β ≤ 1
Ft+n = (Lt + n Tt) St−p+n
Ft+n = forecast value at time t with n steps;
p = considered period length;
n = forecast step;
St−p+n = estimated seasonal.
2.2.2. Machine Learning Technique
Long Short-Term Memory (LSTM)
One of the most efficient techniques in the machine learning (ML) category for forecasting time-series data is the long short-term memory (LSTM) model [25,26]. LSTM, a variant of recurrent neural networks (RNNs), utilizes short-term and long-term memory cells to enhance forecasting performance [18,27]. This design allows LSTM to retain only the necessary input data in short-term memory for accurate predictions while capturing long-term dependencies in both linear and nonlinear data. Additionally, LSTM addresses the issues of vanishing and exploding gradient descents during training. By continuously updating weights in its memory cells throughout the training process, LSTM reduces noise and improves forecast accuracy, making predictions more aligned with actual data. The structure and details of the LSTM model are illustrated in Equations (18)–(23) [26].
First step: The forget gate ( decides which information must be rejected from the cell.
Second step: The input gate ( determines the chosen inputs for updating the LSTM cell state. Additionally, the hyperbolic tangent layer generates a new vector for the candidate cell state (.
Third step: The existing cell state ( is updated by combining it with the candidate cell state ( to produce the new state (.
Fourth step: The output gate ( determines which information from the cell state should be produced as the output.
Last step: The value of the hidden state ( is constructed based on the output gate ( and the update cell state (, typically using an activation function such as the hyperbolic tangent.
where
= the input at time t and represents the external factors;
= the hidden state at time t − 1;
= the hidden state at time t;
= input weights at each gate;
= recurrent weights at each gate;
= bias factors at each gate;
= the sigmoid function;
= the hyperbolic tangent function.
2.3. Relevant Prior Works
Existing studies have explored the use of ML and DL techniques to predict train passenger trends across various scenarios. For example, some researchers [28,29] applied artificial neural networks (ANNs) and related ML techniques to forecast passenger train delays, considering multiple constraints and input factors, including varying portions of training and testing datasets. The results of these studies revealed that the ANN technique outperformed other approaches. Another study [30] proposed a real-time prediction model for train and platform crowding using Random Forest and Gradient-Boosted Trees techniques. The results demonstrated that the predictive data could reduce passenger boarding refusal rate and improve train capacity utilization. Lastly, a researcher [31] developed a novel forecasting model based on the theory of random utility and a multinomial logit model to predict passenger distribution flow during holidays. This proposed model also outperformed other ML models in comparative analyses.
Although some studies have implemented ML and DL techniques to forecast train passenger trends, few have examined how such forecasts influence tourist behavior in the context of rail tourism. Moreover, most existing studies rely on single forecasting techniques to analyze passenger behavior. The problem with single forecasting techniques is that they cannot learn and capture all behavior contexts. Some techniques perform well when only identifying behavior trends, while others rely solely on the seasonality of demand during certain periods. To address these research gaps, this study aims to enhance the forecasting performance of passenger trends by utilizing hybrid forecasting models. These models are effective in capturing tourist behaviors, including linear and nonlinear trends, as the seasonal patterns of specific periods. Additionally, we will evaluate the performance of proposed hybrid models using historical train passenger data from all regions covered by the SRT. The details of the research methodology will be presented in the next section.
3. Methodology
There are four steps involved in proposing hybrid forecasting models: data gathering, data pre-processing, training the model with forecasting techniques, and model evaluation. All details are presented below and illustrated in Figure 1.
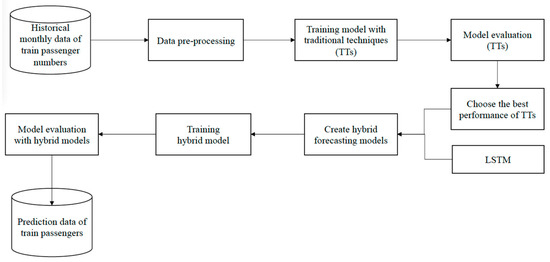
Figure 1.
Flowchart of hybrid forecasting approach.
3.1. Data Gathering
We collect data on the monthly train passenger numbers for the period between December 2020 and August 2024 across four regions of Thailand. Data was provided by the SRT. This step ensures the availability of sufficient and accurate time-series data for analysis. The trends in train passenger data across four regions are shown in Figure 2.
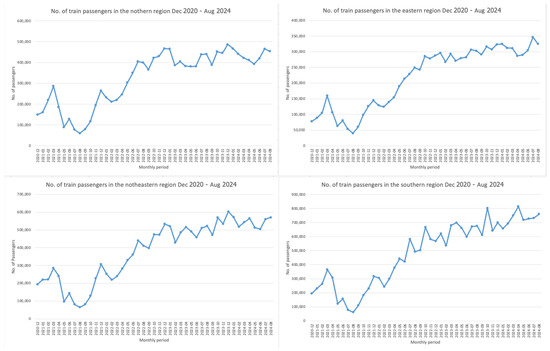
Figure 2.
Trends in train passenger numbers across four regions.
3.2. Data Pre-Processing
In this step, we focus on data cleaning and normalization. First, we clean the data collected in the previous step by removing all missing values and outliers and correcting typographical errors. We implement the cleaning step in all monthly passenger datasets. Then, we transform the data to a consistent scale using normalization techniques. In this case, we implement the MinMaxScaler method to normalize data to the same scale. These two methods enhance the data’s applicability for training forecasting models in the next step [32].
3.3. Training Model with Forecasting Techniques
After completing data pre-processing, we divide the data into training and testing sets. We use a random search to determine the data portion. The optimal split is 70% for training and 30% for testing. Next, we implement traditional statistical and machine learning techniques to train forecasting models. For traditional statistical techniques, DMA, DES, and ES3 are employed for model training. For machine learning, LSTM is utilized for training as well. Moreover, for DMA and LSTM, we train the models by considering the lag time of historical passenger data, as these models perform well in terms of capturing the relationships among historical data from previous periods. Lag times of 2 and 4 months are considered because the number of passengers changes rapidly every 2 or 4 months, as shown in Figure 2.
Subsequently, we develop hybrid forecasting models by combining the best traditional statistical technique with LSTM. The best traditional statistical technique is selected based on train passenger data for each region. Additionally, the structure of the hybrid models is adapted from a previous study [19]. The reason for choosing this hybrid model is that it outperforms other hybrid models in the literature in terms of forecasting performance. However, the key difference between the reference hybrid model from the literature and this work lies in the selection of the traditional statistical technique used in the model and the hyperparameter tuning solution. The formula and the model architecture of the hybrid forecasting model are presented in Equation (24) and Figure 3. All steps for constructing a hybrid model are linked with blue arrows.
where
= forecast data of hybrid model at period t;
= forecast data using LSTM model at period t;
= forecast data using traditional model at period t;
α = GRG nonlinear; 0 ≤ α ≤ 1.

Figure 3.
Model architecture of hybrid LSTM–traditional model.
Figure 3.
Model architecture of hybrid LSTM–traditional model.

Hyperparameter tuning is performed for both single and hybrid forecasting models to enhance accuracy and reliability. For DES, ES3, and hybrid models, we use GRG nonlinear optimization to tune hyperparameters, specifically the alpha values. Meanwhile, for LSTM, we employ a hybrid scatter search–genetic algorithm [18] to select the most suitable hyperparameters, including the number of hidden layers, the number of nodes in each layer, activation functions, and optimizers. All forecasting techniques are developed using the Python programming language version 3.11.12 in Google Colab. The experiments on training and testing data are validated on an Apple M1 CPU-based machine with 8 GB of DDR5 RAM, running macOS Sonoma version 14.4.1. The forecast data will be evaluated to assess their performance in the next step.
3.4. Model Evaluation
This step will be implemented after training using the traditional statistical techniques and hybrid forecasting models. First, the testing data will be converted from scaled data back to original data during the data post-processing phase. Next, the forecasting model will be evaluated using three performance indicators: Mean Absolute Percentage Error (MAPE), Mean Absolute Scaled Error (MASE), and Coefficient of Variation (CV) scores. The formulas of these indicators are shown in Equations (25)–(27) [33,34,35].
: the actual demand for period i;
: the forecast demand for period i;
: the average forecast;
: the forecasting period;
: the training period.
Additionally, the model’s performance will be assessed from an economic perspective. In this study, we will calculate the deviation in train passenger revenues across three regions by comparing actual and forecasted passenger numbers. The results will be presented in Section 4.
4. Result Analysis and Discussion
In this section, the results in terms of three aspects, namely, forecasting, economic, and managerial performance, are analyzed and discussed. All details are provided below.
4.1. Forecasting Performance
This aspect begins with a performance comparison of single traditional statistical techniques, namely, DMA, DES, and ES3. Additionally, for the ES3 technique, both additive and multiplicative patterns are considered, with fixed values for the seasonal parameter depending on the train passenger data patterns. The comparison of different single traditional techniques is presented in Table 1 and Table 2. Additionally, the forecasting performance is analyzed by comparing the forecasted and actual train passenger numbers over a 13-month testing period.

Table 1.
Comparison of forecasting performance between single traditional techniques using MAPE across four regions.
Table 2.
Comparison of forecasting performance between single traditional techniques using MASE across four regions.
Table 1 and Table 2 demonstrate that DES provides the lowest MAPE and MASE scores compared to other traditional techniques. Therefore, DES outperforms the other traditional techniques. Subsequently, the forecast data using the DES technique will be combined with the forecast data using the LSTM technique to create hybrid forecasting results. A comparison between single forecasting models, namely, DES and LSTM, and hybrid forecasting models is presented in Table 3 and Table 4.
Table 3.
Comparison of forecasting performance between single and hybrid forecasting models using MAPE across four regions.
Table 4.
Comparison of forecasting performance between single and hybrid forecasting models using MASE across four regions.
Table 3 and Table 4 reveal that the hybrid LSTM-DES model provides the lowest MAPE and MASE scores, outperforming the other forecasting techniques. Furthermore, the hybrid model’s formulation differs across regions. For the northern and eastern regions, the hybrid LSTM-DES model combines the results of the LSTM with a time lag of 2 months and the DES technique. Meanwhile, for the northeastern and southern regions, the hybrid LSTM-DES combines the results of the LSTM with a time lag of 4 months and the DES technique. This shows that historical data from the previous 2 and 4 months impact the forecasting performance of hybrid models, in particular outperforming forecasting during the previous time steps of LSTM. In addition, the comparison graphs demonstrate that hybrid models perform well with both linear and nonlinear trends, including the seasonal patterns during specific periods. The comparison between forecasted and actual train passenger numbers is displayed in Figure 4.
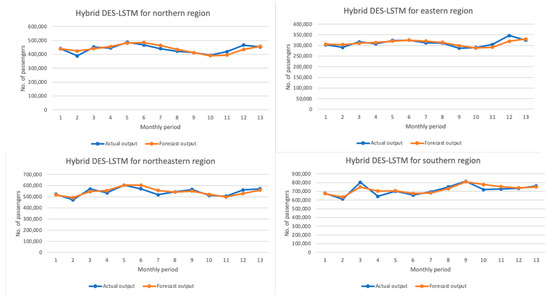
Figure 4.
Comparison between forecasted and actual train passenger numbers across four regions.
Subsequently, the forecast data from the hybrid LSTM-DES model will be used as the input to examine forecasting stability and certainty using the CV score. The list of best-performing forecasting models for train passenger numbers is presented in Table 5.
Table 5.
List of best-performing forecasting models across four regions based on CV score.
Table 5 shows that the CV scores of the forecasted data using the hybrid LSTM-DES models are less than 0.25, indicating that the forecasted data across all regions demonstrates stability and certainty. The forecasted passenger data from the hybrid models is used as the input to calculate future passenger revenues. All details are discussed in the next section. Based on the statistical results among the MAPE, MASE, and CV indicators, the hybrid LSTM-DES models demonstrate superior performance compared to other single forecasting models in terms of both accuracy and stability, even when the forecasting periods change.
4.2. Economic Performance
The forecasted results from the 13-month testing period of the hybrid LSTM-DES models are used to calculate train passenger revenue for each tourist route. For the train ticket price, we select the one-way ticket price for a seat in a second-class carriage of a medium-speed train as an input parameter for calculating train passenger revenue. The assumption is that, for long-distance trips, all passengers will choose a seat in a second-class carriage of a medium-speed train due to its affordable price and standard facilities. The one-way ticket price for a seat in a second-class carriage of a medium-speed train and the revenue deviations between actual and forecasted passenger numbers across the four regions are presented in Table 6 and Table 7.
Table 6.
One-way ticket price of seat in second-class carriage of medium-speed train across four regions.
Table 7.
Revenue deviations between actual and forecasted passenger numbers across four regions.
Table 7 demonstrates that the deviation percentage between actual and forecasted passenger numbers across the four regions is minimal, ranging approximately from 0.02 to 1.00 percent. This indicates that the incoming revenue can be accurately calculated using the forecasted passenger numbers from the hybrid LSTM-DES models. In the next section, we will provide further details on how the forecasted monthly train passenger numbers influence the tourism strategy.
4.3. Managerial Aspect
Based on the flowchart in Figure 5, train tourism strategic planning can be developed using the forecasted monthly train passenger numbers, predicted by the hybrid LSTM-DES models (blue arrows), combined with other related factors (yellow arrow), such as the number of train stations, available facilities, modes of transport, and local attractions. The expected outcomes from this strategic planning (red arrows) include forecasted train passenger revenue, suitable train tourist programs, and the growth rate of the tourism sector across the four regions, which are distinguished using yellow circles, in Thailand. For example, the forecasted number of passengers in the northern region can help the SRT plan a sufficient number of tourism trains and provide suitable options for intermodal transportation from the train station to tourist destinations in the northern area. In addition, this framework can be implemented using real-time data or by adapting the model to other modes of transport.
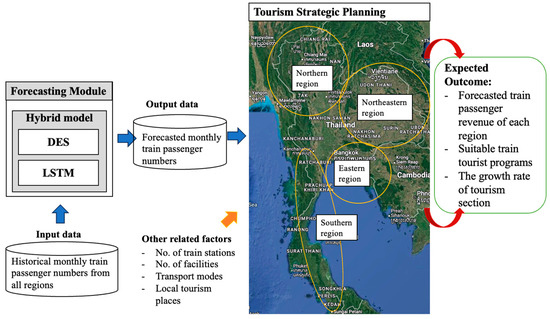
Figure 5.
Managerial framework of rail tourism integrated with hybrid forecasting approach.
5. Conclusions
This paper proposes hybrid LSTM-DES models that combine traditional forecasting methods with recurrent neural network techniques. We experiment with the proposed models using historical passenger datasets from four regions of Thailand. Additionally, we compare the performance of the proposed hybrid models with several individual forecasting models, including DMA, DES, and Holt–Winter methods (ES3), and long short-term memory (LSTM) recurrent neural networks, using MAPE, MASE, and CV scores as performance metrics.
Our proposed hybrid model builds upon previous work, incorporating improvements in hyperparameter tuning through the GRG nonlinear optimization method. The results demonstrate that the hybrid LSTM-DES model outperforms all individual models in terms of both accuracy and demand variation. For the MAPE, the hybrid LSTM-DES model achieves the lowest score, with less than 3.50 percent in all regions. Similarly, the hybrid model provides the lowest MASE score, which is below 0.5 in all regions. Furthermore, the forecasted passenger numbers show stability and reliability, with a CV score consistently below 0.25. Using the forecasted data, we calculate the incoming passenger revenue for each region and compare it to actual data. The deviation percentage between forecasted and actual passenger numbers is very small, with less than 1 percent deviation across all regions. This suggests that the forecasted passenger numbers can be used to reliably estimate incoming revenue across the four regions. From a managerial perspective, the forecasted monthly train passenger numbers can also serve as key input factors for developing train tourism strategic plans. Moreover, the experimental results prove that the hybrid forecasting approach is applicable for resource allocation planning, both regionally and globally in different areas.
For future work, we recommend conducting tourism cluster analyses using the forecasted train passenger data for each region. Factors such as train station locations, available facilities, and the number of departure/arrival trains at each station could serve as valuable inputs for designing sustainable train tourism policies. This approach would further enhance the managerial framework proposed in this paper and contribute to more effective and sustainable train tourism strategies.
Author Contributions
Introduction and literature reviews, A.K.-a. and S.M.; methodology, A.K.-a. and P.S.; algorithm development, A.K.-a.; algorithm validation, P.K., P.P., and P.S.; formal analysis, A.K.-a. and S.M.; writing—original draft preparation, A.K.-a. and P.S.; writing—review and editing, P.S., A.K.-a., and S.M.; supervision, P.K. and P.P.; funding acquisition, A.K.-a. and P.S. All authors have read and agreed to the published version of the manuscript.
Funding
This research received no external funding.
Institutional Review Board Statement
This study was conducted in accordance with the Declaration of Helsinki and approved by the Human Research Ethics Committee of University of Phayao (protocol code HREC-UP-HSS 2.2/234/67 and date of approval 3 September 2024).
Informed Consent Statement
This study did not involve humans.
Data Availability Statement
The data that support the findings of this study are available on request from the corresponding author. The data are not publicly available due to their containing information that could compromise the privacy of research participants.
Acknowledgments
The research could not have been completed without the support of the historical tourist data from the State Railways of Thailand. We are also grateful for facility support from the Faculty of Logistics at Burapha University, Chonburi, the School of Business and Communication Arts, University of Phayao, Phayao, Thailand, and the Program Management Unit for Competitiveness Enhancement (PMU-C). Finally, we are grateful to the experts, authors, consultants, and sample data analysts in Thailand who have contributed to this research and helped to achieve its goals.
Conflicts of Interest
The authors declare no conflicts of interest for this study. In addition, the funders had no role in the design of the study; in the collection, analyses, or interpretation of data; in the writing of the manuscript; or in the decision to publish the results.
References
- Ministry of Tourism and Sports. Thailand Tourism Economic Outlook 2019; Ministry of Tourism and Sports: Bangkok, Thailand, 2019. [Google Scholar]
- Statista. Global Tourism Industry—Statistics & Facts; Statista Research Department: Hamburg, Germany, 2024. [Google Scholar]
- Cronjé, D.F.; du Plessis, E. A review on tourism destination competitiveness. J. Hosp. Tour. Manag. 2020, 45, 256–265. [Google Scholar] [CrossRef]
- Hartman, S. Destination governance in times of change: A complex adaptive systems perspective to improve tourism destination development. J. Tour. Futur. 2023, 9, 267–278. [Google Scholar] [CrossRef]
- Sun, Y.Y.; Lin, P.C.; Higham, J. Managing tourism emissions through optimizing the tourism demand mix: Concept and analysis. Tour. Manag. 2020, 81, 104161. [Google Scholar] [CrossRef] [PubMed]
- Sun, S.; Wei, Y.; Tsui, K.L.; Wang, S. Forecasting tourist arrivals with machine learning and internet search index. Tour. Manag. 2019, 70, 1–10. [Google Scholar] [CrossRef]
- Wang, D.G.; Niu, Y.; Qian, J. Evolution and optimization of China’s urban tourism spatial structure: A high speed rail perspective. Tour. Manag. 2018, 64, 218–232. [Google Scholar] [CrossRef]
- Hussain, M.N. Evaluating the impact of air transportation, railway transportation, and trade openness on inbound and outbound tourism in BRI countries. J. Air Transp. Manag. 2023, 106, 102307. [Google Scholar] [CrossRef]
- Lee, C.F.; Chen, K.Y. Exploring factors determining the attractiveness of railway tourism. J. Travel Tour. Mark. 2017, 34, 461–474. [Google Scholar] [CrossRef]
- Li, M.; Chen, J. High-speed rail network in China: The contribution of fast trains to regional tourism and economic development. Tour. Rev. 2020, 75, 414–432. [Google Scholar] [CrossRef]
- Statista. Tourism Industry in Thailand—Statistics & Facts; Statista Research Department: Hamburg, Germany, 2024. [Google Scholar]
- Lennon, J. Kanchanaburi and the Thai-Burma Railway: Disputed narratives in the interpretation of War. Int. J. Tour. Cities 2018, 4, 140–155. [Google Scholar] [CrossRef]
- SRT. State Railway of Thailand. 2024. Available online: https://www.railway.co.th/ (accessed on 24 December 2024).
- Severino, A.; Martseniuk, L.; Curto, S.; Neduzha, L. Routes planning models for railway transport systems in relation to passengers’ demand. Sustainability 2021, 13, 8686. [Google Scholar] [CrossRef]
- Peira, G.; Lo Giudice, A.; Miraglia, S. Railway and Tourism: A Systematic Literature Review. Tour. Hosp. 2022, 3, 69–79. [Google Scholar] [CrossRef]
- Hou, Z.; Liang, L.J.; Meng, B.; Choi, H.C. The role of perceived quality on high-speed railway tourists’ behavioral intention: An application of the extended theory of planned behavior. Sustainability 2021, 13, 12386. [Google Scholar] [CrossRef]
- Pham, V.-C.; Pham, N.-C. Developing the Hybrid Forecasting Model on The Short-Term Time Series. ICIC Express Lett. 2020, 14, 1017–1024. [Google Scholar]
- Kantasa-ard, A.; Nouiri, M.; Bekrar, A.; Ait el cadi, A.; Sallez, Y. Machine Learning in forecasting in the Physical Internet: A case study of agricultural products in Thailand. Int. J. Prod. Res. 2021, 59, 7491–7515. [Google Scholar] [CrossRef]
- Thuy, T.; Nguyen, H.; Abed, M.; Le, T.M.; Kantasa-ard, A. Toward a smart forecasting model in supply chain management: A case study of coffee in Vietnam. J. Forecast. 2024, 44, 173–199. [Google Scholar] [CrossRef]
- Febrian, D.; Al Idrus, S.I.; Nainggolan, D.A.J. The Comparison of Double Moving Average and Double Exponential Smoothing Methods in Forecasting the Number of Foreign Tourists Coming to North Sumatera. J. Phys. Conf. Ser. 2020, 1462, 012046. [Google Scholar] [CrossRef]
- Hyndman, P.R.; Koehler, P.A.; Ord, P.K.; Snyder, A.P.R. Forecasting with Exponential Smoothing: The State Space Approach; Springer Science & Business Media: Berlin/Heidelberg, Germany, 2008; ISBN 978-3-540-71916-8. [Google Scholar]
- Hyndman, R.; Kostenko, A.V. Minimum Sample Size Requirements For Seasonal Forecasting Models. Foresight 2007, 6, 12–15. [Google Scholar]
- Shahin, A. Using Multiple Seasonal Holt-Winters Exponential Smoothing to Predict Cloud Resource Provisioning. Int. J. Adv. Comput. Sci. Appl. 2016, 7, 91–96. [Google Scholar] [CrossRef]
- Taylor, J.W. Exponentially weighted methods for forecasting intraday time series with multiple seasonal cycles. Int. J. Forecast. 2010, 26, 627–646. [Google Scholar] [CrossRef]
- Chen, K.; Zhou, Y.; Dai, F. A LSTM-based method for stock returns prediction: A case study of China stock market. In Proceedings of the 2015 IEEE International Conference on Big Data (Big Data), Santa Clara, CA, USA, 29 October–1 November 2015; pp. 2823–2824. [Google Scholar] [CrossRef]
- Sagheer, A.; Kotb, M. Time series forecasting of petroleum production using deep LSTM recurrent networks. Neurocomputing 2019, 323, 203–213. [Google Scholar] [CrossRef]
- Greff, K.; Srivastava, R.K.; Koutnik, J.; Steunebrink, B.R.; Schmidhuber, J. LSTM: A Search Space Odyssey. IEEE Trans. Neural Netw. Learn. Syst. 2017, 28, 2222–2232. [Google Scholar] [CrossRef] [PubMed]
- Lapamonpinyo, P.; Derrible, S.; Corman, F. Real-Time Passenger Train Delay Prediction Using Machine Learning: A Case Study With Amtrak Passenger Train Routes. IEEE Open J. Intell. Transp. Syst. 2022, 3, 539–550. [Google Scholar] [CrossRef]
- Yaghini, M.; Khoshrafter, M.M.; Seyedabadi, M. Railway passenger train delay prediction via neural network model. J. Adv. Transp. 2013, 47, 355–368. [Google Scholar] [CrossRef]
- Noursalehi, P.; Koutsopoulos, H.N.; Zhao, J. Predictive decision support platform and its application in crowding prediction and passenger information generation. Transp. Res. Part C Emerg. Technol. 2021, 129, 103139. [Google Scholar] [CrossRef]
- Yao, E.; Hong, J.; Pan, L.; Li, B.; Yang, Y.; Guo, D. Forecasting Passenger Flow Distribution on Holidays for Urban Rail Transit Based on Destination Choice Behavior Analysis. J. Adv. Transp. 2021, 2021, 9922660. [Google Scholar] [CrossRef]
- Cadavid, J.P.U.; Lamouri, S.; Grabot, B.; Fortin, A. Machine Learning in Production Planning and Control: A Review of Empirical Literature. IFAC-Pap. 2019, 52, 385–390. [Google Scholar] [CrossRef]
- Peterson, R.; Silver, E.A. Decision Systems for Inventory Management and Production Planning; John Wiley & Sons, Ltd: New York, NY, USA, 1985. [Google Scholar]
- Shafiullah, G.M.; Thompson, A.; Wolfs, P.J.; Ali, S. Reduction of power consumption in sensor network applications using machine learning techniques. In Proceedings of the TENCON 2008—2008 IEEE Region 10 Conference, Hyderabad, India, 19–21 November 2008; pp. 1–6. [Google Scholar] [CrossRef]
- Acar, Y.; Gardner, E.S. Forecasting method selection in a global supply chain. Int. J. Forecast. 2012, 28, 842–848. [Google Scholar] [CrossRef]


Disclaimer/Publisher’s Note: The statements, opinions and data contained in all publications are solely those of the individual author(s) and contributor(s) and not of MDPI and/or the editor(s). MDPI and/or the editor(s) disclaim responsibility for any injury to people or property resulting from any ideas, methods, instructions or products referred to in the content. |
© 2025 by the authors. Licensee MDPI, Basel, Switzerland. This article is an open access article distributed under the terms and conditions of the Creative Commons Attribution (CC BY) license (https://creativecommons.org/licenses/by/4.0/).