Abstract
With increasing complexity and the demand for electronic components, evaluation boards that allow the customer to assess the components themselves are required. However, the evaluation boards are normally tested manually, and manual testing methods have challenges in terms of time efficiency, human error, and scalability. Therefore, we formulated an automated testing system based on robotic process automation (RPA) to address the issues. The system integrates RPA with existing testing hardware for high-speed analog-to-digital converter (ADC) evaluation boards to simplify processes of configuration, data logging, and the analysis of key parameters such as the signal-to-noise ratio full scale (SNRFS) and spurious-free dynamic range (SFDR). The current hardware setup was modified for automation to develop an RPA-based software solution for efficient testing, and its performance was compared with traditional methods in terms of time and repeatability. A marked improvement in test time efficiency was observed, with a reduction of up to 69.68% for inexperienced operators and 41.4% for experienced ones. The RPA-based method demonstrated a high accuracy (99.9603%) and repeatability, with minimal variance between test runs. The system provides an efficient and cost-effective test process that minimizes human intervention. This reduces process complexity for evaluation board functional testing, providing an effective solution to meet the growing demands of electronic components.
1. Introduction
With the advancement of technology, companies are required to produce new products. As such, new products must be evaluated to ascertain if they are appropriate for applications. This is why the evaluation boards (EVBs) are needed.
An EVB is a printed circuit board with an integrated circuit that has components performing multiple or specific functions according to the features of the product. It is used to develop systems, too. EVBs come in different generics, such as amplifiers, micro-electro-mechanical systems (MEMS), clocks, and microcontrollers. Presently, technology transforms real-world signals into quantized values seamlessly, which forms high-speed analog-to-digital converters (ADCs) for companies.
To ensure quality at the source, each EVB must be tested. Then, failures before release are found to meet customer demand. The current test setup involves manual bench assembly. This involves the manual attachment of Subminiature version A (SMA) cables between the EVB and test equipment [1,2,3]. With the increasing number of ADCs channels on the market, a complex setup is required as the sequential logging of channel measurements is necessary. This results in man-hours wasted on setting up the device under test (DUT) and multiple instances of data logging.
Test automation prevents problems in terms of conventional manual bench testing [4]. LabVIEW-based software has been used in hardware testing [5,6]. However, if the PCI eXtensions for Instrumentation (PXI) or modules are not capable or available in testing, there is a need to find a better or alternative solution, and robotics that process automation (RPA) can be used [7]. RPA adopts software robots with machine learning to handle repeatable and high-volume tasks and is the current trend in the IT industry [8]. RPA-based systems are also used in different areas, such as business processes, data analytics, software testing, and even consumer services [9,10,11].
In this study, we developed an RPA-based program to test high-speed ADC EVBs to support customer demand. We modified the hardware setup for the proposed automated test system to control equipment via software. RPA was developed to automatically test the device, log its data (specifically signal-to-noise ratio full scale (SNRFS) and spurious-free dynamic range (SFDR), and analyze the results. The results of the existing and proposed solution were compared in terms of the time taken between each test and the repeatability of collected data. The results contribute to test time reduction, the elimination of human errors, and the lessening of process complexity.
2. Literature Review
2.1. High-Speed ADC EVB Test
Most of the high-speed ADC EVB user guides have the start procedure from the configuration of the board up to using the software for testing [1,2,3].
2.1.1. Configuring Board
The hardware is prepared by configuring the EVB’s connections, power supplies, and jumpers/switches to set the operation mode.
2.1.2. Software for Testing
ADC data capture software—Visual Analog Version 1.9.48.1 is used to specify clock frequency, the fast Fourier transform (FFT) capture rate, data length, and the number of channels. The serial peripheral interface (SPI) controller was setup to configure device registers for SPI-based ADC communications. Input signal adjustment is conducted to ensure the input signal meets the required FFT magnitude. Guides for addressing communication issues with failed captures and abnormal plots are provided.
Figure 1 shows the equipment setup for testing the EVBs.
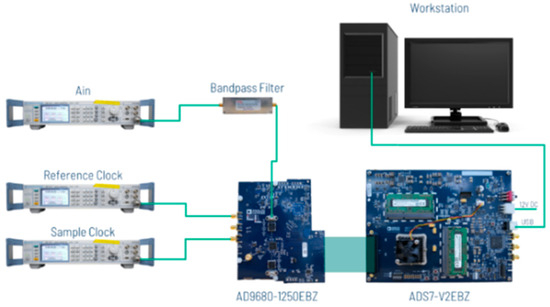
Figure 1.
Equipment setup for the existing method.
2.2. RPA
RPA allows users to automate repetitive digital tasks by creating robots that learn, mimic, and execute business processes based on set rules [12]. Automating routine processes reduces costs and frees up human resources for higher-priority tasks. RPA is installed on an employee’s computer to assist with high-volume activities, mimicking human actions such as recognizing on-screen characters, typing, and extracting data [13]. RPA involves two key processes: equipment control (simulating mouse/keyboard inputs and capturing real-time data) and image recognition (using optical character recognition (OCR) to convert text into machine-readable formats) [7]. Robots are trained by demonstrating steps rather than programming, making integration simpler [14]. The key benefits of RPA include reduced staffing costs, continuous operation, error elimination, faster task completion, and scalability. Robots can automate repetitive processes more efficiently than humans, helping businesses reduce task cycle times and costs while improving management [13].
2.3. Comparison of RPA Tools
As there is an array of tools for RPA, such as UIPath, Automation Anywhere, Blue Prism, Workfusion, Redwood, and Kryon, and there is a need to identify the most reasonable tool that should be used in tandem with testing EVBs.
Industrial reviews of RPA tools and their implementations have been used as the basis for the numerical data (with five being the highest) (Table 1). Due to its script-based design, Automation Anywhere’s software (Autiomation Anywhere Enterprise version 11) robot development and core functioning are implemented with higher accuracy, but it has the disadvantage of fewer users since it is script-based. Control room, system management, reporting, and resilience include the operating requirements and factors of the RPA tool. In this category, UIPath and Blue Prism have performed well. RPA analytics outlines the analytical potential of an RPA tool. Automation Anywhere’s Architecture is the most favorable since it provides a detailed process. In terms of security, Blue Prism has the most security, but UIPath and Automation Anywhere have similar security. Overall, UIPath has a higher technological score [15].

Table 1.
Comparative study based on technical aspects.
3. Methodology
3.1. Hardware
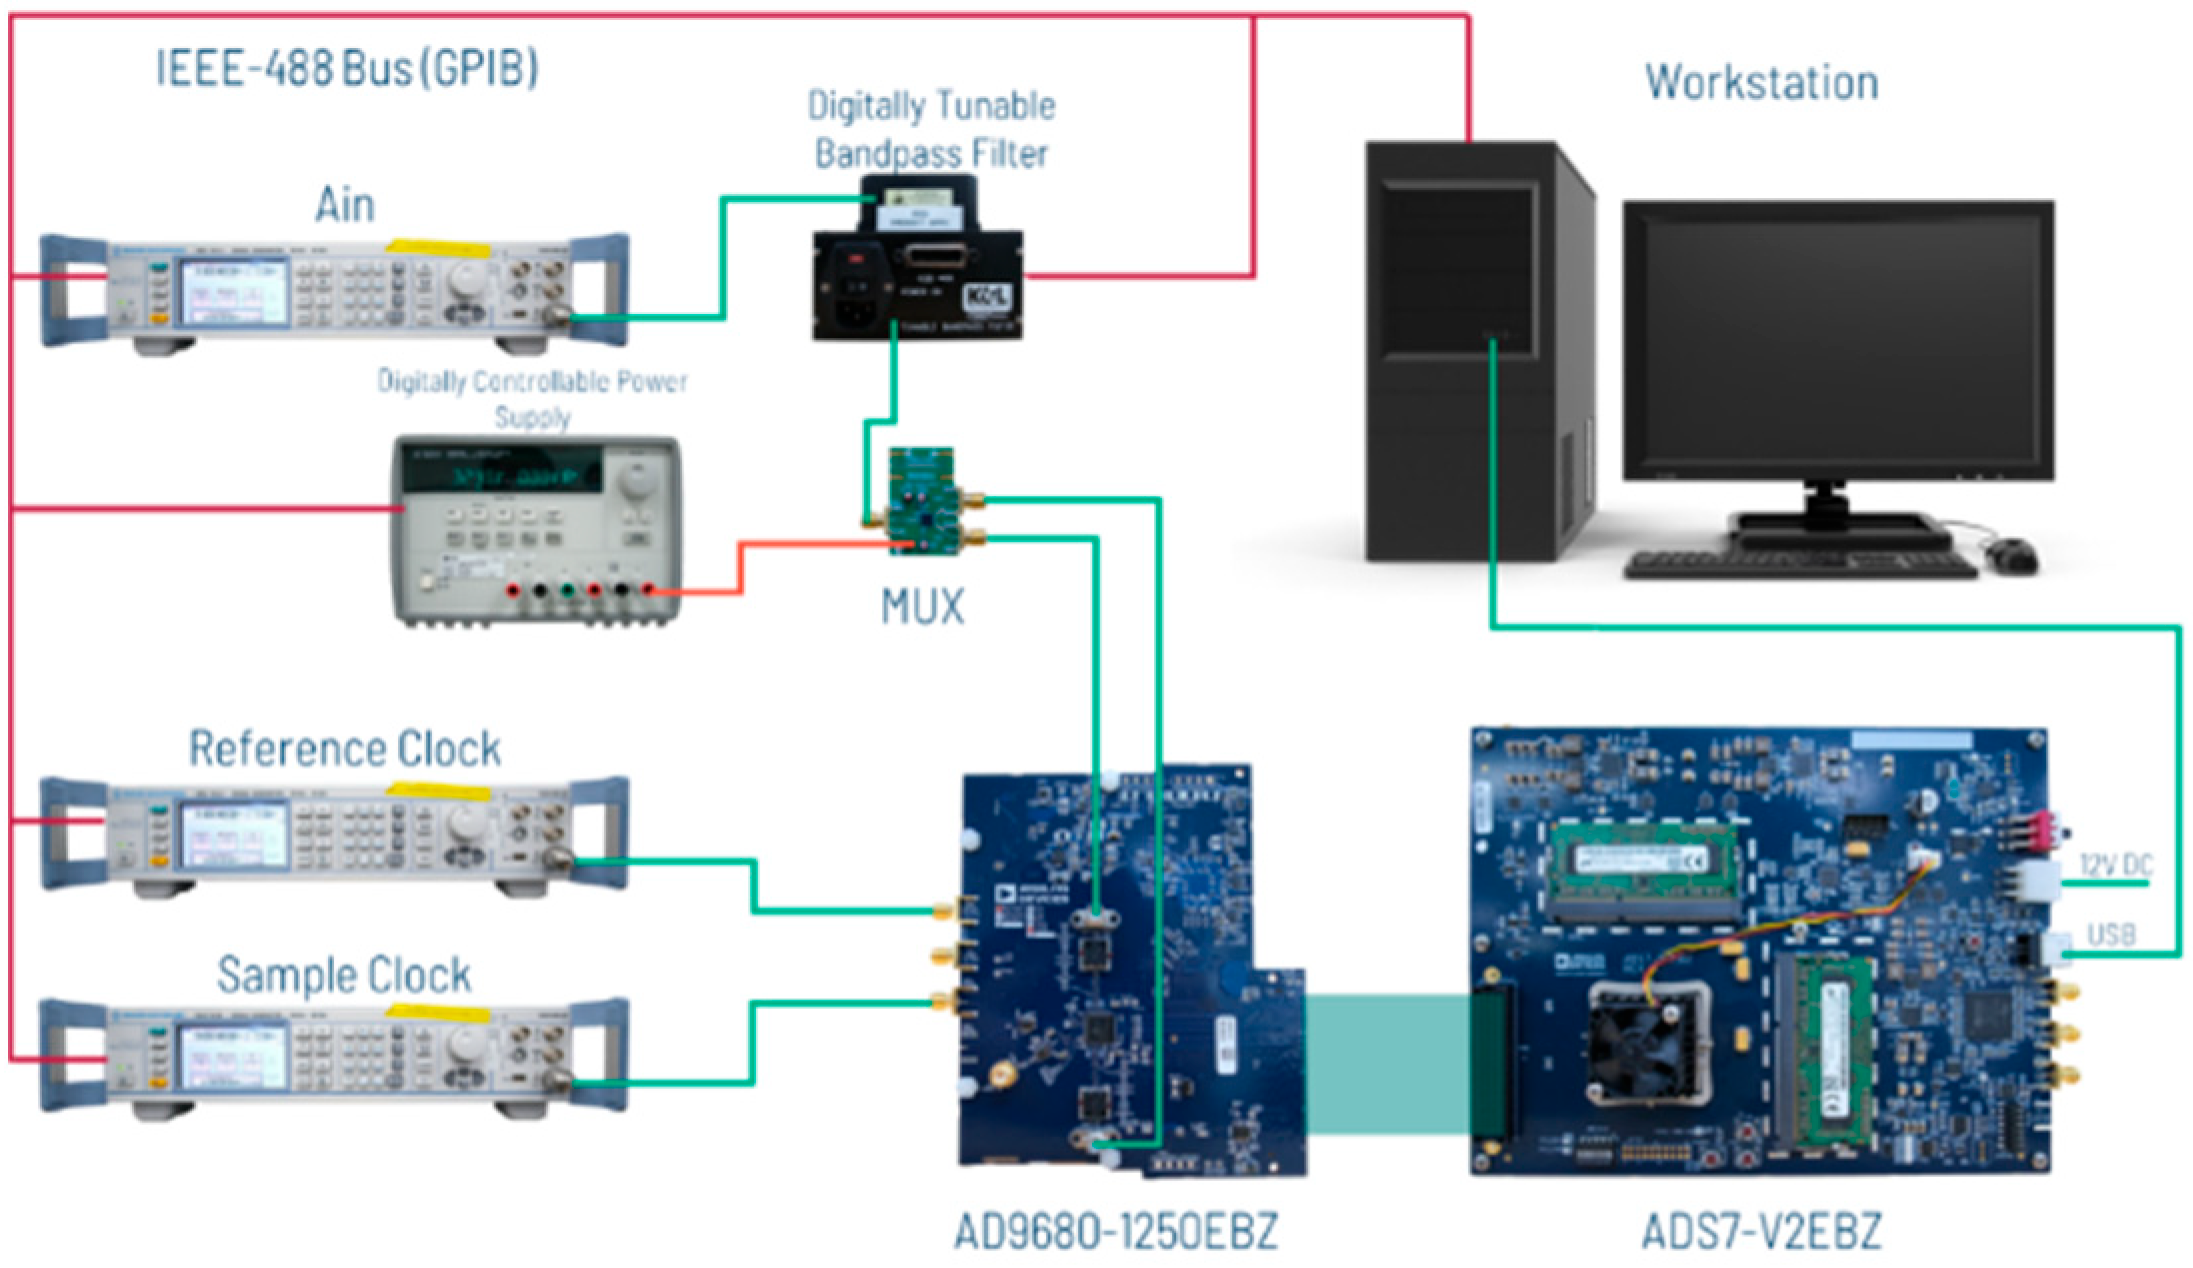
The setup for the proposed method (Figure 2) is similar to the existing one. The proposed setup adds the integration of the IEEE-488 Bus (GPIB). With this control, the centralized management of the equipment in the setup enables us to alter the power levels and frequencies of the signal generators. The signal generators are used as clock sources and analog input signal sources. The digitally tunable bandpass filter allows the setup of a one-size-fits-all solution as this changes the resonant frequency at the same time that the input frequency is changed according to the test procedure without the need to manually replace the connected bandpass filter. The multiplexer makes the entire automation possible and eliminates the need to manually reconnect the SubMiniature version A (SMA) cables from one channel to another. AD9680-1250EBZ is the perfect device to demonstrate this kind of feature.

Figure 2.
Equipment setup for proposed method.
3.2. Software
UIPath is used as an application to program for the RPA. The code is created with a flow, recording mouse clicks and keyboard presses while executing the test. Figure 3 shows the code outline developed in conjunction with this study. The code sequence starts with the user inputting the Serial No of the board being tested. The NI Max block involves the control of the test equipment, such as setting the frequency of the bandpass filter, powering up the multiplexer, and configuring the parameters for the sample clock and the reference clock. Meanwhile, the Visual Analog and SPI Controller blocks deal with the initialization and operation of the test software. The SPI Controller ensures that there is proper communication from the FPGA to the DUT. From there onwards, the code moves on to the Capture FFT A block. This block first checks the power level measured by the test software. With image recognition, the measurements from the Visual Analog are sent back to UIPath. For example, when the fundamental power is not met, UIPath then initiates equipment control using NI Max and adjusts the signal generator’s power accordingly.
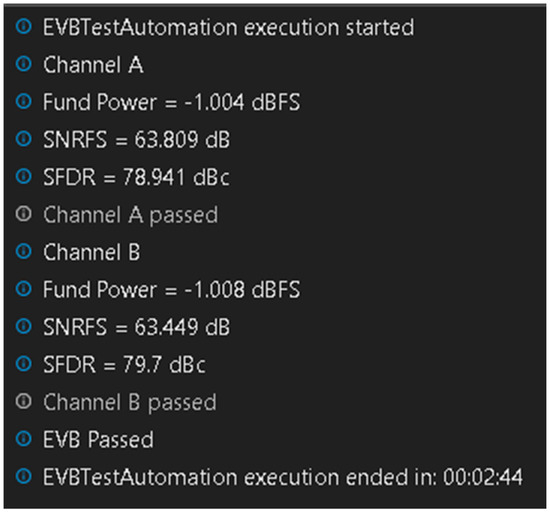
Figure 3.
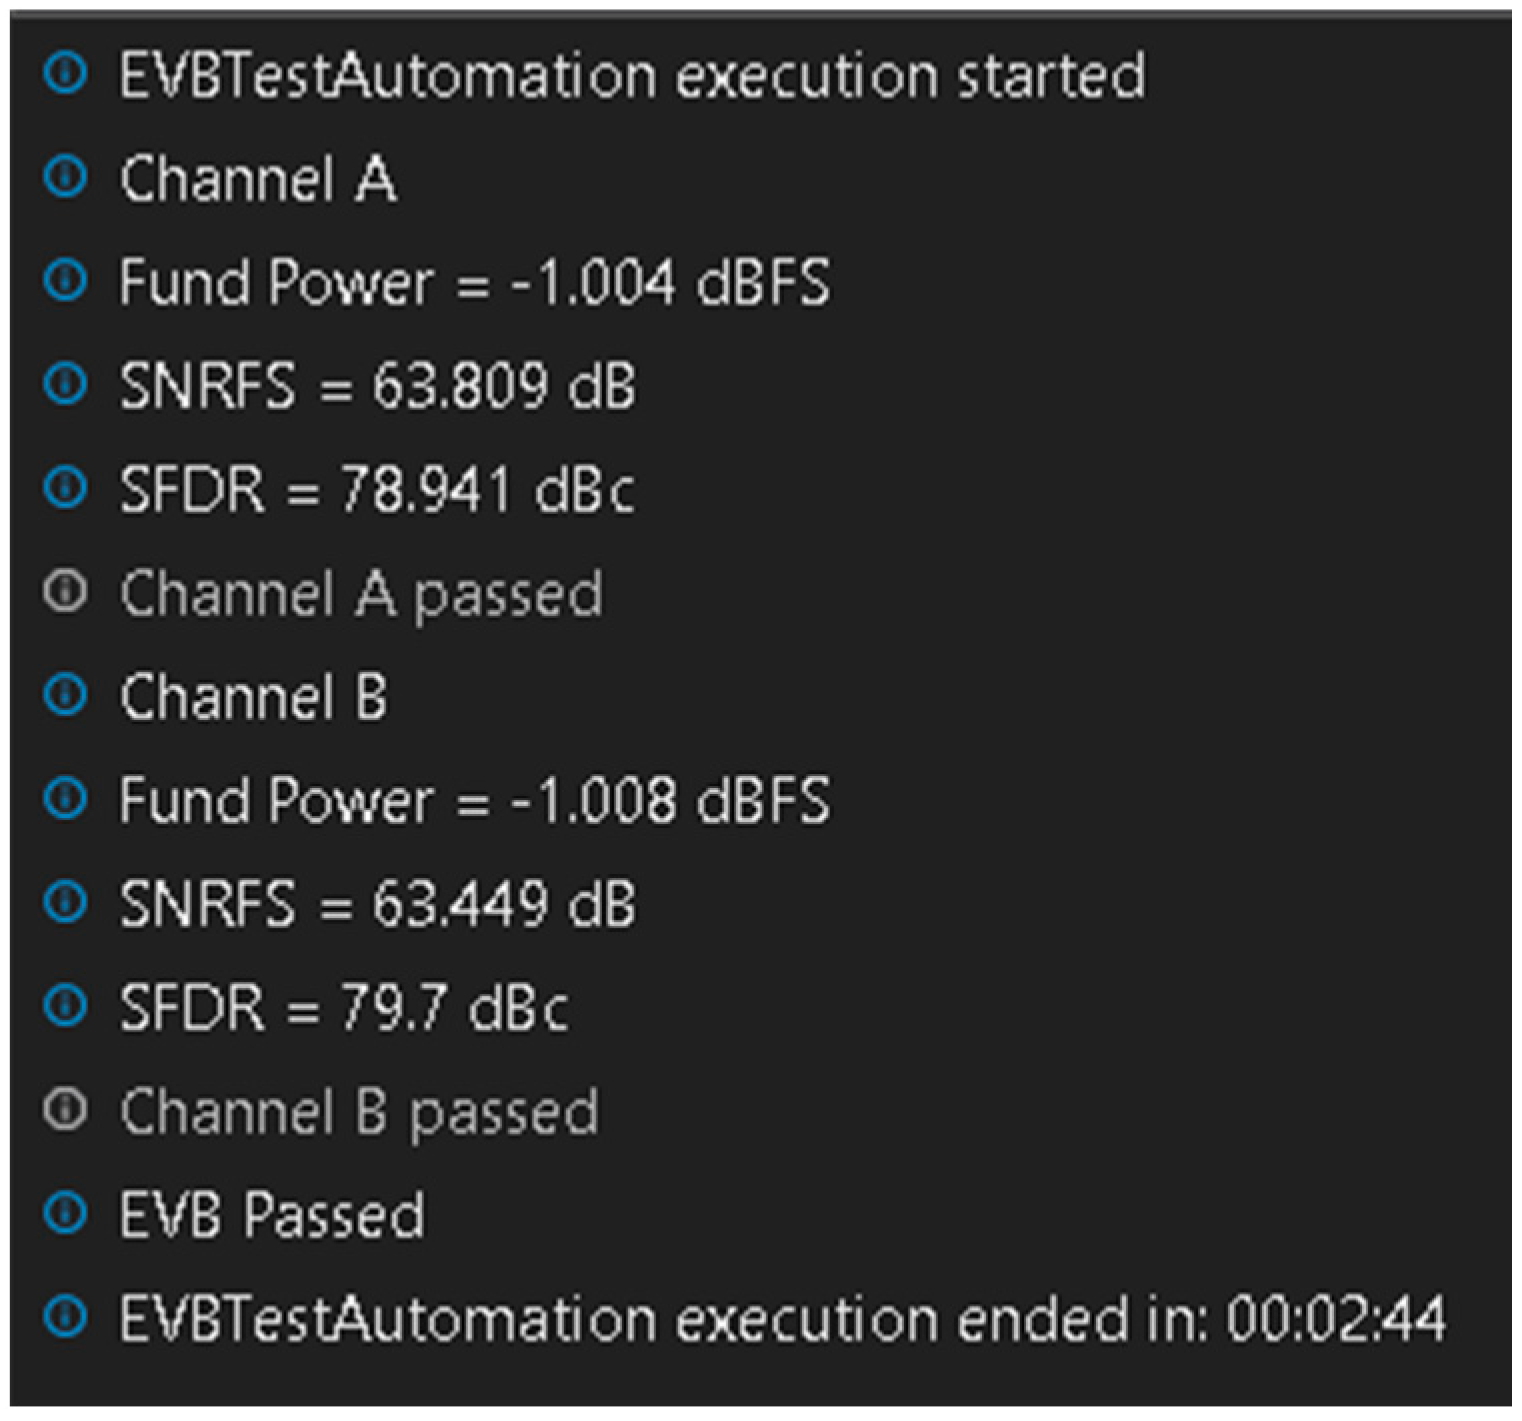
Text output obtained from image recognition.
At the end of the testing, data are obtained by taking a screenshot of the evaluation software output and deciding if that channel has passed both the SNRFS and SFDR limits. These steps are conducted in the Capture FFT B block. The only noticeable difference is the Set Switch to Channel B sub-block, which reconfigures the multiplexer to switch the connection from Channel A to B. After this, the program performs a clean-up, which involves terminating all applications in the Close Application block and finally shows if the DUT has passed or failed in the Final Result block. The inherent image recognition in the program enables it to output a text (Figure 4) in UIPath alongside an Excel File, which records board measurement data and whether they have passed or failed the test criteria.
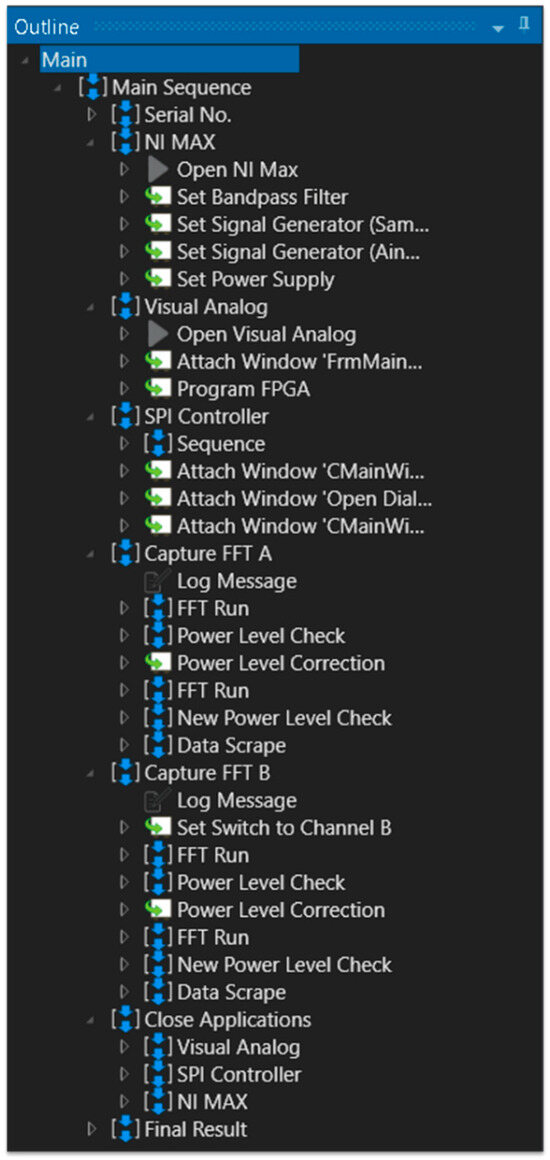
Figure 4.
UIPath code outline.
3.3. Validation
For the validation of the evaluation process, the repeatability of the proposed method was ensured by conducting 30 test runs in which the data for the Fund Power, SNRFS, and SFDR were recorded. This was the same configuration of parameters (frequency and power levels) used in the existing method. With this, the testing time per run was recorded and statistically analyzed. Data from both steps were contrasted to 10 different runs of the existing method. Half of the runs were conducted by an experienced operator, while the rest were conducted by an inexperienced one.
4. Results and Discussion
4.1. Repeatability
To ensure that the proposed method is accurate and precise, we proved its repeatability. From 30 runs in the proposed method and 10 runs for the existing method, the statistics of the SNRFS and SFDR for Channels A and B were obtained. The mean, standard deviation, and variance were calculated. Lower standard deviations indicated higher repeatability, meaning that the measurements were more consistent (Table 2 and Table 3).
Table 2.
Statistics of SNRFS and SFDR for proposed method.
Table 3.
Statistics of SNRFS and SFDR for existing method.
To prove the proposed method’s repeatability, an analysis of variance (ANOVA) was performed using the F-statistic. Table 4 shows the calculated F-values for the SNRFS and SFDR for Channels A and B of the existing and proposed methods. At a significance level of 0.05, no significant difference between the means of the proposed and existing methods was observed.
Table 4.
Statistical treatment—f-test.
The accuracy of the system was calculated using the mean absolute percentage error (MAPE) using (1). Table 5 shows the computed MAPE and accuracy for the proposed method.
Table 5.
MAPE and corresponding accuracies per test parameter.
The proposed method’s accuracy (from 99.9016% to 99.9960%, with a mean of 99.9603%) was exceptionally high, indicating that the method was similar to the existing method. With an MAPE of an average of 0.0397%, the differences between the proposed and existing methods were proven minimal.
4.2. Test Time Analysis
The proposed method showed a minimum time of 2:36 and a maximum time of 2:46. The mode, median, and mean times measured at 2:40. The existing method’s test time was measured using two operators. One was experienced (4:33.8 of the mean test time), while the other was a beginner (8:47.8 of the mean test time). This time reduction was presented as the efficiency of the proposed method. The time efficiency was calculated using (2) to estimate the improvement of the proposed method.
Table 6 shows that the proposed method showed a significant improvement in efficiency when the process was automated. The time spent was shortened from 41.57% (beginner) to 69.68% (experienced). By assuming that both operators were equally important, their average efficiency was improved by 55.63%.
Table 6.
Efficiency calculation of test time for the existing method versus RPA.
For a more in-depth analysis of the mean time reduction, the t-test was conducted to compare the means of the two methods. Population variances were assumed to be unequal. The t statistic was 4.7933, with the computed degrees of freedom being nine. Table 7 shows that the mean time of the proposed method was significantly shorter than the mean of the existing method.
Table 7.
Statistical treatment—t-test.
5. Conclusions
RPA is not only limited to high-speed ADCs but can be introduced to other business strategies using evaluation software and hardware with digital interfaces. The implementation of the proposed system in other ADI EVBs might be difficult as efficiency and simplicity might be outweighed. With the proposed method, factors that substantially alter the recorded measurements are considered. There was no significant difference found between the existing and proposed methods. Both show high accuracy and low MAPE, and the proposed method is almost identical to the existing method. The efficiency improved from 41.57 to 69.68% in its testing time for AD9680-1250EBZ. This shows a significant cost reduction in man-power allocation. A person can perform different tasks at the same time, creating more value for the company. The results of this study provide a reference for the functional test automation of other types of EVBs, such as DACs and MEMS.
Author Contributions
Conceptualization, A.D.A.; Methodology, A.D.A. and G.M.; Hardware, A.D.A.; Software, A.D.A.; Validation, A.D.A. and G.M.; Results & Discussion, A.D.A. and G.M.; Original Draft Preparation, A.D.A.; Review and Editing, A.D.A. and G.M. All authors have read and agreed to the published version of the manuscript.
Funding
This research received no external funding.
Institutional Review Board Statement
Not applicable.
Informed Consent Statement
Not applicable.
Data Availability Statement
The data presented in this study are available upon request from the corresponding author.
Acknowledgments
We would like to express our gratitude to the instructors of Mapua University and colleagues at Analog Devices for giving insightful suggestions and their continuous assistance during the development of this work.
Conflicts of Interest
The authors declare no conflict of interest.
References
- Analog.com. Evaluating the AD9650/AD9268/AD9258/AD9251/AD9231/AD9204/ AD9269/AD6659 Analog-to-Digital Converters. Available online: https://www.analog.com/media/en/technical-documentation/user-guides/UG-003.pdf (accessed on 16 December 2019).
- Analog.com. Evaluating the AD9265/AD9255 Analog-to-Digital Converters. Available online: https://www.analog.com/media/en/technical-documentation/user-guides/UG-074.pdf (accessed on 16 December 2019).
- Analog.com. Evaluating the AD9643/AD9613/AD6649/AD6643 Analog-to-Digital Converters. Available online: https://www.analog.com/media/en/technical-documentation/user-guides/UG-293.pdf (accessed on 16 December 2019).
- Gade, A.; Angal, Y. Automation In Library Management Using LabVIEW. In Proceedings of the International Conference on Computing Communication Control and Automation (ICCUBEA), Pune, India, 12–13 August 2016. [Google Scholar]
- Ćatić, V.; Lukić, N.; Salom, I.; Ristić, V.; Kabović, M.; Nenadić, N. An Automated Environment for Hardware Testing Using PXI Instrumentation and LabVIEW Software. In Proceedings of the 24th Telecommunications Forum (TELFOR), Belgrade, Serbia, 22–23 November 2016. [Google Scholar]
- Neškovi, M.; Spasić, J.; Ćelebić, V.; Salom, I. An Automated Hardware Testing Using PXI Hardware and LabVIEW Software. In Proceedings of the 5th European Conference on Circuits and Systems for Communications (ECCSC’10), Belgrade, Serbia, 23–25 November 2010. [Google Scholar]
- Lin, S.; Shih, L.; Yang, D.; Lin, J.; Kung, J. Apply RPA (Robotic Process Automation) in Semiconductor Smart Manufacturing. In Proceedings of the E-Manufacturing & Design Collaboration Symposium (eMDC), Hsinchu, Taiwan, 7 September 2018. [Google Scholar]
- Yatskiv, S.; Voytyuk, I.; Yatskiv, N.; Kushnir, O.; Trunfanova, Y.; Panasyuk, V. Improved Method of Software Automation Testing Based on the Robotic Process Automation Technology. In Proceedings of the 9th International Conference on Advanced Computer Information Technologies (ACIT), Ceske Budejovice, Czech Republic, 5–7 June 2019. [Google Scholar]
- Romao, M.; Costa, J.; Costa, C. Robotic Process Automation: A case study in the Banking Industry. In Proceedings of the 14th Iberian Conference on Information Systems and Technologies (CISTI), Coimbra, Portugal, 19–22 June 2019. [Google Scholar]
- Raissa, U.; Zhyldyz, K.; Ryskhan, S.; Aiman, M.; Aizhan, K. Applying of RPA in administrative processes of public administration. In Proceedings of the IEEE 21st Conference on Business Informatics (CBI), Moscow, Russia, 15–17 July 2019. [Google Scholar]
- Kobayashi, T.; Tanimoto, S.; Sato, H.; Kanai, A. Communication Robot for Elderly based on Robotic Process Automation. In Proceedings of the IEEE 43rd Annual Computer Software and Applications Conference (COMPSAC), Milwaukee, WI, USA, 15–19 July 2019. [Google Scholar]
- UIPath. Robotic Process Automation (RPA). Available online: https://www.uipath.com/rpa/robotic-process-automation (accessed on 18 July 2021).
- Automation Anywhere. What is Robotic Process Automation (RPA)? An Enterprise Guide. Available online: https://www.automationanywhere.com/rpa/robotic-process-automation (accessed on 29 July 2021).
- Lavrov, P.S.I.; Petyuk, S.I. Robotic Process Automation. Sci. Notes Young Res. 2017, 6, 43–45. [Google Scholar]
- Issac, R.; Muni, R.; Desai, K. Delineated Analysis of Robotic Process Automation Tools. In Proceedings of the Second International Conference on Advances in Electronics, Computer and Communications (ICAECC-2018), Bangalore, India, 9–10 February 2018. [Google Scholar]


Disclaimer/Publisher’s Note: The statements, opinions and data contained in all publications are solely those of the individual author(s) and contributor(s) and not of MDPI and/or the editor(s). MDPI and/or the editor(s) disclaim responsibility for any injury to people or property resulting from any ideas, methods, instructions or products referred to in the content. |
© 2025 by the authors. Licensee MDPI, Basel, Switzerland. This article is an open access article distributed under the terms and conditions of the Creative Commons Attribution (CC BY) license (https://creativecommons.org/licenses/by/4.0/).