Proceeding Paper

Menstruation-Related Physical Condition Management for Women Using an Underwear-Type Wearable Biosensor †

1
Graduate School of Engineering Science, Osaka University, Toyonaka 560-8531, Japan
2
Department of Food and Nutrition, Tsu City College, Tsu 514-0112, Japan
3
Graduate School and Faculty of Information Science and Electrical Engineering, Kyushu University, Fukuoka 819-0395, Japan
*
Author to whom correspondence should be addressed.
Presented at the 2024 IEEE 6th Eurasia Conference on IoT, Communication and Engineering, Yunlin, Taiwan, 15–17 November 2024.
Eng. Proc. 2025, 92(1), 5; https://doi.org/10.3390/engproc2025092005
Published: 10 April 2025
(This article belongs to the Proceedings of 2024 IEEE 6th Eurasia Conference on IoT, Communication and Engineering)

Abstract

:
Many females experience physical problems caused by menstruation, such as menstrual cramps and premenstrual syndrome, which disrupt their daily lives and work. Knowing when menstruation begins is essential for managing such physical conditions. However, menstrual periods are not always cyclic and can be extended by physical and mental stress. Currently used menstrual management applications rely on self-reported cycle length and basal body temperature (BBT), which makes it challenging to predict irregular periods. Advances in smart wearables have made continuous, non-invasive health monitoring accessible, such as heart rate variability (HRV). HRV characteristics reflect autonomic nervous system activity and are used as physical and mental health status indices. This study aims to explore the relationship between HRV indices and the menstrual cycle using smart wearables. A total of 13 females aged from 18 to 20 participated in this study and measured their indices using an underwear-type wearable device for six months. The device measured HRV and body acceleration. Participants recorded their BBT every morning and answered questionnaires about their physical and mental status every morning and evening. They also reported the start and end dates of menstruation. The HRV data were split into sleep and wake phases using acceleration and calculated time- and frequency-domain HRV indices. Cross-correlation and regression analysis were conducted to assess the relation between the menstrual cycle and phases, such as follicular and luteal, and the HRV indices. A significant relationship between HRV indices and the menstrual cycle length was found, particularly in the difference between the follicular and luteal phases of HRV indices. This difference showed a relatively high association with menstrual cycle length. Importantly, the regression analysis results suggested that HRV indices can be used to predict the length of the menstrual cycle and potential physical and mental disorders. These findings significantly contributed to menstrual health management and the Femtech industry.

1. Introduction

Female menstrual problems are of significant concern worldwide. Menstruation causes a variety of symptoms, causing students to miss classes and employees to be absent. Many studies on menstruation have been conducted around the world as it is crucial to solve problems related to menstruation [1,2,3]. There are two types of disorders related to menstruation. Dysmenorrhea begins just before the menstrual period. The symptoms include lower abdominal pain and back pain, which disappear with the end of the menstrual cycle. The other is premenstrual syndrome (PMS), which begins 3 to 10 days before the start of menstruation and causes physical symptoms such as lower abdominal pain as well as mental symptoms such as irritability.
The prediction of the next menstrual date and the next ovulation date is crucial for women’s schedule management, considering such physical and mental conditions. In addition, for those hoping to become pregnant, knowing the correct ovulation date is of great interest. Ovulation occurs between the follicular and luteal phases, and the days immediately before ovulation are the most fertile [4]. However, the menstrual cycle is not perfectly cyclic, and variations must be considered. Currently used menstrual management applications are self-recorded, such as average values of past menstrual cycles and daily basal body temperature (BBT). BBT has been used for menstrual management because it reflects the secretion of female hormones, which vary with menstrual phases. It indicates a low-temperature phase during the follicular phase and a high-temperature phase during the luteal phase [5]. However, the biphasic clarity of BBT is not sufficient to detect the ovulation date accurately, and prediction models of menstruation cycle length are solely based on such self-reported data lack accuracy [6].
Recently, there has been a remarkable development in smart wearables. Smart wearables measure healthcare data such as heart rate and heart rate variability (HRV) non-invasively and continuously. HRV is the length of time between heartbeats (R-R intervals) and is used as an indicator of physical and mental health as it reflects the effects of autonomic nervous system activity [7,8]. Many smart wearables have been developed for women, including underwear-type smart wearables. This innovative technology, called Femtech, holds the potential to address unique women’s health issues, such as menstruation, and brings hope to the future of healthcare technology.
In this study, we assume that HRV indices capture changes in physical and mental conditions related to menstruation. With this in mind, we have clarified the relationship between HRV indices and menstrual cycle length using data measured by smart wearables.

2. Methods

2.1. Dataset

The dataset includes long-term and thorough data, consisting of measurements from 14 female college students (18–20 years old). One participant was excluded because her participation was terminated in the middle of the experiment. The participants’ data are listed in Table 1. Participants wore underwear-type wearable devices for six months, and HRV and body acceleration were measured continuously. In addition, they recorded their BBT every morning and answered questionnaires about their physical and mental condition every morning and evening. We designed the questionnaire to ask participants to rate their sleepiness and fatigue/weariness on a scale of 1 to 10. The scores indicated their physical and mental condition on a five-point scale and any symptoms they had. At the same time, the beginning and end of menstruation were also recorded. Before measurement, a preliminary questionnaire survey was conducted regarding the severity of PMS symptoms. The pre-survey questionnaire included the options of “none”, “weak”, “moderate”, and “strong” symptoms for 56 different symptoms during the premenstrual, menstrual, and postmenstrual periods, respectively.

2.2. HRV Indices

We resampled the measured HRV (R-R intervals) time series at 2 Hz. We then separated sleep and wakefulness under the condition that the time of day was between 8 PM and 12 AM. The one-hour average of body acceleration on the y-axis was greater than or equal to −0.5 G. Finally, the seven HRV indices were calculated for both sleeping and being awake for 24 h (Table 2).

2.3. Spearman’s Rank Correlation Coefficient

We used Spearman’s rank correlation coefficient to examine the relationship between HRV indices and the menstrual cycle length. This correlation coefficient is a nonparametric index that does not assume a normal distribution. We initially calculated the correlation coefficient between the HRV indices calculated for each phase and the menstrual cycle length. In this study, the participants recorded the beginning and end of their menstrual periods. Therefore, we defined the period excluding the menstrual phase within the first 14 days from the start of menstruation as the follicular phase and the 14 days counting backward from the start of menstruation as the luteal phase. Hereafter, the menstrual phase refers to the recorded period, and the follicular and luteal phases refer to the periods calculated using the described method.
The production of female hormones changes when the phases shift. More estrogen is secreted in the first half of the menstrual cycle, while more progesterone is secreted in the second half. The balance of these female hormones, which varies depending on the phase, affects menstrual cycle length. We hypothesized that HRV reflects changes in hormonal balance during the changing menstrual phases and focused on the differences in HRV indices calculated for each phase.
In addition, for females, knowing the length of the menstrual cycle, i.e., when the next menstruation begins, is helpful for scheduling, so the earlier such a prediction is made, the better results are obtained. Therefore, to determine the time for better prediction of the length of the menstrual cycle with constant quality, we varied the data to calculate HRV by extending it by one day and examined the evolution of the correlation coefficients.

2.4. Linear Mixed Effect Model

Advanced models such as deep learning have often been used in recent years to make predictions but such methods require huge data sizes to predict accurately. In addition, one characteristic of the data, the magnitude of problems related to menstruation, shows significant differences among participants. Therefore, in this study, we analyzed the dataset using a linear mixed effects model to solve these issues [9,10]. The linear mixed effect model (1) is a linear regression model with two types of terms—fixed and random effects—and is an effective analytical method for data that captures both population and individual variation.
Y = + Zb + ε
(Y: dependent variable; : design matrix and vector for fixed effects; Zb: design matrix and vector for random effects; ε: vector of observation errors).
Fixed effects represent population variation, while random effects represent individual variation. Using these parameters, the linear mixed effects model captures data characteristics measured from the same individuals. Since the menstrual cycles used in this study varied by individual and the population, the strengths of the linear mixed effects model need to be exploited further.

3. Results and Discussion

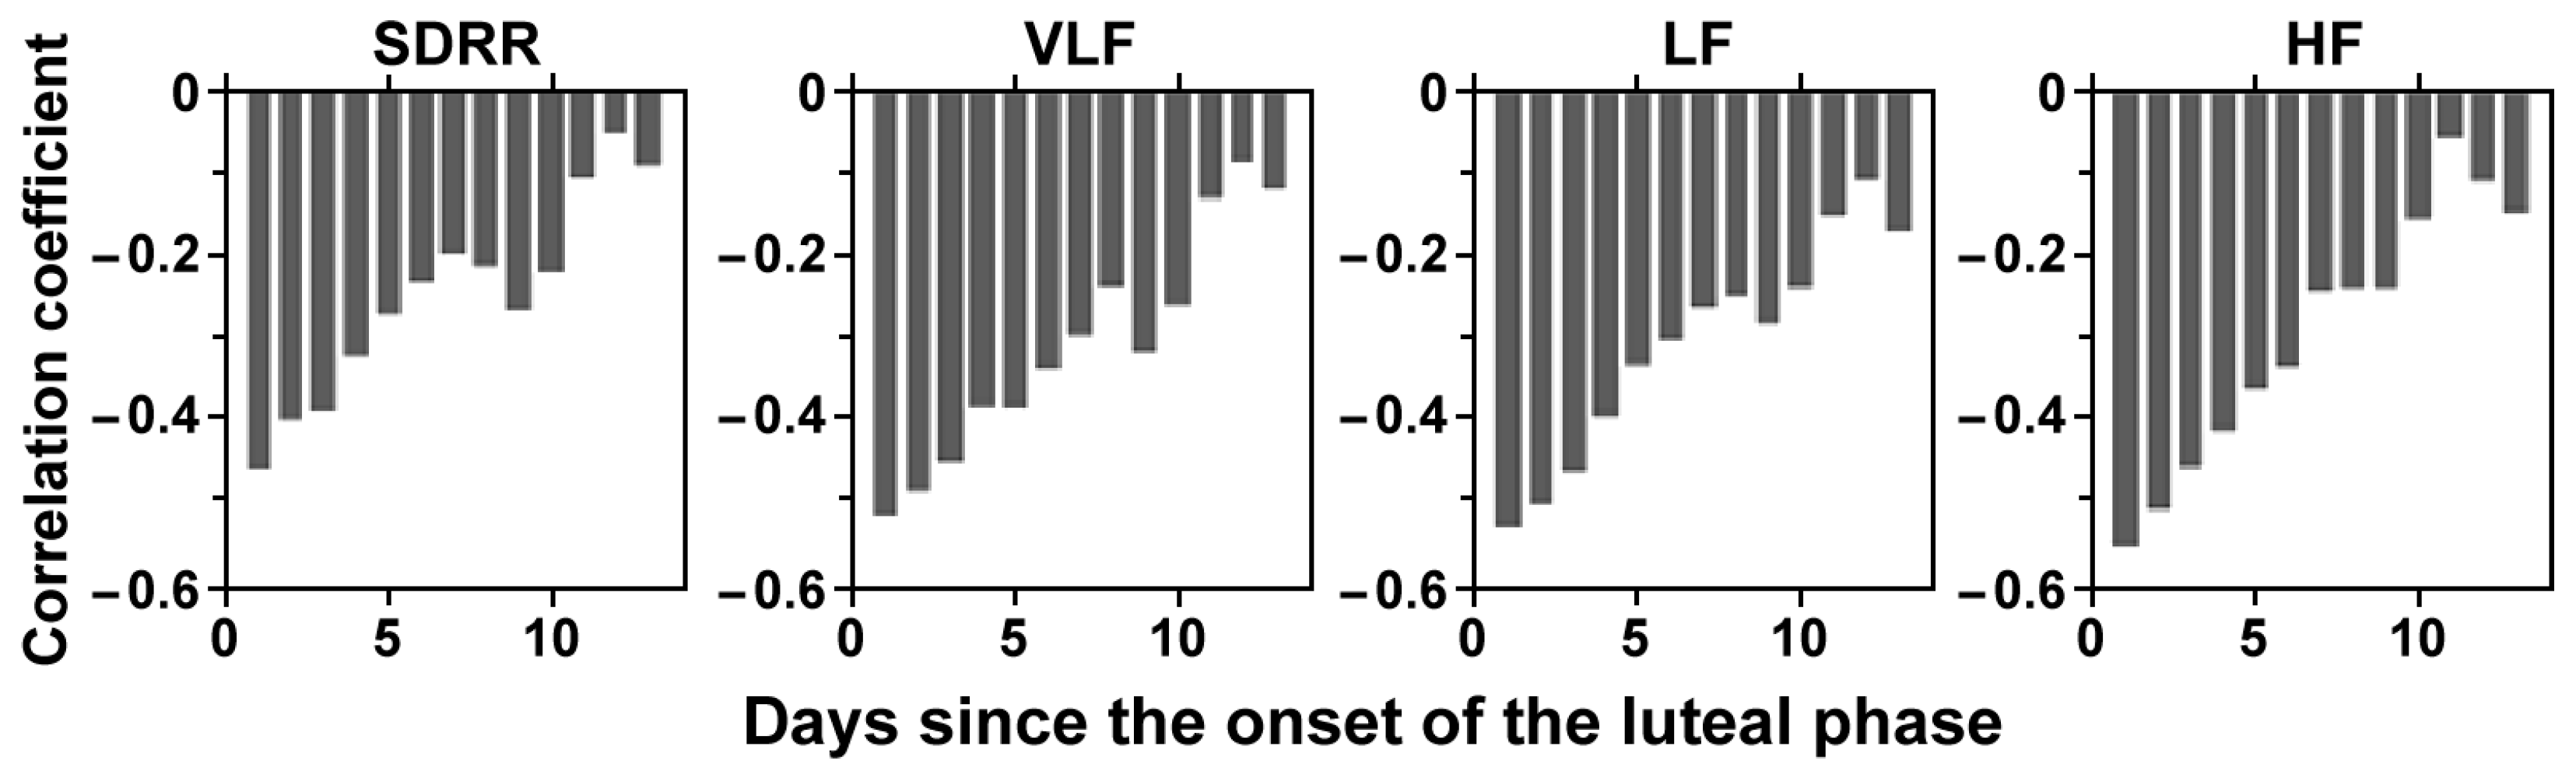
3.1. Cross-Correlation Analysis

We calculated HRV indices in each menstrual, follicular, and luteal phase, and investigated correlation coefficients between those indices and the length of the menstrual cycle. As a result, no HRV index exceeded a correlation coefficient of 0.4, presenting a moderate correlation. Table 3 shows the correlation coefficients between the difference in HRV indices calculated for each phase and menstrual cycle. Pre-luteal in Table 3 refers to the 14 days immediately preceding the series of periods for which menstrual cycle length was recorded. We found a higher correlation coefficient than 0.4 for SDRR, VLF, LF, and HF during wakefulness. We also investigated differences in HRV indices calculated for the follicular and menstrual phases, respectively, and found no correlations higher than 0.4.
Figure 1 shows the results of varying the data from Day 1 to 14 after the start of menstruation for the top four HRV indices with the highest correlation coefficients in Table 3. The correlation coefficients for all indices increased around Day 5. This suggests that factors influencing the start of the next menstruation are largely present in the menstrual phase. Figure 2 shows the results of varying the data from Day 14 to 28 after the start of menstruation for the four highest HRV indices with the highest correlation coefficients in Table 3. The correlation coefficients decreased as the period lengthened, indicating that the HRV indices are not immediate factors determining the start of the next menstruation, but that instead there are other factors with a time lag that influence the start of the menstruation after the next cycle starts.

3.2. Regression Analysis

The results of the correlation coefficient analysis showed a relationship between the HRV indices and the menstrual cycle length. Therefore, we investigated the possibility of predicting menstrual cycle length from the difference in the HRV indices calculated for the menstrual phase and pre-luteal phase. The features used in the linear mixed effects model were selected by excluding features that showed little correlation between the feature and the length of the menstrual cycle, which ranged from −0.2 to 0.2. We excluded SDNN which largely correlated with other indices. After that, we used VIF to select only valid features, with a VIF smaller than 10 for multicollinearity. Due to the results of the above methods, we chose RMSSD and VLF for waking and RMSSD and HF for sleeping. The results of the regression analysis using the linear mixed effects model are shown in a Brandt–Altman plot (Figure 3). The dotted lines indicate the acceptable range, represented by “the mean of the differences ± 1.96 × the standard deviation of the differences”. Since most points fall within the acceptable range, it is possible to predict the menstrual cycle length using HRV indices.

4. Conclusions

In this study, we investigated the relationship between HRV indices and the menstrual cycle, using the long-term measurement of RR intervals made possible by smart wearables. The difference in HRV indices calculated in the menstrual or follicular phase and the luteal phase immediately before that phase was linked to the menstrual cycle length. The regression analysis results also indicated that these indices serve as predictive tools for the future start date of menstruation. The linear mixed effects model underscores the significant role of individual differences among women in this context. This highlights the need for personalized care, as the severity of symptoms and other external factors vary for each individual. The study’s results offer a positive future for women suffering from menstrual disorders and underscore the potential of Femtech, including underwear-type smart wearables for women. The related technology needs to be developed further in the future, with a focus on individualized approaches in women’s health.

Author Contributions

Conceptualization, T.N. and K.K. (Ken Kiyono); methodology, T.N.; formal analysis, T.N.; investigation, Y.A. and M.K.; resources, K.K. (Ken Kiyono); data curation, Y.A.; writing—original draft preparation, T.N. and K.K. (Kyosuke Kato); writing—review and editing, T.N., M.K. and K.K. (Ken Kiyono); visualization, T.N. and K.K. (Ken Kiyono); supervision, K.K. (Ken Kiyono); project administration, K.K. (Ken Kiyono); funding acquisition, K.K. (Ken Kiyono). All authors have read and agreed to the published version of the manuscript.

Funding

This work was supported partially by JSPS KAKENHI Grant No. 23K26341.

Institutional Review Board Statement

This study was conducted in accordance with the Declaration of Helsinki and was approved by the Ethics Committee of the Graduate School of Engineering Science, Osaka University (protocol code: R3-7-1 and 4 March 2022).

Informed Consent Statement

Informed consent was obtained from all subjects involved in the study.

Data Availability Statement

The original data are unavailable due to privacy or ethical restrictions.

Conflicts of Interest

The authors declare no conflict of interest.

References

  1. Critchley, H.O.D.; Babayev, E.; Bulun, S.E.; Clark, S.; Garcia-Grau, I.; Gregersen, P.K.; Kilcoyne, A.; Kim, J.-Y.J.; Lavender, M.; Marsh, E.E.; et al. Menstruation: Science and society. Am. J. Obstet. Gynecol. 2020, 223, 624–664. [Google Scholar] [CrossRef] [PubMed]
  2. Li, K.; Urteaga, I.; Shea, A.; Vitzthum, V.J.; Wiggins, C.H.; Elhadad, N. A predictive model for next cycle start date that accounts for adherence in menstrual self-tracking. J. Am. Med. Inform. Assoc. 2022, 29, 3–11. [Google Scholar] [CrossRef] [PubMed]
  3. Tatsumi, T.; Sampei, M.; Saito, K.; Honda, Y.; Okazaki, Y.; Arata, N.; Narumi, K.; Morisaki, N.; Ishikawa, T.; Narumi, S. Age-dependent and seasonal changes in menstrual cycle length and body temperature based on big data. Obstet. Gynecol. 2020, 136, 666–674. [Google Scholar] [CrossRef] [PubMed]
  4. Wilcox, A.J.; Weinberg, C.R.; Baird, D.D. Timing of sexual intercourse in relation to ovulation—Effects on the probability of conception, survival of the preg-nancy, and sex of the baby. N. Engl. J. Med. 1995, 333, 1517–1521. [Google Scholar] [CrossRef] [PubMed]
  5. Baker, F.C.; Siboza, F.; Fuller, A. Temperature regulation in women: Effects of the menstrual cycle. Temperature 2020, 7, 226–262. [Google Scholar] [CrossRef] [PubMed]
  6. Barron, M.L.; Fehring, R.J. Basal body temperature assessment: Is it useful to couples seeking pregnancy? MCN Am. J. Matern. Child Nurs. 2005, 30, 290–296. [Google Scholar] [CrossRef] [PubMed]
  7. Acharya, U.R.; Joseph, K.P.; Kannathal, N.; Lim, C.M.; Suri, J.S. HRV: A review. Med. Biol. Eng. Comput. 2006, 44, 1031–1051. [Google Scholar]
  8. Shaffer, F.; Ginsberg, J.P. An overview of HRV metrics and norms. Front. Public Health 2017, 5, 258. [Google Scholar] [CrossRef] [PubMed]
  9. Pinheiro, C.; Bates, D.M. Linear mixed-effects models: Basic concepts and examples. In Mixed-Effects Models in Sand S-PLUS; Springer: Berlin/Heidelberg, Germany, 2000; pp. 3–56. [Google Scholar]
  10. Tang, M.; He, Y.; Zhang, X.; Li, H.; Huang, C.; Wang, C.; Gao, Y.; Li, Y.; Kan, H.; Hu, J.; et al. The acute effects of temperature variability on HRV: A repeated-measure study. Environ. Res. 2021, 194, 110655. [Google Scholar] [CrossRef] [PubMed]
Figure 1. Change in the correlation coefficient of the differences in the HRV indices between the follicular and luteal phases and the menstrual cycle length when the length of the follicular phase used to calculate the HRV indices is changed.
Engproc 92 00005 g001
Figure 2. Change in the correlation coefficient of the differences in the HRV indices between the follicular and luteal phases and the menstrual cycle length when the length of the luteal phase used to calculate the HRV indices is changed.
Engproc 92 00005 g002
Figure 3. Brandt–Altman plot consisting of menstrual cycle length recorded and predicted by a linear mixed effects model.
Engproc 92 00005 g003
Table 1. Participants’ data.
CharacteristicsData (Mean ± SD)
Age19.0 ± 0.71
Body mass index21.6 ± 2.20
Menstruation cycle length30.4 ± 4.6
Table 2. HRV indices.
IndexIndex Description
MeanRRMean of R-R intervals.
SDRRStandard deviation of R-R intervals.
RMSSDSquare root of the mean of the squares of the differences between adjacent R-R intervals.
VLFPower in the frequency band of 0.003–0.04 Hz.
LFPower in the frequency band of 0.04–0.15 Hz.
HFPower in the frequency band of 0.15–0.4 Hz.
LF/HFThe value of LF divided by HF.
Table 3. Correlation coefficient between differences in HRV indices calculated for each phase and length of menstrual cycle (correlation coefficients with an absolute value greater than 0.4 are indicated in bold).
Index(Follicular)–(Pre-Luteal)(Menstrual)–(Pre-Luteal)
MeanRRSleep−0.21−0.08
Wakefulness−0.230.20
SDRRSleep0.310.26
Wakefulness0.120.44
RMSSDSleep0.330.29
Wakefulness−0.030.27
VLFSleep0.240.21
Wakefulness0.250.51
LFSleep0.280.25
Wakefulness0.310.51
HFSleep0.350.27
Wakefulness0.110.46
LF/HFSleep0.050.03
Wakefulness0.09−0.32
Disclaimer/Publisher’s Note: The statements, opinions and data contained in all publications are solely those of the individual author(s) and contributor(s) and not of MDPI and/or the editor(s). MDPI and/or the editor(s) disclaim responsibility for any injury to people or property resulting from any ideas, methods, instructions or products referred to in the content.

