Evaluation of Peltier Cooling Vest †

Abstract
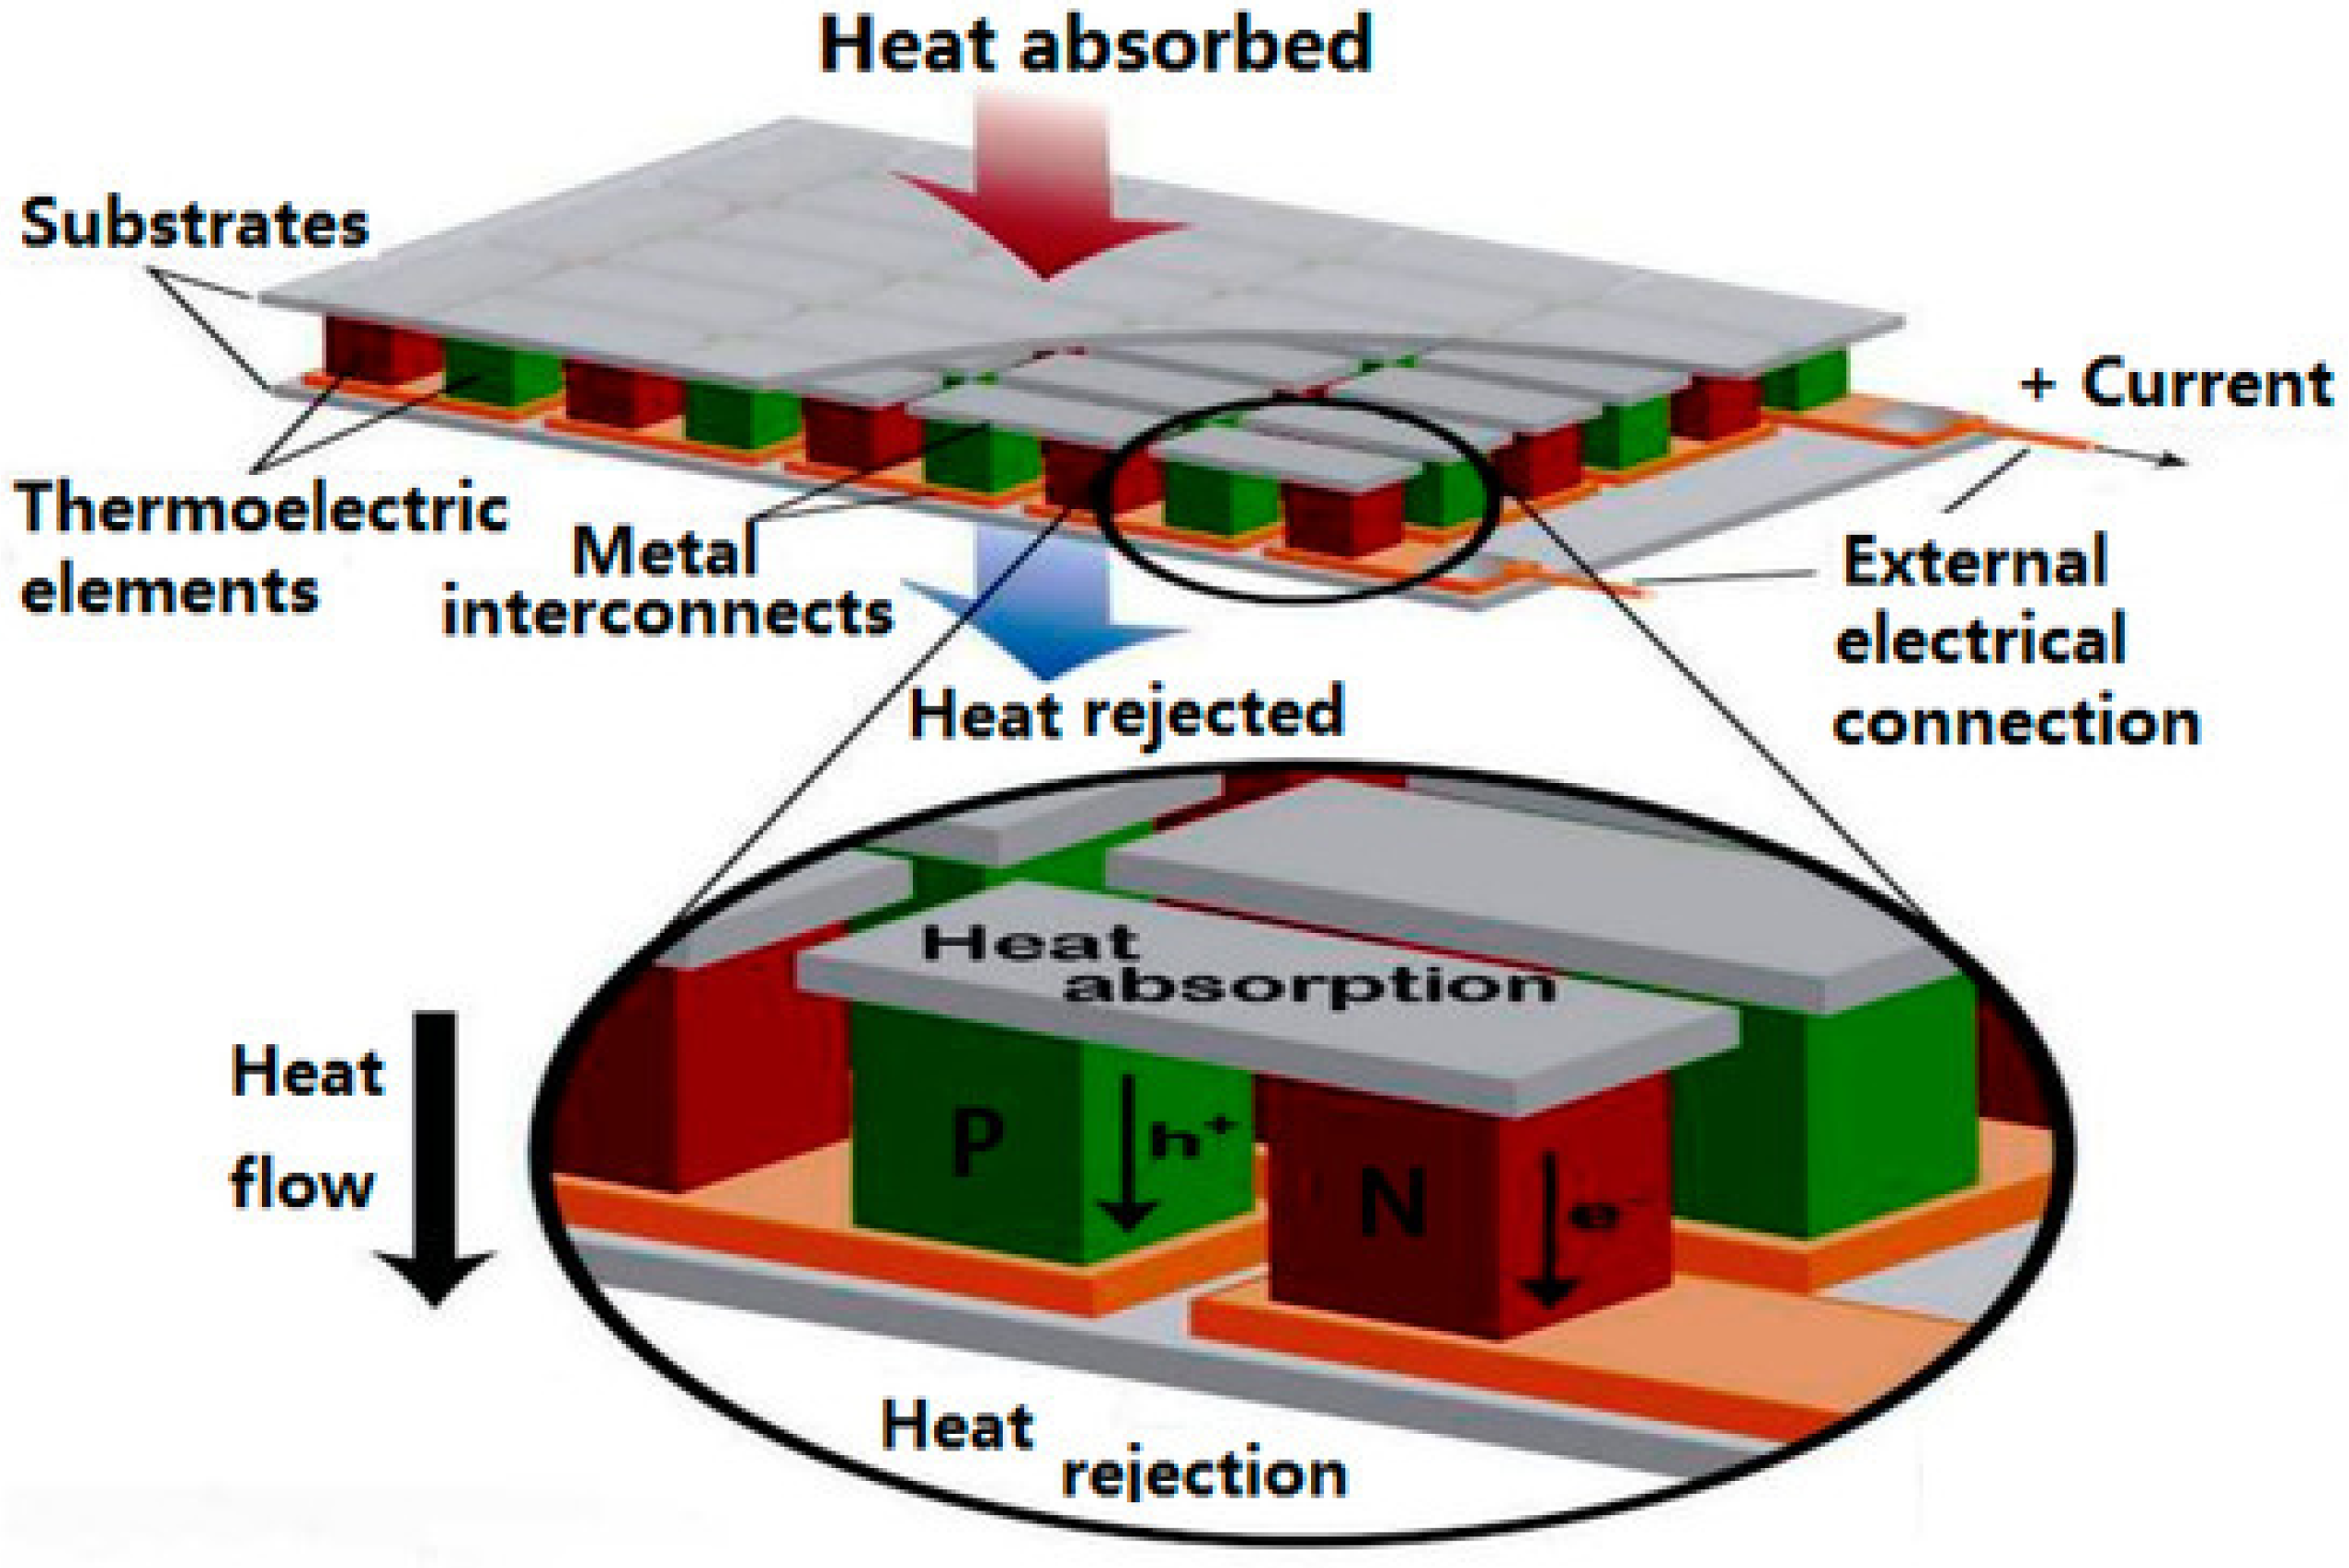
1. Introduction
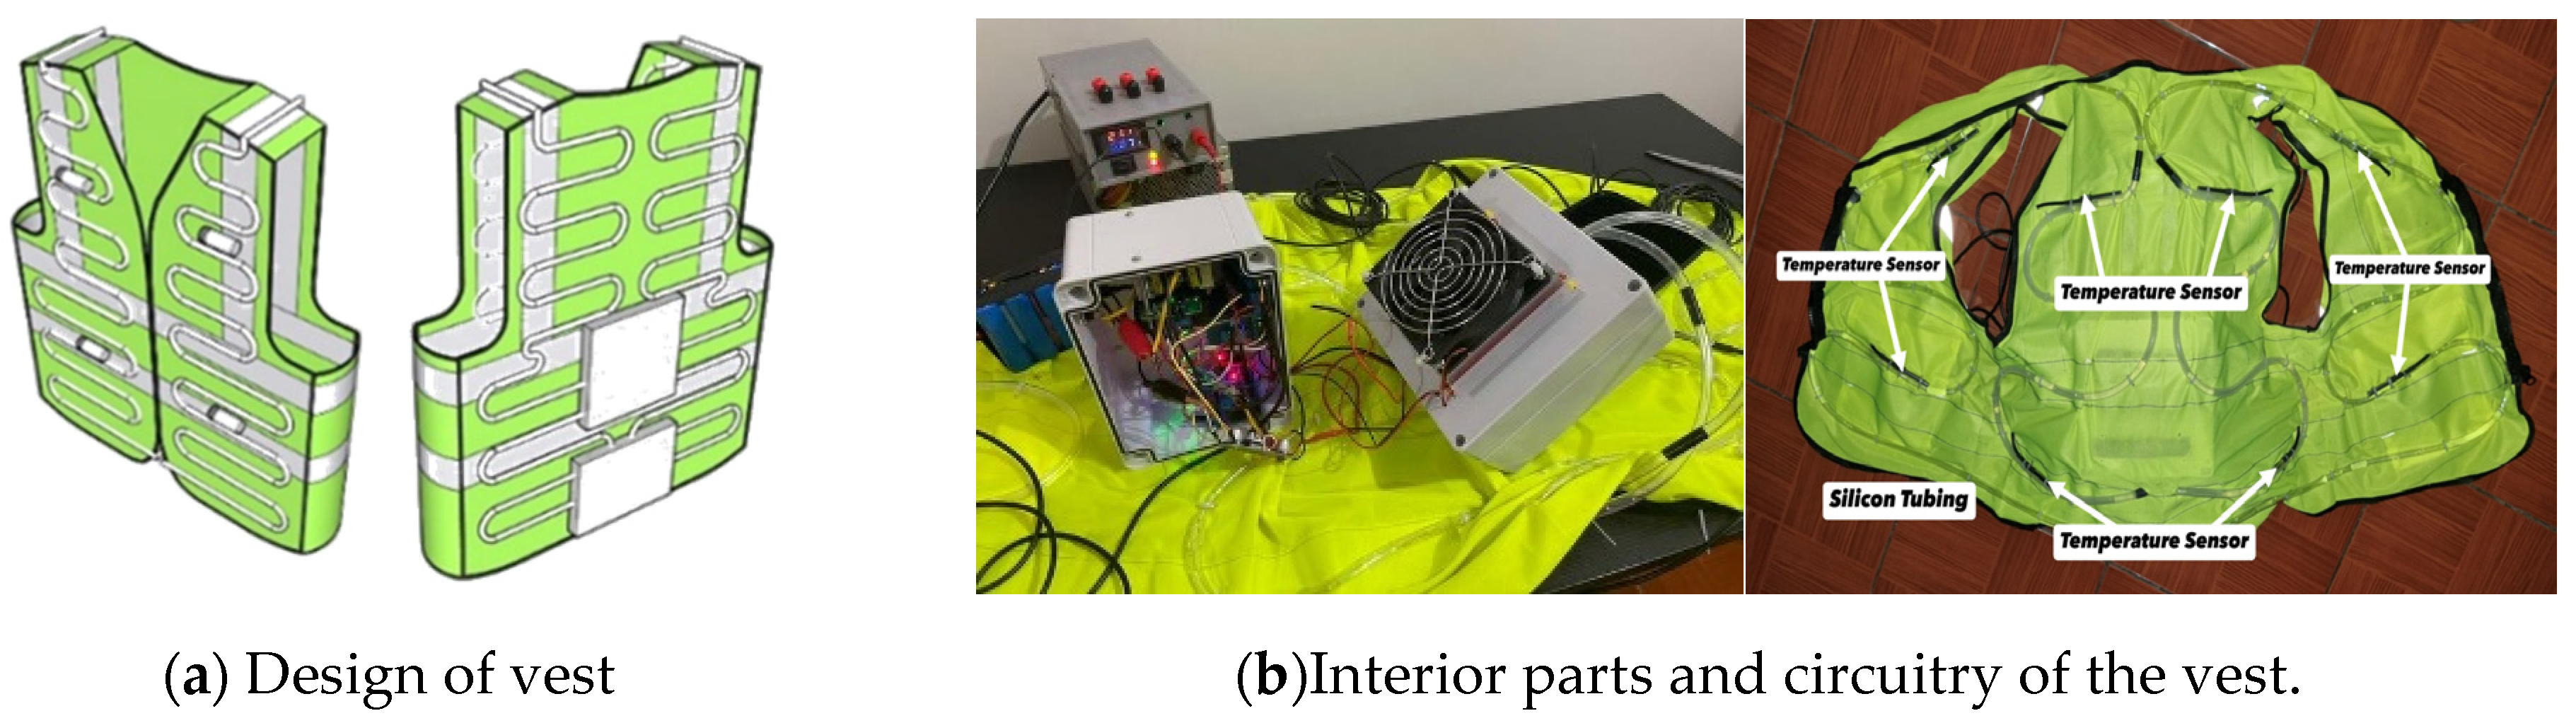
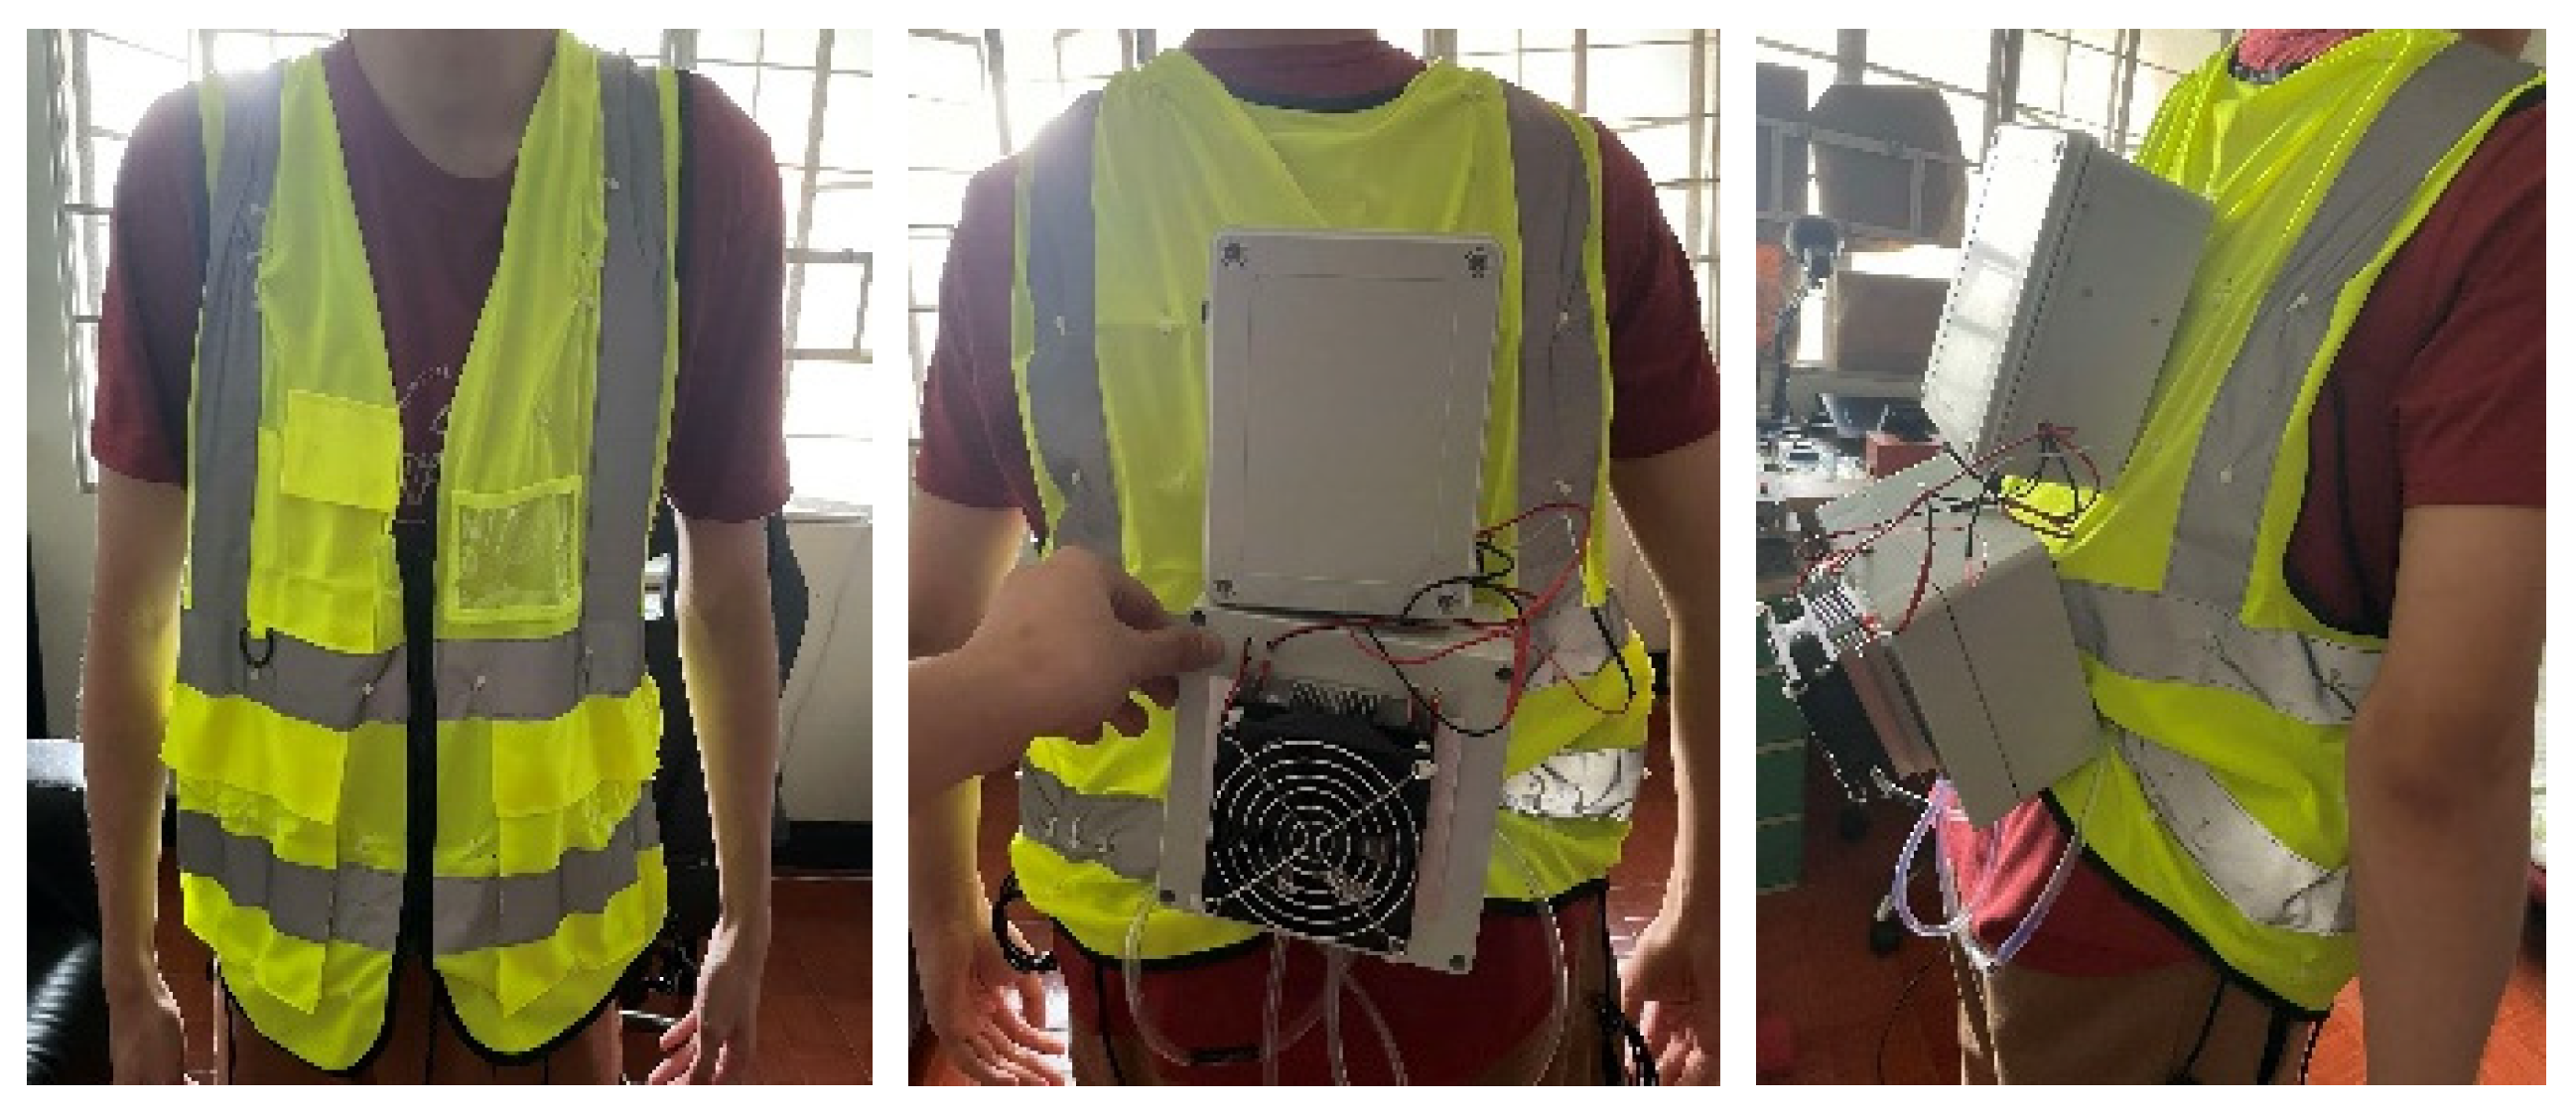
2. Methodology
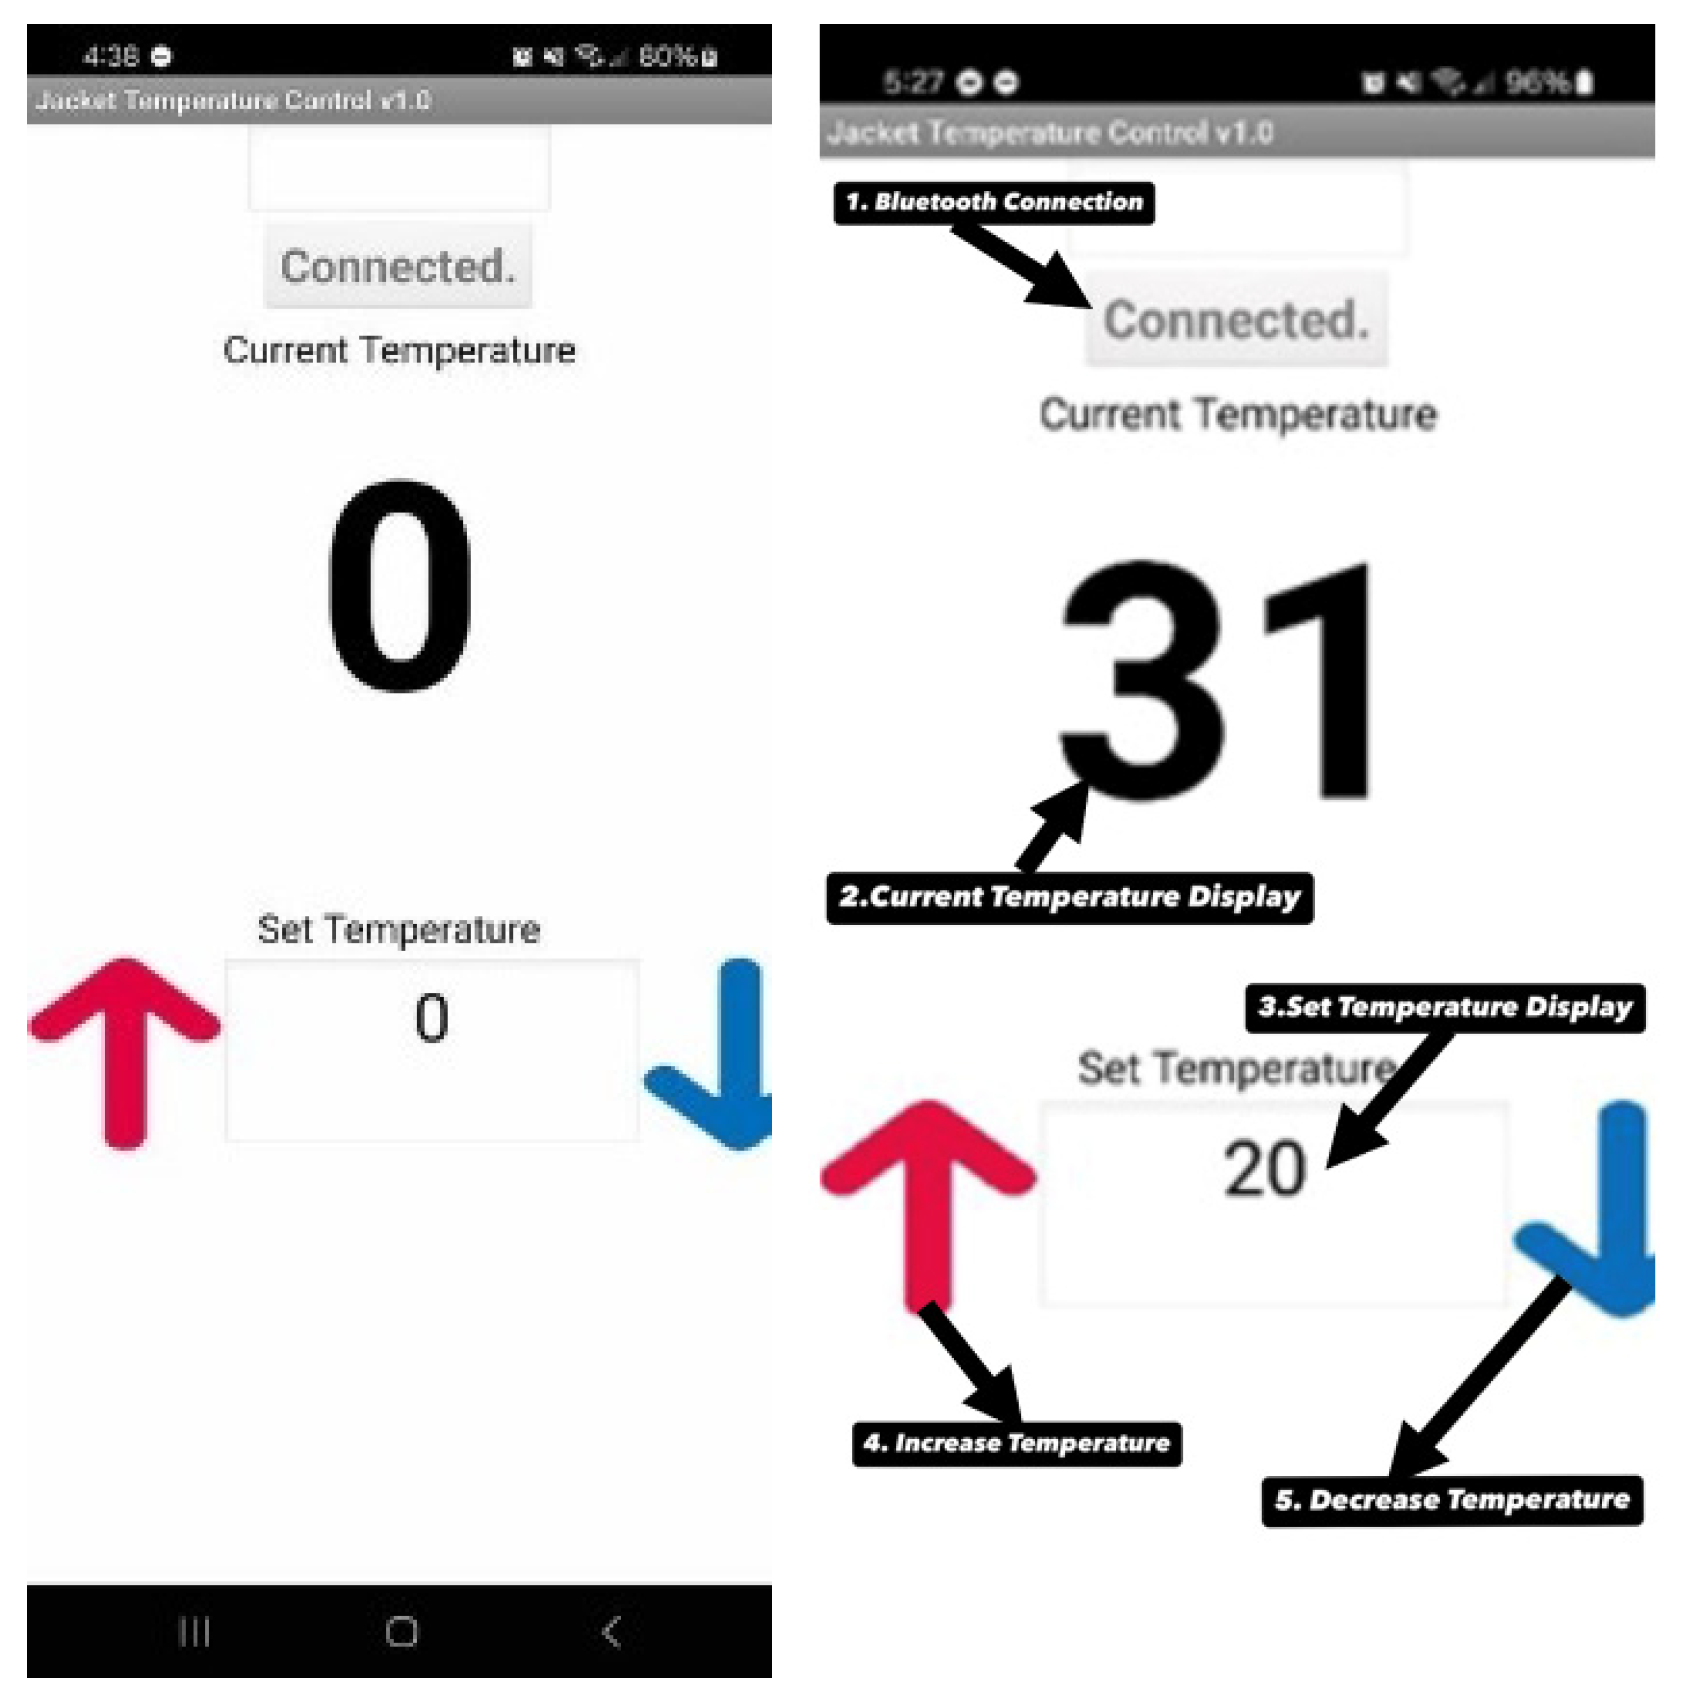
2.1. System Process
2.2. Evaluation
3. Results and Discussion
3.1. Calibration of Temperature
3.2. Peltier Cooling Vest Cooling Response Time
3.3. Temperature Maintainability
3.4. Power Consumption
4. Conclusions and Recommendation
Author Contributions
Funding
Institutional Review Board Statement
Informed Consent Statement
Data Availability Statement
Acknowledgments
Conflicts of Interest
References
- Zhang, C.-W.; Xu, K.-J.; Li, L.-Y.; Yang, M.-Z.; Gao, H.-B.; Chen, S.-R. Study on a Battery Thermal Management System Based on a Thermoelectric Effect. Energies 2018, 11, 279. [Google Scholar] [CrossRef]
- Xu, Y.; Li, Z.; Wang, J.; Zhang, M.; Jia, M.; Wang, Q. Man-portable cooling garment with cold liquid circulation based on thermoelectric refrigeration. Appl. Therm. Eng. 2022, 200, 117730. [Google Scholar] [CrossRef]
- Hwang, C.O. Development of an adaptive thermoelectric cooling system for smart clothing. Textile Res. J. 2020, 90, 2347–2357. [Google Scholar]
- Wang, L.; Zhang, K. Textile-Based Thermoelectric Generators and Their Applications. Energy Environ. Mater. 2020, 3, 67–79. [Google Scholar] [CrossRef]
- Petsagkourakis, I.; Tybrandt, K.; Crispin, X.; Ohkubo, I.; Satoh, N.; Mori, T. Thermoelectric materials and applications for energy harvesting power generation. Sci. Technol. Adv. Mater. 2018, 19, 836–862. [Google Scholar] [CrossRef] [PubMed]
- Wang, Z.; Warren, K.; Luo, M.; He, X.; Zhang, H.; Arens, E.; Chen, W.; He, Y.; Hu, Y.; Jin, L.; et al. Evaluating the comfort of thermally dynamic wearable devices. Build. Environ. 2020, 167, 106443. [Google Scholar] [CrossRef]
- Smith, A.; Johnson, B. Advances in Wearable Cooling Technology. J. Therm. Eng. 2020, 12, 45–59. [Google Scholar]


| Trial No. | Target Test Temperature (°C) | Temperature Sensor Measurement (°C) | Commercial Thermometer Measurement (°C) |
|---|---|---|---|
| 1 | 16 | 15.8 | 16.1 |
| 2 | 17 | 17.2 | 16.9 |
| 3 | 18 | 18.2 | 18.2 |
| 4 | 19 | 18.8 | 18.9 |
| 5 | 20 | 20.3 | 19.8 |
| 6 | 21 | 21.1 | 21.0 |
| 7 | 22 | 21.7 | 22.2 |
| 8 | 23 | 22.8 | 23.0 |
| 9 | 24 | 24.2 | 24.6 |
| 10 | 25 | 25.1 | 24.9 |
| 11 | 26 | 26.3 | 26.1 |
| 12 | 27 | 27.0 | 26.8 |
| 13 | 28 | 28.4 | 27.9 |
| 14 | 29 | 29.2 | 29.1 |
| 15 | 30 | 30.2 | 30.3 |
| Target Temperature (°C) | Time (Minutes) | |||
|---|---|---|---|---|
| 15 | 30 | 45 | 60 | |
| 16 | 16.2 | 16.1 | 15.8 | 16.0 |
| 18 | 17.8 | 17.6 | 17.9 | 18.2 |
| 20 | 20.6 | 19.8 | 20.0 | 20.1 |
| 22 | 22.3 | 22.1 | 21.4 | 21.8 |
| 24 | 23.7 | 23.8 | 24.0 | 24.1 |
| 26 | 26.1 | 25.8 | 25.8 | 26.2 |
| 28 | 28.1 | 28.0 | 28.2 | 27.9 |
| 30 | 29.6 | 29.5 | 29.7 | 29.6 |
| Target Temperature (°C) | Average Standard Deviation |
|---|---|
| 16 | 0.17 |
| 18 | 0.25 |
| 20 | 0.34 |
| 22 | 0.39 |
| 24 | 0.18 |
| 26 | 0.21 |
| 28 | 0.13 |
| 30 | 0.82 |
| Temperature Range (°C) | Time (Minutes) |
|---|---|
| 30–26 | 10.36 |
| 26–21 | 8.75 |
| 21–16 | 9.16 |
| Target Temperature (°C) | Time (Minutes) | |||
|---|---|---|---|---|
| 15 | 30 | 45 | 60 | |
| 16 | 16.2 | 16.1 | 15.8 | 16.0 |
| 18 | 17.8 | 17.6 | 17.9 | 18.2 |
| 20 | 20.6 | 19.8 | 20.0 | 20.1 |
| 22 | 22.3 | 22.1 | 21.4 | 21.8 |
| 24 | 23.7 | 23.8 | 24.0 | 24.1 |
| 26 | 26.1 | 25.8 | 25.8 | 26.2 |
| 28 | 28.1 | 28.0 | 28.2 | 27.9 |
| 30 | 29.6 | 29.5 | 29.7 | 29.6 |
| Target Temperature (°C) | Error Rate (%) | |||
|---|---|---|---|---|
| Time (Minutes) | ||||
| 15 | 30 | 45 | 60 | |
| 16 | 1.25 | 0.625 | −1.25 | 0 |
| 18 | −1.25 | −2.5 | −0.625 | −1.25 |
| 20 | 2.5 | −1.25 | 0 | 0.625 |
| 22 | 1.875 | 0.625 | −2.5 | −1.25 |
| 24 | −1.875 | −1.25 | 0 | 0.625 |
| 26 | 0.625 | −1.25 | −1.25 | 1.25 |
| 28 | 0.625 | 0 | 1.25 | −0.625 |
| 30 | −2.5 | −3.125 | −1.875 | −2.5 |
| Target Temperature (°C) | Voltage (V) | Ampere (A) | Total Power (Watts) |
|---|---|---|---|
| 30 | 14.7 | 3.3 | 48.51 |
| 25 | 15.2 | 8.4 | 127.68 |
| 20 | 15.7 | 11.2 | 175.84 |
| 16 | 15.7 | 12.1 | 189.97 |
| Function | Working | Not |
|---|---|---|
| Bluetooth scan | 34 | 6 |
| Bluetooth connection | 38 | 2 |
| Bluetooth disconnection | 40 | 0 |
| Temperature display | 40 | 0 |
| Temperature setting (up/down) | 40 | 0 |
| Criterion | Description | Response |
|---|---|---|
| Ease of Use | The app does not need lengthy instructions. | 4.18 |
| Intuitiveness | The purpose of app elements (buttons, graph, numerical display) can be easily understood. | 4.56 |
| Responsiveness | The commands can be executed on a single attempt. | 4.32 |
| Informativeness (GUI) | The graph display contains important information and can be easily interpreted. | 3.88 |
Disclaimer/Publisher’s Note: The statements, opinions and data contained in all publications are solely those of the individual author(s) and contributor(s) and not of MDPI and/or the editor(s). MDPI and/or the editor(s) disclaim responsibility for any injury to people or property resulting from any ideas, methods, instructions or products referred to in the content. |
© 2025 by the authors. Licensee MDPI, Basel, Switzerland. This article is an open access article distributed under the terms and conditions of the Creative Commons Attribution (CC BY) license (https://creativecommons.org/licenses/by/4.0/).
Share and Cite
Talamayan, V.K.A.; Yalung, M.J.S.A.; Balbin, J.R. Evaluation of Peltier Cooling Vest. Eng. Proc. 2025, 92, 25. https://doi.org/10.3390/engproc2025092025
Talamayan VKA, Yalung MJSA, Balbin JR. Evaluation of Peltier Cooling Vest. Engineering Proceedings. 2025; 92(1):25. https://doi.org/10.3390/engproc2025092025
Chicago/Turabian StyleTalamayan, Vin Klein A., Mharlon Jefferson S. A. Yalung, and Jessie R. Balbin. 2025. "Evaluation of Peltier Cooling Vest" Engineering Proceedings 92, no. 1: 25. https://doi.org/10.3390/engproc2025092025
APA StyleTalamayan, V. K. A., Yalung, M. J. S. A., & Balbin, J. R. (2025). Evaluation of Peltier Cooling Vest. Engineering Proceedings, 92(1), 25. https://doi.org/10.3390/engproc2025092025