Abstract
The progress in the development of sensors made using additive manufacturing (AM) techniques has opened up new possibilities for their integration into more complex structures, such as CubeSats. In this study, preliminary tests were conducted on printed sensors by FDM embedded in simple structures to evaluate their feasibility under simulated operational conditions, including temperature variations and dynamic loads. The results obtained represent a preliminary step toward the full integration of embedded sensors in 3D-printed structures. With further development, 3D-printed embedded sensors could be used to monitor dynamic loads and vibrations during service, which is essential for structural health monitoring and determining fatigue life.
1. Introduction
In recent years, advances in additive manufacturing (AM) techniques have revolutionized the manufacturing processes across several industries [1]. AM refers to a set of technologies that create objects layer by layer from digital models; among the most widely used AM techniques are fused deposition modeling (FDM), selective laser sintering (SLS), and stereolithography (SLA). These methods enable the fabrication of highly complex geometries that traditional single-process machining would find difficult or impossible to achieve. The main advantages of AM include significant weight reduction, which is particularly advantageous in industries such as aerospace and automotive [2], as well as the direct integration of functional components, such as sensors [3], during the printing process.
This paper focuses on the use of fused deposition modeling (FDM) with thermoplastic materials to produce the primary structure and printed sensors, also made of thermoplastic material [4,5], during the same printing process, resulting in a final product already equipped with sensors [6]. This approach enables the creation of customized sensors, facilitates their integration into printed structures, and reduces costs, space requirements, and overall weight, thus optimizing available space [7,8].
Piezoresistive sensors, in particular, capitalize on the ability to convert mechanical changes, such as pressure or deformation, into variations in electrical resistance [9,10], which can be directly correlated to the physical quantities being measured. For this reason, previous studies have focused on the feasibility of these sensors for strain measurements [11], exploring the physical quantities these devices are capable of detecting [12,13].
This feature makes piezoresistive sensors extremely useful in a wide range of applications, from wearable electronics [14,15] to structural health monitoring [16], robotics [17], and even biomedical engineering [18]. Specifically, they can be employed to develop true “smart structures” capable of self-monitoring by detecting real-time variations in physical parameters within the component, such as dynamic loads, vibrations, natural frequencies, temperatures, and strains—data that are essential for the damage and remaining life calculations of a component [19].
This capability is particularly valuable in situations where direct intervention on the component is not feasible. Continuous monitoring throughout the component’s lifecycle can provide crucial information for future design and help prevent failures. This research focuses on the potential to integrate sensors into CubeSat platforms [20], nanosatellites that have seen significant growth due to their standardized external structure. The modular and uniform design of these platforms has facilitated the development of and increase in launches, enabling the use of shared launch solutions, which have significantly reduced mission costs [21].
However, these satellites are deployed into orbit using launchers inside respective P-Pods, where they are subjected to very high vibrational loads, both in the early phase of the journey (random and sine) and during payload release (shock) [21]. During launch, CubeSats experience a significant drop in temperature, transitioning from ambient conditions to the lower temperatures typical of low Earth orbit (LEO) [22], where they must endure extreme thermal cycles caused by alternating exposure to sunlight and periods of darkness [23,24].
Space mission components undergo rigorous qualification tests before launch. The requirements and loads are defined in specific user guides [25,26], which set preliminary operational limits for accelerations up to 5g and temperatures ranging from 20 °C (at launch) to −40 °C (in orbit).
This article presents the initial experimental tests aimed at assessing the operational capabilities of printed sensors under simulated launch and lifecycle conditions. The performance of the sensors in structural monitoring during launch is analyzed, as well as their ability to function effectively under thermal variations and load applications.
The tests are mainly divided into two categories: a static characterization phase, where temperature tests were conducted inside a climatic chamber, and a dynamic characterization phase, where an electrodynamic shaker was integrated with the climatic chamber to test the sensors under dynamic load conditions with temperature variations.
The article is structured into four sections. The first section describes the materials used, the experimental setup, and the types of tests conducted. The second section presents the results of the static analyses, while the third reports the results of the dynamic tests performed under thermal variation conditions. Finally, the last section contains the conclusions.
2. Materials and Methods
2.1. Sample
The samples were fabricated using thermoplastic materials, with a standard PLA for the structural component and a conductive PLA for the sensor [27]. The sensor material comprises a specialized PLA filament embedded with conductive particles, whose electrical resistance changes proportionally to the deformation experienced by the structure. The specific dimensions and geometry of both the sample and sensor are illustrated in Figure 1.
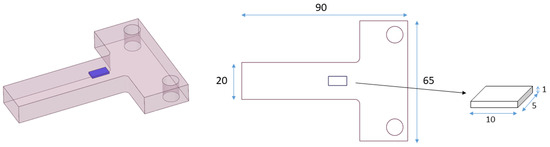
Figure 1.
Sample view and section; all dimensions are in millimeters.
The T-shaped design of the sample is optimized for attachment to the shaker system, featuring two plates secured with screws to ensure precise adhesion between the sample and sensor, even under varying temperature conditions. The remainder of the sample consists of a standard beam, designed to ensure a predictable distribution of stress and deformation.
The sensor, rectangular in shape, is fully integrated into the sample (see Figure 1). During the 3D printing process, conductive tape can be embedded between layers of conductive PLA, facilitating the connection to the circuit for powering and acquiring data from the piezoresistive sensor.
2.2. Experimental Setup
The tests were conducted using a climatic chamber and an electro-dynamic shaker to achieve both static and dynamic characterization. The integration of these two instruments enabled vibration testing under varying temperature conditions.
The same samples were used for both types of tests, though the mounting method differed. For tests involving only temperature variation, securing the samples with screws was unnecessary; instead, they were simply placed on the grid inside the chamber.
For the temperature response analysis, the samples underwent a temperature cycle ranging from 20 °C to −40 °C, with ascending and descending phases at a rate of 1 °C per minute, over the course of 8 cycles.
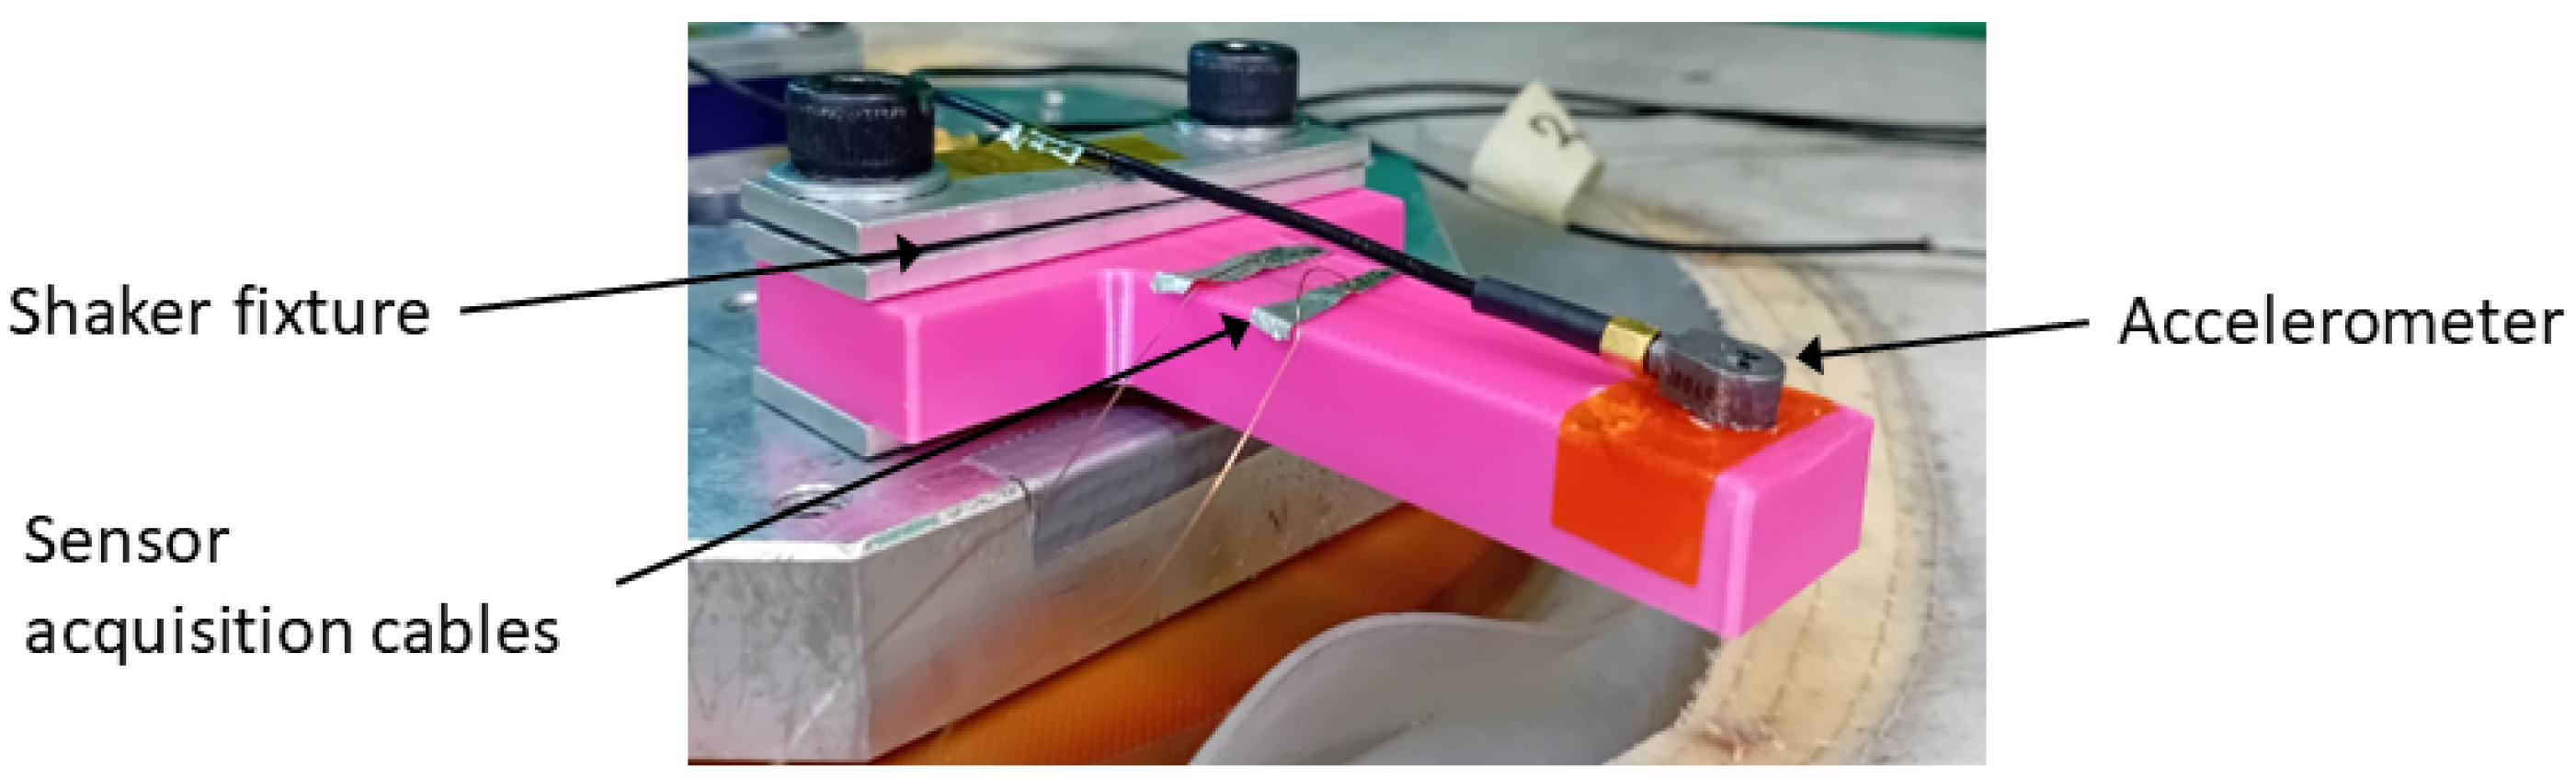
For the combined temperature and vibration tests, the samples were mounted to the shaker fixture using two aluminum plates and secured with screws. An accelerometer was positioned at the end of the samples to serve as a reference for the piezoresistive sensor, as illustrated in Figure 2. Another accelerometer was placed on the shaker fixture to enable closed-loop control of the input signal. Two types of input signals, sinusoidal and random, were selected for the dynamic testing.
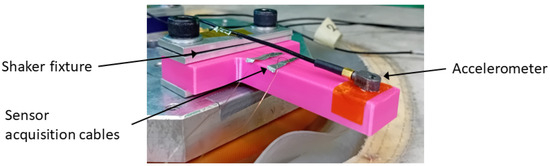
Figure 2.
Experimental Setup.
The sinusoidal test was performed to analyze the sensor’s response to time-varying inputs. To avoid exciting the resonance frequency of the structure, including both the sample and the sensor, a frequency of 80 Hz was selected. Different sinusoidal tone amplitudes, 0.6 g, 1.2 g, 2.5 g and 5 g, were applied to evaluate the sensor’s performance under varying excitation levels.
A random test was conducted to assess the sensor’s ability to monitor system dynamics and evaluate the impact of dynamic effects. A rectangular Power Spectral Density (PSD) profile, ranging from 50 Hz to 2000 Hz with an RMS value of 5 g, was chosen to ensure uniform excitation across all frequencies within that range.
The temperature–vibration test followed these steps:
- Stabilize the temperature in both the chamber and the sample for 10 min;
- Apply the load for 30 s. In the case of sine tones, the excitation amplitude was incrementally increased every 30 s, with data acquisition at each level;
- Adjust the temperature to the next step and repeat the process (steps 1 and 2), with 5°C increments from 20 °C to −40 °C.
For all tests, the sensor’s response was evaluated by measuring its resistance using a custom-designed acquisition circuit. This circuit captured the voltage variation across both the sensor and the shunt resistance, which was then used to calculate the sensor’s resistance values [19].
3. Static Characterization
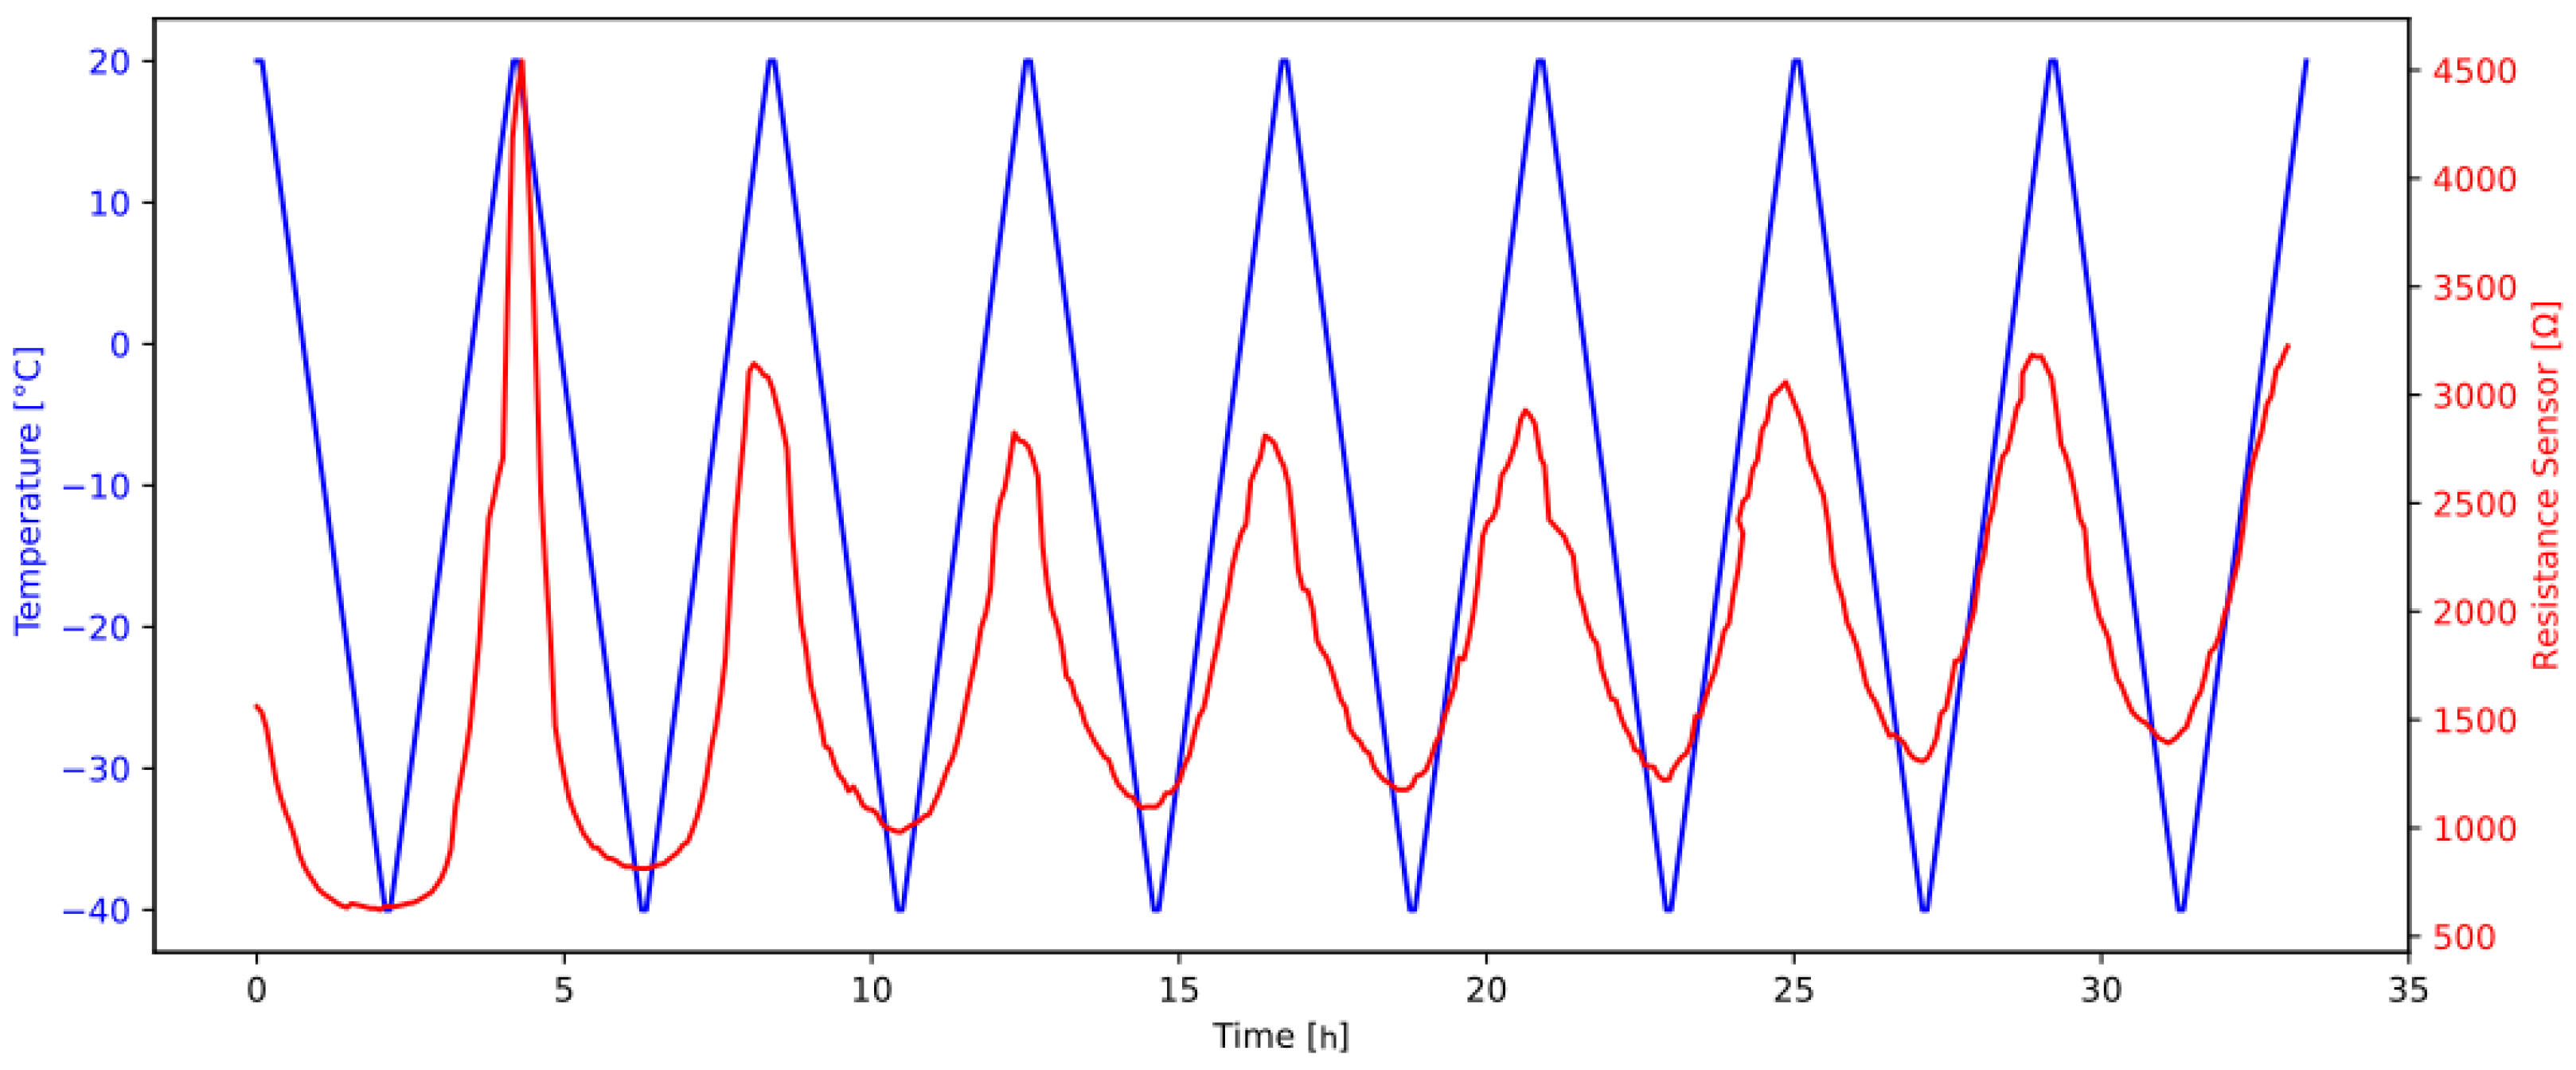
The objective of the static characterization is to investigate the resistance variation of conductive PLA in response to temperature fluctuations. Specifically, this analysis focuses on examining the behavior of the sensor’s resistance during multiple temperature cycles. Throughout the test, both the sensor’s resistance and the chamber temperature were continuously recorded, with the results presented in Figure 3.
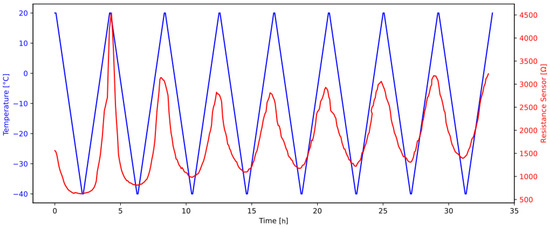
Figure 3.
Comparison of resistance and temperature measured during the cycle temperature test.
Figure 3 illustrates the resistance trend over multiple cycles. As can be observed, the amplitude of resistance in the first and second cycles differs from the subsequent ones. However, from the third cycle onward, the resistance trend becomes consistent and repeatable. Starting from this cycle, the resistance variation was evaluated relative to a reference value, chosen and set at 20 °C, and analyzed as a function of the temperature recorded in the climatic chamber during testing.
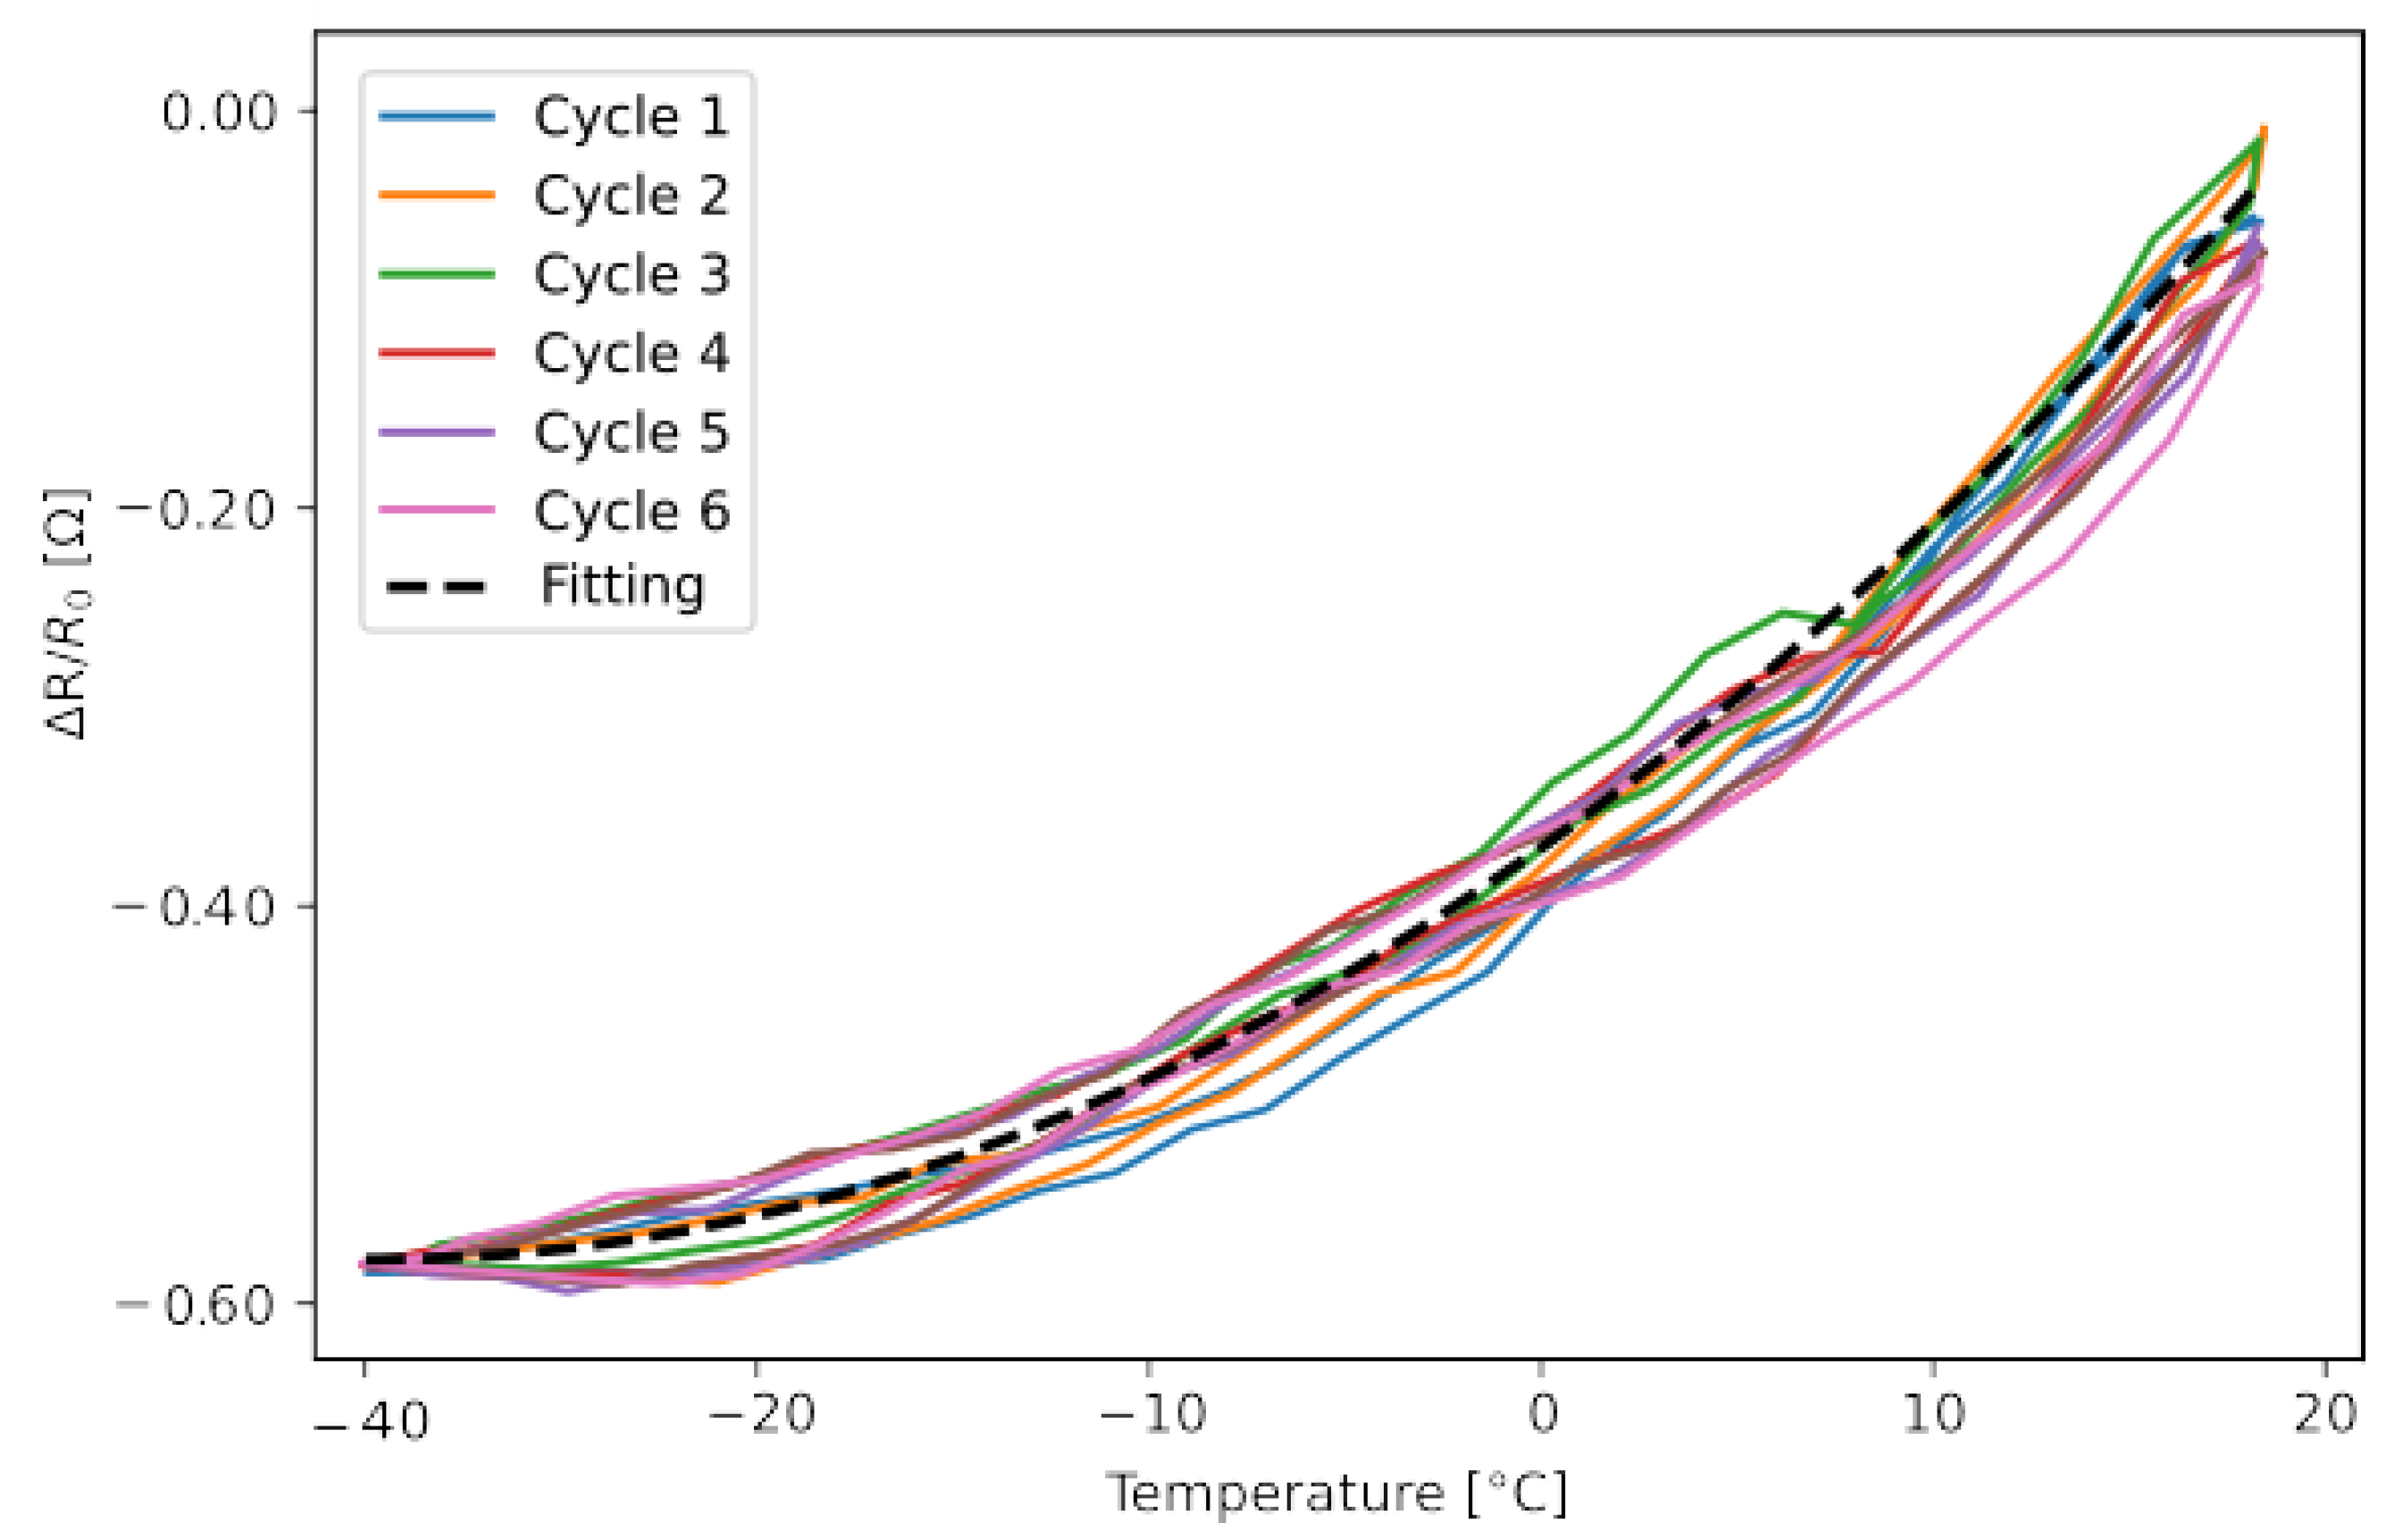
The figure below (Figure 4) shows the resistance as a function of temperature. Each cycle includes a descending phase (from 20 °C to −40 °C) and an ascending phase (from −40 °C back to 20 °C). Across all six cycles, the resistance shows good correspondence between the descending and ascending phases, with only minor variations. The most notable observation is the parabolic trend, indicating a clear relationship between the change in resistance and the increase in temperature.
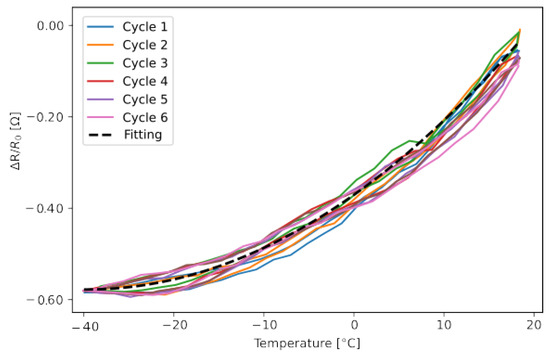
Figure 4.
Trend of the acquired resistance divided for each cycle as a function of temperature and the fitting curve of the experimental points.
4. Dynamic Characterization
Dynamic characterization was performed using two different input types: sinusoidal and random. In both cases, the resistance signals were recorded and subsequently processed. For the sinusoidal test, the signals were analyzed in both the time and frequency domains. In the time domain, the mean component was evaluated for each temperature and amplitude, while in the frequency domain, the maximum value of the FFT at the excited frequency was identified. This parameter represents the sensor’s response, corresponding to the resistance variation induced by the input signal.
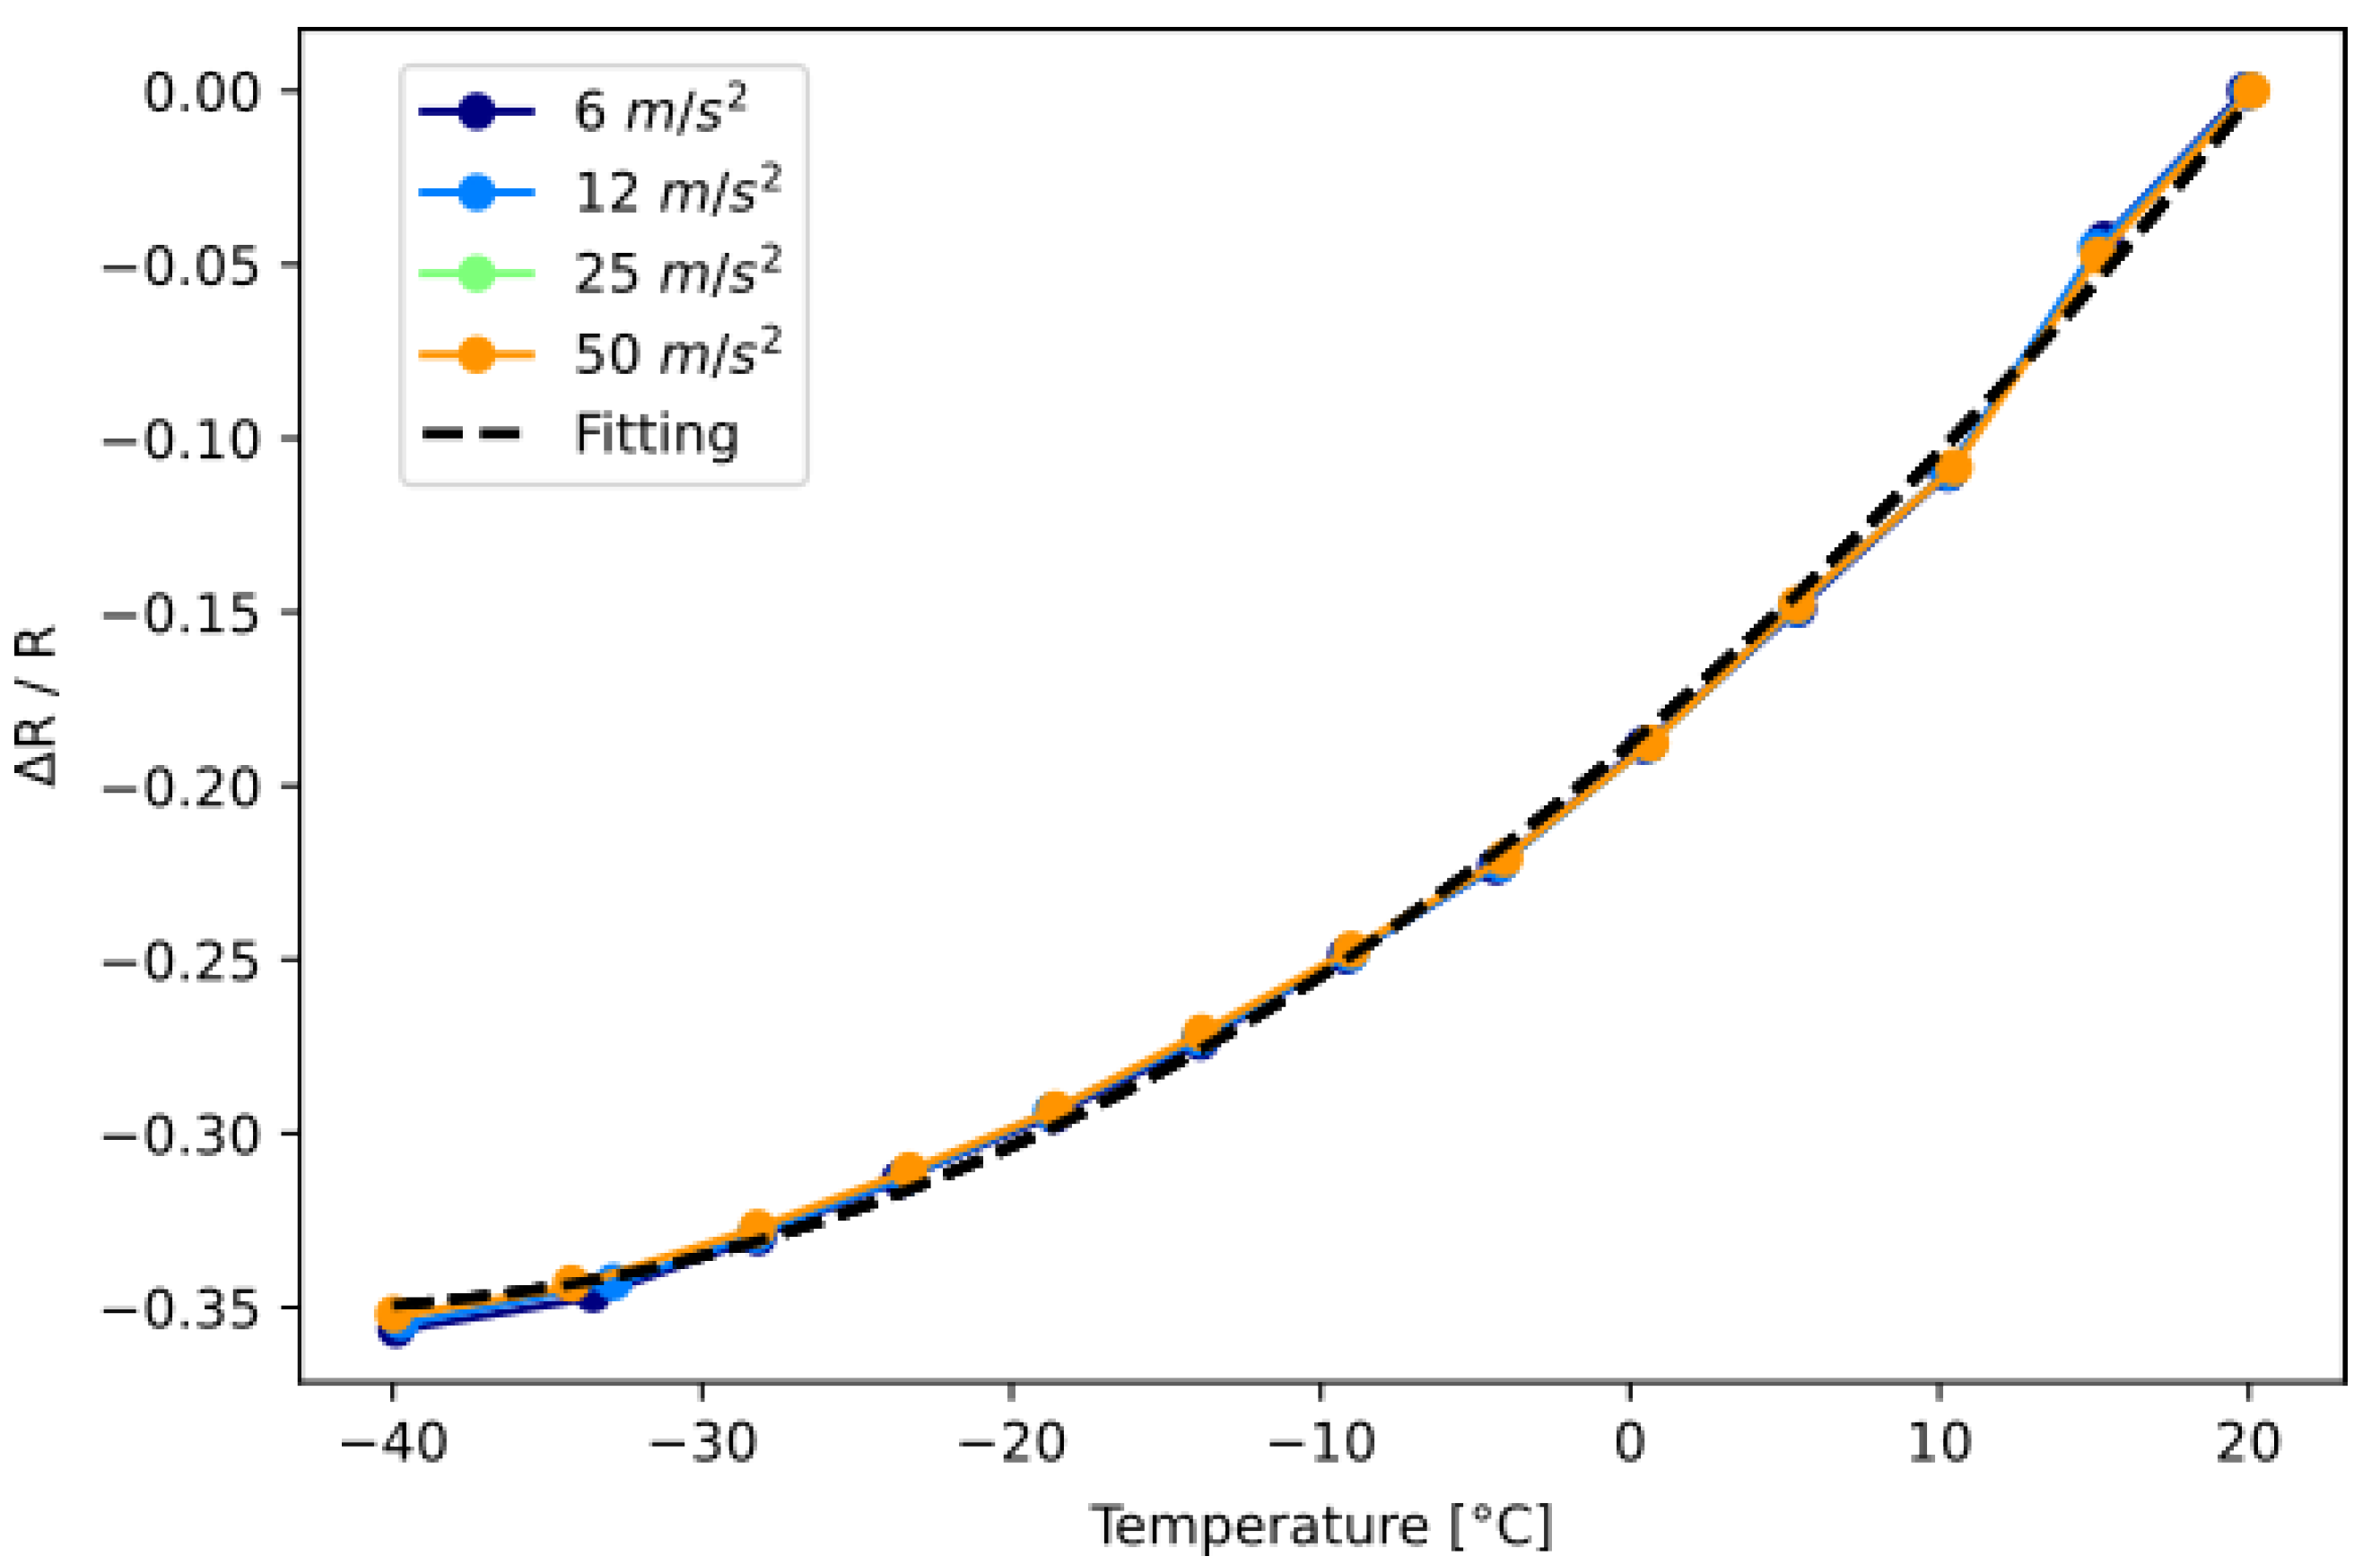
The initial analysis focused on the signal averages. The means for the different excitation levels were plotted as a function of temperature, as shown in Figure 5. As can be observed, the trend of the average resistance increase closely mirrors the behavior observed under static conditions.
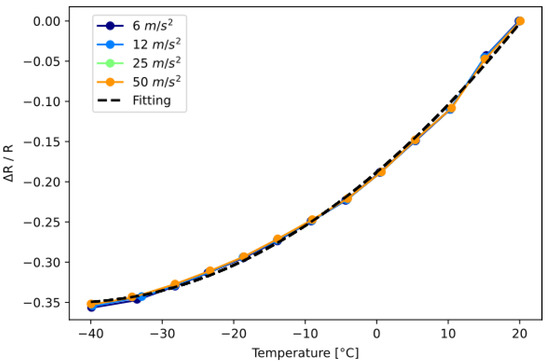
Figure 5.
Trend of the acquired mean resistance during the sine test as a function of temperature and the fitting curve of the experimental points.
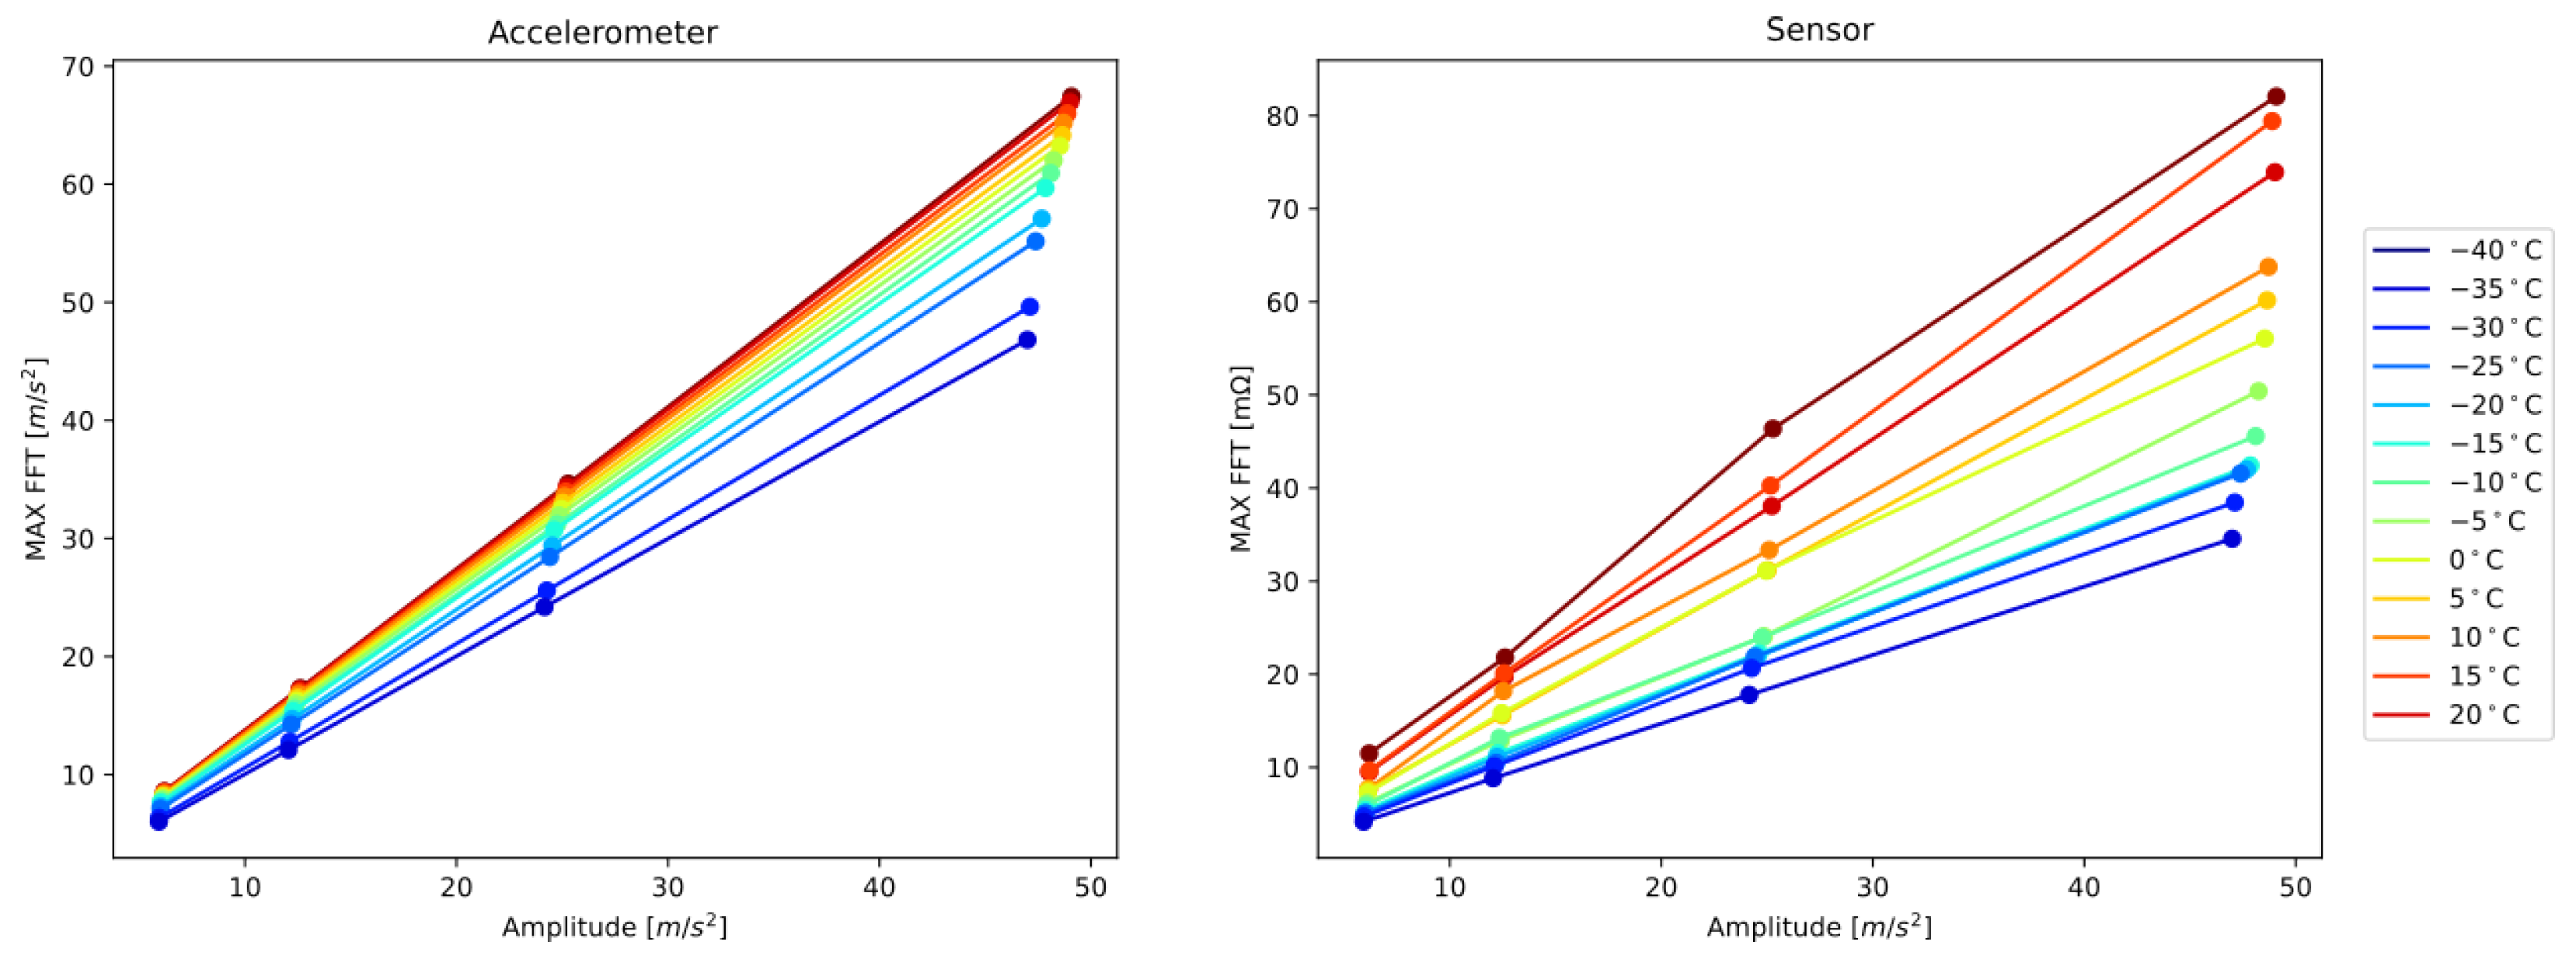
Next, the analysis of FFT maxima for different excitation amplitudes at each temperature was performed. The resulting values were plotted as a function of temperature for each input amplitude and compared with the corresponding results obtained from the accelerometer (Figure 6).
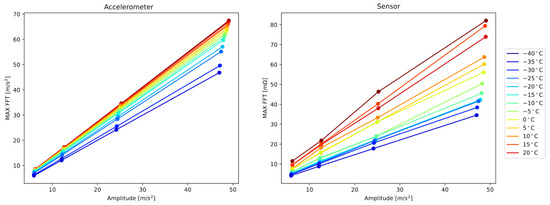
Figure 6.
Response of the accelerometer and sensor (maximum of the FFT) as the excitation amplitude increases for each temperature.
As shown in Figure 6, increasing the input amplitude results in a linear response from the piezoresistive sensor at each temperature, similar to the accelerometer. However, the slope of these lines is not constant and varies with temperature, indicating that the sensitivity of both instruments is probably influenced by temperature changes.
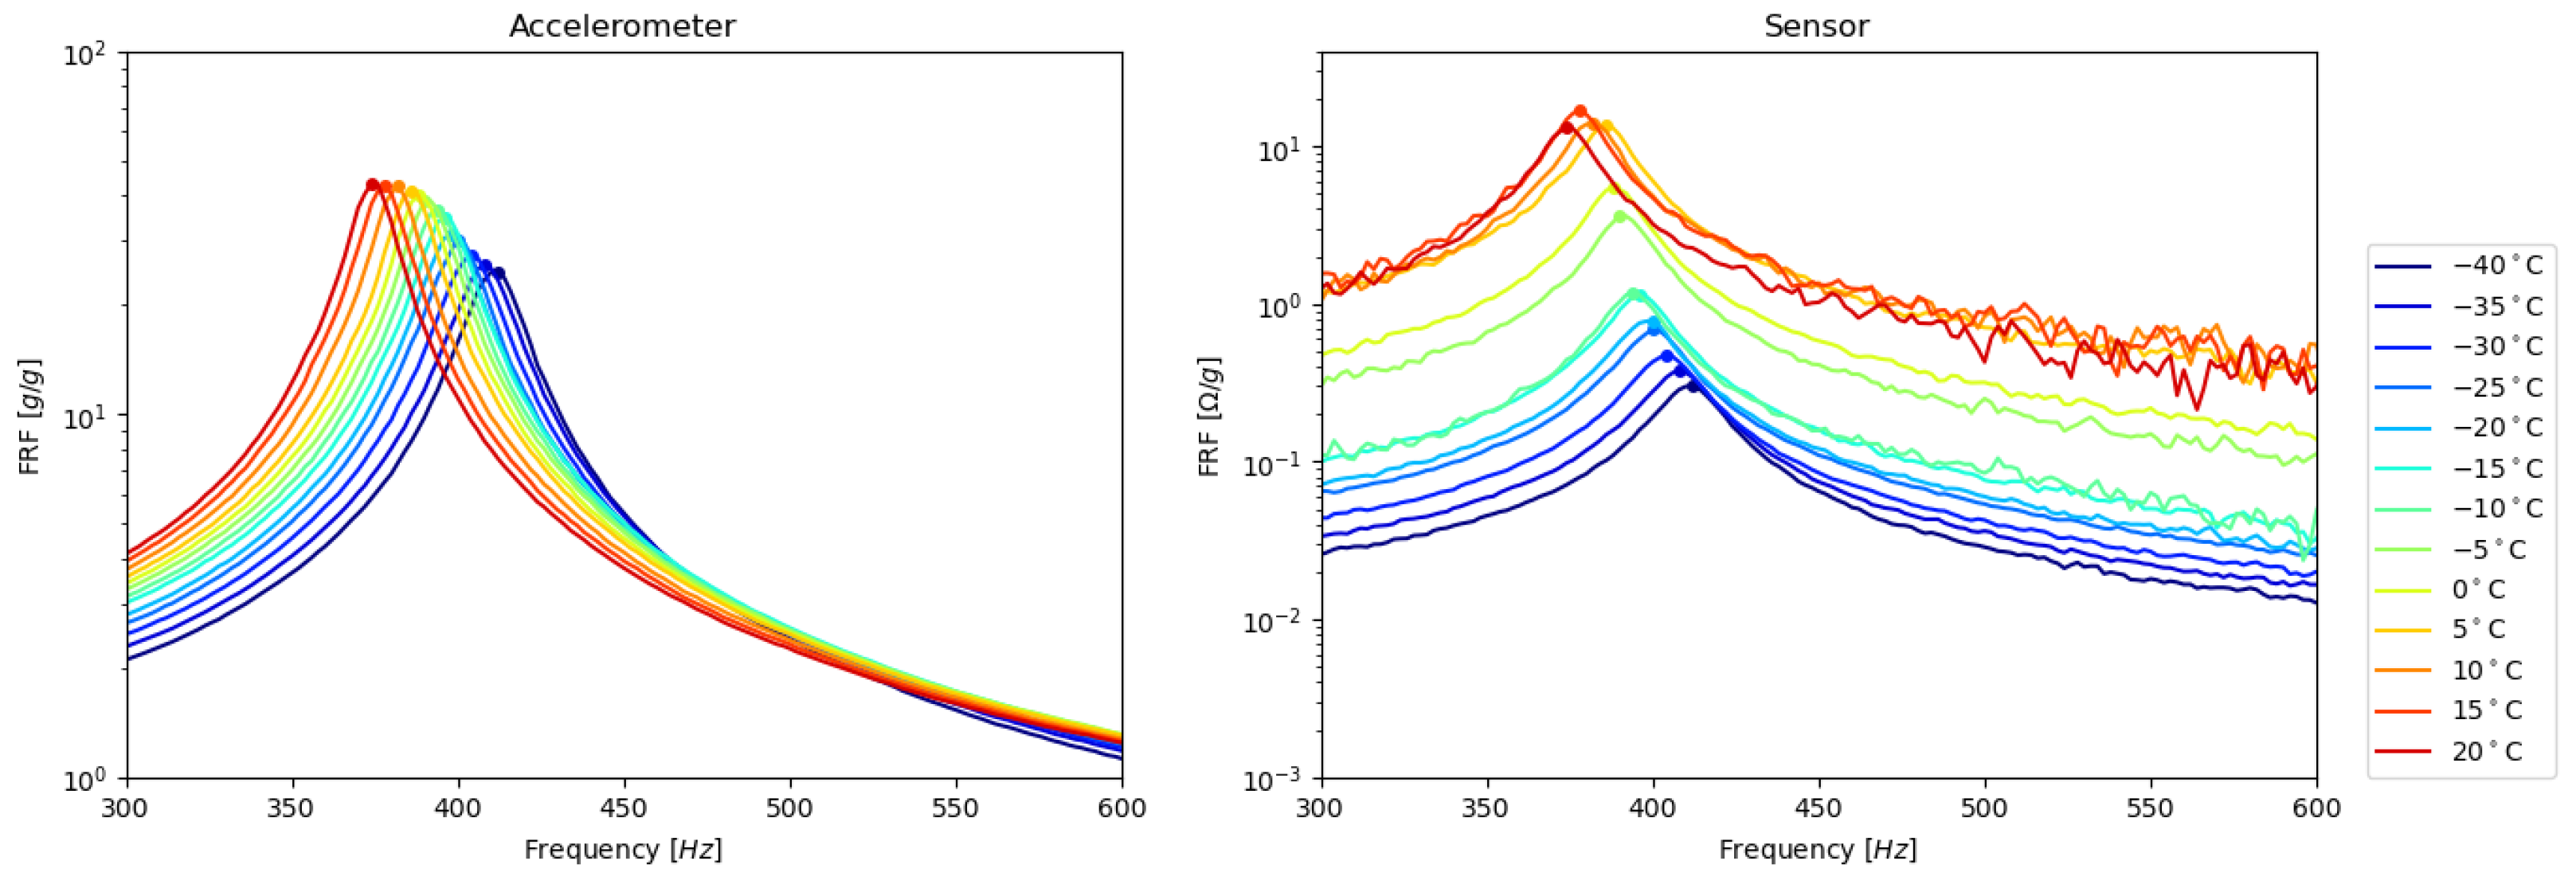
To further assess the sensor’s performance in the presence of system dynamics and potential changes in those dynamics, a random excitation profile targeting the system’s first resonance frequency was applied. The acquired signals were used to generate Frequency Response Functions (FRFs): acceleration was used as the output for the accelerometer and resistance for the printed sensor, while the shaker’s input acceleration was used as the input in both cases.
Figure 7 illustrates the evolution of the Frequency Response Functions (FRFs) obtained from both the accelerometer and the sensor. The results reveal that the system’s dynamics change with increasing temperature.
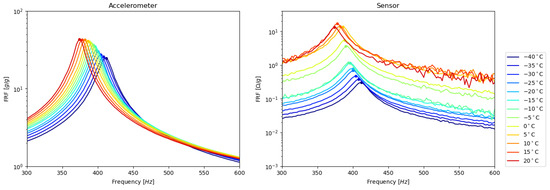
Figure 7.
Frequency Response Functions of the accelerometer and printed sensor at different temperatures.
In the FRF obtained from the accelerometer, the peak corresponds to the system’s natural frequency, which is directly related to the material’s elastic modulus and damping properties. In this preliminary phase, a detailed numerical comparison was not performed. Instead, a qualitative analysis was conducted to assess whether the sensor possesses similar capabilities to the accelerometer in monitoring the structural parameters.
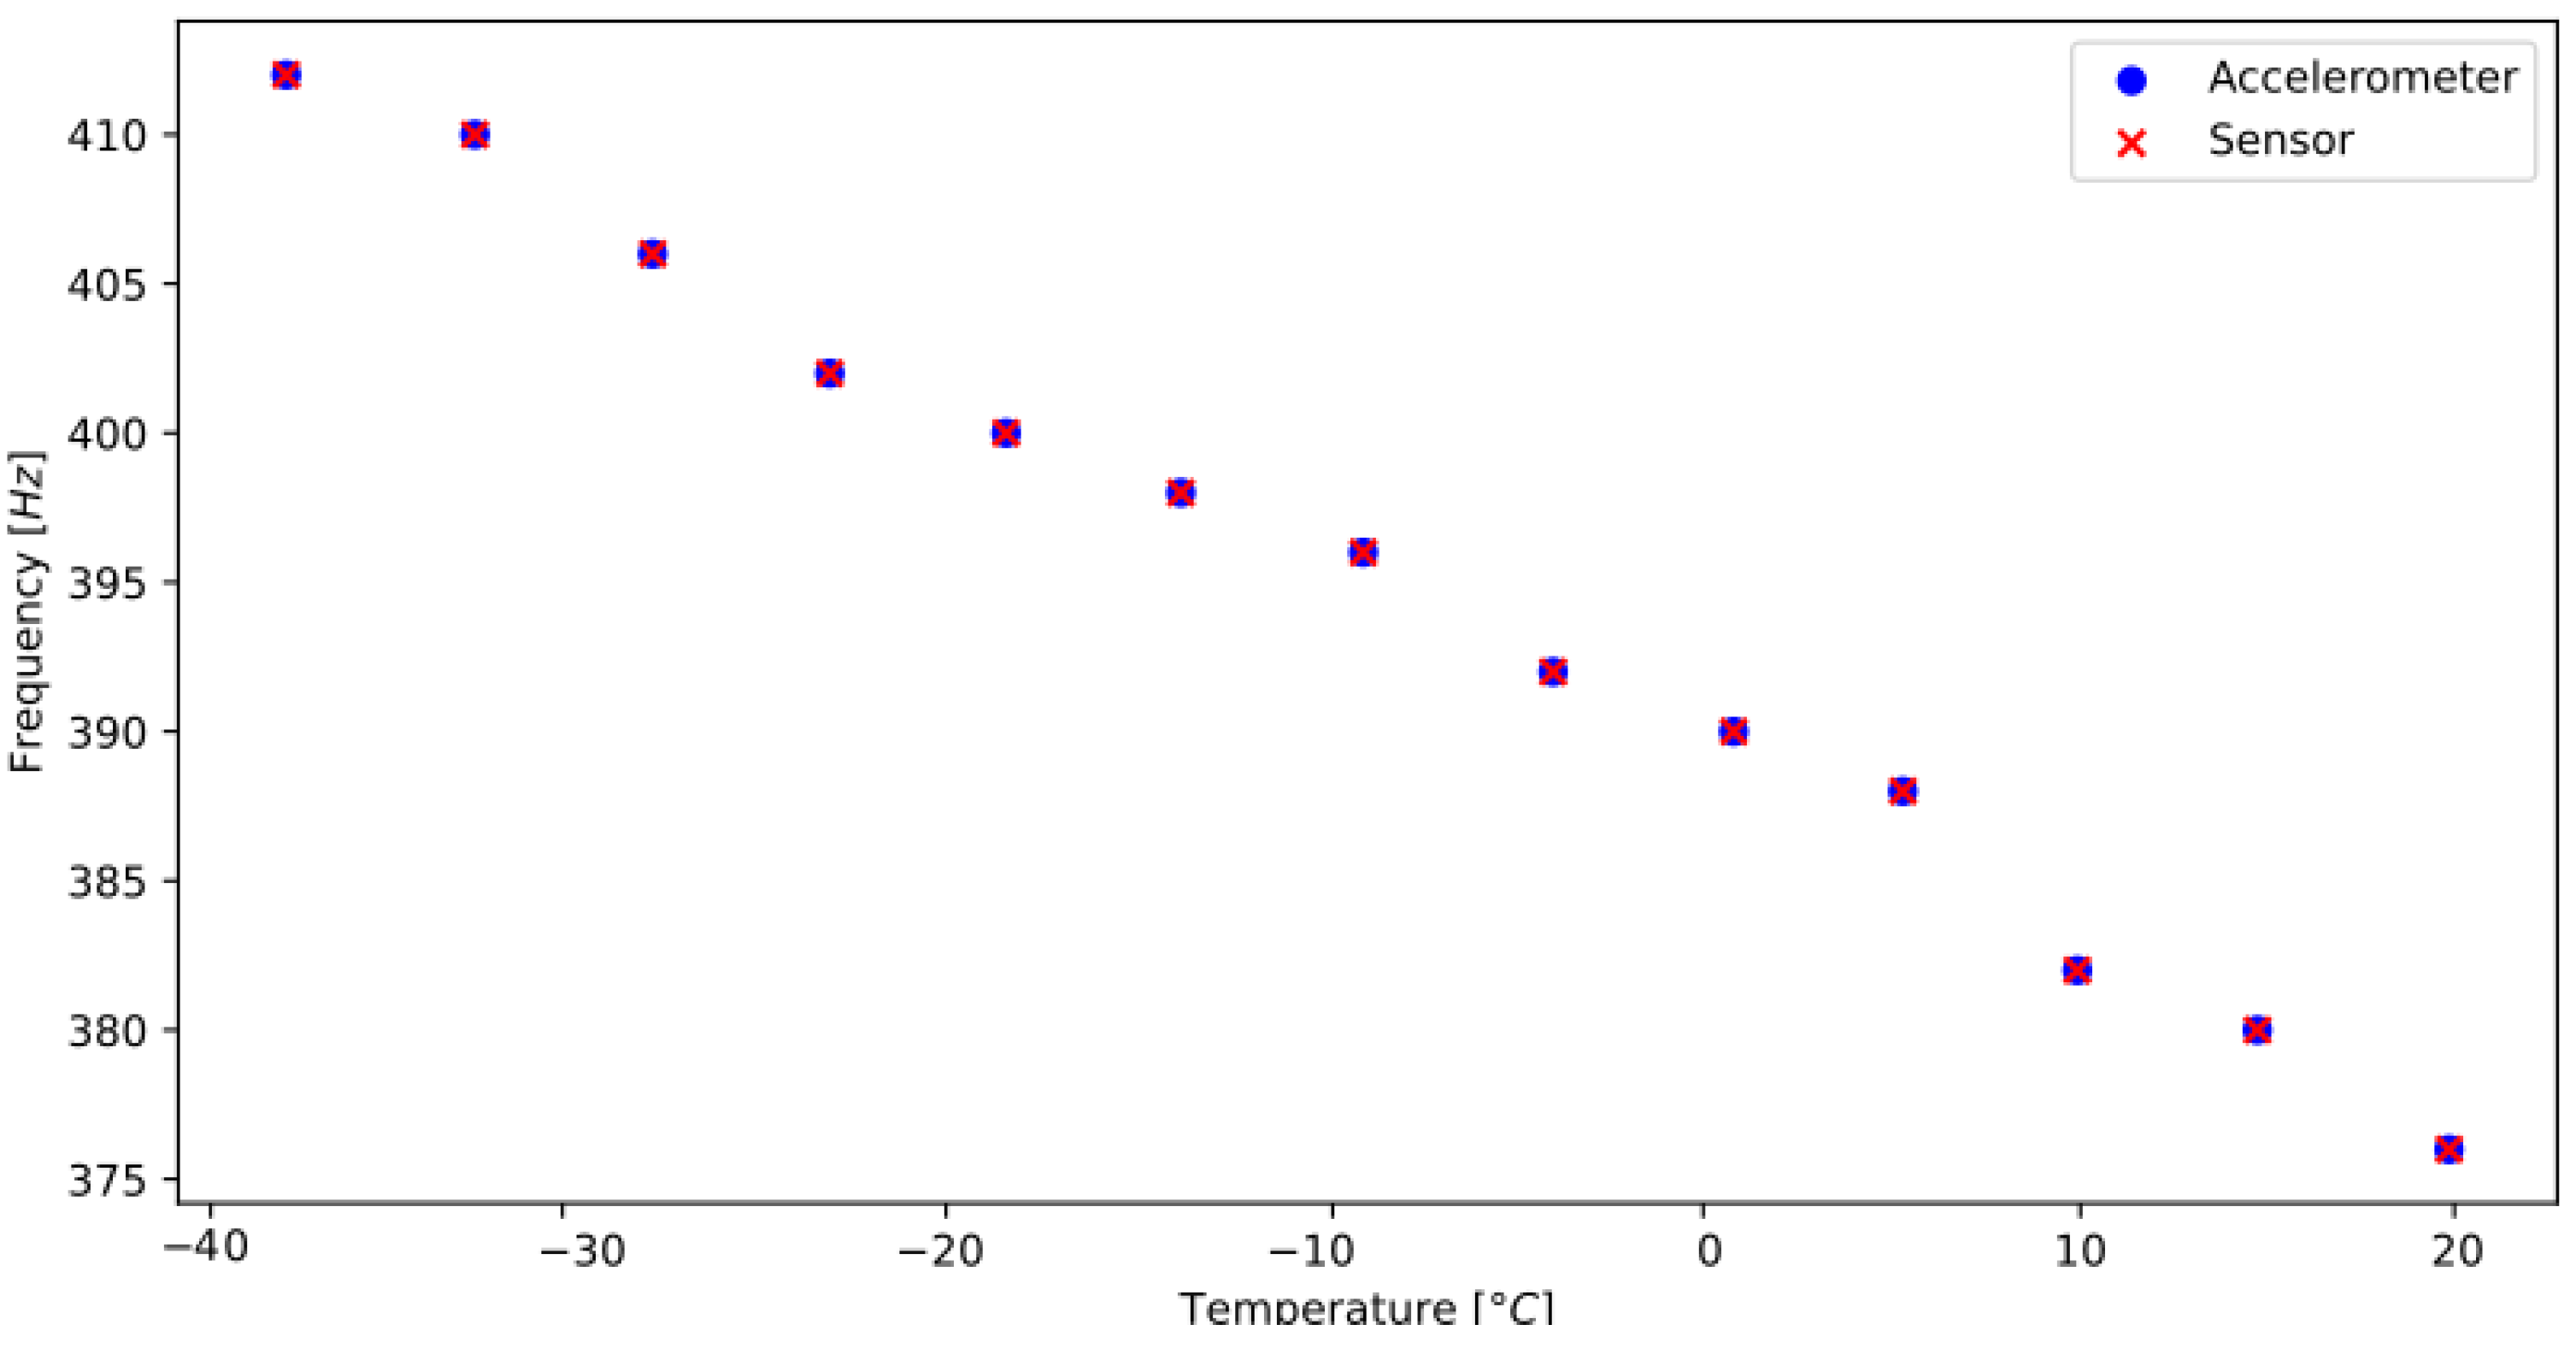
Figure 8 shows that the frequencies obtained experimentally from both the accelerometer and the sensor are in excellent agreement. Additionally, it is evident that the natural frequency decreases with increasing temperature.
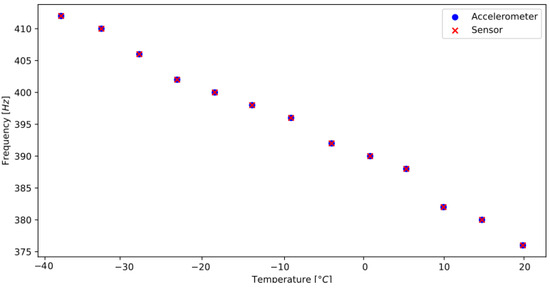
Figure 8.
Comparison of the experimentally obtained resonant frequencies from the Frequency Response Functions of the accelerometer and the printed sensor.
5. Conclusions
This paper presents preliminary tests conducted on a simple structure, such as a beam, to analyze the capabilities of an additively manufactured sensor to operate under dynamic and thermal loading conditions. Specifically, separate tests were conducted to first evaluate the effect of temperature and then integrate and assess the combined effect of dynamic loading with temperature variations. The results show the following:
- A parabolic trend between resistance variation and temperature increase under both static and dynamic conditions.
- A linear response of the piezoresistive sensor at each temperature range.
- The ability of the sensor to generate frequency response functions (FRFs) similar to an accelerometer.
- A 0% error between the resonance frequencies monitored by the accelerometer and the sensor within the considered temperature ranges.
These preliminary results provide a solid foundation for future tests and more detailed analyses, particularly in terms of the measurement capabilities and temperature dependence of these sensors.
Author Contributions
Conceptualization, A.S., M.P. and G.M.; methodology, A.S. and M.P.; software, A.S.; validation, A.S., M.P. and G.M.; formal analysis, A.S., M.P. and G.M.; investigation, A.S.; resources, A.S.; data curation, A.S., M.P. and G.M.; writing—original draft preparation, A.S.; writing—review and editing, A.S., M.P. and G.M.; visualization, F.C.; supervision, F.C.; project administration, F.C.; funding acquisition, F.C. All authors have read and agreed to the published version of the manuscript.
Funding
This research was funded by the European Union—NextGenerationEU under the Italian Ministry of University and Research (MUR) National Innovation Ecosystem grant ECS00000041-VITALITY.
Institutional Review Board Statement
Not applicable.
Informed Consent Statement
Not applicable.
Data Availability Statement
All data is available upon request.
Acknowledgments
We acknowledge Università degli Studi di Perugia and MUR for support within the project Vitality.
Conflicts of Interest
The authors declare no conflicts of interest.
References
- Calignano, F.; Manfredi, D.; Ambrosio, E.P.; Biamino, S.; Lombardi, M.; Atzeni, E.; Salmi, A.; Minetola, P.; Iuliano, L.; Fino, P. Overview on Additive Manufacturing Technologies. Proc. IEEE 2019, 105, 593–612. [Google Scholar] [CrossRef]
- Najmon, J.C.; Raeisi, S.; Tovar, A. Review of additive manufacturing technologies and applications in the aerospace industry. Addit. Manuf. Aerosp. Ind. 2017, 7–31. [Google Scholar] [CrossRef]
- Xu, Y.; Wu, X.; Guo, X.; Kong, B.; Zhang, M.; Qian, X.; Mi, S.; Sun, W. The Boom in 3D-Printed Sensor Technology. Sensors 2017, 17, 1166. [Google Scholar] [CrossRef] [PubMed]
- Jiang, Y.; Islam, M.N.; He, R.; Huang, X.; Cao, P.F.; Advincula, R.C.; Choi, W. Recent advances in 3D printed sensors: Materials, design, and manufacturing. Adv. Mater. Technol. 2023, 8, 2200492. [Google Scholar] [CrossRef]
- Słoma, M. 3D printed electronics with nanomaterials. Nanoscale 2023, 15, 5623–5648. [Google Scholar] [CrossRef] [PubMed]
- Lehmhus, D.; Aumund-Kopp, C.; Petzoldt, F.; Godlinski, D.; Haberkorn, A.; Zöllmer, V.; Busse, M. Customized smartness: A survey on links between additive manufacturing and sensor integration. Procedia Technol. 2016, 26, 284–301. [Google Scholar] [CrossRef]
- Hassan, M.S.; Zaman, S.; Dantzler, J.Z.R.; Leyva, D.H.; Mahmud, M.S.; Ramirez, J.M.; Gomez, S.G.; Lin, Y. 3D Printed Integrated Sensors: From Fabrication to Applications—A Review. Nanomaterials 2023, 13, 3148. [Google Scholar] [CrossRef] [PubMed]
- Sbriglia, L.R.; Baker, A.M.; Thompson, J.M.; Morgan, R.V.; Wachtor, A.J.; Bernardin, J.D. Embedding sensors in FDM plastic parts during additive manufacturing. In Topics in Modal Analysis & Testing, Volume 10: Proceedings of the 34th IMAC, A Conference and Exposition on Structural Dynamics; Springer International Publishing: Orlando, FL, USA, 2016; pp. 205–214. [Google Scholar]
- Gackowski, B.M.; Goh, G.D.; Sharma, M.; Idapalapati, S. Additive manufacturing of nylon composites with embedded multi-material piezoresistive strain sensors for structural health monitoring. Compos. Part B Eng. 2023, 261, 110796. [Google Scholar] [CrossRef]
- Maurizi, M.; Slavič, J.; Cianetti, F.; Jerman, M.; Valentinčič, J.; Lebar, A.; Boltežar, M. Dynamic measurements using FDM 3D-printed embedded strain sensors. Sensors 2019, 19, 2661. [Google Scholar] [CrossRef] [PubMed]
- Staffa, A.; Palmieri, M.; Morettini, G.; Cianetti, F.; Braccesi, C. Integration of Piezoresistive Sensors into AM Structural Components: Evaluation of Sensor Properties and Its Impact on Component Mechanical Performance. In IOP Conference Series: Materials Science and Engineering; IOP Publishing: Genova, IT, USA, 2024. [Google Scholar]
- Arh, M.; Slavič, J. Single-process 3D-printed triaxial accelerometer. Adv. Mater. Technol. 2022, 7, 2101321. [Google Scholar] [CrossRef]
- Košir, T.; Zupan, M.; Slavič, J. Self-aware active metamaterial cell 3D-printed in a single process. Int. J. Mech. Sci. 2024, 282, 109591. [Google Scholar] [CrossRef]
- Sapra, S.; Chakraborthy, A.; Nuthalapati, S.; Nag, A.; Inglis, D.W.; Mukhopadhyay, S.C.; Altinsoy, M.E. Printed, wearable e-skin force sensor array. Measurement 2023, 206, 112348. [Google Scholar] [CrossRef]
- Osman, A.; Lu, J. 3D printing of polymer composites to fabricate wearable sensors: A comprehensive review. Mater. Sci. Eng. R Rep. 2023, 154, 100734. [Google Scholar] [CrossRef]
- Ju, M.; Dou, Z.; Li, J.W.; Qiu, X.; Shen, B.; Zhang, D.; Wang, K. Piezoelectric materials and sensors for structural health monitoring: Fundamental aspects, current status, and future perspectives. Sensors 2023, 23, 543. [Google Scholar] [CrossRef]
- Dijkshoorn, A.; Werkman, P.; Welleweerd, M.; Wolterink, G.; Eijking, B.; Delamare, J.; Krijnen, G.J. Embedded sensing: Integrating sensors in 3-D printed structures. J. Sens. Sens. Syst. 2018, 7, 169–181. [Google Scholar] [CrossRef]
- Jelva, H.K.S.; Subramaniam, M.P.; Mohammed, K.K.T.; Sreeram, P.; Parvathi, S.; Sari, P.S.; Raghavan, P. Fabrication and challenges of 3D printed sensors for biomedical applications-Comprehensive review. Results Eng. 2024, 101867. [Google Scholar]
- Palmieri, M.; Slavič, J.; Cianetti, F. Single-process 3D-printed structures with vibration durability self-awareness. Addit. Manuf. 2021, 47, 102303. [Google Scholar] [CrossRef]
- Technology CubeSats. Available online: https://www.esa.int/Enabling_Support/Space_Engineering_Technology/Technology_CubeSats (accessed on 13 June 2024).
- Morettini, G.; Zucca, G.; Braccesi, C.; Cianetti, F.; Dionigi, M. Cubesat spatial expedition: An overview from design to experimental verification. In IOP Conference Series: Materials Science and Engineering; IOP Publishing: Genova, IT, USA, 2021. [Google Scholar]
- Xiao, L.; Shi, W.; Li, X.; Shen, C.; Wang, Y.; Mu, R.; Wang, K. A novel design of a deployable CubeSat for material exposure missions in low earth orbit. CEAS Space J. 2023, 15, 641–653. [Google Scholar] [CrossRef]
- Corpino, S.; Caldera, M.; Nichele, F.; Masoero, M.; Viola, N. Thermal design and analysis of a nanosatellite in low earth orbit. Acta Astronaut. 2015, 115, 247–261. [Google Scholar] [CrossRef]
- Da Silva Cardozo, R.; Donati, D.C.X.; Possamai, T.S.; Oba, R. Thermal analysis of the impact of six month in a 1U CubeSat in LEO. COB-2023-0444. In Proceedings of the 27th International Congress of Mechanical Engeneering, Florianópolis, Brazil, 4–8 December 2023. [Google Scholar]
- Falcon User’s Guide. Available online: https://www.spacex.com/media/falcon-users-guide-2021-09.pdf (accessed on 19 June 2024).
- SSMS Vega-C User’s Manual. Available online: https://ariane.group/app/uploads/sites/4/2024/10/SSMS-Vega-C-UsersManual-Issue-1-Rev0-Sept2020.pdf (accessed on 19 June 2024).
- Protopasta. Available online: https://proto-pasta.com/products/conductive-pla?srsltid=AfmBOoqNEThJQSkb06joQ5tCZWMK-ltDu1TxK8uID_2evEo8b3TBOZ7G (accessed on 24 May 2023).

Disclaimer/Publisher’s Note: The statements, opinions and data contained in all publications are solely those of the individual author(s) and contributor(s) and not of MDPI and/or the editor(s). MDPI and/or the editor(s) disclaim responsibility for any injury to people or property resulting from any ideas, methods, instructions or products referred to in the content. |
© 2025 by the authors. Licensee MDPI, Basel, Switzerland. This article is an open access article distributed under the terms and conditions of the Creative Commons Attribution (CC BY) license (https://creativecommons.org/licenses/by/4.0/).