Abstract
The reliable prediction of future system behavior using sensor data is often hindered by inherent uncertainties, especially in cases where the data undergo gradual changes over time. These uncertainties typically arise from environmental factors or system degradation, posing significant challenges to accurate prognosis and decision making. In this study, we propose a solution to address this issue by employing confidence intervals to quantify uncertainty in prognosis based on progressively drifted sensor data. Our approach aims to establish a robust framework for evaluating the uncertainty associated with predictions derived from sensor data affected by gradual changes. To illustrate the importance of our proposed method, we mathematically model an exponentially growing sinusoidal pattern with additive noise and outliers, a pattern commonly observed in vibration signals from rotating machinery. Through various deep learning models, well trained and optimized under hyperparameter optimizations and validation, our empirical validation and analysis demonstrate the effectiveness of our approach in enhancing the reliability and accuracy of prognosis models in dynamic sensor data environments. Thus, we draw important conclusions about the trustworthiness of predictions. This research study contributes to advancing the understanding and application of statistical techniques in managing uncertainty within sensor-based prognostic systems, thereby improving their effectiveness across diverse real-world applications.
1. Introduction
Prognostics and health management (PHM) systems play a crucial role in ensuring the operational efficiency and longevity of mechanical systems [1]. Within this domain, predicting the remaining useful life or assessing the health index is paramount for preemptive maintenance, cost reduction, and overall system reliability [2]. Central to these endeavors is the utilization of learning systems, which harness the power of data-driven methodologies to glean insights and make informed decisions [3]. Vibration analysis stands out as a cornerstone technique in PHM, offering invaluable insights into the health and performance of mechanical systems [4]. By monitoring and interpreting vibration signals, analysts can detect anomalies, identify potential faults, and predict impending failures [5]. However, in real-world scenarios characterized by harsh environmental conditions and diverse system operating conditions, the complexity of the PHM process escalates significantly. The interplay between environmental factors, system dynamics, and degradation mechanisms poses formidable challenges, necessitating sophisticated approaches for uncertainty quantification.
Uncertainty quantification emerges as a critical component in the realm of PHM, addressing the inherent unpredictability stemming from various sources such as measurement errors, model approximations, and environmental variability. Despite its significance, the existing literature often lacks detailed explanations and clear methodologies, presenting a barrier for beginners and impeding further advancements in the field [6].
In this paper, we aim to address this gap by providing a comprehensive framework for uncertainty quantification in sensor data-driven prognosis. Our contributions are threefold:
1. Mathematical model utilization: We employ a mathematical model to interpret vibration signals, assuming the presence of a bearing with degraded behavior. Additionally, we introduce a confidence interval-based z-score margin error to quantify uncertainty, leveraging features derived from the confidence interval.
2. Hyperparameters optimization: We propose a novel approach to hyperparameter optimization based on uncertainty quantification. By integrating uncertainty considerations into the optimization process, we enhance the robustness and generalization capabilities of the learning system.
3. LSTM with uncertainty objective minimization: We explore the use of long short-term memory (LSTM) networks tuned based on uncertainty objective minimization. A comparative analysis is conducted between LSTM models optimized for uncertainty minimization and those optimized for root mean square error (RMSE) minimization, shedding light on the efficacy of our proposed methodology [7].
The subsequent sections of this paper are structured as follows: Section 2 elaborates on the materials used, detailing the generation of synthetic data. Section 3 delineates the methodology employed for confidence interval construction and uncertainty quantification. Section 4 is dedicated to presenting the results of our experiments and comparative analyses. Finally, Section 5 encapsulates our conclusions and outlines avenues for future research.
2. Materials
Simulating the degradation data of vibration measurements that are assumed to be obtained from a deteriorating mechanical system passes via several key steps. Initially, time vector is formulated, comprising a predetermined number of points upon which the degradation data will be constructed. Sensor measurements are generated as a composite signal involving a sinusoidal oscillation with exponential decay, represented mathematically as in (1). Here, signifies the amplitude of the sinusoidal component, represents the oscillation frequency, and denotes the decay rate governing the exponential decay process. The term is the sinusoidal oscillations, while encapsulates the decay aspect, yielding a signal that exhibits sinusoidal behavior with increasing amplitude over time. Following the generation of the base signal, Gaussian noise and outliers are introduced to mirror real-world measurement errors and environmental disturbances. Lastly, health index is generated to reflect the progressive degradation of the mechanical system. It is depicted as a linearly decreasing function, signifying the system’s health status over time. Mathematically, health index is expressed as in (2), where is the number of points in .
Sensor measurements and the associated decay landscape are depicted in Figure 1, offering a comprehensive visualization of the simulated degradation process and its temporal evolution. Through this integrated approach, synthetic degradation data akin to vibration measurements from deteriorating mechanical systems are effectively generated, facilitating investigations into prognostics and health management endeavors.
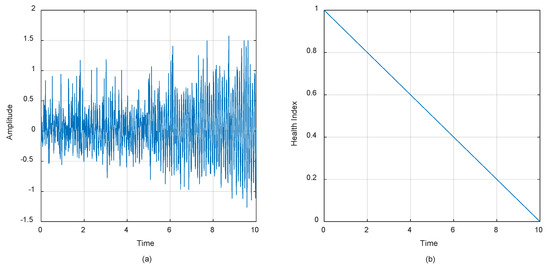
Figure 1.
Generated vibration data: (a) run-to-fail lifecycle vibration measurements; (b) linearly degraded health index.
3. Methods
This work adopts a confidence interval (CI) based on the z-score to measure uncertainty in predictions [8], specifically as depicted in (3), where is the sample mean, and represents the score associated with a given confidence level (i.e., 99% in this work results in ). signifies the standard deviation , and is the number of points in T as already mentioned.
The objective function can incorporate various CI features, such as stability and coverage probability. However, for illustrative purposes, this work primarily focuses on the interval width as in (4) as the main objective. The narrower the interval, the higher the level of certainty in the predictions is obtained.
4. Results
An LSTM network is trained and its hyperparameters are optimized using Bayesian optimization with the objective of minimizing the confidence interval width [9]. This approach is then compared to a reference LSTM trained with the objective of minimizing RMSE. The data are not preprocessed; instead, they are simply divided into training and testing sets using the 20–80% rule. We are aware that this method of data processing and splitting may not be optimal, but the goal of this small-scale study is to observe the differences between the two training methodologies and draw conclusions accordingly.
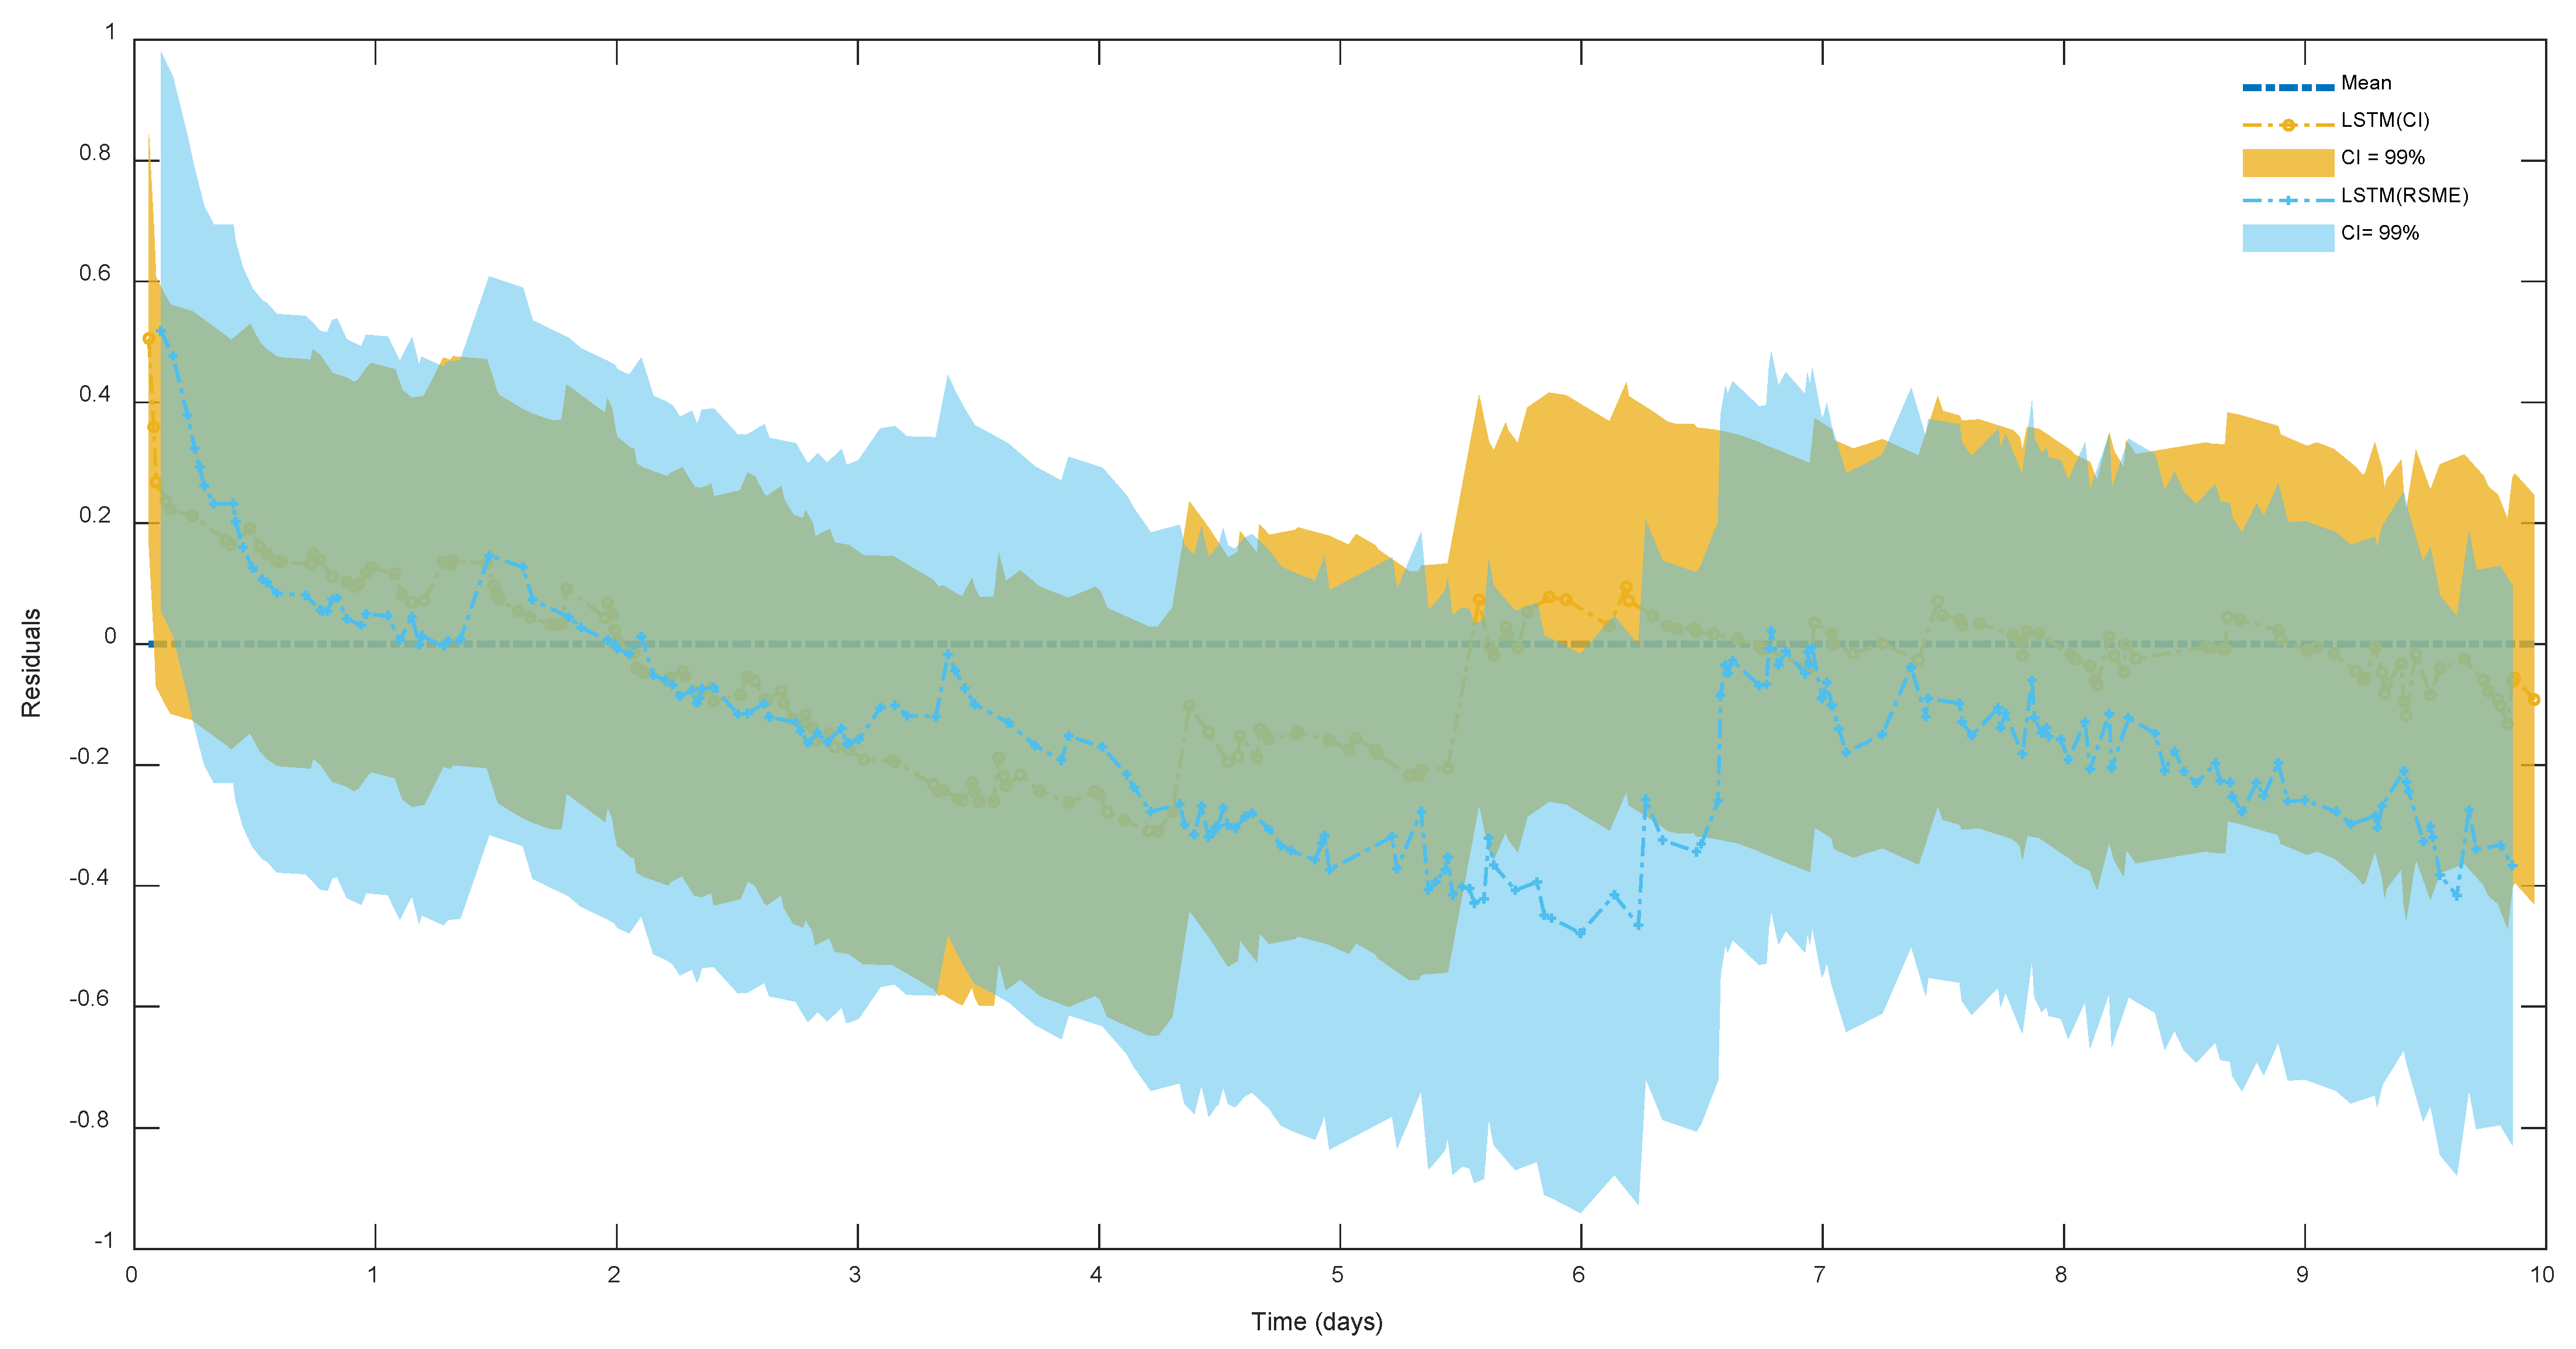
In Figure 2, we present the results obtained by testing two neural network models on a holdout set comprising 20% of the dataset. This evaluation is conducted to assess the generalization performance of the models beyond the training data. The figure displays the prediction residuals along with the corresponding confidence intervals obtained for each model.
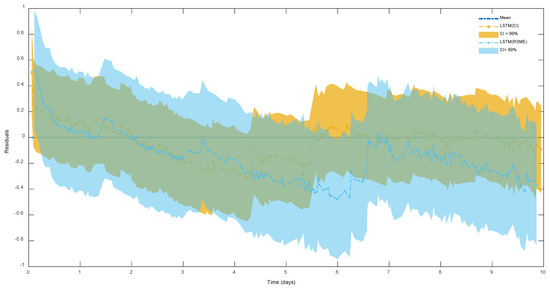
Figure 2.
Obtained uncertainty quantification results.
Specifically, we compare the performance of two LSTM networks trained using different objectives: one under an uncertainty quantification objective (i.e., interval width) and the other under an RMSE objective.
The LSTM network trained under the uncertainty quantification objective demonstrates tighter and more stable confidence intervals compared to the ordinary LSTM trained under the RMSE objective. This observation indicates that the uncertainty quantification objective leads to better uncertainty estimation in the predictions. Tighter confidence intervals signify a higher level of confidence in the model’s predictions, while stability in the intervals suggests robustness against variations in the data.
Additionally, it is noteworthy that the residuals observed in the LSTM network trained under the uncertainty quantification objective are closer to zero on average compared to those in the ordinary LSTM trained under the RMSE objective. This closer proximity to zero suggests that the uncertainty-aware LSTM model tends to produce predictions that are more centered around the true values, indicating a higher level of accuracy and potentially better model calibration.
Overall, Figure 2 highlights the effectiveness of optimizing neural network models for uncertainty quantification objectives, particularly in enhancing the reliability, stability, and accuracy of predictions, which are crucial for making informed decisions in various applications, including prognostics and health management.
5. Conclusions
In this study, we investigated the performance of LSTM neural network models trained under different objectives for predicting bearing degradation through vibration measurements. Specifically, we compared models trained under an uncertainty quantification objective and an RMSE objective. Our results demonstrate that optimizing LSTM models for uncertainty quantification objectives leads to several advantages over traditional RMSE-based training approaches. Firstly, the LSTM network trained under the uncertainty quantification objective exhibited tighter and more stable confidence intervals, indicating improved uncertainty estimation in the predictions. This enhanced uncertainty estimation is essential for providing reliable and informative predictions, especially in critical applications such as prognostics and health management. Furthermore, we observed that the residuals of the LSTM network trained under the uncertainty quantification objective were closer to zero on average compared to those of the RMSE-based LSTM model. This suggests that the uncertainty-aware LSTM model tends to produce predictions that are more centered around the true values, indicating a higher level of accuracy and potentially better model calibration. Overall, our findings highlight the importance of considering uncertainty quantification objectives in the training of predictive models for degradation prediction tasks. By incorporating uncertainty quantification into the model optimization process, we can enhance the reliability, stability, and accuracy of predictions, ultimately leading to more effective prognostics and health management strategies for mechanical systems. Future research could explore advanced uncertainty quantification techniques, like random weighting and one-sided confidence intervals for quantiles in discrete distributions, across various degradation data and models. Additionally, assessing the impact of uncertainty-aware predictions on decision-making and maintenance strategies would offer valuable insights for prognostics and health management.
Author Contributions
Conceptualization, T.B. and M.B.; methodology, T.B. and M.B.; software, T.B.; validation, T.B. and M.B.; formal analysis, T.B. and M.B.; investigation, T.B. and M.B.; resources, T.B.; data curation, T.B.; writing—original draft preparation, T.B.; writing—review and editing, T.B. and M.B. All authors have read and agreed to the published version of the manuscript.
Funding
This research received no external funding.
Institutional Review Board Statement
Not applicable.
Informed Consent Statement
Not applicable.
Data Availability Statement
Data used in this paper and all codes are publicly available at https://zenodo.org/doi/10.5281/zenodo.11120106 (accessed on 6 May 2024).
Conflicts of Interest
The authors declare no conflicts of interest.
References
- Berghout, T.; Mouss, M.-D.; Mouss, L.; Benbouzid, M. ProgNet: A Transferable Deep Network for Aircraft Engine Damage Propagation Prognosis under Real Flight Conditions. Aerospace 2022, 10, 10. [Google Scholar] [CrossRef]
- Hu, Y.; Liu, S.; Lu, H.; Zhang, H. Remaining Useful Life Model and Assessment of Mechanical Products: A Brief Review and a Note on the State Space Model Method. Chinese J. Mech. Eng. 2019, 32, 15. [Google Scholar] [CrossRef]
- He, B.; Liu, L.; Zhang, D. Digital Twin-Driven Remaining Useful Life Prediction for Gear Performance Degradation: A Review. J. Comput. Inf. Sci. Eng. 2021, 21, 030801. [Google Scholar] [CrossRef]
- Ferreira, C.; Gonçalves, G. Remaining Useful Life Prediction and Challenges: A Literature Review on the Use of Machine Learning Methods. J. Manuf. Syst. 2022, 63, 550–562. [Google Scholar] [CrossRef]
- Lei, Y.; Li, N.; Guo, L.; Li, N.; Yan, T.; Lin, J. Machinery Health Prognostics: A Systematic Review from Data Acquisition to RUL Prediction. Mech. Syst. Signal Process. 2018, 104, 799–834. [Google Scholar] [CrossRef]
- Sankararaman, S.; Goebel, K. Why Is the Remaining Useful Life Prediction Uncertain? In Proceedings of the Annual Conference of the PHM Society 2013, New Orleans, LA, USA, 14–17 October 2013; pp. 337–349. [Google Scholar] [CrossRef]
- Yu, Y.; Si, X.; Hu, C.; Zhang, J. A Review of Recurrent Neural Networks: LSTM Cells and Network Architectures. Neural Comput. 2019, 31, 1235–1270. [Google Scholar] [CrossRef] [PubMed]
- Poole, C. Beyond the Confidence Interval. Am. J. Public Health 1987, 77, 195. [Google Scholar] [CrossRef] [PubMed]
- Wu, J.; Chen, X.Y.; Zhang, H.; Xiong, L.D.; Lei, H.; Deng, S.H. Hyperparameter Optimization for Machine Learning Models Based on Bayesian Optimization. J. Electron. Sci. Technol. 2019, 17, 26–40. [Google Scholar] [CrossRef]

Disclaimer/Publisher’s Note: The statements, opinions and data contained in all publications are solely those of the individual author(s) and contributor(s) and not of MDPI and/or the editor(s). MDPI and/or the editor(s) disclaim responsibility for any injury to people or property resulting from any ideas, methods, instructions or products referred to in the content. |
© 2024 by the authors. Licensee MDPI, Basel, Switzerland. This article is an open access article distributed under the terms and conditions of the Creative Commons Attribution (CC BY) license (https://creativecommons.org/licenses/by/4.0/).