Proceeding Paper

The Correlation of Pickled Fish and Frequency Response Using Parallel-Coupled-Lines Band-Stop Filter Microstrip †

by
Warakorn Karasaeng
1,
Jitjark Nualkham
1,
Phatsakul Thitimahatthanakusol
2,
Niwat Angkawisittpan
3 and
Somchat Sonasang
4,*
1
Faculty of Industrial Technology, Nakhon Phanom University, Nakhon Phanom 48000, Thailand
2
Department of Telecommunication Engineering, Faculty of Engineering and Technology Rajamangala University of Technology Isan, Nakorn Ratchasima 30000, Thailand
3
Research Unit for Electrical and Computer Engineering Technology (RECENT), Faculty of Engineering, Mahasarakham University, Maha Sarakham 44150, Thailand
4
Electrical Elements and Wireless Devices Unit (EEWDU), Faculty of Industrial Technology, Nakhon Phanom University, Nakhon Phanom 48000, Thailand
*
Author to whom correspondence should be addressed.
Presented at the 11th International Electronic Conference on Sensors and Applications (ECSA-11), 26–28 November 2024; Available online: https://sciforum.net/event/ecsa-11.
Eng. Proc. 2024, 82(1), 13; https://doi.org/10.3390/ecsa-11-20508
Published: 26 November 2024

Abstract

This research presents the development and analysis of a microwave sensor designed with a microstrip band-stop filter, aimed at applications in electrical engineering and food quality assessment. The sensor employs parallel-coupled lines within the microstrip, integrating a band-stop filter at 2.45 GHz on an FR4 substrate. The primary objective is to evaluate preserved fish samples to demonstrate the sensor’s efficacy and applicability. Measurements were conducted using a KEYSIGHT model E5063A network analyzer, covering a frequency range from 0.1 GHz to 3 GHz. The analysis focuses on the frequency response of the insertion loss (S21) across specified frequencies. The results indicate a significant correlation between the percentage shift in the transmission coefficient and the frequency, even when the sample range was meticulously adjusted. These findings underscore the potential of microwave sensors in monitoring the physical properties of preserved food, particularly within food production and quality control processes. The sensor facilitates rapid and precise assessments of food properties, highlighting its broad applicability in various sectors of the food industry. Furthermore, this research contributes to the advancement of microwave technology, suggesting new pathways for future studies and applications in engineering and industrial contexts. The integration of microstrip technology with band-stop filters in sensor design presents a novel approach that enhances the accuracy and efficiency of food quality monitoring systems. This study not only establishes a foundation for further technological developments but also emphasizes the interdisciplinary nature of modern engineering solutions, combining principles of electrical engineering with practical applications in the food industry. This innovative approach could lead to more sophisticated and reliable methods for ensuring food safety and quality.

1. Introduction

Pickled fish, commonly known as pla som, holds considerable cultural and economic significance in Thailand, particularly in its northeastern regions. The distinctive sour taste of pla som is the result of a complex fermentation process involving lactic acid bacteria, which are essential in developing both the taste and quality of the product. Additionally, pickled fish is a valuable source of protein and amino acids, making it an integral part of the local diet. However, maintaining consistent quality and ensuring safety during production remain key challenges due to variations in fermentation conditions and ingredient quality, which can impact the final product.
To improve the consistency and safety of fermented food products like pla som, modern sensing technologies have emerged as crucial tools. One highly effective approach involves microwave sensing, renowned for its non-invasive, rapid analysis of food properties. Microwave sensors, especially those using coupled microstrip lines, offer exceptional sensitivity when monitoring the dielectric properties of fermented products [1,2,3]. The development of microwave sensors for material characterization and food quality assessment has been an area of growing interest due to its non-invasive and rapid analysis capabilities. One study by Shahzad et al. introduced a metamaterial sensor using a complementary split-ring resonator (CSRR) for measuring the dielectric properties of materials. Their sensor demonstrated high sensitivity in detecting coal powder dielectric constants with a deep notch in transmission loss, showing the potential for non-destructive testing in various applications [1]. Another relevant study by Jelali and Papadopoulos focused on the application of microwave and terahertz technologies for the inline inspection of packaged food. Their review emphasized how microwave sensors are particularly useful for detecting foreign bodies and assessing food quality in real-time production environments [2]. Additionally, research by Zappia et al. further demonstrated how terahertz imaging could be employed to detect contaminants in food products, highlighting the versatility of electromagnetic sensing technologies in ensuring food safety [3]. These works collectively underline the growing application of microwave and metamaterial sensors in food quality control, demonstrating their efficacy in both industrial and research settings. The study by Aiswarya et al. presents the development of a compact microwave sensor using a closed-loop resonator for detecting adulteration in solid and liquid substances. Operating at 2.4 GHz, the sensor achieved significant size reductions and demonstrated high accuracy with less than 6% error between experimental and simulated results. The sensor’s high sensitivity, driven by the dielectric properties of the materials, enables real-time detection of food adulteration through changes in resonant frequency and scattering parameters. This research highlights the potential of microwave sensors for ensuring food safety and quality control, offering an effective, non-invasive method for material characterization [4]. In recent years, its application in material characterization, particularly in soil moisture measurement, has gained attention. The study by Karasaeng et al. demonstrated the use of microwave sensors based on band-stop filter (BSF) coupled lines for measuring soil moisture, offering high sensitivity and precision in real-time monitoring. This approach aligns with other research utilizing microwave technology for food and environmental quality assessments, such as detecting moisture content, contamination, and dielectric property changes in agricultural and food products. Microwave sensors, particularly those leveraging BSF and coupled-line designs, have proven effective in non-destructive testing and real-time quality control across industries. This growing body of research underscores the versatility and practicality of microwave sensors in both industrial and agricultural contexts [5]. The research explores the potential of microwave technology for non-invasive, real-time detection of alcohol levels. The sensor operates at specific frequency ranges where alcohol’s dielectric properties can be accurately measured, leveraging the sensitivity of microstrip BSF designs. The findings indicate that this sensor design is effective for alcohol concentration measurement, which could have applications in various industries, including food safety and biofuel production. The study contributes to the expanding field of microwave sensor technology, demonstrating the versatility of BSF-based sensors in material characterization and quality control [6].
In this study, the development of a microwave sensor for evaluating pickled fish quality builds upon advancements in coupled-line and microstrip technology. By utilizing innovative design techniques, the sensor incorporates a one-section band-stop filter (BSF) aimed at optimizing performance for precise material property measurements. The design and construction of the filter are grounded in previous studies [5,6], ensuring it meets the necessary specifications for high efficiency and sensitivity across various test conditions. The BSF effectively blocks unwanted frequency bands, significantly improving the accuracy of electrical property measurements, making it highly suitable for quality assessments in food products such as pickled fish.

2. Methods

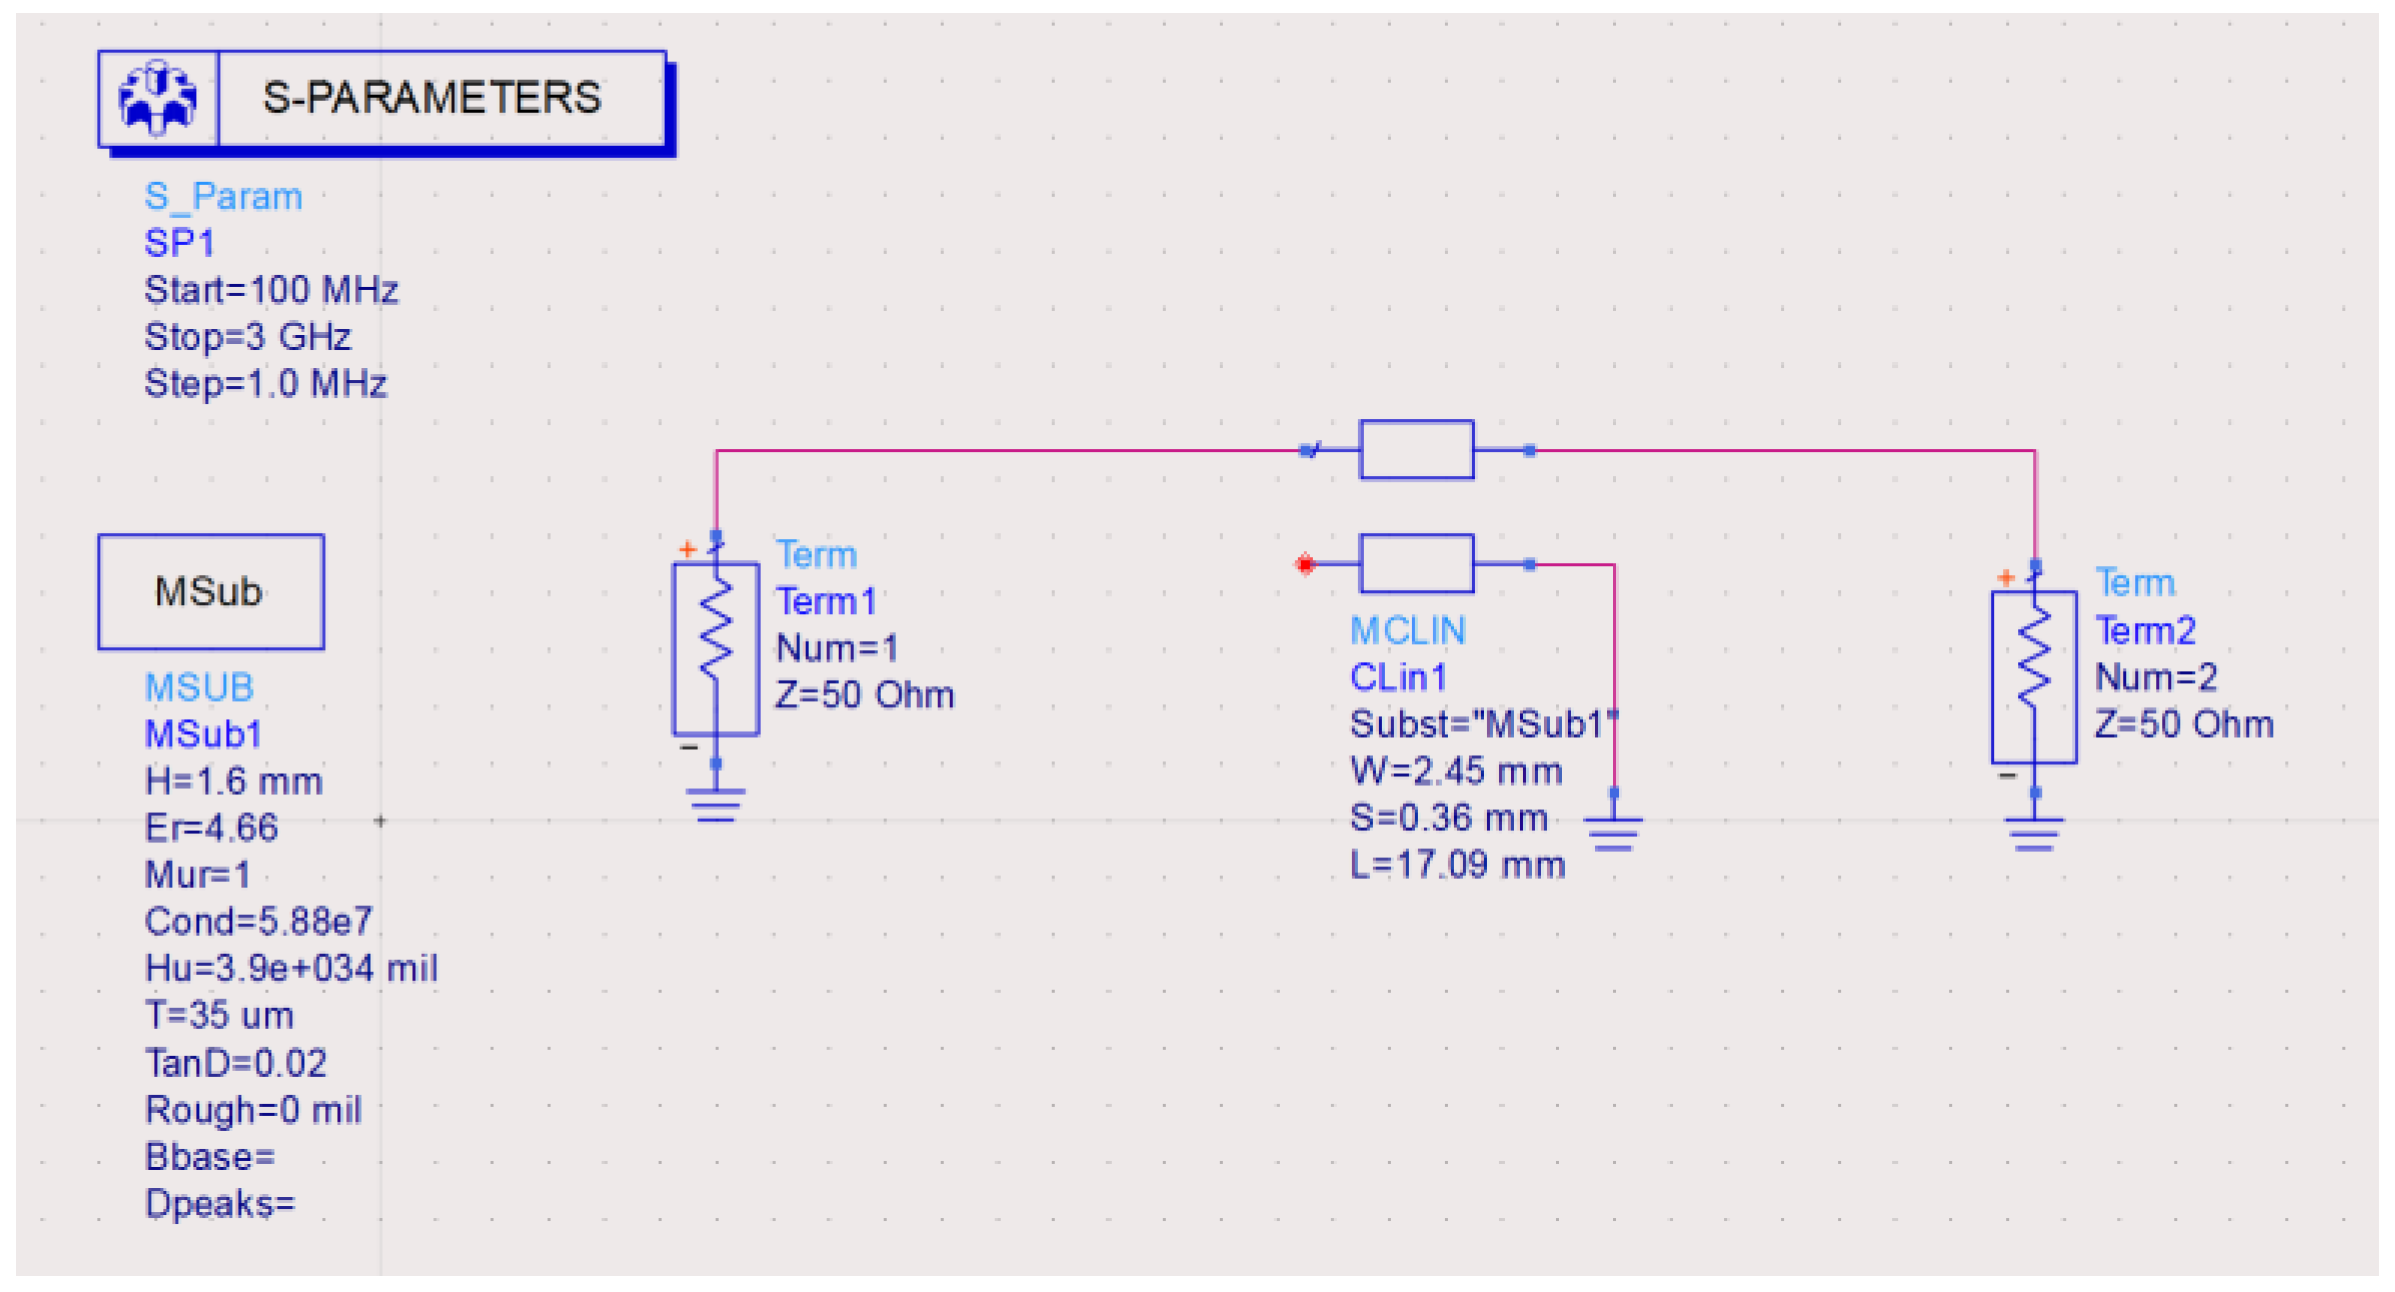
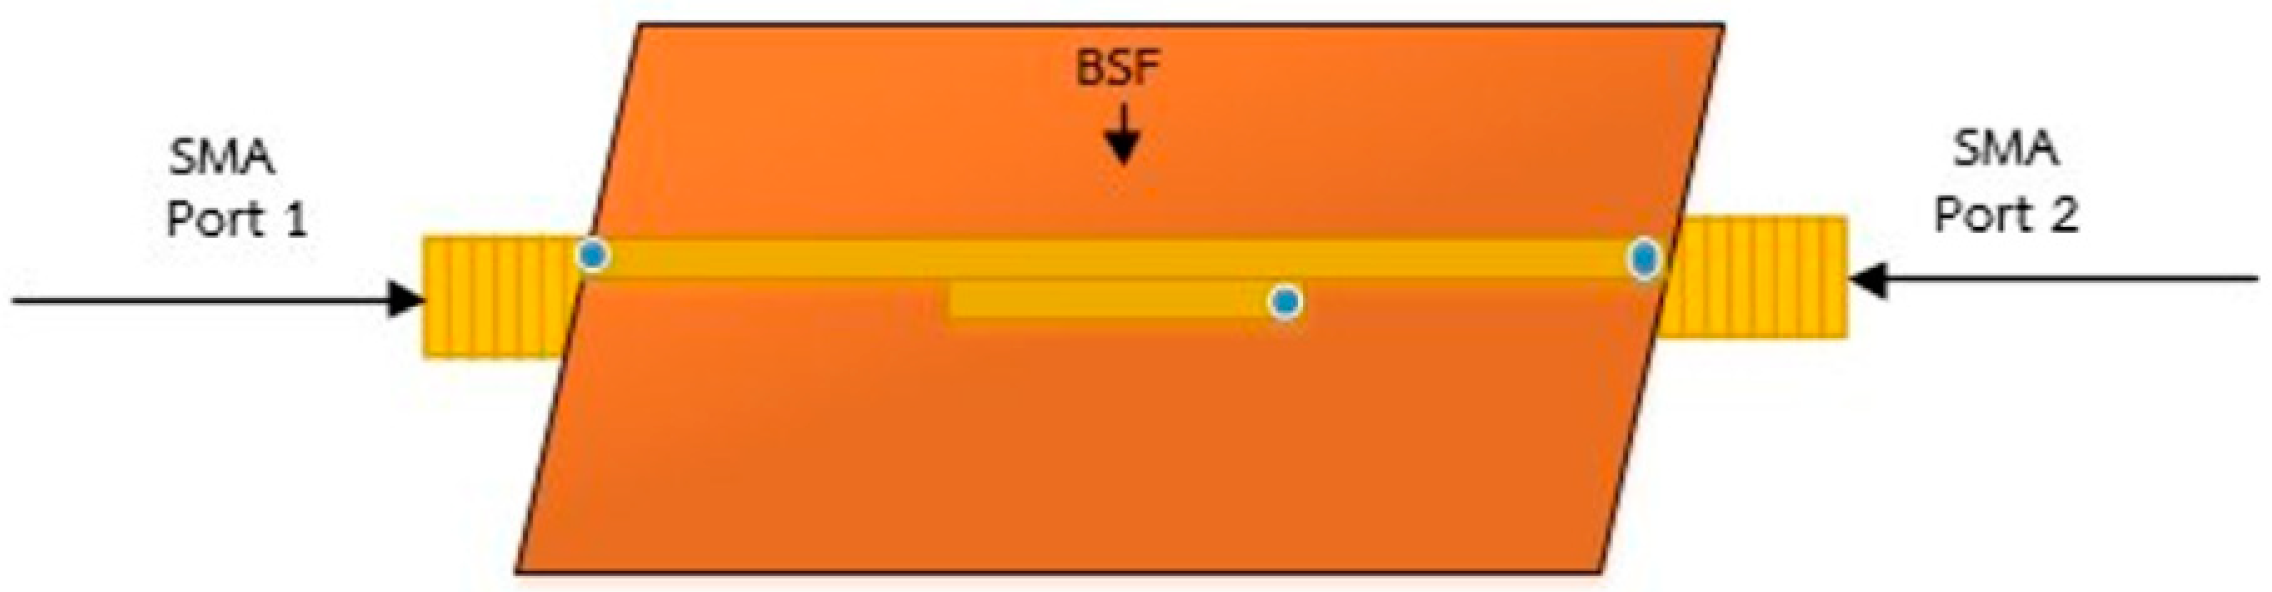
2.1. Design and Analysis

The parallel-coupled microstrip lines comprise two conductive strips that function as signal transmission paths. Each strip has a defined width (W) and thickness (t), and they are aligned parallel to each other over a length (L). The distance between the two conductors is denoted by the separation (S) [6]. A substrate material with a specific relative dielectric constant supports the conductive strips, while the medium above the strips is air, which has a different dielectric constant. Beneath the substrate, a metallic ground plane serves as the reference for the electric field. The electrical properties and configuration of the parallel-coupled microstrip lines generate electromagnetic interactions, allowing power transfer between the conductors. This interaction results in the formation of electromagnetic fields on the strips, commonly referred to as crosstalk. When multiple transmission lines are placed close to each other and run parallel, they form parallel-coupled microstrip lines. The electromagnetic waves on these lines exhibit either a fully orthogonal mode or a quasi-static mode, with distinct even- and odd-mode waveforms. These modes are characterized by specific impedance values for the even and odd modes, denoted as Z 0 e and Z 0 o . These impedance values are critical in ensuring signal integrity and optimizing the performance of the transmission lines, particularly in high-frequency applications. The simplified expressions for the characteristic impedance in the even and odd modes are provided by Equations (1) and (2) [7].
Z 0 e = Z 0 1 C 1 + C
Z 0 o = Z 0 1 + C 1 C
In this research, a microwave sensor was designed and developed using parallel-coupled microstrip lines as in Figure 1, specifically designed to operate at a frequency of 2.45 GHz, which is a standard frequency in various industries, including food quality assessment. The sensor utilizes FR4 as the substrate material due to its balance between cost and performance, with a dielectric constant (Er) of 4.66, a substrate thickness of 1.6 mm, and a loss tangent of 0.02. These parameters were used to calculate and optimize the parallel-coupled microstrip lines to ensure efficient operation at the target frequency. Although the loss tangent of FR4 is higher than that of specialized microwave materials, it was chosen for this application due to its cost-effectiveness and practicality.
For the analysis, Advanced Design System (ADS) software [8] was employed to simulate the sensor’s behavior. The simulation focused on analyzing the S11 (return loss) and S21 (insertion loss) parameters, which indicate the sensor’s ability to transmit and reflect signals at the target frequency. Additionally, the parallel-coupled microstrip lines were designed with a width of 2.45 mm, a length of 17.09 mm, and a spacing of 0.36 mm between the lines to meet the specific coupling and impedance requirements. The simulation was configured to evaluate the sensor’s frequency response from 0.1 GHz to 3.0 GHz, with a fine frequency step of 0.0001 GHz. The analysis results confirmed the accuracy of the design and the sensor’s performance in detecting the electrical properties of the pickled fish samples.
Figure 2 presents the simulation results of the designed microwave sensor, focusing on the S-parameters S11 and S21 across a frequency range of 0 GHz to 3 GHz. The solid curve shows the return loss, which measures how much of the input signal is reflected due to impedance mismatch. The significant dip in the return loss curve at approximately 2.45 GHz indicates effective impedance matching at this frequency, meaning that minimal signal reflection occurs. This confirms that the sensor is well-tuned to the target operating frequency of 2.45 GHz, making it optimal for applications such as dielectric property measurements of pickled fish samples.
The dashed curve represents the insertion loss (S21), which measures the signal attenuation between the input and output ports. A clear notch can be seen at 2.45 GHz, indicating that the band-stop filter is functioning as designed by significantly attenuating signals in this frequency band. This result confirms the sensor’s ability to block unwanted frequencies while allowing the desired signal to pass through other frequencies. The results from the simulation validate the sensor design, showing that the parallel-coupled microstrip lines effectively enhance sensitivity and accuracy, especially for applications that require precise measurement at 2.45 GHz.
Figure 3 displays the prototype of the microwave sensor based on parallel-coupled microstrip lines, designed to operate at 2.45 GHz. The design consists of two key ports, SMA Port 1 and SMA Port 2, which are used for signal input and output, respectively. The microstrip lines are fabricated on an FR4 substrate, and the central section of the lines represents the BSF, which is responsible for attenuating specific frequencies. The microstrip lines are positioned parallel to each other, with carefully calculated dimensions such as width, separation, and length, as detailed earlier. The yellow lines in the diagram represent the conductive strips that form the parallel-coupled microstrip lines, while the orange region represents the FR4 substrate material supporting the structure. The SMA connectors on either side enable connection to external measurement instruments, such as network analyzers, to analyze the sensor’s performance. This prototype configuration ensures that the sensor is capable of accurate and efficient microwave sensing, particularly in evaluating the dielectric properties of materials.

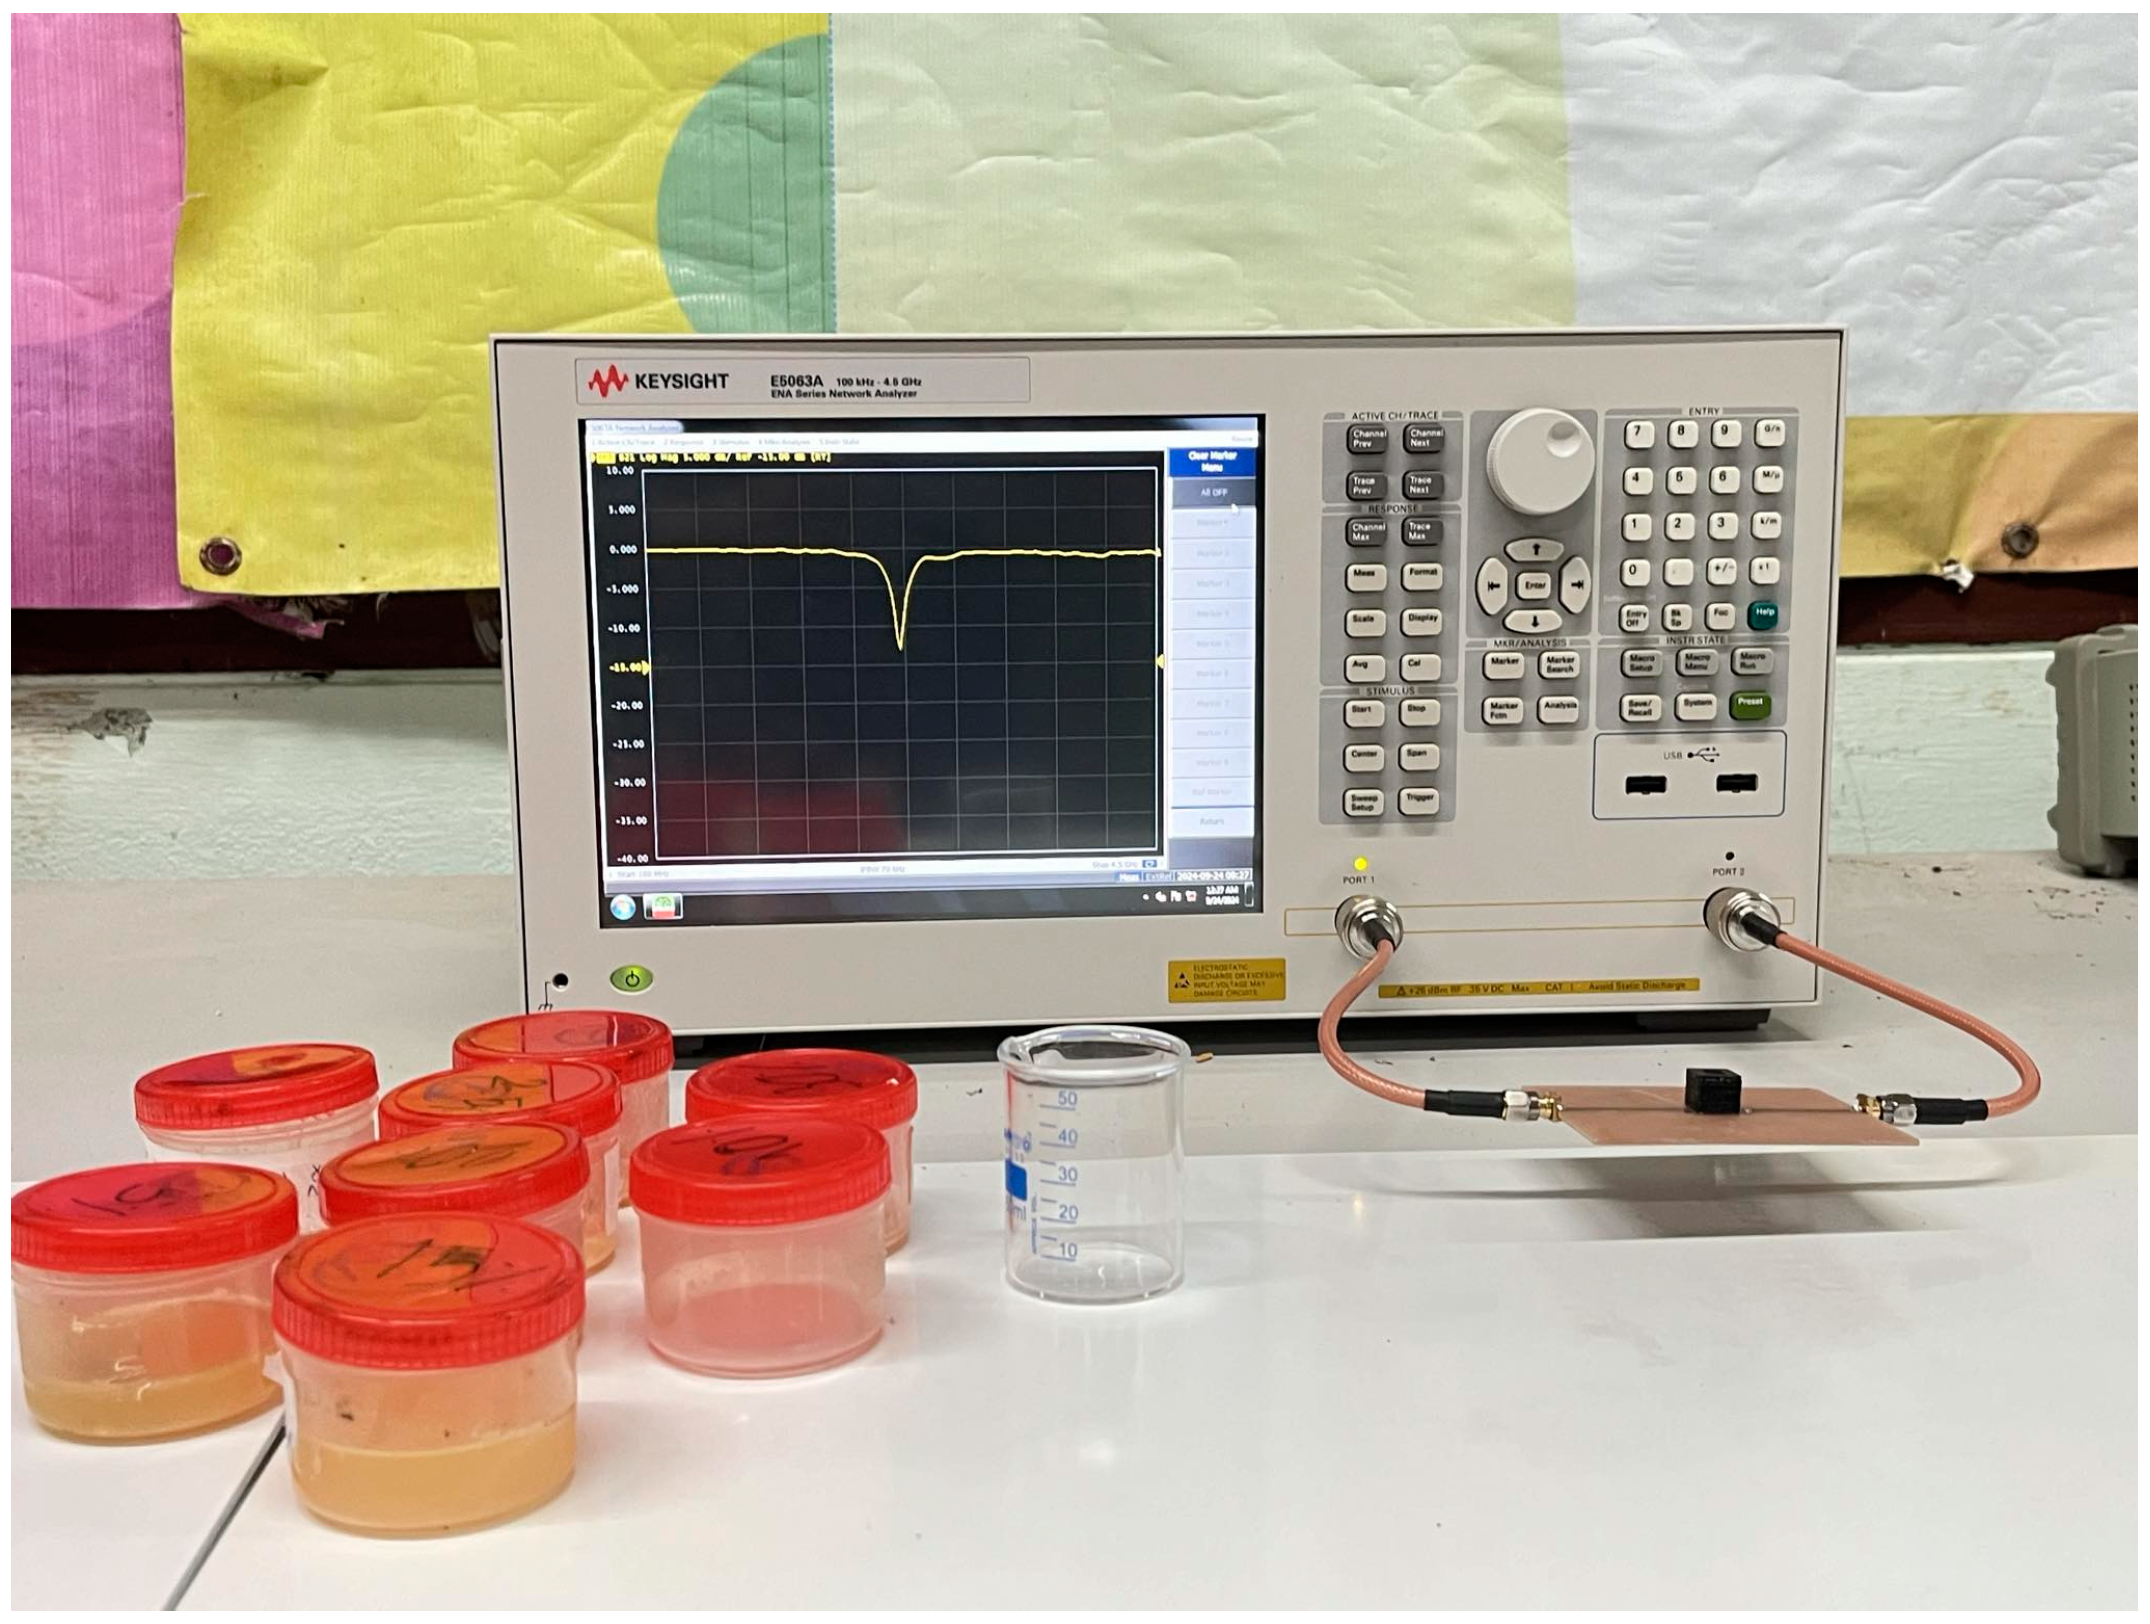
2.2. Experimental Setup

The experimental (Figure 4) setup utilized an E5063A ENA vector network analyzer (VNA) from KEYSIGHT Technology (Santa Rosa, CA, USA), calibrated to measure within a frequency range of 0.1 to 3.0 GHz. The aim of the experiment was to investigate the properties of pickled fish samples using a microwave sensor based on parallel-coupled microstrip lines. The VNA was employed to evaluate the transmission characteristics of the sensor, focusing on the S21 parameter, which measures the insertion loss and indicates the amount of microwave signal transmitted through the sensor when exposed to different samples. The sensor was connected to the VNA via coaxial cables at Port 1 and Port 2, and each pickled fish sample was carefully positioned near the sensor. Measurements of the S21 parameter were recorded across a frequency range from 0.1 GHz to 3.0 GHz, capturing how the presence of pickled fish affected the signal transmission. Additionally, the phase of the S21 parameter was measured to detect any phase shifts, which could signify changes in the dielectric properties of the samples. These phase shifts provide valuable insights into how the electrical characteristics of the pickled fish alter when subjected to microwave frequencies.
The experiment involved testing pickled fish samples with varying salt concentrations, as detailed in Table 1. Each sample was assigned a specific salt concentration, ranging from 0% to 90%, allowing for a systematic analysis of how different levels of salt content affected the sensor’s response. These varying concentrations were labeled accordingly to facilitate the comparison of sensor performance and the dielectric property changes of the samples. The objective was to determine how the salt concentration influenced the transmission characteristics, specifically the S21 parameter, and how it impacted the microwave signal as it passed through or reflected from the pickled fish samples.

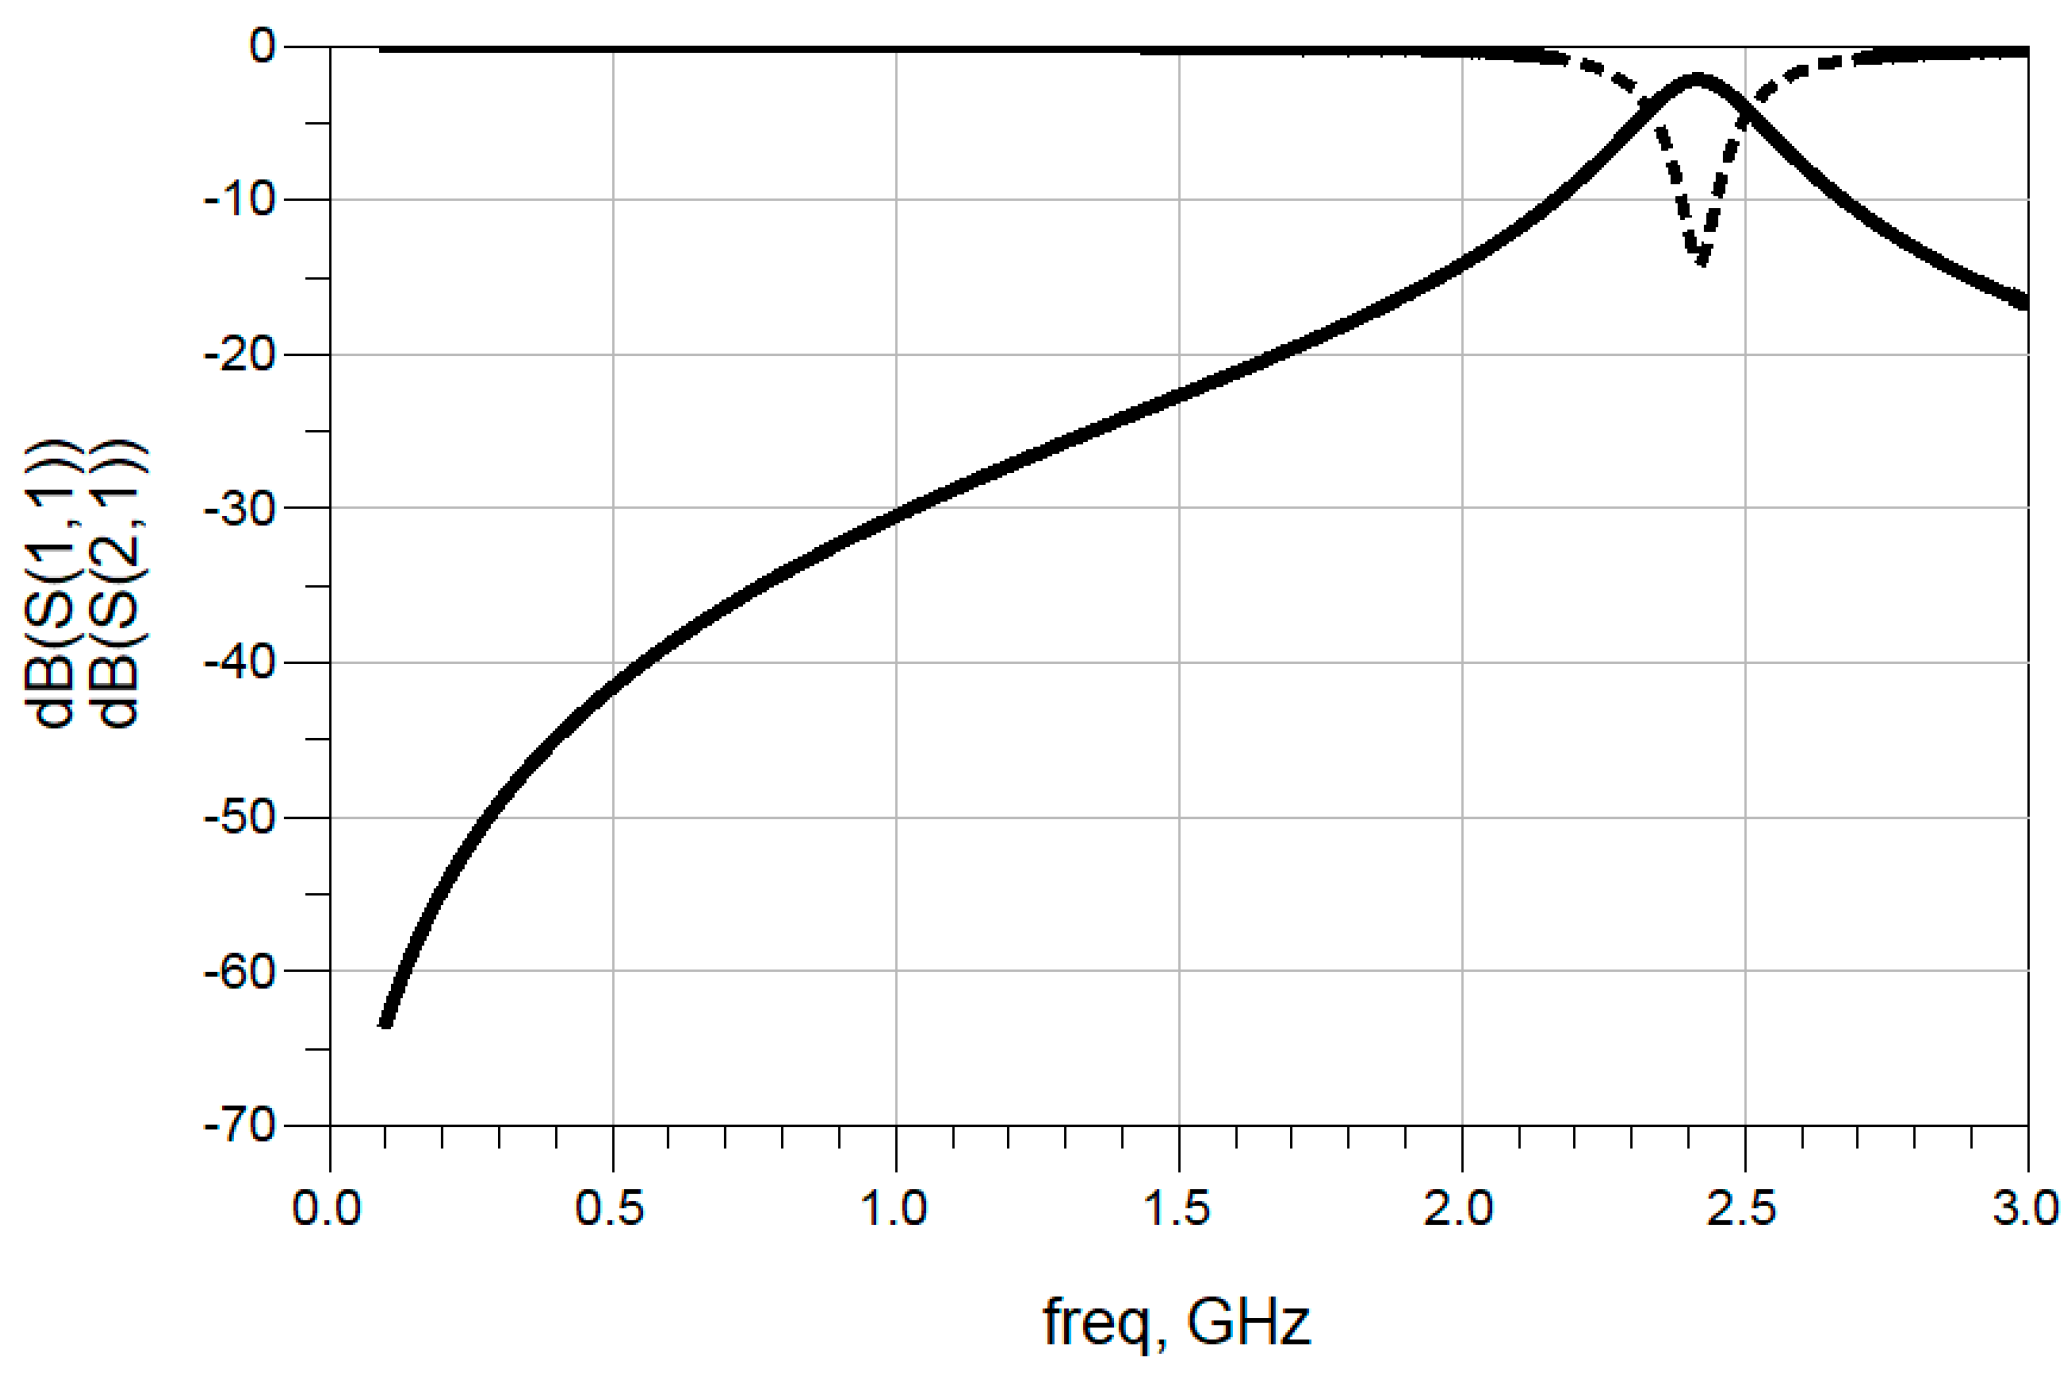
3. Results and Discussion

Figure 5 presents the measurement results of the S-parameters, particularly insertion loss, across a frequency range from 0.0 GHz to 3.5 GHz for pickled fish samples with varying salt concentrations. Each curve represents a different sample, labeled with corresponding variables such as S2100 (0% salt) and S2190 (90% salt). The data reveal significant notches in the frequency response, with major dips around 1.5 GHz and 2.4 GHz, indicating that the sensor effectively attenuates signals at these frequencies. These deep notches represent the frequencies where the sensor’s band-stop filter is most active, exhibiting maximum signal attenuation. As the salt concentration increases, the sensor shows slight variations in both the depth and position of the insertion loss notches. This shift indicates that the microwave sensor is responsive to changes in the dielectric properties of the pickled fish samples. The higher the salt concentration, the more pronounced the impact on the transmission signal. This behavior underscores the sensor’s effectiveness in distinguishing between different salt concentrations, making it a powerful tool for monitoring food quality and fermentation processes in real time. The results suggest that the sensor can track changes in the electrical properties of the sample as the salt content increases, which is crucial for applications requiring precise monitoring of material properties.
The results of the %BW (percentage bandwidth) measurements show that the sensor maintains a relatively stable bandwidth between 28–29% for moderate salt concentrations (ranging from 0% to 52%). This consistency suggests that the sensor is capable of broadly detecting dielectric property changes in pickled fish samples with lower to moderate salt content. However, as the salt concentration increases beyond 61%, the %BW drops significantly to values around 22–23%, indicating a narrowing of the sensor’s bandwidth. This narrowing suggests that the sensor becomes more selective and sensitive at higher salt concentrations, reflecting a more focused response to the changing dielectric properties in the samples. This trend highlights the sensor’s ability to adapt to varying material properties, making it highly effective for applications that require precise measurement of sample characteristics across a range of salt concentrations.
Figure 6 shows the correlation between salt concentration and %BW with a clear negative trend. As the salt concentration in the pickled fish samples increases, the %BW decreases, indicating that higher salt levels lead to a narrower bandwidth. The regression line, with the equation %BW = −0.0789 × Sample + 29.9590, highlights this relationship, demonstrating that the microwave sensor becomes more selective with increasing salt content, making it effective for detecting variations in material properties.

4. Conclusions

In conclusion, this study demonstrates the effectiveness of a microwave sensor based on parallel-coupled microstrip lines for detecting changes in the dielectric properties of pickled fish samples with varying salt concentrations. The results show a clear correlation between salt content and the sensor’s performance, particularly in terms of percentage bandwidth (%BW) and Q factor. As the salt concentration increases, the sensor becomes more selective, with a narrowing bandwidth and increasing Q factor, indicating its heightened sensitivity to higher salt levels. This sensor design offers a reliable and efficient method for non-invasive, real-time monitoring of food quality, making it a valuable tool for applications in the food industry.

Author Contributions

Conceptualization, W.K. and S.S.; methodology, W.K. and J.N.; software, W.K.; validation, P.T., N.A. and W.K.; formal analysis, W.K.; investigation, W.K.; resources, S.S. and N.A.; preparation, S.S.; writing—review and editing, S.S., J.N. and P.T. All authors have read and agreed to the published version of the manuscript.

Funding

This research received no external funding.

Institutional Review Board Statement

Not applicable.

Informed Consent Statement

Not applicable.

Data Availability Statement

Data are contained within the article.

Acknowledgments

The authors would like to demonstrate gratitude toward the Department of Electronic Technology, Faculty of Industrial Technology of the Nakhon Phanom University for research time, the research grant, and instrumentation, and the Faculty of Industrial Technology of the Nakhon Phanom University for financial support. The authors would like to express gratitude to the Tiwat Pongthavornkamol, Identification System Research Team Location and Automatic, National Electronics and Computer Technology Center (NECTEC) for providing ADS software simulation. We would also like to thank the Electronics Faculty of Industrial Technology, Nakhon Phanom University, for supporting materials, equipment, and laboratory facilities.

Conflicts of Interest

The authors declare no conflicts of interest.

References

  1. Shahzad, W.; Hu, W.; Ali, Q.; Raza, H.; Abbas, S.M.; Ligthart, L.P. A Low-Cost Metamaterial Sensor Based on DS-CSRR for Material Characterization Applications. Sensors 2022, 22, 2000. [Google Scholar] [CrossRef] [PubMed]
  2. Jelali, M.; Papadopoulos, K. Inline Inspection of Packaged Food Using Microwave/Terahertz Sensing—An Overview with Focus on Confectionery Products. Processes 2024, 12, 712. [Google Scholar] [CrossRef]
  3. Haq, T.; Ruan, C.; Zhang, X.; Ullah, S.; Fahad, A.K.; He, W. Extremely Sensitive Microwave Sensor for Evaluation of Dielectric Characteristics of Low-Permittivity Materials. Sensors 2020, 20, 1916. [Google Scholar] [CrossRef] [PubMed]
  4. S, A.; Menon, S.K.; Donelli, M.; L, M. Development of a Microwave Sensor for Solid and Liquid Substances Based on Closed Loop Resonator. Sensors 2021, 21, 8506. [Google Scholar] [CrossRef] [PubMed]
  5. Karasaeng, W.; Nualkham, J.; Summatta, C.; Sonasang, S. Measurement of soil moisture using microwave sensors based on BSF coupled lines. Eng. Proc. 2023, 58, 110. [Google Scholar] [CrossRef]
  6. Saeng-On, P.; Srisawat, S.; Phromloungsri, R.; Summatta, C.; Sonasang, S.; Prabpal, P. Design and analysis of microwave sensor for alcohol concentration with microstrip band stop filter. In Proceedings of the 2023 International Conference on Power, Energy and Innovations (ICPEI), Phrachuap Khirikhan, Thailand, 18–20 October 2023; pp. 52–55. [Google Scholar]
  7. Pozar, D.M. Microwave Engineering, 4th ed.; Wiley: Hoboken, NJ, USA, 2011. [Google Scholar]
  8. Advanced Design System (ADS); 2022 Update 1; License Number 347DF667415C; Keysight Technologies: Santa Rosa, CA, USA, 2022.
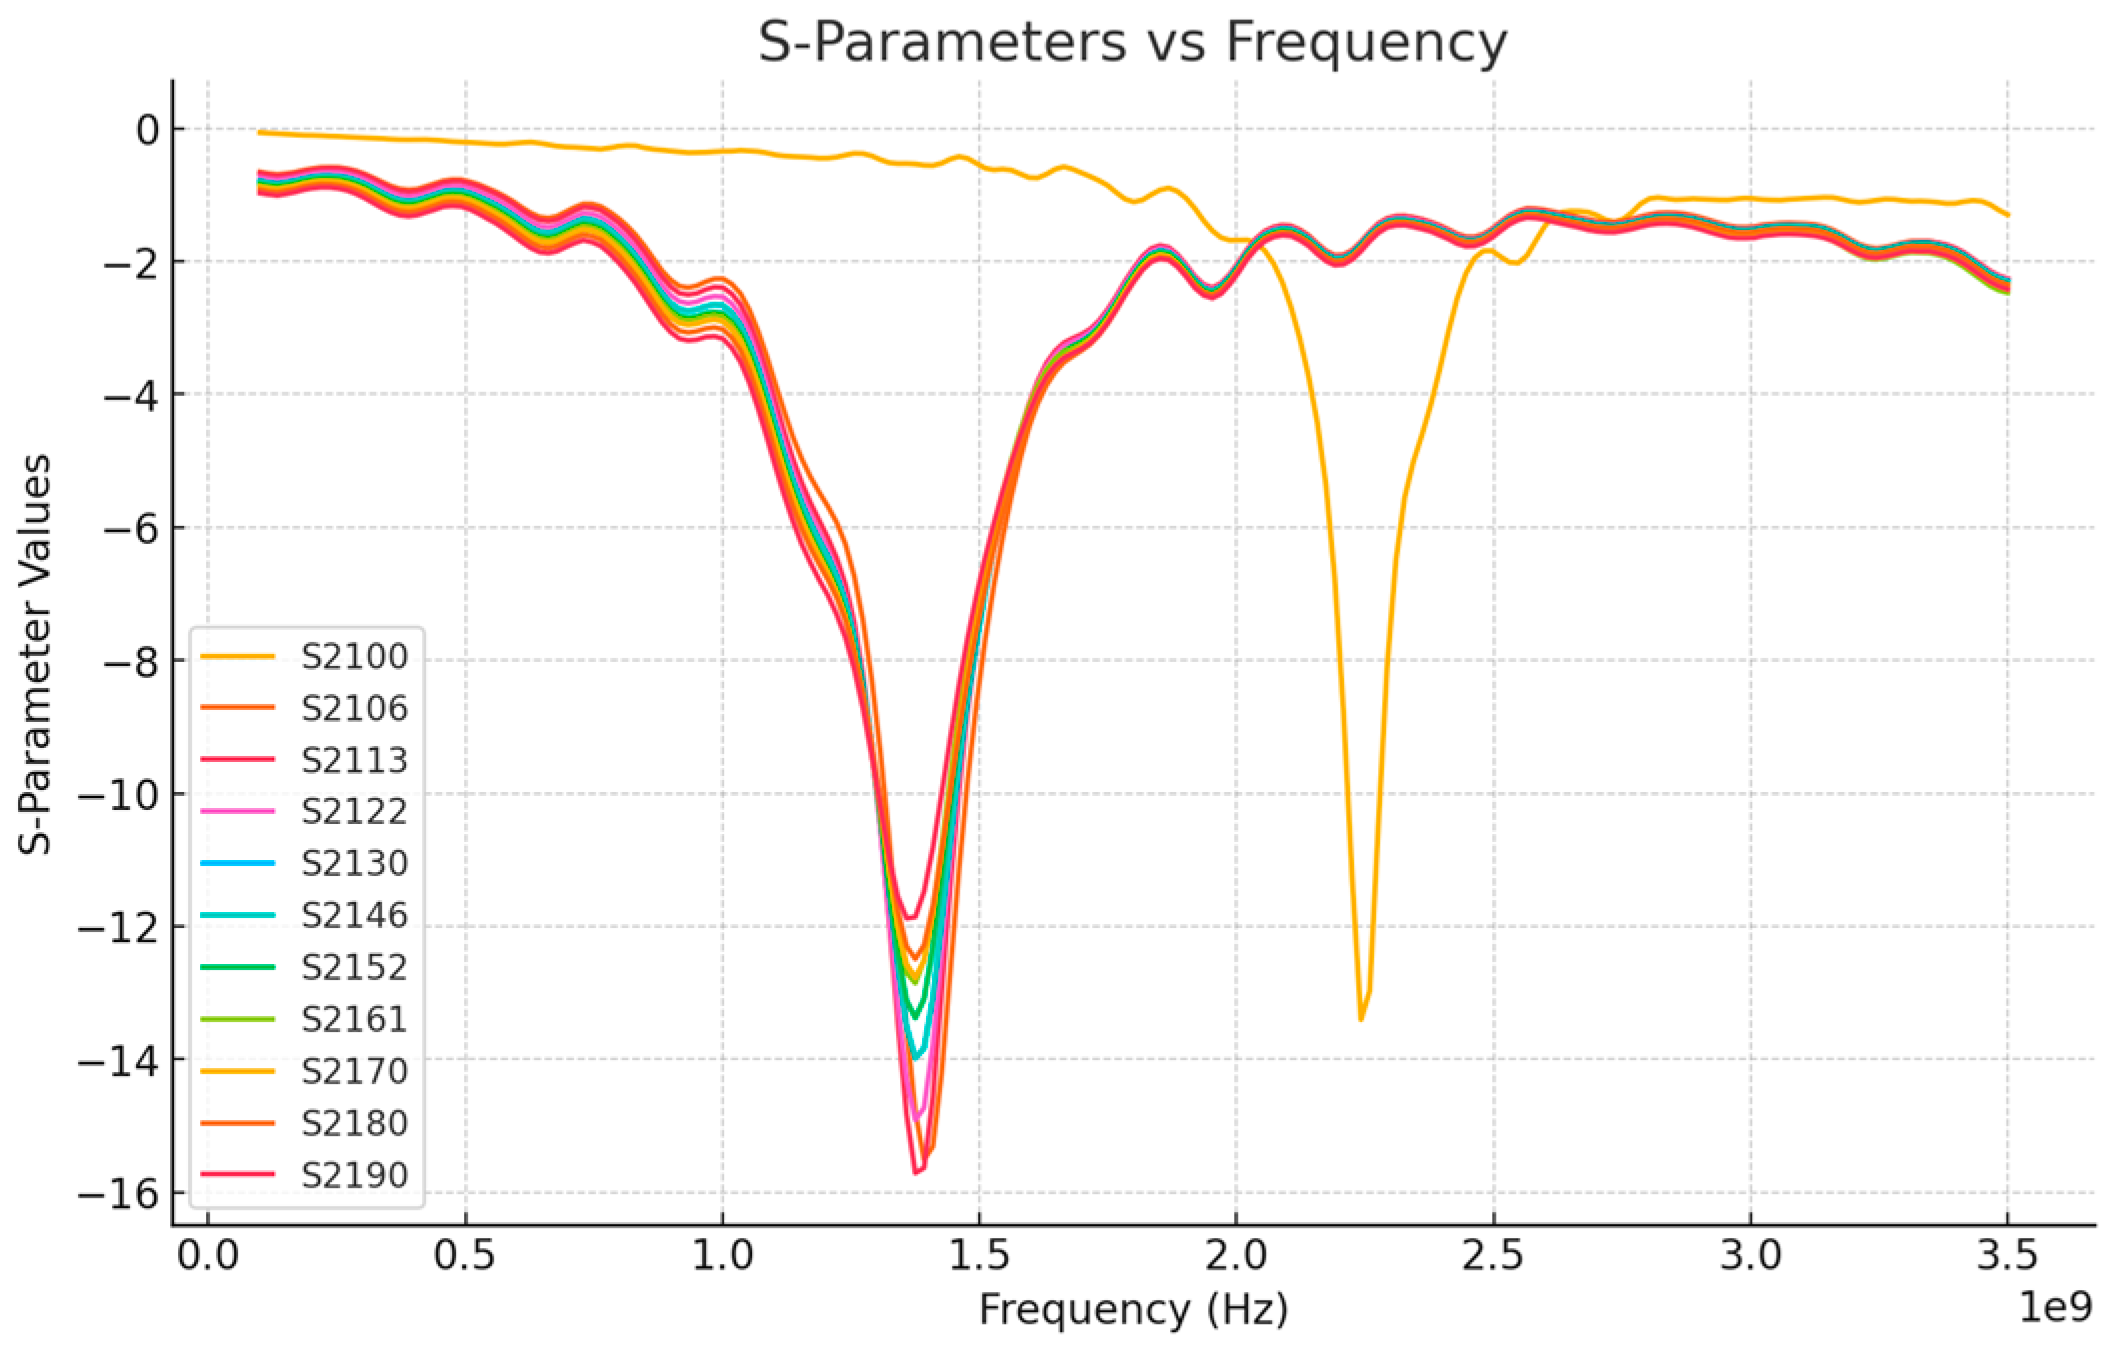
Figure 1. Design and simulation of microwave sensor using parallel-coupled microstrip lines [8].
Engproc 82 00013 g001
Figure 2. Simulation results of microwave sensor using parallel-coupled microstrip lines.
Engproc 82 00013 g002
Figure 3. Prototype of microwave sensor using parallel-coupled microstrip lines.
Engproc 82 00013 g003
Figure 4. Experimental setup of microwave sensor using parallel-coupled microstrip lines.
Engproc 82 00013 g004
Figure 5. Measurement results of microwave sensor using parallel-coupled microstrip lines.
Engproc 82 00013 g005
Figure 6. The correlation of pickled fish and frequency response.
Engproc 82 00013 g006
Table 1. Salt concentration and assigned variable.
Salt Concentration (%)Assigned VariableSalt Concentration (%)Assigned Variable
0S210046S2146
6S210652S2152
13S211361S2161
22S212270S2170
30S213090S2190
Disclaimer/Publisher’s Note: The statements, opinions and data contained in all publications are solely those of the individual author(s) and contributor(s) and not of MDPI and/or the editor(s). MDPI and/or the editor(s) disclaim responsibility for any injury to people or property resulting from any ideas, methods, instructions or products referred to in the content.

