Abstract
While artificial intelligence has shown promising results for quality inspection, it often requires large training datasets, which are impractical for industrial applications. Defective parts are heavily underrepresented in normal production, which makes it a poorly posed problem for supervised learning approaches. In this work, this issue is tackled by combining an automated inspection procedure with an anomaly detection approach for defect detection. A 7-DoF robotic manipulator was used to automate part handling in front of an industrial optical camera sensor. The captured images were used to train a PaDiM anomaly detection network to reconstruct a normal image of the part. The results show that various defects can be detected with defect detection rates up to 100% while maintaining approximately 91% specificity using a small dataset of 117 parts.
1. Introduction
In-line quality inspection in the manufacturing industry is of high relevance to reduce financial losses by minimizing waste and preventing returns [1]. In the current time, production processes are becoming increasingly more efficient, demanding automated systems that can keep up with the increased production speed without losing reliability [1].
Although deep learning (DL) approaches are already applied in a broad spectrum of fields, they are still rare in industrial settings. This is usually due to the highly time-intensive process of acquiring training data, which is not readily feasible in time-efficient production environments, which has already been addressed by previous works [2,3]. This paper aims to explore possibilities to seamlessly integrate training data acquisition into normal production. As the targeted use case, the field of plastic injection molding was selected, where 100% inspection of the produced parts is commonly required to ensure high production standards. Plastic injection-molded parts often have complex surface structures, which makes the inspection of such parts time-consuming, difficult to automate, and unreliable for humans. Due to the wide variety of materials, geometries, surface properties, and degrees of complexity in the field of injection-molded components, each product has specific characteristics that are used to evaluate product quality manually or automatically. Examples include geometric variations, flow marks, scratches, weight variations, differences in gloss level, cracks, etc. Many systems can identify a single or a few defect features. But no system exists that can evaluate several defect features at the same time without a substantial training database. Especially in the field of plastic injection molding, flexible inspection system designs would be desirable due to the inherently dynamic nature of plastic injection molding. The mold cavity as well as the plastic or rubber material are readily exchangeable, and new mold cavities for new parts are being developed regularly. Thus, smart systems that are easily adaptable to changing circumstances would greatly benefit the production quality and efficiency in this field.
To achieve this, the experimental setup of this work consists of a robotic manipulator used to execute the handling of the parts—namely picking, placing, and presenting them to an industrial camera in multiple orientations. On the backend, a DL approach is applied that processes the acquired images and assesses the quality of the inspected part. This work aims to prove the concept of a robotically aided automatic inspection procedure in this production field that is easily adaptable to other use cases.
More concretely, this paper aims to contribute practical potentials, limits, challenges, and experiences that arise when implementing robotic automation and DL anomaly detection into industrial manufacturing processes.
Related Work
The field of defect detection on images is very broad. The development of artificial intelligence networks in recent years has enabled real-time detection and/or classification of defects on optical images with very high precision. Currently, machine vision or DL approaches are broadly investigated in many fields, especially in the production sector [4,5,6]. The majority of approaches in this field employ supervised learning, which requires vast amounts of data to train.
Transfer learning, the application of previously learned skills to new circumstances, can be used to mitigate this problem. While initially, transfer learning was only applied to knowledge transfer between similar domains, results now indicate that it is also possible to transfer knowledge between dissimilar domains, achieving up to 99.95% classification accuracy [7]. Transfer learning has also already been evaluated in an industrial environment for defect detection of thermal conductive components, where it could be shown that a CNN pretrained on ImageNet can reach an accuracy of 93% after training on a 6000-image dataset with four types of defects [3]. It should be noted that [3] and [7] used grayscale images and considered only parts/subjects without complex geometries. An alternative approach to the reduction in training data is data augmentation. This has already been applied to practical use cases in the field of semiconductor manufacturing, where as few as 30 images per class could be used to achieve an accuracy of approximately 95% [2]. However, [2] also states that generating a consistent amount of defect data for each class was difficult in practice.
Alternatively, semi-supervised or unsupervised approaches are also described in the literature. In these cases it is assumed that either only defect-free samples are learned or that the majority of training samples are defect-free [6]. In recent developments, the Patch Distribution Modeling (PaDiM) anomaly detection approach [8] reached at least 94.1% Area Under The Curve—Receiver Operating Characteristics (AUC-ROC) metric for all classes in an anomaly detection benchmark dataset (MVTech AD) [9]. The main advantage of the anomaly detection approach is that defective parts are usually heavily underrepresented in production. Furthermore, it is not always trivial to synthesize defects, so the acquisition of appropriate training data is challenging in an ongoing production environment. A drawback of anomaly-based methods is that no direct classification of the defect is possible.
When it comes to automating the required data acquisition for optical surface defect detection, different systems are applied. Stationary cameras observing conveying systems, CNC machines, dedicated inline computer vision systems, or articulated robots with a camera as an end-effector [1]. Especially in serial production of complex parts, it is not trivial to design a process that achieves reliable and precise inspection of the entire part surface. Complex parts are usually difficult to pick for robots and require multiple viewpoints for an optical inspection procedure to sample the entire surface. To avoid the problem of picking and placing parts, articulated robots are often used to manipulate optical sensors around objects for inspection. In [10], an articulated robot was used to track parts on a running conveyor belt using a stereovision 3D scanner, paving the way for in-motion quality inspection. Another example for this robot-camera setting is given in [11], where a mobile articulated robot with a dual camera setup and a 3D scanner is used to inspect aircraft engine assemblies. Furthermore, in [12], a robot was used to pick metal washers and manipulate them in front of a high-resolution inspection camera system to perform geometric measurements. An advantage of the part-in-hand setting instead of the sensor-in-hand setting is that perspectives of complex shapes are easier to reach while avoiding occlusions.
2. Materials and Methods
Our experimental setup consists of a robotic manipulator as the part handling system, Franka Emika Panda (Franka Emika GmbH, Munich, Germany); a Basler GigE Vision (Basler AG, Ahrensburg, Germany) industrial camera system with an attached ring light source; and a PCE Instruments PCE-AB100C precision scale (PCE Deutschland GmbH, Meschede, Germany).
The part on which the system is applied is a transparent thermoplastic (polycarbonate) ring with complex small surface structures (see Figure 1). A general overview of the proposed experimental setup is given in Figure 2.
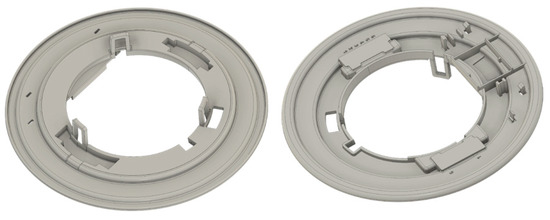
Figure 1.
Injection molding part model used in the proposed system architecture.

Figure 2.
Overview of the used system setup consisting of the part-handling robot, an industrial camera, and a precision scale.
The prototype realizes a generalizable system architecture, applicable in an industrial production setting, that is differentiable into the robotic unit, the anomaly detection approach, and the communication and data management of the entire process.
2.1. Image Acquisition Procedure
The complete inspection process consists of the initial production of the part, which is then picked up by the robot at a consistent, predefined grasp position on the part. The robot moves the part to the industrial camera and captures 20 MP uncompressed images of eight different, heuristically defined perspectives. Subsequently, the part is placed on the precision scale and picked up again at a second predefined grasp point after the weight measurement is completed. This is necessary due to the occlusions caused by the gripper in the first set of images. The same eight perspectives are acquired again using the second grasp point, yielding a total of 16 inspection images per part. The complete process diagram is given in Figure 3.
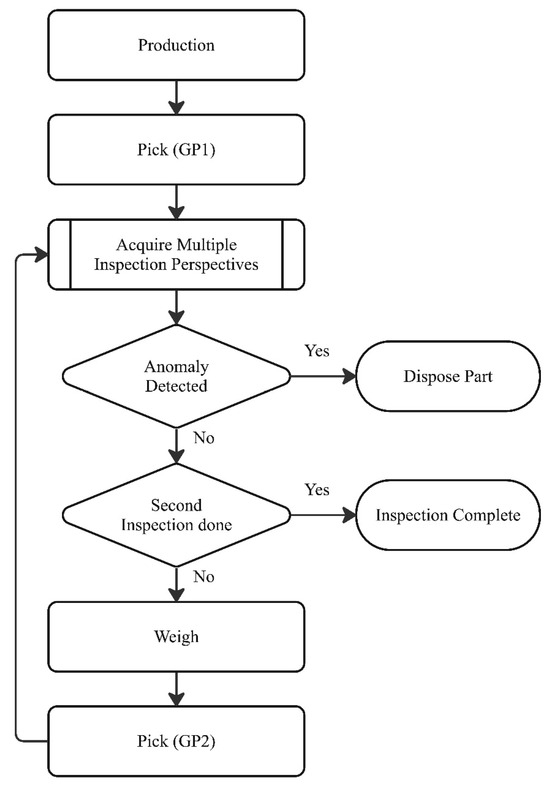
Figure 3.
Diagram of the inspection process (GP: grasp point).
Control of the robot is realized using a robot operating system (ROS) environment [13] in which the real-world planning scene setting and the corresponding motion of the robot were planned using MoveIt [14].
2.2. Dataset and Image Preprocessing
The dataset used for this study comprises 118 defect-free parts (no noticeable differences or defects to a sample part) and 32 parts with different kinds and degrees of artificially generated defects (scratches, cracks, dots, missing geometries, deformation). Some of the generated defects are given in Figure 4.
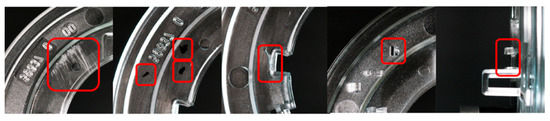
Figure 4.
Examples of some of the artificially generated defects on the part surface marked in red squares respectively. From left to right: scratches, dots, crack, missing structure 1, missing structure 2.
The acquired images need a few processing steps before being used for training of the elected anomaly detection method. To avoid processing too many unnecessary pixels, the full image is initially cropped to the outline of the part. Therefore, Multi-Otsu [15] was used to determine a threshold for the background, and the image was cropped accordingly. Additionally, heavy reflection artifacts from the metal fingers of the robot gripper introduced challenges to the anomaly detection algorithm. As the gripper was in a very consistent image area and is not required for the actual quality analysis, this part of the image was cropped by removing the bottom 300 rows of pixels from the image. The cropped images were resized with constant padding to the shorter side to achieve a square image ratio. Finally, each image was normalized according to the ResNet18 documentation [16].
2.3. Anomaly Detection Network and Training
For the anomaly detection, an implementation of PaDiM [8] with a ResNet18 backbone [17] was trained on a Nvidia GeForce RTX 3090 GPU (Nvidia Corporation, Santa Clara, CA, USA) to convert input 20 MP RGB images into lower-resolution anomaly heatmaps. To reduce the potential for outliers, each anomaly heatmap was filtered using an isotropic Gaussian smoothing operation with . An individual model was trained for each of the sixteen perspectives of the part. To estimate the required training dataset size and output precision, the network was trained using different parameters. Lower-resolution heatmaps require less computation time and thus grant faster inference times, while less training data yields shorter training times and preparation/data acquisition periods. This was performed by varying the training/validation split ratios (0.4, 0.6, 0.8) of the defect-free images as well as three network output resolutions (256 × 256 pixel, 512 × 512 pixel, 1024 × 1024 pixel) for the three split ratios, resulting in nine test cases.
2.4. Anomaly Decision Process
The PaDiM network generates heatmaps in the specified size in which each pixel corresponds to an anomaly score. The decision of whether a part is anomalous based on the anomaly heatmaps can be approached in different ways. To avoid manual labeling, which is time-intensive and defeats the purpose of this work, threshold-based decision methods are applied to determine an “anomaly score” . In each case, an anomaly score is defined and compared to the threshold T. If the threshold is crossed in at least two of the 16 images for each part, the part is labeled anomalous. This was performed to increase the robustness of the detection against noise or outliers.
2.4.1. Maximal Image Value
This metric extracts the maximal image value from each anomaly heatmap M.
2.4.2. Percentile-Based
A more robust approach may be the usage of percentiles instead of the maximal image value. This may account for outliers in defect-free anomaly maps. For this approach, the anomaly score is equal to the image value at the p-th percentile, P.
2.4.3. Cluster-Based Anomaly Decision
A slightly more advanced approach is to binarize the anomaly heatmap according to T and then evaluate the resulting pixel clusters by size. Here, the binary decision of whether an image is anomalous or not is based on the presence of at least one cluster of pixels above T of at least size S. Furthermore, it is possible to mark the detected defect location on the image to evaluate the anomaly in edge cases with low anomaly scores.
The values for T and S in this work were determined by analyzing the dataset. For T, the distributions of maximal image values for all images in all datasets and network configurations (see Section 2.3) were plotted, and the mean distance between the training data distribution and anomaly data distribution was calculated. An example for this evaluation is given in Figure 5. The value of S was determined by estimating the dimensions of the minimal expected defect size and converting it to the corresponding pixel area. A minimal defect size of 0.5 mm was defined according to the smallest defect in the defective dataset. A circular pixel area was assumed for determining the expected pixel cluster size in an anomalous image. To optimally reflect the expected minimal anomaly cluster size, the smoothing kernel size was considered by adding the kernel size to the pixel defect size before calculating the pixel area. This results in the following values for S in the different resolutions: 1024:131, 512:86, and 256:67.
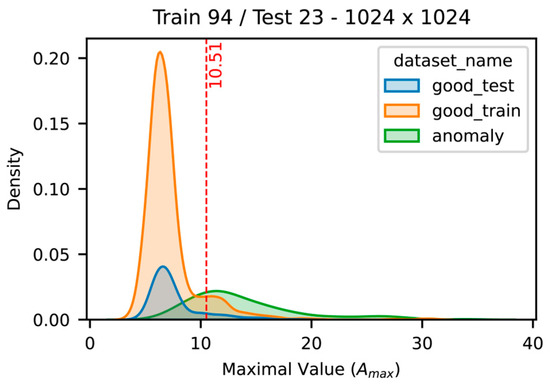
Figure 5.
Example distributions of maximal image values to determine a threshold value for the subsequent analyses. The network configuration with 94 training parts and 23 validation parts was chosen for this purpose with a 1024 × 1024 heatmap resolution. The mean distance between the distributions of the training dataset (orange) and the anomaly dataset (green) is shown at the dashed red line. The distribution of the validation set is given in blue.
The sensitivity, or true positive rate (TPR), as well as the specificity, or true negative rate (TNR), were used to evaluate the results. In this case, a positive classification corresponds to an anomalous part, whereas a negative classification corresponds to a defect-free part. In industrial manufacturing it is necessary to keep the sensitivity high to maintain high quality standards while also keeping the specificity high to avoid unnecessary disposal of too many parts that are defect-free. This is a common trade-off in classification problems that needs to be balanced for the individual use case. In this work, emphasis is placed on the TPR to ensure that all anomalous parts are detected. Thus, the metric, , for evaluating the threshold in this case is the true negative rate (TNR) at the highest threshold, , that still yields a TPR of 1. This way, the best tradeoff where all anomalies are still detected with the least amount of false positive classifications can be determined.
3. Results
The main results for the proposed anomaly decision methods and the different network parameters are given in Figure 6. In Figure 6, the results for sensitivity and specificity are shown against the respective anomaly score thresholds for the three evaluation metrics. The range of thresholds was chosen according to the results from Figure 5, which indicated that a threshold value around 10 may be a sensible choice to separate the anomalous images from the defect-free images. Thus, thresholds from 0 to 15 were evaluated in steps of 1. Additionally, the effects of the split of training data and validation data, as well as the trained anomaly heatmap pixel ratio on the evaluation metrics, are given. Additionally, the results for DT for each network and decision approach are given in Table 1.
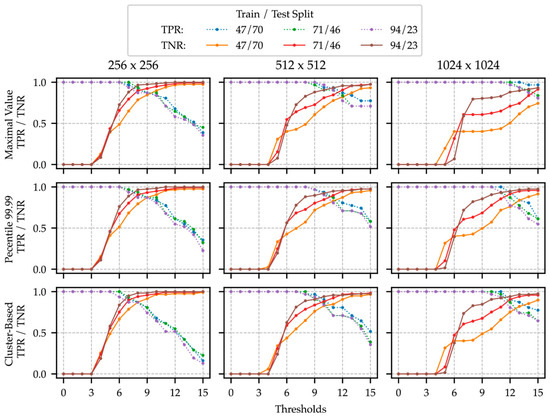
Figure 6.
Plots of the sensitivity (true positive rate—TPR) in full lines and the specificity (true negative rate—TNR) in dashed lines against the tested thresholds for the respective anomaly scores. The results are displayed in terms of the three anomaly decision methods (maximal value, 99.99th percentile, cluster-based), as well as each anomaly heatmap image ratio (columns) and the different splits of training and validation values (47/70: blue/yellow, 71/46: green/red, 94/23: purple/brown).

Table 1.
Evaluation of the highest true negative rate (TNR) at the highest threshold that still yields a true positive rate (TPR) of 1 for each network constellation. The maximal values for TNR for each evaluation method are marked in bold letters.
3.1. Anomaly Heatmap Size
For all evaluated metrics, the effect of the anomaly heatmap size on the detection performance is similar. The drop-off of the TPR starts at lower thresholds of values around 6–7 for the 2562 heatmaps, whereas the 5122 TPR begins dropping at around 7–9 and the 10242 maps at 10–11. The opposite is the case for the TNR. Here, the lower-resolution anomaly maps reach plateaus earlier and achieve higher rates in general. The TNR is close to one at a threshold value range of 10–12, whereas the TNRs for the 5122 and 10242 maps are still ascending to one at the maximal evaluated threshold of 15. In combination, this means that the best compromise between false positive detections and false negatives is reached at lower thresholds for lower-resolution heatmaps and at higher thresholds for higher-resolution heatmaps. In terms of DT, higher resolutions on average result in lower DT scores, except for the max-value-based decision approach, where the average of DT scores is higher for the 10242 resolution heatmap than for the 5122 resolution heatmap.
3.2. Training/Validation Split
The split of training and validation data also influences the performance metrics. In general, the TNR for the lower split ratios is lower than in the higher split ratios, whereas there is no visible difference in the TPR for the different split ratios. The DT scores for the different split ratios are mostly decreasing on average with greater split ratios, although no average difference could be found between the DT scores of the 71/46 split and 94/23 split in the cluster-based decision method.
3.3. Anomaly Decision Approach
The different anomaly decision approaches influence the decision performance as well. The TPR curves drop off with a steeper slope in the percentile-based and cluster-based approaches compared to the max-value-based method. The TNR curves are similar to each other in all evaluated cases except for the max-value-based TNR curves in the case of the 10242 resolution. Here, the curves show a larger plateau at thresholds of 6–7 and subsequently slightly lower maximal values for TNR with respect to the other two. Overall, the percentile-based approach yielded the best results in terms of the DT score. In the 10242 network with a 94/23 split of training and validation data, the DT score was 0.91, meaning that in this case, 100% of anomalous parts were correctly classified as anomalous, while 91% of defect-free parts were classified as defect-free. The next best DT scores of 0.88 were found in the 94/23/512 settings for the max-value-based and percentile-based methods. The highest DT score for the cluster-based approach is 0.85 in the 94/23/1024.
4. Discussion
The results indicate that high classification accuracy for anomalous parts can be achieved using anomaly detection methods and simple approaches for decision-making. By tuning the anomaly threshold for the individual use cases a 100% detection rate of anomalous parts could be achieved. However, 9% of defect-free parts were misclassified in the best-performing scenario, which corresponds to 11 of 117 evaluated parts. Analyzing the falsely classified parts, a few reasons for misclassification could be identified. Examples of these anomalies in the training dataset are given in Figure 7. Some of these anomalies are of a technical nature, e.g., in row one an example of a failure of the contour detection for the cutout of the part failed. This may happen due to unexpected structures or changes in the image background and could be fixed by using an image registration approach for the cutout instead of a contour detection approach. In the second row, the gripper is in the cutout frame due to a slight offset of the grasp position on the part. This is likely due to uncertainty in the experimental setup, which can be avoided in industrial implementations of the prototype by using more accurate hardware in the supply system and the robotic manipulator. Other parts contained residual plastic strings that were barely visible to the naked eye or very small dust or dirt particles (see Figure 7, columns 3 and 4). The conclusions from this are twofold: Firstly, it could be shown that these kinds of defects can be detected even though they were present in the training dataset. However, secondly, it may be difficult to decide whether every anomaly should directly grant rejection of the part, as superficial dust may not be reason enough to dispose of the part. In conclusion, this means that the DT scores presented in Table 1 may be slightly lower when assuming a more optimal inspection environment and setup. However, the risk of anomaly detection methods for excessive misclassification of factually defect-free parts needs to be considered in the individual application.
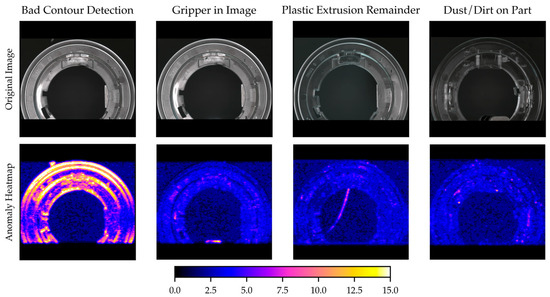
Figure 7.
Analysis of falsely classified parts from the training and validation datasets. The original image and the corresponding anomaly heatmap (1024 × 1024) are shown, and the type of anomaly is labeled on each row.
The image resolution as well as the training dataset size has a measurable impact on the classification performance. According to the results of this work, adequate classification accuracy cannot be reached with training dataset sizes below 47 parts for the presented use case. In this work, the highest measured DT score for the 47/70 split was 0.72, so almost 30% of all defect-free parts were falsely classified as anomalous. Furthermore, an anomaly heatmap size of 2562 will also not result in adequate classification accuracy, as the highest DT score reached in the 2562 networks did not exceed 0.79.
Three simple decision approaches were evaluated and compared to the other parameters; the influence of the decision method on the classification seems to play a minor role. Interestingly, the still simple but most advanced decision method, “cluster-based”, achieved worse classification accuracy in terms of DT at only 0.85 compared to the percentile-based approach. The reasons are difficult to determine without having a 100% accurate dataset, as DT may be heavily influenced by anomalous parts in the training/validation datasets.
The speed of both the hardware and software systems was not prioritized in this work. An inspection cycle with the current hardware system takes approximately 1 min for one part, where the inference takes roughly 5 s per image on a midrange consumer CPU at the highest image resolution of 10242. Future work should consider optimizing hardware and software performance and reevaluate the network performance on further datasets, as well as other parts.
In this work, important findings regarding the application of anomaly detection for automated quality inspection of complex parts could be found. The approaches were focused on ease of implementation and application in practical manufacturing. Anomaly detection approaches are suitable here due to the advantage that only defect-free data are required for training. The results indicate high potential for the application in real-world industrial manufacturing but need to be tuned to the individual production requirements to avoid unnecessarily high false positive classifications.
Author Contributions
Conceptualization, D.L. and A.R.; methodology, N.K. and D.L.; software, N.K. and L.S.; validation, N.K. and L.S.; formal analysis, N.K. and L.S.; investigation, N.K.; resources, A.R.; data curation, N.K. and L.S.; writing—original draft preparation, N.K.; writing—review and editing, L.S., D.L. and A.R.; visualization, N.K. and L.S.; supervision, A.R. and D.L.; project administration, A.R.; funding acquisition, A.R. and D.L. All authors have read and agreed to the published version of the manuscript.
Funding
This research was funded by the Federal Ministry of Education and Research (BMBF), grant number 011S20090C.
Institutional Review Board Statement
Not applicable.
Informed Consent Statement
Not applicable.
Data Availability Statement
The data presented in this study are available on request from the corresponding author. The data are not publicly available due to privacy reasons.
Acknowledgments
The work in this paper was executed in collaboration with Martin Spitz of SHS plus GmbH, Dinslaken, Germany and Arkadius Gombos of sentin GmbH, Bochum, Germany. Special thanks go to our colleague Oliver Chojnowski for collaborating in the early stages of the project and all the other researchers in the Cologne Cobots Lab.
Conflicts of Interest
sentin GmbH has no commercial conflict of interest. The authors declare no other conflicts of interest.
References
- Azamfirei, V.; Psarommatis, F.; Lagrosen, Y. Application of Automation for In-Line Quality Inspection, a Zero-Defect Manufacturing Approach. J. Manuf. Syst. 2023, 67, 1–22. [Google Scholar] [CrossRef]
- Fujishiro, A.; Nagamura, Y.; Usami, T.; Inoue, M. Minimization of CNN Training Data by Using Data Augmentation for Inline Defect Classification. In Proceedings of the 2020 International Symposium on Semiconductor Manufacturing (ISSM), Tokyo, Japan, 15–16 December 2020; pp. 1–4. [Google Scholar]
- Weiher, K.; Rieck, S.; Pankrath, H.; Beuss, F.; Geist, M.; Sender, J.; Fluegge, W. Automated Visual Inspection of Manufactured Parts Using Deep Convolutional Neural Networks and Transfer Learning. Procedia CIRP 2023, 120, 858–863. [Google Scholar] [CrossRef]
- Yang, J.; Li, S.; Wang, Z.; Dong, H.; Wang, J.; Tang, S. Using Deep Learning to Detect Defects in Manufacturing: A Comprehensive Survey and Current Challenges. Materials 2020, 13, 5755. [Google Scholar] [CrossRef] [PubMed]
- Chen, Y.; Ding, Y.; Zhao, F.; Zhang, E.; Wu, Z.; Shao, L. Surface Defect Detection Methods for Industrial Products: A Review. Appl. Sci. 2021, 11, 7657. [Google Scholar] [CrossRef]
- Bhatt, P.M.; Malhan, R.K.; Rajendran, P.; Shah, B.C.; Thakar, S.; Yoon, Y.J.; Gupta, S.K. Image-Based Surface Defect Detection Using Deep Learning: A Review. J. Comput. Inf. Sci. Eng. 2021, 21, 040801. [Google Scholar] [CrossRef]
- Kim, S.; Kim, W.; Noh, Y.-K.; Park, F.C. Transfer Learning for Automated Optical Inspection. In Proceedings of the 2017 International Joint Conference on Neural Networks (IJCNN), Anchorage, AK, USA, 14–19 May 2017; pp. 2517–2524. [Google Scholar]
- Defard, T.; Setkov, A.; Loesch, A.; Audigier, R. PaDiM: A Patch Distribution Modeling Framework for Anomaly Detection and Localization. arXiv 2020, arXiv:2011.08785. [Google Scholar] [CrossRef]
- Bergmann, P.; Fauser, M.; Sattlegger, D.; Steger, C. MVTec AD—A Comprehensive Real-World Dataset for Unsupervised Anomaly Detection. In Proceedings of the IEEE/CVF Conference on Computer Vision and Pattern Recognition (CVPR), Long Beach, CA, USA, 15–20 June 2019. [Google Scholar]
- Wu, Z.-G.; Lin, C.-Y.; Chang, H.-W.; Lin, P.T. Inline Inspection with an Industrial Robot (IIIR) for Mass-Customization Production Line. Sensors 2020, 20, 3008. [Google Scholar] [CrossRef] [PubMed]
- Abdallah, H.B.; Jovančević, I.; Orteu, J.-J.; Brèthes, L. Automatic Inspection of Aeronautical Mechanical Assemblies by Matching the 3D CAD Model and Real 2D Images. J. Imaging 2019, 5, 81. [Google Scholar] [CrossRef] [PubMed]
- Semeniuta, O.; Dransfeld, S.; Falkman, P. Vision-Based Robotic System for Picking and Inspection of Small Automotive Components. In Proceedings of the 2016 IEEE International Conference on Automation Science and Engineering (CASE), Fort Worth, TX, USA, 21–25 August 2016; pp. 549–554. [Google Scholar]
- Quigley, M.; Conley, K.; Gerkey, B.; Faust, J.; Foote, T.; Leibs, J.; Wheeler, R.; Ng, A.Y. ROS: An Open-Source Robot Operating System. In Proceedings of the ICRA Workshop on Open Source Software, Kobe, Japan, 12–17 May 2009; Volume 3, p. 5. [Google Scholar]
- Coleman, D.; Sucan, I.; Chitta, S.; Correll, N. Reducing the Barrier to Entry of Complex Robotic Software: A Moveit! Case Study. arXiv 2014, arXiv:1404.3785. [Google Scholar]
- Liao, P.-S.; Chen, T.-S.; Chung, P.-C. A Fast Algorithm for Multilevel Thresholding. J. Inf. Sci. Eng. 2001, 17, 713–727. [Google Scholar]
- ResNet. Available online: https://pytorch.org/hub/pytorch_vision_resnet/ (accessed on 13 March 2024).
- He, K.; Zhang, X.; Ren, S.; Sun, J. Deep Residual Learning for Image Recognition. In Proceedings of the 2016 IEEE Conference on Computer Vision and Pattern Recognition (CVPR), Las Vegas, NV, USA, 27–30 June 2016; pp. 770–778. [Google Scholar]
Disclaimer/Publisher’s Note: The statements, opinions and data contained in all publications are solely those of the individual author(s) and contributor(s) and not of MDPI and/or the editor(s). MDPI and/or the editor(s) disclaim responsibility for any injury to people or property resulting from any ideas, methods, instructions or products referred to in the content. |
© 2025 by the authors. Licensee MDPI, Basel, Switzerland. This article is an open access article distributed under the terms and conditions of the Creative Commons Attribution (CC BY) license (https://creativecommons.org/licenses/by/4.0/).