Abstract
In material classification tasks, custom sensors have traditionally been employed to achieve accuracy scores. While numerous studies have reported high accuracy rates, there has been limited discussion on real-time predictions or real-world applications in most research papers. The real-time prediction of object material properties is crucial for enhancing the tactile sensing capabilities of robotics in industrial settings. This study proposes the use of Commercial Off-The-Shelf (COTS) tactile sensors for hardness classification, utilizing small datasets for model training and real-time prediction. Testing involves evaluating the ability of robotic grippers to accurately predict the hardness of new, unknown objects, categorizing them into two classes (soft, hard) or three classes (hard, soft, flexible). Results obtained from a multiple-algorithm approach reveal an 80% accuracy rate for binary classification, with real-time tests demonstrating two out of three correct predictions for most sensors. For ternary classification, the accuracy rate is around 70%, with two out of three correct predictions from at least one sensor. These findings highlight the capability of COTS sensors to perform real-time hardness classification effectively. This also highlights that COTS sensors have capabilities and flexibility based on their dimensional architecture that can be used in many different robotics applications without investing time in the development of a specific use-case sensor for classification tasks within robotic tactile sensing.
1. Introduction
Determining the properties of objects or materials has always been crucial in manufacturing environments for handling purposes. Different types of classification have been performed across the literature using various customized, complex architecture-based sensors [1,2,3]. These tactile sensors, however, have a high cost to produce and take more time to become ready to deploy in robotics environment [3,4,5]. Additionally, customized sensors often face integration issues with robotic grippers. While different types of classification have demonstrated promising results in terms of accuracy, real-time prediction still misses the context of application use of sensors [2,4,5,6,7]. However, one significant classification that has not been extensively explored is hardness classification. Hardness classification is essential in the industrial robotic environment. This helps to train robotic grippers to understand the hardness of objects, thereby enhancing the tactile sensing capabilities of robotic grippers. Different machine learning algorithms have been used across literature to analyze collected data and use accuracy metrics to evaluate performance but do not explore real-time testing or the prediction capability outcome of classification [2,4].
Previously, the literature has explored COTS and other tactile sensors inspired by human mechanoreceptors functionality [4,6,7]. These studies, however, have primarily focused on classification accuracy from multiple algorithms. To extend the existing outcomes and studies to real-time application scenarios, it is crucial to understand COTS sensor’s capability in real-time predictions using existing trained models. Also, customized sensors can face difficulty while integrating with different robotic grippers, whereas COTS sensors may have more flexibility and agility to embed with robotic grippers. The literature has utilized different sensors to investigate classification by collecting data from various objects based on the shore hardness scale [4,6]. This paper focuses on the investigation of COTS tactile sensors individually for classification and performing near-real-time hardness prediction. Additionally, it presents how expanding the number of object classes impacts the prediction of unknown objects and the retesting of new object data for real-time hardness estimation. This will demonstrate the capability of COTS tactile sensors as a potential solution in real-time robotic environments.
2. Method
2.1. COTS Sensor
Based on a literature review, COTS tactile sensors were selected to conduct real-time prediction tests [4]. Three sensors were identified: one force-sensitive resistor (FSR) as (F), potentiometer sensors Softpot membrane as (P), and a vibration thin film sensor as (V). Each of the sensors were readily available and they were easy to install on the Schunk robotics gripper with the help of tape. Each sensor’s value was collected through Arduino via raspberry-pi 3 Model B+ and Raspberry Pi OS using a serial commutation library which was adapted from a research paper [4,7]. Each sensor detects different types of tactile information—pressure, vibration, and force—as analog values during the grasping process. These tactile inputs are crucial for accurately determining the hardness and other properties of the objects being handled, as demonstrated in the study from [4]. The integration of these sensors allows comprehensive data collection, which can be essential for improving the precision and reliability of COTS in real-time predictions for robotic applications.
2.2. Object Selection Based on Shore Scale
The previous literature has highlighted various techniques utilizing the shore hardness scale, categorizing it into qualitative and quantitative methods [4]. The qualitative scale was used to select and prepare objects for 3D printing techniques and highlighted as follows: soft—S; hard—H; F—flexible. Illustrated in Figure 1, the qualitative scale served as a reference for understanding the objects chosen for data collection during the experiment and for retesting the model with unknown objects. For training and testing the machine learning (ML) methods, four primary objects were selected, silicone rubber (S), PLA-Polylactic Acid (H), TPU (thermoplastic polyurethane) -(F), and wood (H), each approximately 3 cm × 3 cm × 3 cm in size. For real-time predictions, metal (H), thread ball (F or S), and white sponge (S) were chosen. Each object was categorized as either soft, flexible, or hard. In the binary classification–retesting case, squeezable objects were considered soft (S), while flexible objects were also considered soft.
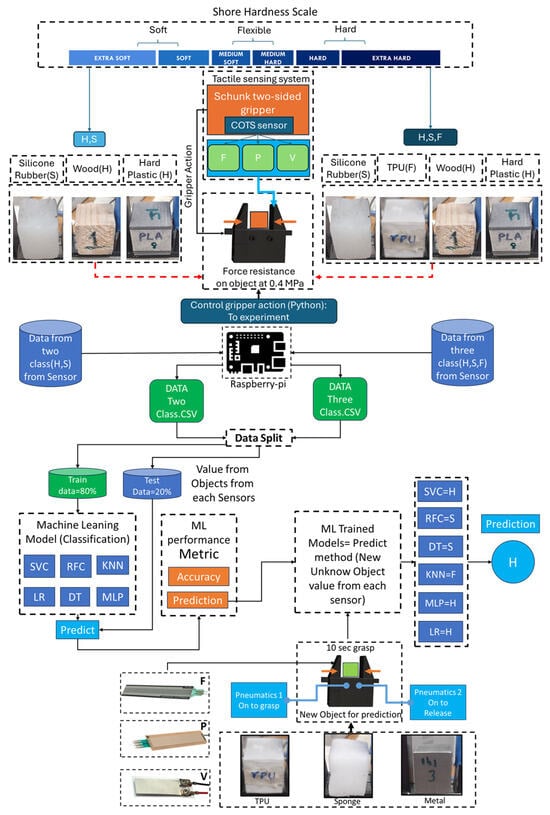
Figure 1.
This figure illustrates the shore scale-based object selection method used for hardness classification. In this approach, objects are classified into two categories, hard (H) and soft (S), or into three categories, hard (H), soft (S), and flexible (F). New objects are treated as unknown values and are evaluated using a trained prediction model. This model processes data obtained from COTS sensors and values obtained while grasping for 10 s sequentially to predict whether the object is H, S, or F [4].
2.3. Approach
The approach illustrated in Figure 1 can be described as follows: To perform hardness prediction, COTS sensors were selected to collect tactile information from objects using grasping or force resistance methods, or by squeezing the objects with a two-sided robotic gripper. Objects, chosen based on the shore hardness scale, were subjected to a force impact of 0.4 MPa and placed between the robotic gripper to collect data from each sensor (F—force; P—potentiometer; V—vibration). This resulted in two sets of data for binary classification (hard and soft) and ternary classification (hard, soft, flexible) for each object. The data obtained from the sensors were connected to an Arduino and stored on a raspberry-pi. Gripper actions were controlled via Python 3.11.0, which also managed the pressure valve for grasping and releasing. For the classification task, multiple machine learning algorithms such as Support Vector Classifier (SVC), Random Forest, Decision Tree, and others were implemented as described in the literature [1,2,4,5]. To test the trained algorithms, 20% of the original data were used as test data to predict accuracy, as shown in the results. For real-time testing, an unknown object was chosen to test each sensor and ML predictability, while grasping new data were generated and fed at the same time without storing. The sensor data were fed directly into the trained model to predict outcomes such as H (hard), S (soft) for binary classification, and H, S, F (flexible) for ternary classification. After each algorithm predicted the outcome, the maximum number of predictions of any class determined the overall outcome. This overall algorithm prediction was represented in the results, indicating the most repeated outcomes as H, S or H, S, F.
3. Results and Discussion
To validate the machine learning algorithm, two methods were used. First, unseen object data comprising 20% of the original dataset was used to test the model. This approach confirms the model’s accuracy and evaluates its performance with data that was not used during the training phase. Second, real-time data were integrated into the predictive model of each ML algorithm, which had been trained with previously collected data. This method allowed for the assessment of the model’s performance in real-time scenarios, demonstrating its capability to handle predictions and adapt dynamically to new tactile information.
3.1. Accuracy
The accuracy results are illustrated in Figure 2, demonstrating the performance of various machine learning algorithms and highlighting the capability of COTS sensors in performing hardness classification compared to the literature that uses customized sensors. The accuracy for binary classification reached approximately 82%, indicating that among the three COTS sensors, P (potentiometer) and F (force) showed reliable outcomes. For the three-class classification, only the P sensor was able to achieve around 69% accuracy, whereas the F and V (vibration) sensors did not reach this level.
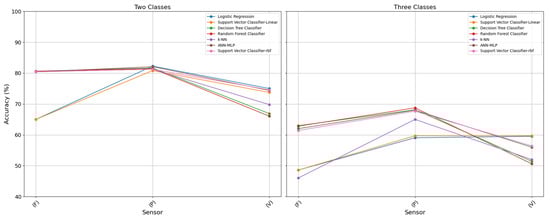
Figure 2.
This figure illustrates the accuracy results obtained from each algorithm for the sensors considered across multiple algorithms: F—force sensors; P—potentiometer sensors; V—vibration sensors. The left plot shows the accuracy based on two classes (hard and soft), while the right plot presents the accuracy based on three classes (hard, soft, and flexible).
3.2. Real-Time Prediction
In real-time prediction, unknown object values were directly obtained from each sensor within the robotic gripper over durations ranging from 1 to 10 s as illustrated in Figure 3, based on the shore hardness scale. Each second denotes the number of datasets considered estimated: 1 sec corresponds to 1 data point, while 10 sec provides 10 data points if the object is continuously grasped. The median value was obtained which goes into the prediction method of each model to predict the classifier. Most of the predicted outcomes from each algorithm were used to determine the final result. For a binary classification, the outcomes were H (hard) and S (soft), as shown in Table 1. For a ternary classification, the outcomes were H (hard), F (flexible), and S (soft), as shown in Table 2.
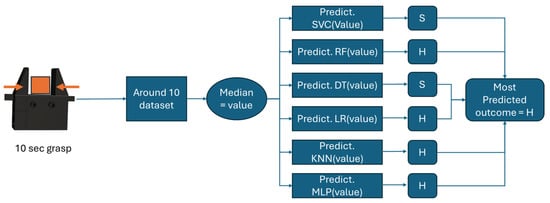
Figure 3.
The figure showcases the prediction approach employed, highlighting the outcomes from several algorithms. The process begins with the grasping of the object for approximately 10 sec to collect data, followed by calculating the median value. This median value is then input into the prediction methods of each algorithm, with the most predicted outcome being displayed.

Table 1.
Table showcases the outcome prediction which uses binary classification (H, S) based trained model and predicts outcome based on two classes: H—hard; S—soft. Red indicates the wrong prediction.
Table 2.
Table showcases the outcome prediction which uses a ternary classification (H, S, F) based trained model and predicts outcome based on three classes: H—hard; S—soft; F—Flexible. Red indicates the wrong prediction.
4. Conclusions
The results from real-time prediction demonstrate that binary classification can accurately predict the properties of unknown object materials to a certain extent. However, as shown in Table 2, increasing the number of classes to include a flexible category leads to a rise in prediction errors and a drop in accuracy. The study also indicates that COTS sensors are capable of handling real-time prediction in binary classification scenarios, but their performance declines when the number of classes expands. In binary classification, both FSR and vibration sensors accurately predicted material properties, whereas in ternary classification, only potentiometer sensors showed accurate predictions. The near real-time prediction capability of these sensors indicates that COTS sensors have potential for use in real-world applications. For future research, these sensors and the proposed approach could be further tested with multiple iterations with best-performing sensors and with topology, thereby enhancing their suitability for wide-scale real-time testing and applications. It is also important to look at how to reduce the time scale of prediction to less than a second.
Supplementary Materials
The following supporting information can be downloaded at: https://www.mdpi.com/article/10.3390/ecsa-11-22208/s1, Video S1: Video Presentation.
Author Contributions
Conceptualization, Y.S.; methodology, Y.S. and P.F.; software, Y.S.; validation, Y.S.; formal analysis, Y.S.; investigation, Y.S.; resources, Y.S.; data curation, Y.S.; writing—original draft preparation, Y.S.; writing—review and editing, Y.S., S.A., C.G., P.F. and L.J.; visualization, Y.S.; supervision, P.F., C.G. and L.J.; project administration, Y.S.; video, Y.S.; S.A., C.G. and P.F.; funding acquisition, P.F. All authors have read and agreed to the published version of the manuscript.
Funding
This research received no external funding.
Institutional Review Board Statement
Not applicable.
Informed Consent Statement
Not applicable.
Data Availability Statement
The data supporting the findings of this study are available within the paper.
Conflicts of Interest
The authors declare no conflict of interest.
References
- Amin, Y.; Gianoglio, C.; Valle, M. Embedded real-time objects’ hardness classification for robotic grippers. Future Gener. Comput. Syst. 2023, 148, 211–224. [Google Scholar] [CrossRef]
- Song, Y.; Lv, S.; Wang, F.; Li, M. Hardness-and-Type Recognition of Different Objects Based on a Novel Porous Graphene Flexible Tactile Sensor Array. Micromachines 2023, 14, 217. [Google Scholar] [CrossRef] [PubMed]
- Luo, S.; Bimbo, J.; Dahiya, R.; Liu, H. Robotic tactile perception of object properties: A review. Mechatronics 2017, 48, 54–67. [Google Scholar] [CrossRef]
- Sharma, Y.; Ferreira, P.; Justham, L. Hardness Classification Using Cost-Effective Off-the-Shelf Tactile Sensors Inspired by Mechanoreceptors. Electronics 2024, 13, 2450. [Google Scholar] [CrossRef]
- Jin, J.; Wang, S.; Zhang, Z.; Mei, D.; Wang, Y. Progress on flexible tactile sensors in robotic applications on objects properties recognition, manipulation and human-machine interactions. Soft Sci. 2023, 3, 8. [Google Scholar] [CrossRef]
- Yuan, W.; Zhu, C.; Owens, A.; Srinivasan, M.A.; Adelson, E.H. Shape-independent hardness estimation using deep learning and a GelSight tactile sensor. In Proceedings of the 2017 IEEE International Conference on Robotics and Automation (ICRA), Singapore, 29 May–3 June 2017; pp. 951–958. [Google Scholar] [CrossRef]
- Zhang, Z.; Zhou, J.; Yan, Z.; Wang, K.; Mao, J.; Jiang, Z. Hardness recognition of fruits and vegetables based on tactile array information of manipulator. Comput. Electron. Agric. 2021, 181, 105959. [Google Scholar] [CrossRef]
Disclaimer/Publisher’s Note: The statements, opinions and data contained in all publications are solely those of the individual author(s) and contributor(s) and not of MDPI and/or the editor(s). MDPI and/or the editor(s) disclaim responsibility for any injury to people or property resulting from any ideas, methods, instructions or products referred to in the content. |
© 2025 by the authors. Licensee MDPI, Basel, Switzerland. This article is an open access article distributed under the terms and conditions of the Creative Commons Attribution (CC BY) license (https://creativecommons.org/licenses/by/4.0/).