1. Introduction
Agriculture plays an important role in our lives, sustaining and improving the economic sector, and also helps in ensuring food security across the globe. The field of agriculture contributes up to 6% of the world’s economy and it is a dominant sector in at least nine countries of the world. Agriculture is one of the most important and sensitive sectors of the Indian economy that provides employment to almost half the population of the country. It is essential to obtain real-time information about the type, health, location, extent, and yield of crops for assurance of food security, water resource management, and poverty reduction [
1].
Remote-sensing-based crop type discrimination has gained importance for agricultural research. In situ crop type discrimination is frequently expensive, labour-intensive, and destructive. A large number of remote sensing sensors including multispectral optical sensors, microwave synthetic aperture radar, light detection and ranging (LiDAR), and hyperspectral sensors and techniques have been employed for the periodic assessment and monitoring of crops at different sites [
2,
3]. Such sensor dimensions control the type of detailed information that can be extracted from an image. Remote sensing data contain rich spectral features that characterize crop leaf pigment, leaf water content and canopy structure, and spatial features that reflect crop planting morphology and texture, particularly when high-spatial-resolution images are considered [
4]. Multispectral sensors are limited in their ability to resolve agricultural crop types and can differentiate three to six classes of crop types with an overall accuracy of 60–75%. The improvements in remote sensing sensors in the studies of crop types have been significantly boosted with the launch of hyperspectral sensors with enhanced spatial and spectral resolution. Spectral resolution is more important than spatial resolution for providing accurate figures of species discrimination and the classification of crops. There are many difficulties linked with extracting valuable information with confidence from spatial resolution imagery. Hyperspectral imaging techniques have now been in use for over two decades and come as a reasonable and rapid mode for taking measurements of spectral reflectance. Very limited research has been performed on crop discrimination based on hyperspectral remote sensing sensors [
5,
6]. A precise and continuous spectral signature can significantly help obtain an unambiguous distinction among the crop types [
7]. The spectral signatures reflected from the plant canopy at specific wavelengths provide various types of cumulative information on the substantial and gradual changes that occur in specific plant characteristics or tolerance levels [
8]. Hyperspectral sensors with narrow spectral bands may be crucial for providing information of crop biophysical characteristics and yield prediction.
This study is mainly focused on PRISMA hyperspectral imagery data for the discrimination of crop types. Hyperspectral data were taken over the Khanna, Amloh, and Bassi Pathanan blocks, which lie in part of Punjab state, India. Hyperspectral imagery data were mainly used for development of a spectral library of diverse crop types including maize, sunflower, moong, sugarcane, and chilli. The results of this study will be helpful for the evaluation of the hyperspectral data for agricultural prospects. It may help improve the accuracy of crop mapping and crop condition assessment. Sustainable agriculture is not a set of prescriptive management practises and is defined differently by different people to accommodate individual scientific, political, or economic agendas.
2. Study Area
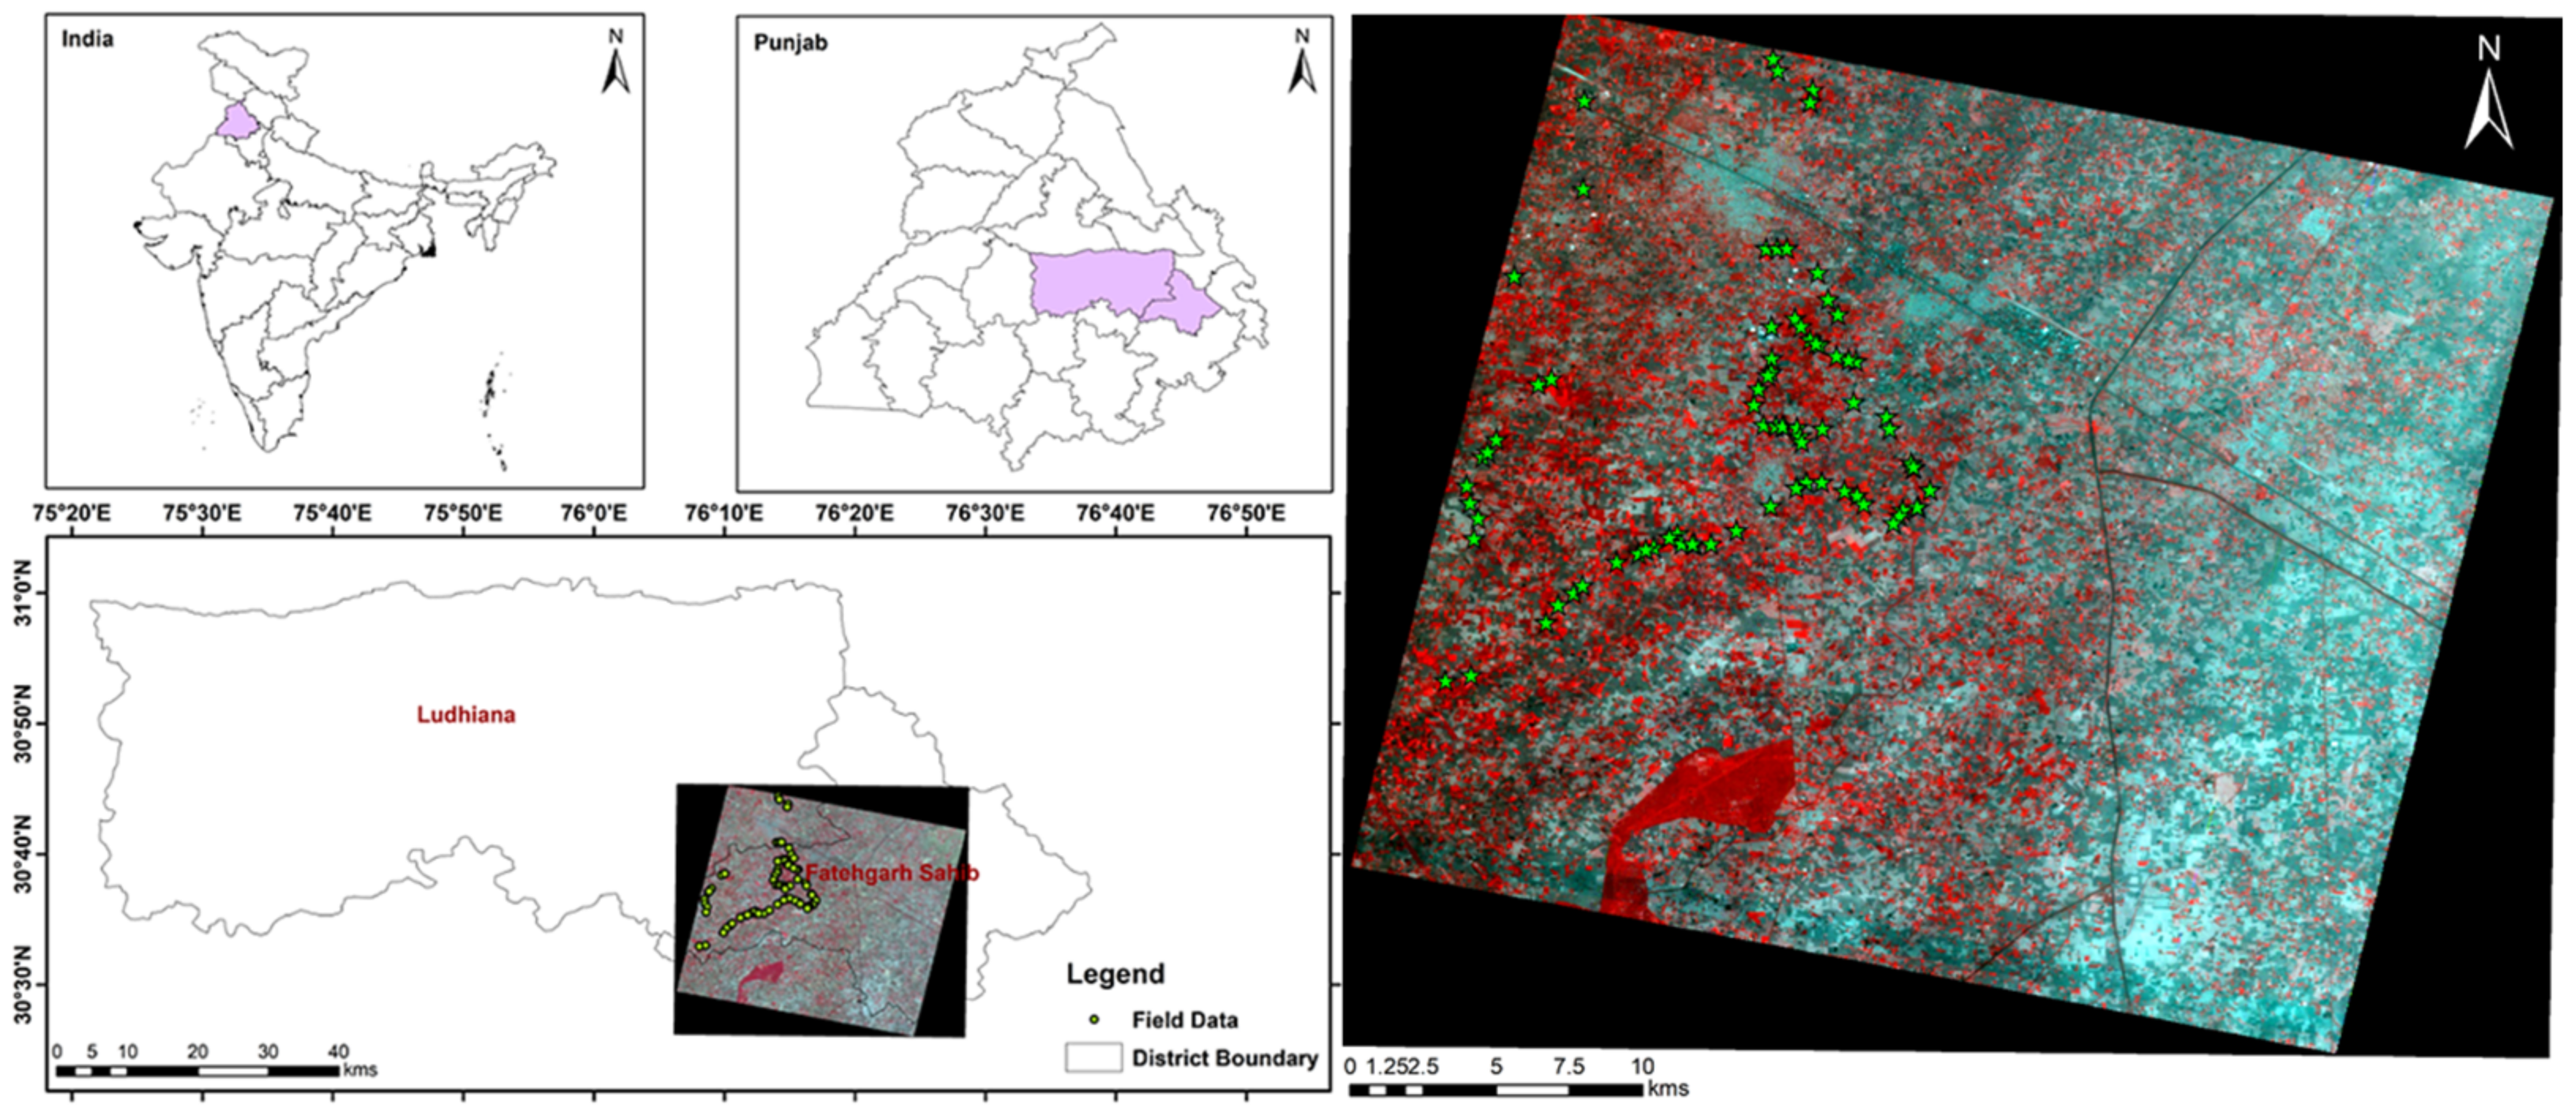
Punjab state is located in the northwest region of India. Punjab is predominantly an agrarian state which is highly dependent on river water for irrigation and domestic purposes in the non-monsoon period, and the main economic activity in the area is with chief crops such as wheat, rice, and cotton. This study area was selected for crop type study due to consisting of varying crop patterns, and the study was carried out over part of the Ludhiana, Fatehgarh Sahib, and Patiala districts of Punjab state, India, with an area that lies between 30°26′ N and 30°45′ N latitude and 76°06′ E and 76°28′ E longitude with a total area of ~890 km
2 (
Figure 1). The block lies in the study areas of Khanna, Amloh, Bassi, and Pathanan over Punjab state, India, and its primarily grown crops during the study period are maize, sunflower, moong, sugarcane, chilli, rice, etc.
3. Materials and Methodology
The research methodology used in this study was divided into four main stages including the literature review, data acquisition, data processing, and data analysis and representation. This study used field sampling points and one hyperspectral remote sensing atmospherically corrected dataset (i.e., PRISMA) over the study area for the effective identification of crop types. Different image processing techniques were developed for the corrections of satellite images. Hyperspectral data were taken at the same time during the field survey. The field data collection period was between May and June 2022 and the acquisition period for the selected images was between 5 and 6 June 2022. The selected image was cloud-free or uncovered. The analysis was performed using ENVI 4.7, ArcMap 10.8, QGIS (
https://qgis.org/), and Matlab 2018a software.
3.1. Field Data Collection
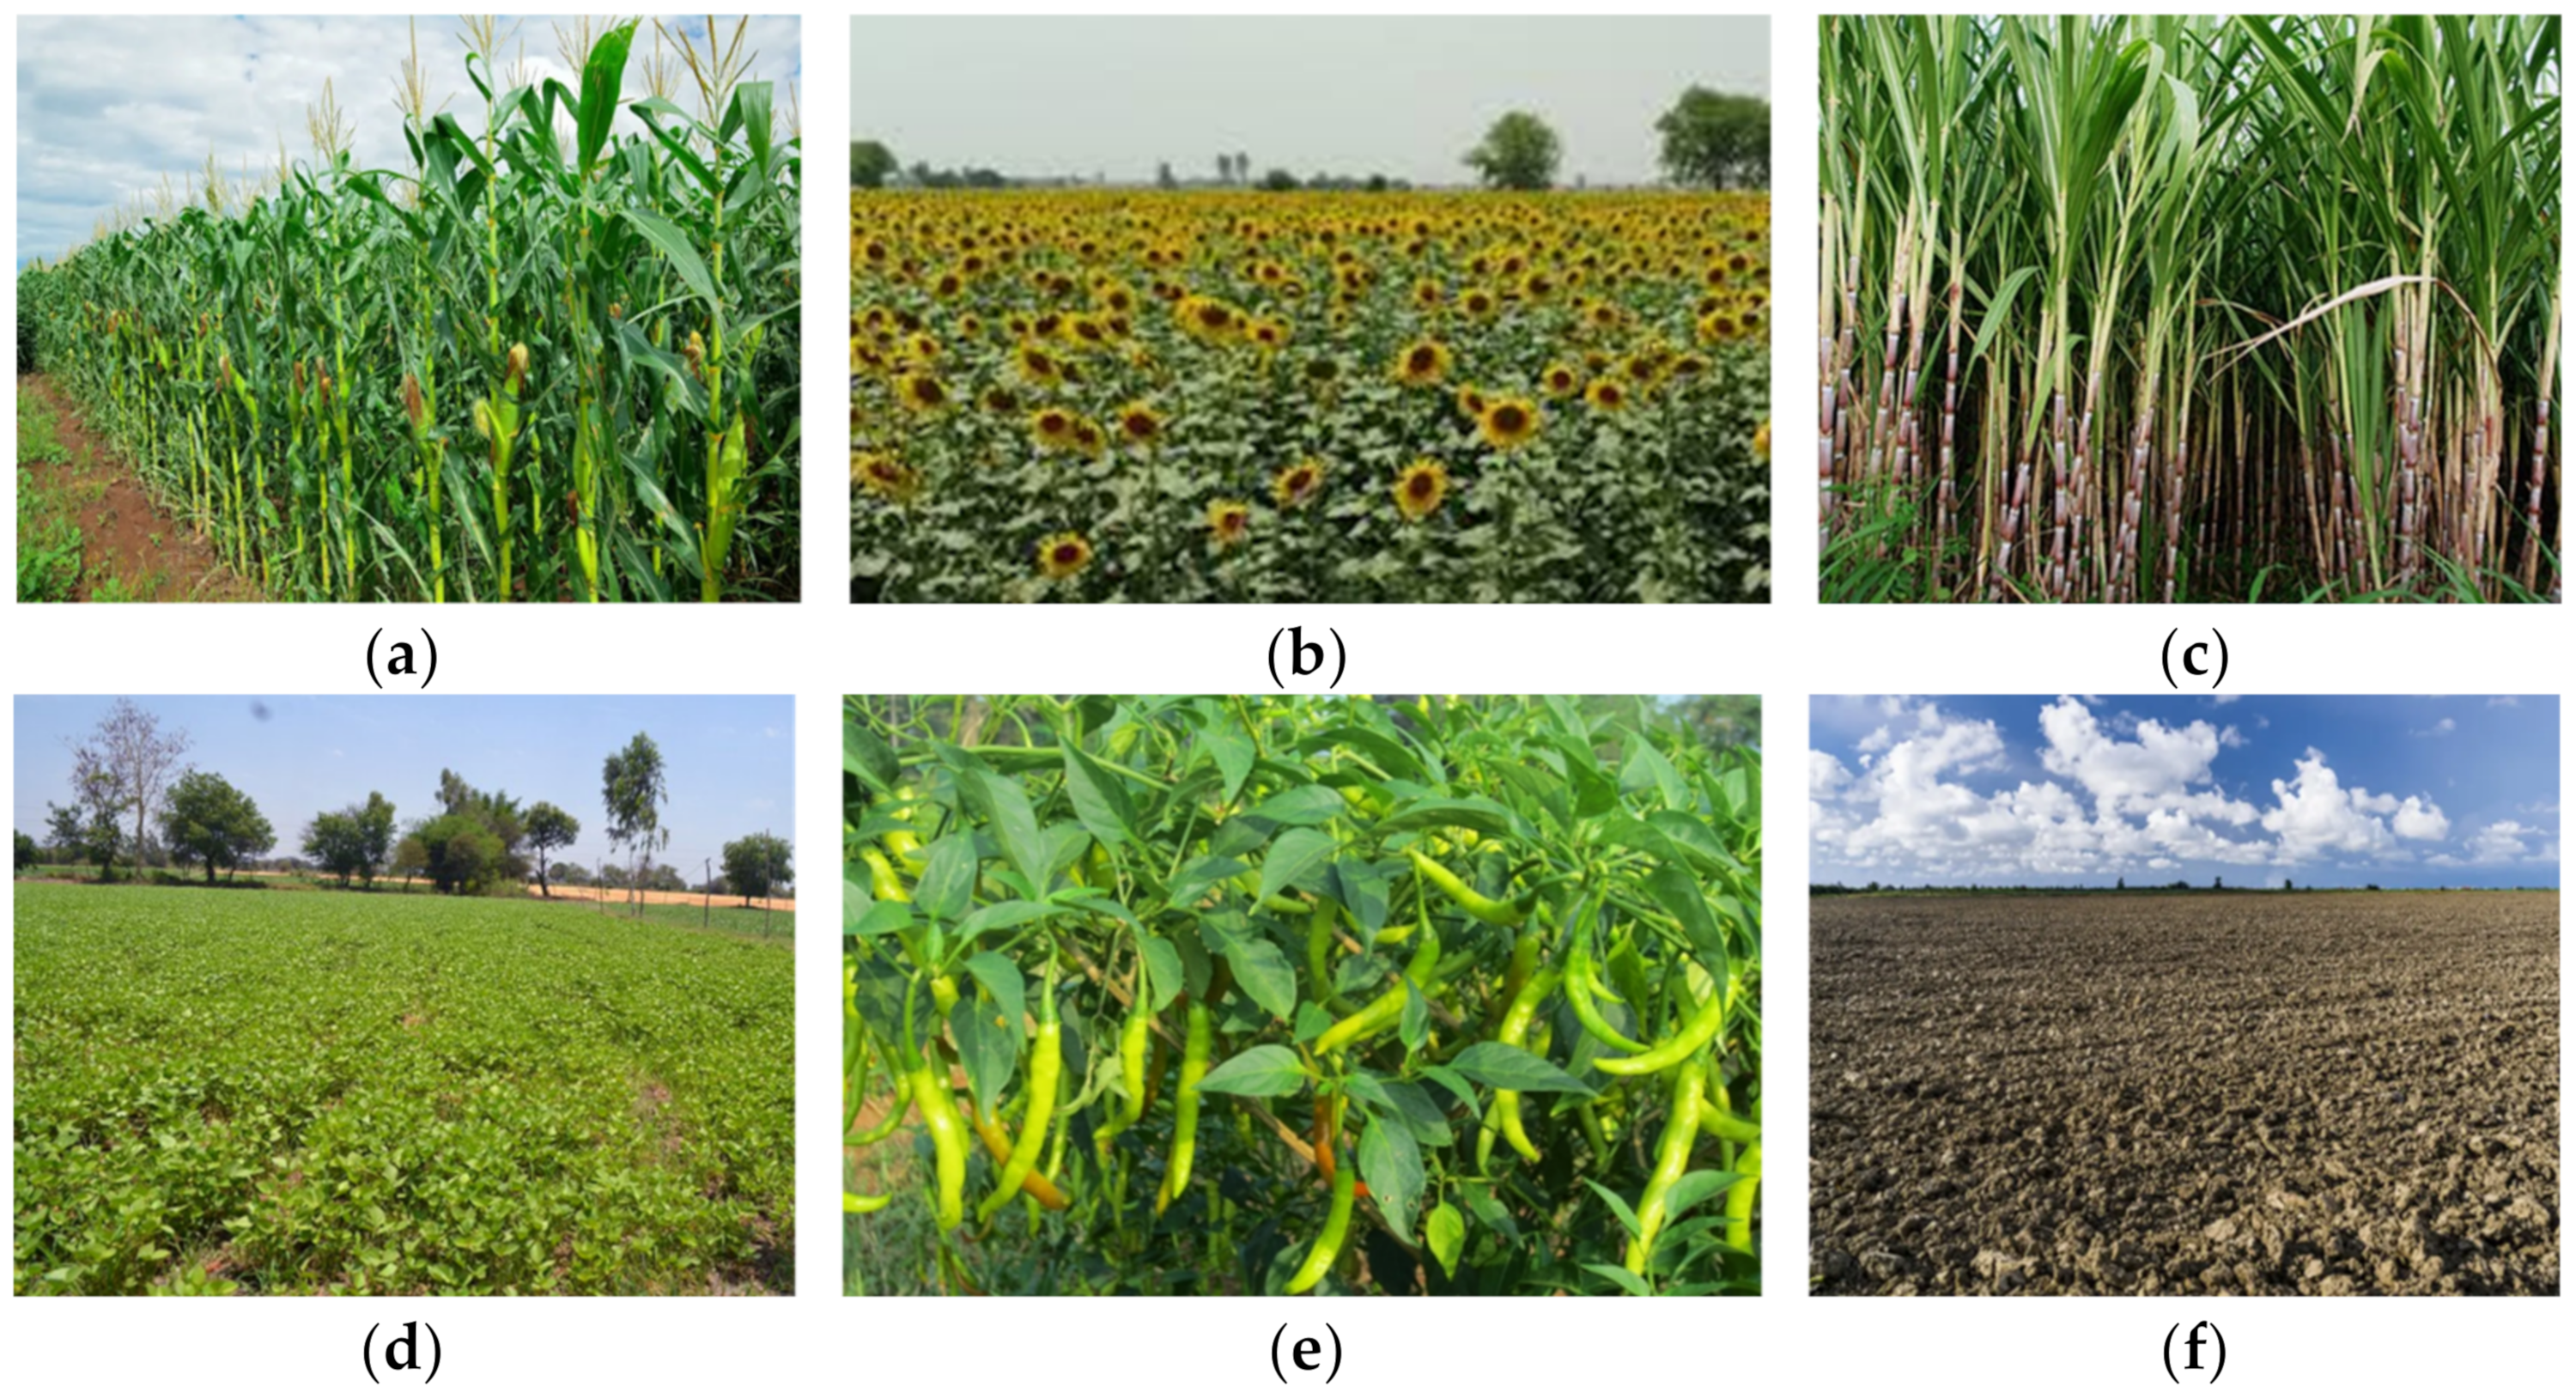
Field data collection is essential to identify the crop types present in a study area. Extensive field work was carried out during the paddy season (May and June months) to acquire the locations of crop types for the creation of a spectral library and classification. The geographical coordinates of each crop were measured using a handheld GPS with a position accuracy of +3 m. A total of 135 individual points were surveyed and the main agricultural crop types over the study area were maize, sunflower, moong, sugarcane, and chilli. Each collected field data point was accompanied with a photo record (
Figure 2).
3.2. PRISMA Hyperspectral Data
The Italian Space Agency (ISA)’s PRecursoreIper Spettraledella Missione Applicativa (PRISMA) hyperspectral imagery (HSI) represents a new era of space-borne monitoring missions and was launched into orbit on 22 March 2019 with narrow bands (<10 nm) and with capability across the full optical range (400–2500 nm) covering the visible and near- and shortwave-infrared ranges [
9]. PRISMA is a push broom sensor that records 250 spectral bands. The swath of hyperspectral imagery is 30 km. The PRISMA system consists of two hyperspectral sensors with a spatial resolution of 30 m and an average spectral resolution <10 nm. Hyperspectral sensors are important tools for the identification of objects and phenomena based on their high-spectral-resolution capability. PRISMA reflectance data were processed using the Spectral Hourglass Wizard (SHW) module available in ENVI 5.4 software. SHW performs Minimum Noise Fraction (MNF), Data Dimensionally Determination, Pixel Purity Index (PPI), Derive End-member, and Spectral Angle Mapper (SAM) for classification. The reference spectra of the different crop types of maize, sunflower, moong, sugarcane, chilli, rice, and other spectra of water and built-up land were derived from PRISMA hyperspectral imagery data.
4. Results and Discussion
This study used a PRISMA-hyperspectral-imagery-derived spectral library of each crop type which covered part of Khanna, Amloh, Bassi, and Pathanan, which lie in Punjab state, India. Hyperspectral imagery data were collected on 5 to 6 June 2022 for crop discrimination and analysis over the study region. Hyperspectral sensors are more useful for distinguishing narrow spectral features, and such sensors can separate out a large number of crop classes. Crop type discrimination is an important requirement for crop mapping and monitoring. PRISMA hyperspectral data were processed based on spectral features and respective crop types were discriminated. The analysis of the PRISMA hyperspectral imagery was mainly focused on the visible and near-infrared bands of reflectance spectra to accurately discriminate and map the spatial distribution of crop types. The spectrum allows us to study very specific characteristics of agricultural crops. The spectral discrimination of agricultural crop types in complex environments is challenging as different crop types may have similar spectral characteristics; alternatively, they may show different spectral signatures. The data were acquired using 234 spectral bands between 400 and 2500 nm. Such a large number of spectral bands increases our ability to identify each crop type spectral signature. The spectral dimension of remotely sensed data is the key control of the types of information that can be measured, classifying and mapping crop types.
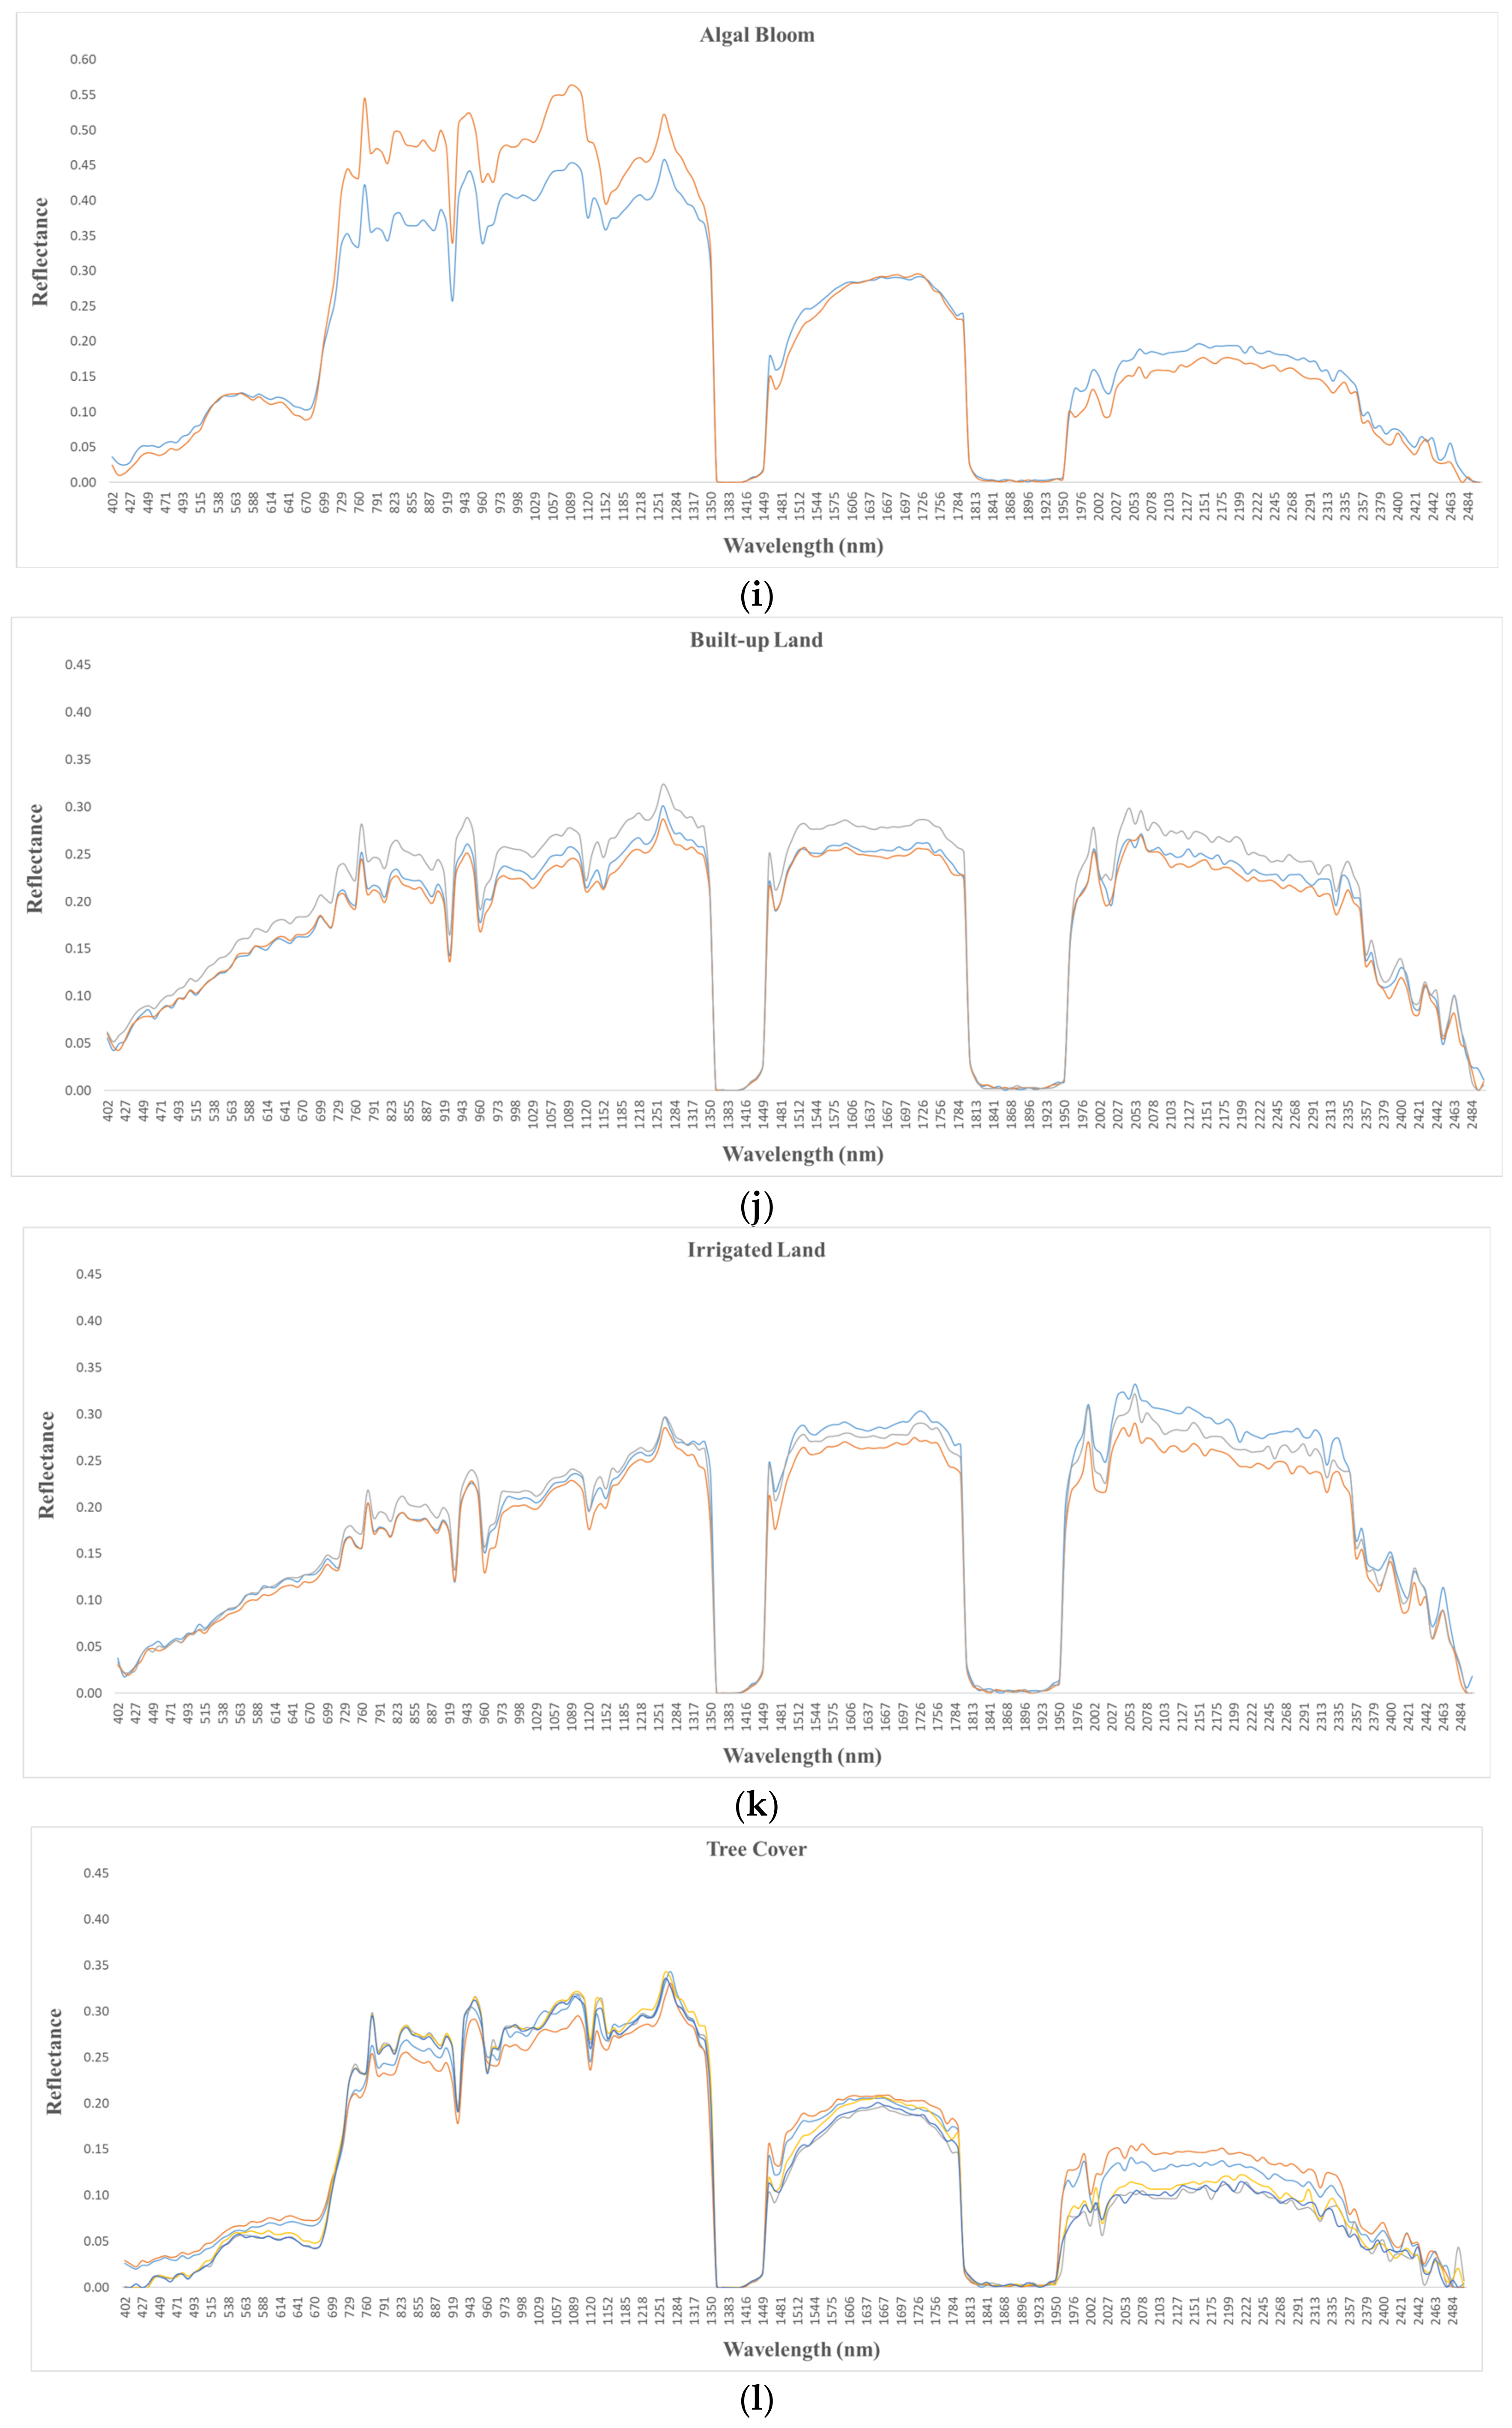
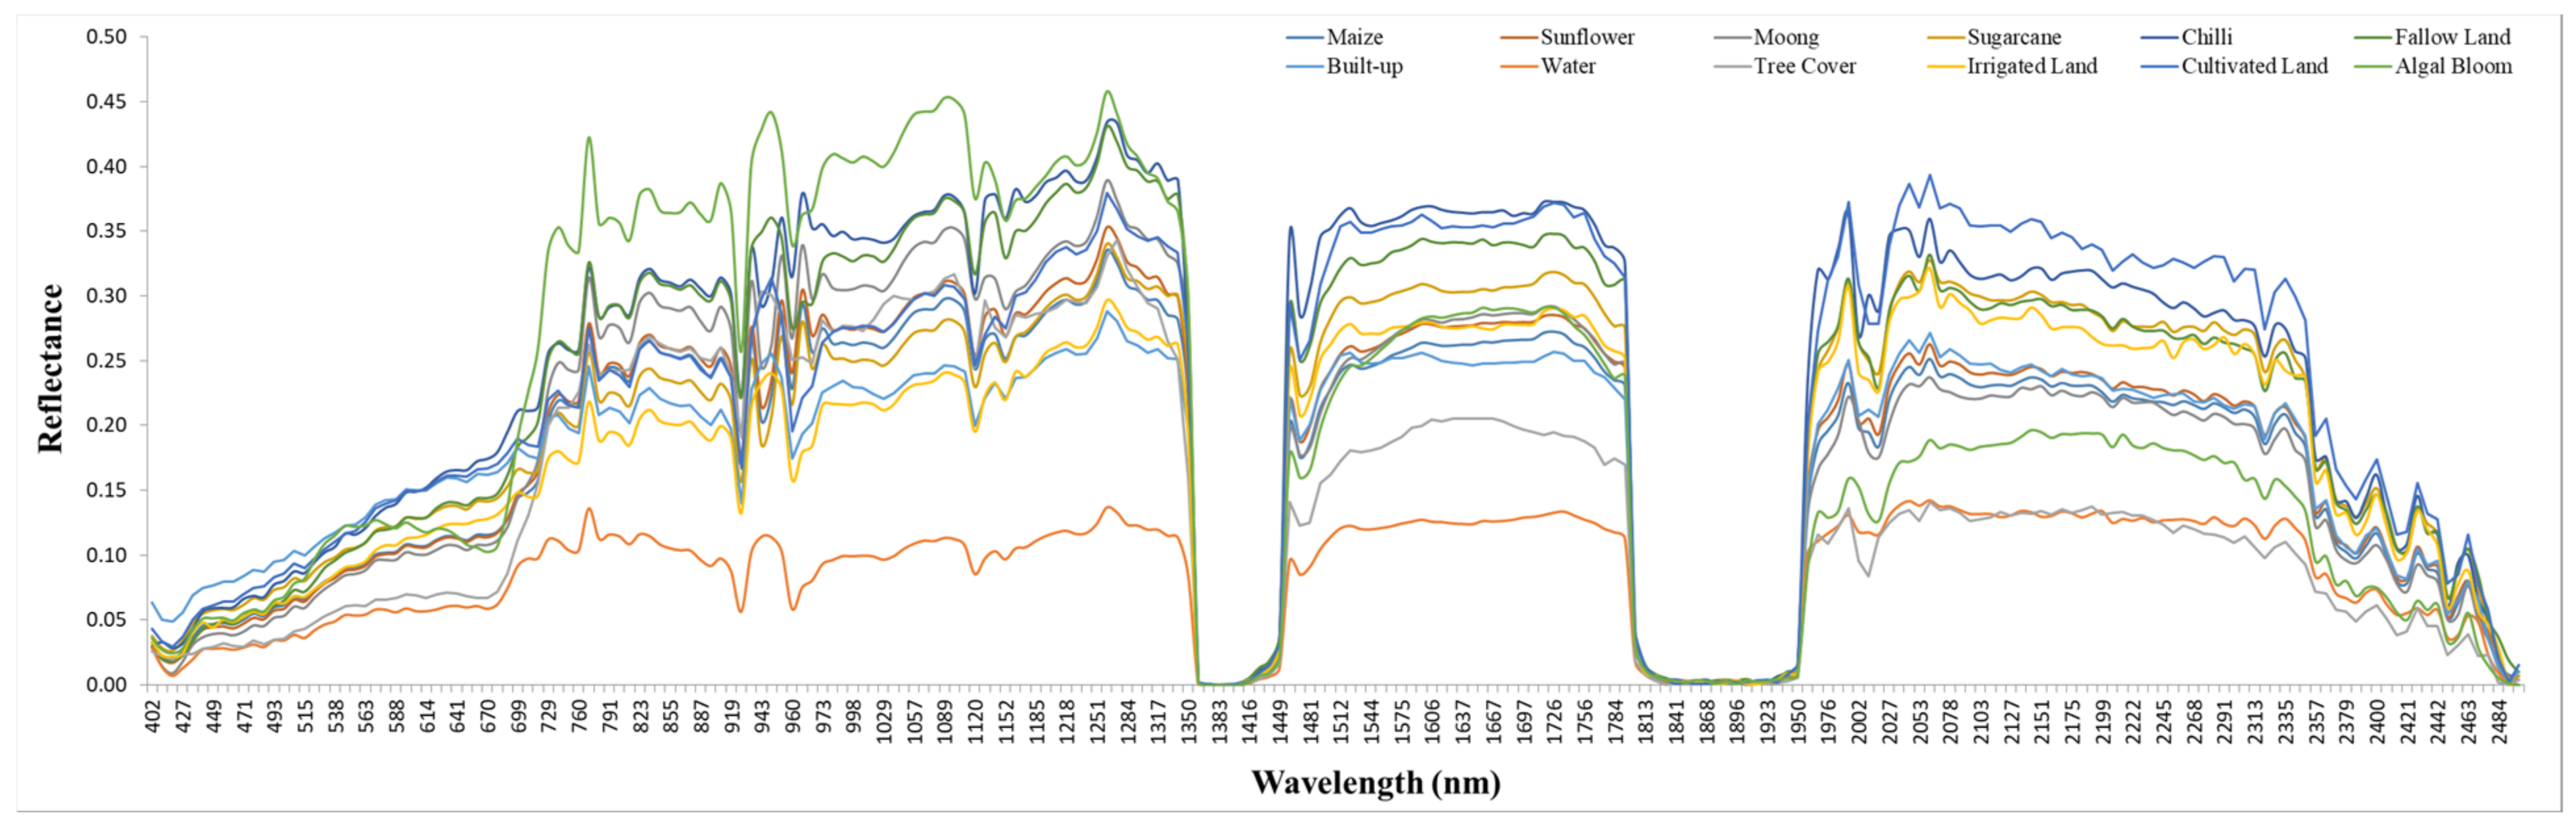
This research is mainly focused on the development of a crop spectral library, varying spectral responses, and the interpretation of spectral features using different indices. Field data were collected at the same time during the satellite imagery survey. During the ground survey, data of five different crop types (maize, moong, sugarcane, sunflower, and chilli) and six other features (fallow land, cultivated land, built-up land, tree cover, water, and algal bloom) were collected over 135 sites. Field data collection sites were selected by visual inspection of crop types and other features present in the hyperspectral imagery data covering the study area, and the reflectance of each crop and other feature types were collected. In this manner, 43 pieces of spectral information of five crop types and 38 pieces of spectral information of seven other features were obtained (
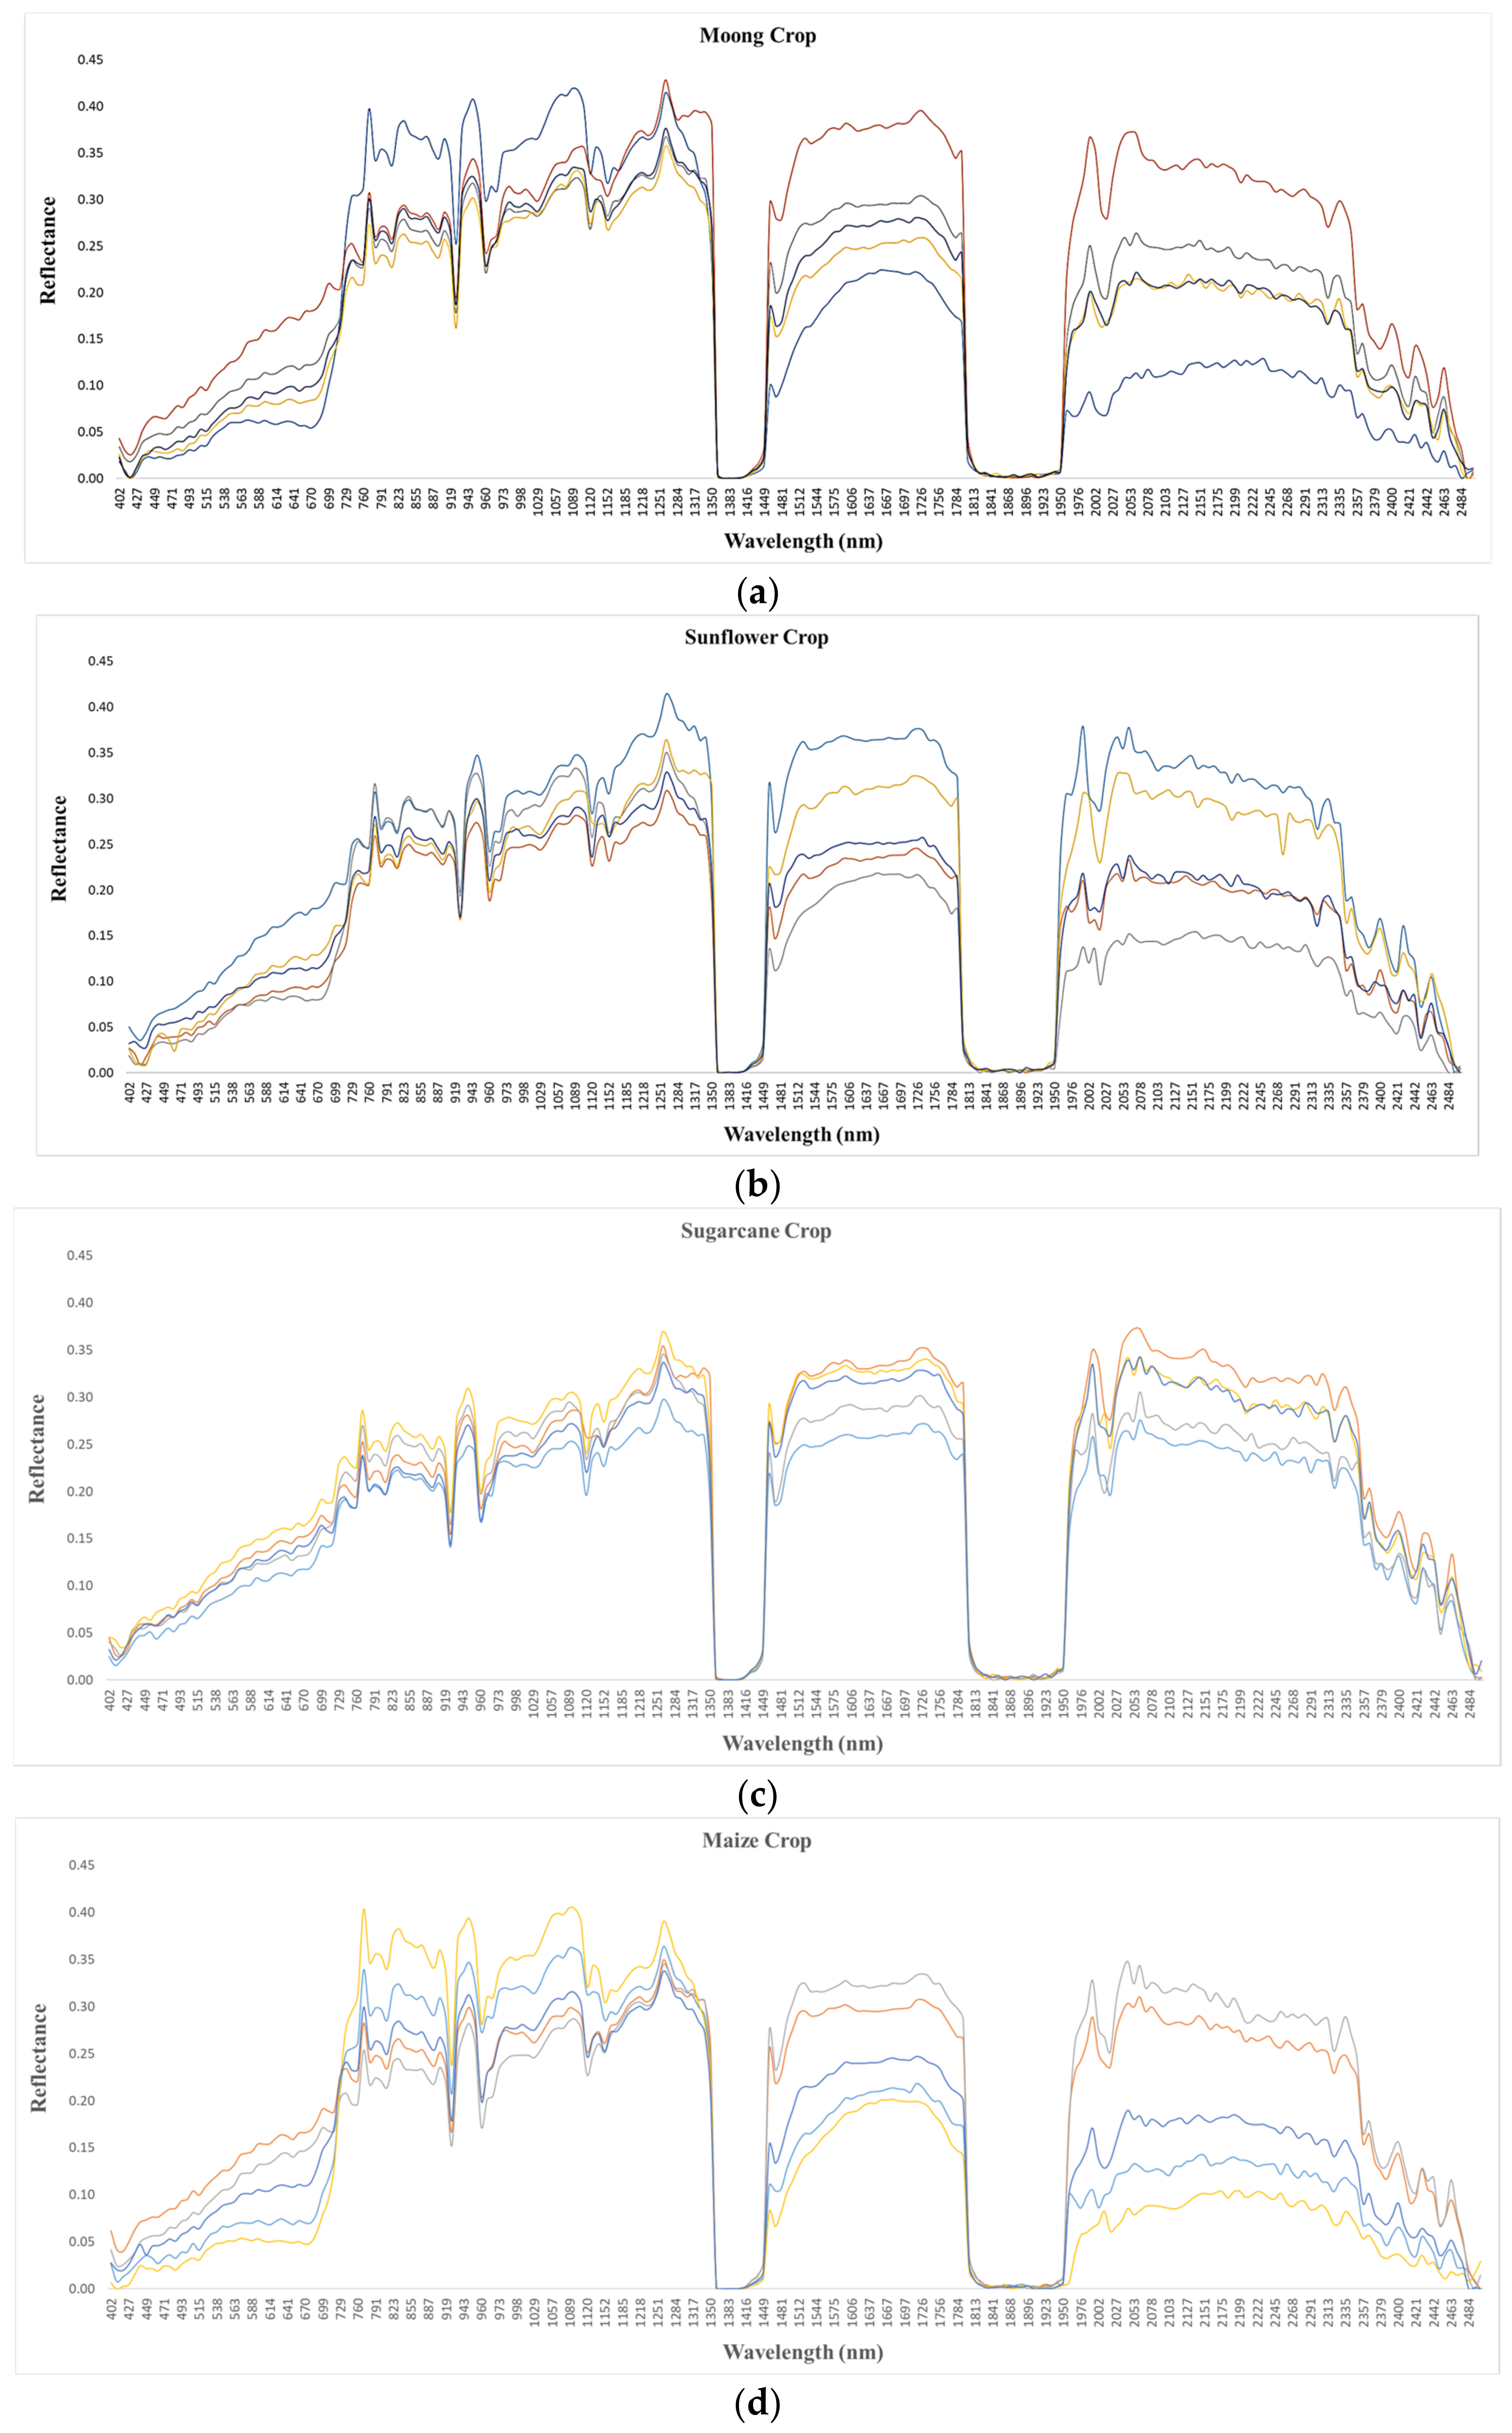
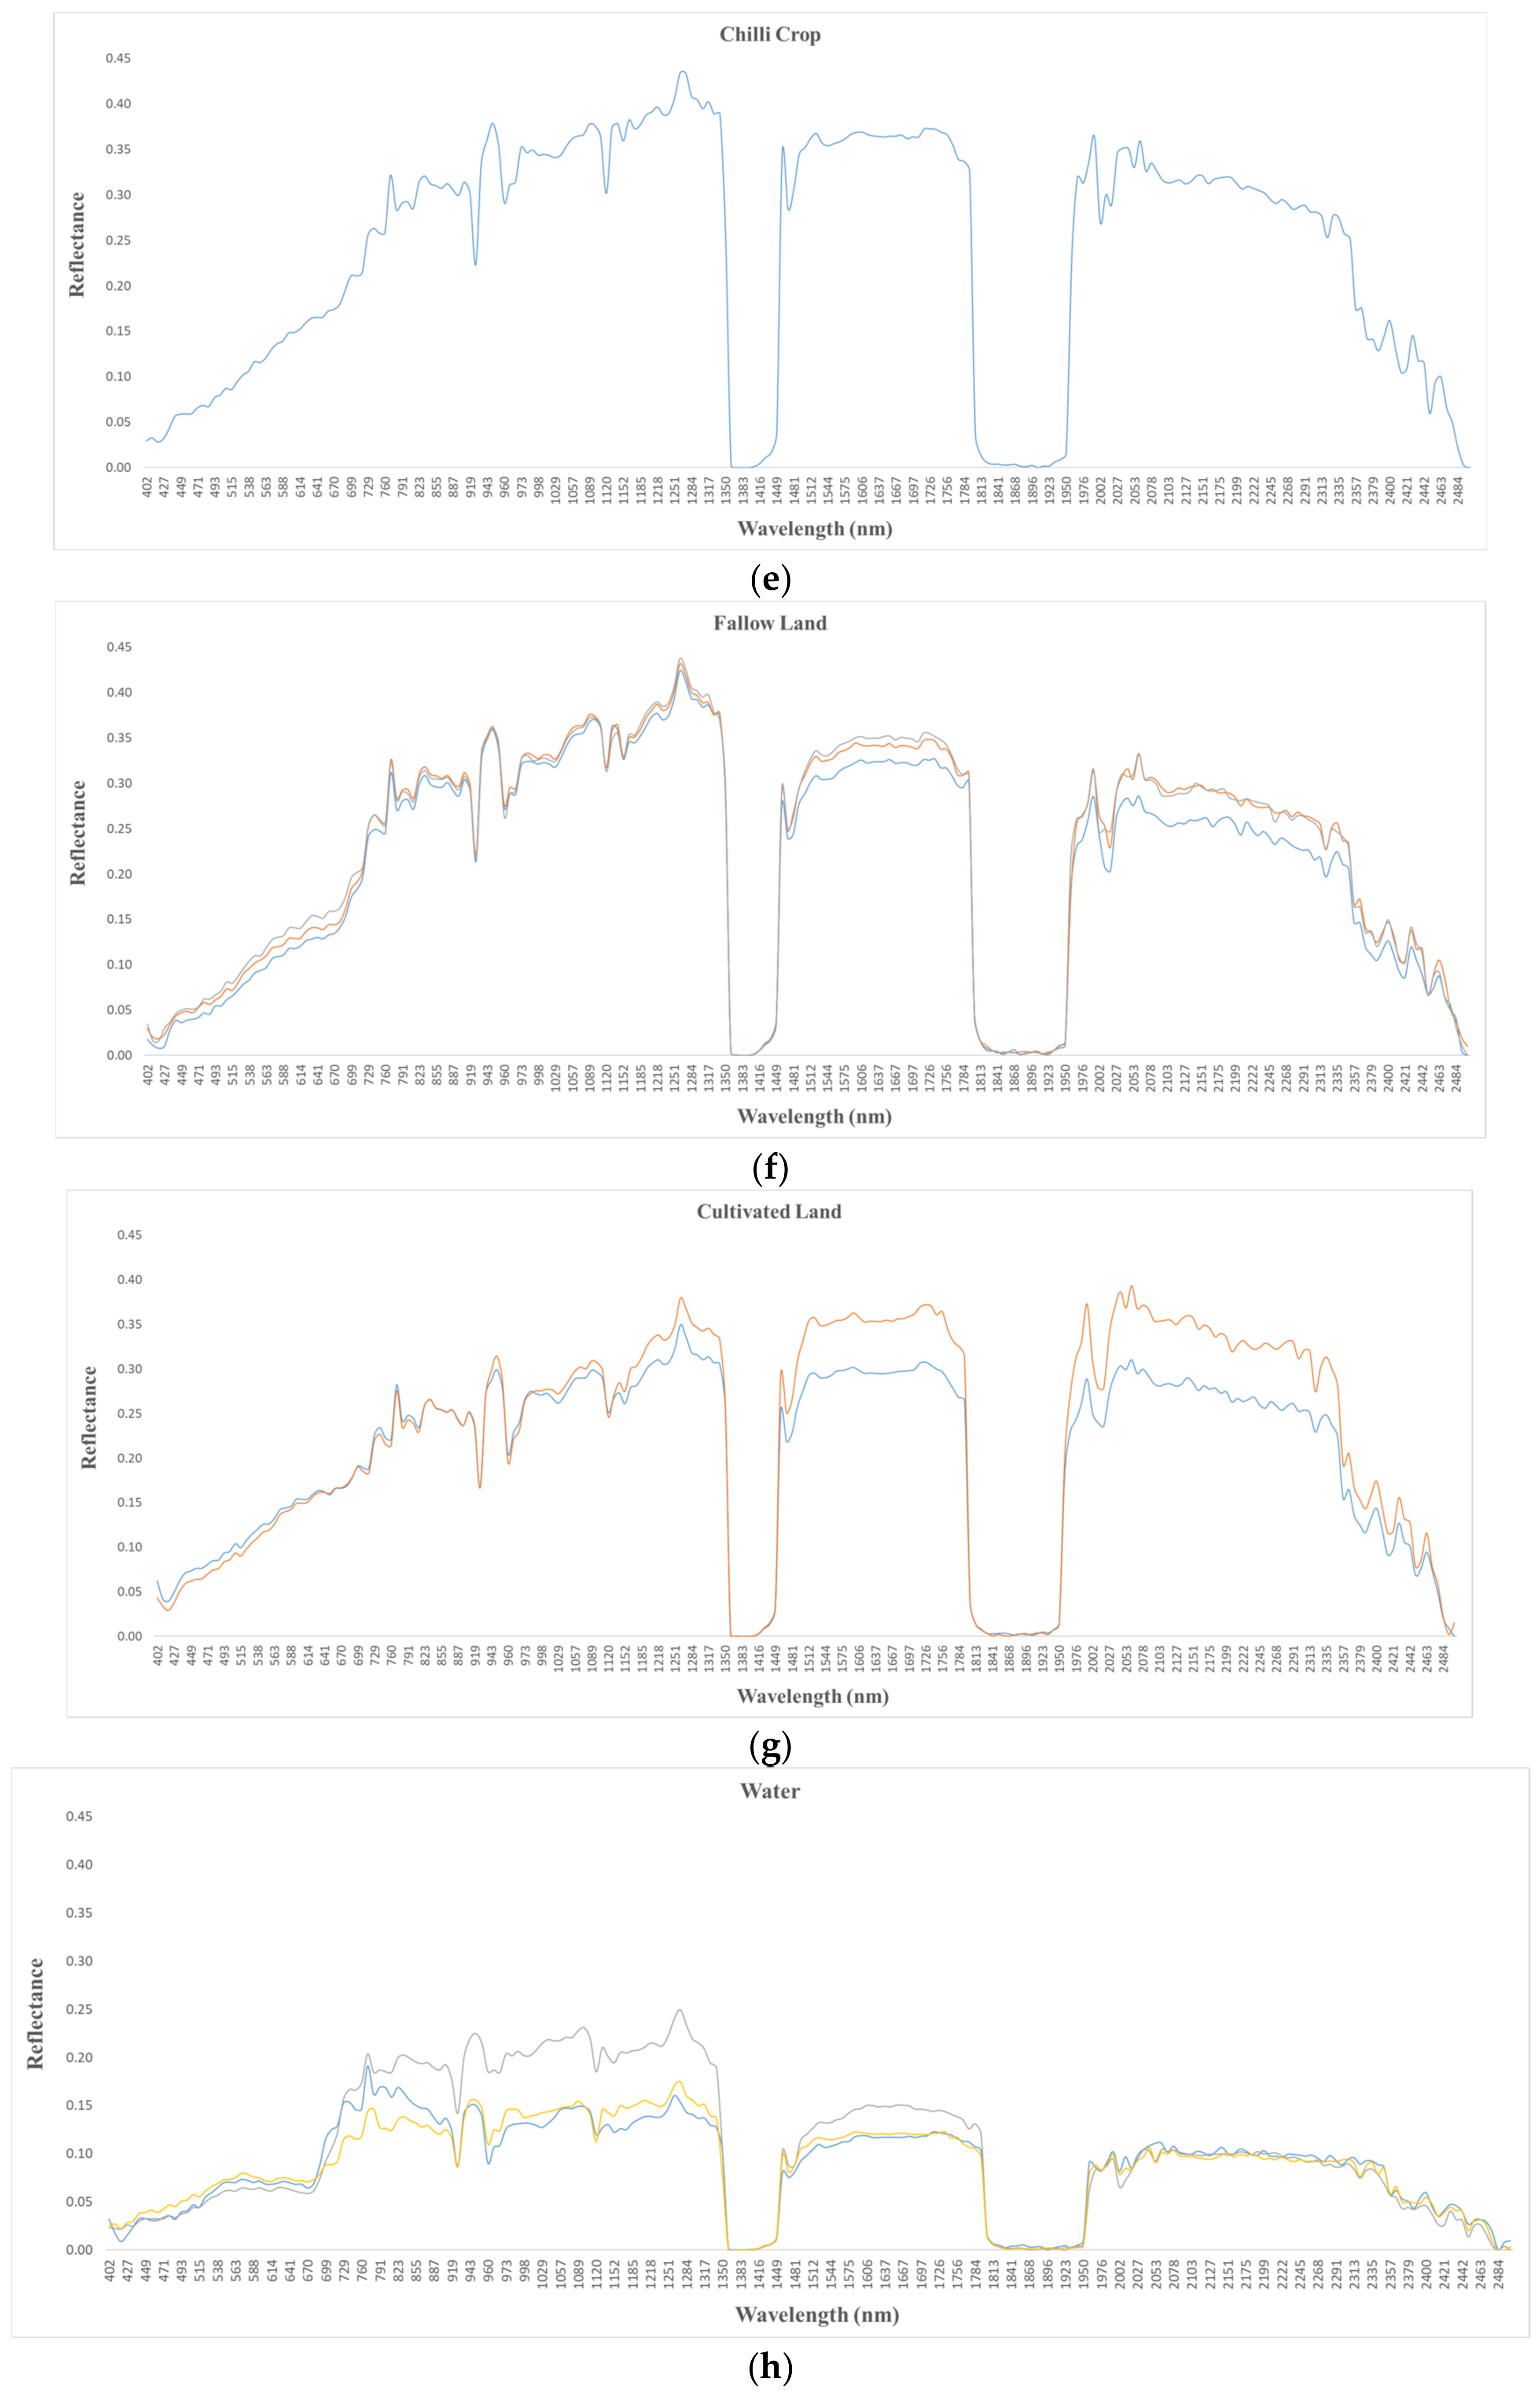
Figure 3). The substrates’ reflectance was calculated as a ratio of the radiance from substrates against the downwelling irradiance. The collected end-member spectra of the same crop types at different sites over the study area were averaged to produce reference spectra for various specimens (
Figure 4 and
Figure 5). A number of collections of spectral signatures of each crop were made to ensure the homogeneity of crops. The main reason for using average spectra is that identical substrate types show variations in spectral reflectance in both magnitude and shape. The average spectral reflectance of each class was determined in a full optical spectral range from 402 to 2497 nm with 9.0 nm intervals. The sampling interval was 8.3 nm in the spectral range of 402 to 700 nm, while it was 9.1 nm in the spectral range of 701 to 2497. The spectral bands between 730 and 1295 nm were optimal in identifying maize crop, while three spectral bands between 402 and 719 nm, 1448 and 1533 nm, and 1949 and 2349 nm were used to identify rice crops. The discrimination of crop type is an important requirement for mapping and monitoring crops. Two major contributions in a crop’s reflectance spectrum are the leaf optical properties and the canopy structure. The narrowband spectral indices were significantly proven effective outcomes for crop pigment analysis.
Hyperspectral sensors acquire reflectance values of each crop type at many different wavelength bands and are particularly sensitive to changes in the chlorophyll content and the structural properties of canopies. The reflectance pattern showed the same trend for all five crops; however, the reflectance of chilli was higher than that of other crops along the whole spectrum. The highest spectral reflectance was shown in the infrared spectral zone (940 to 1300 nm), relatively low reflectance was shown in the spectral zone of 1361 to 1449 nm and 1822 to 1932 nm, and the lowest reflectance was found in the spectral zone of 2350 to 2495 nm as described in
Table 1. This study observed that there was a big similarity in the spectral reflectance pattern in all crop types and it was very difficult to discriminate them. The visible region of the crop reflectance spectrum was characterized by low reflectance due to strong absorption by pigments like chlorophyll. The chlorophyll has strong reflectance peaks in the red and blue wavelength region. A blue peak is not used to estimate the chlorophyll content, because it overlaps with the absorbance of the carotenoids. Maximal absorbance in the red region occurs between 660 nm and 680 nm. The transition from visible to infrared is characterized by a steep increase in reflectance referred to as the red-edge. This edge and the subsequent plateau are related to the leaf chlorophyll content and to the canopy structure. The discrimination information between crop types is characterized by the height of the visible spectrum (400 to 650 nm), the location of the red edge (700 nm), and the height of the infrared spectrum (750 to 900 nm). The NIR spectral zone is the best to differentiate between these six crops, while visible spectral zones did not show any significant difference in crop reflectance. The wavelength range from 400 nm to 800 nm was used for crop health analysis. This study showed that the NIR spectral zone was the best spectral zone to differentiate each crop type. The spectral library of crop types can be useful for a better understanding of the image classification problems. Many studies revealed that the spectral reflectance of vegetation from 400 to 700 nm region is primarily governed by the abundance of chlorophyll and other pigments). The hyperspectral data contain spectral responses of crop leaves in the ripening stage for the extraction of chlorophyll, carotenoid, and xanthophyll contents.
5. Conclusions
This study concludes that hyperspectral remote sensing, along with high spatial and spectral resolution, is an effective tool for the discrimination and classification of crop types. Crop types were effectively distinguished on the basis of their spectral signatures. The red and infrared portions of the electromagnetic spectrum are the most employed and potential wavelength regions for chlorophyll estimation and provide vegetation growth. This study also revealed that the spectral reflectance patterns of all the crop types were similar and that it was very difficult to discriminate them. Spectral signatures of different features can improve the supervised categorization accuracy via machine learning. Compared with broad bands, the narrow bands of hyperspectral data offer significantly more information in terms of quantifying the biophysical properties of agricultural crops. The spectral signatures of various features and classification results can be further used for yield prediction for crops, which can increase food security.
Author Contributions
K.L.: data collection, writing—original draft preparation, software; M.A.: conceptualization, methodology, software, internal review; N.K.: overall guidance and internal review. All authors have read and agreed to the published version of the manuscript.
Funding
This research received no external funding.
Institutional Review Board Statement
Not applicable.
Informed Consent Statement
Not applicable.
Data Availability Statement
The data that support the findings of this study are available from the corresponding author upon reasonable request.
Acknowledgments
The authors would like to acknowledge their appreciation to the Italian Space Agency (ISA) for making this research possible by providing the public domain PRecursoreIperSpettrale delta MissioneApplicativa (PRISMA) hyperspectral imagery datasets. We also express our gratitude to the anonymous reviewers for their insightful criticism.
Conflicts of Interest
The authors declare no conflicts of interest.
References
- Seydi, S.T.; Amani, M.; Ghorbanian, A. A Dual Attention Convolutional Neural Network for Crop Classification Using Time-Series Sentinel-2 Imagery. Remote Sens. 2022, 14, 498. [Google Scholar] [CrossRef]
- Veloso, A.; Mermoz, S.; Bouvet, A.; Le Toan, T.; Planells, M.; Dejoux, J.F.; Ceschia, E. Understanding the temporal behavior of crops using Sentinel-1 and Sentinel-2-like data for agricultural applications. Remote Sens. Environ. 2017, 199, 415–426. [Google Scholar] [CrossRef]
- Xie, B.; Zhang, H.K.; Xue, J. Deep convolutional neural network for mapping smallholder agriculture using high spatial resolution satellite image. Sensors 2019, 19, 2398. [Google Scholar] [CrossRef] [PubMed]
- Chen, H.; Qiu, Y.; Yin, D.; Chen, J.; Chen, X.; Liu, S.; Liu, L. Stacked spectral feature space patch: An advanced spectral representation for precise crop classification based on convolutional neural network. Crop J. 2022, 10, 1460–1469. [Google Scholar] [CrossRef]
- Meng, S.; Wang, X.; Hu, X.; Luo, C.; Zhong, Y. Deep learning-based crop mapping in the cloudy season using one-shot hyperspectral satellite imagery. Comput. Electron. Agric. 2021, 186, 106188. [Google Scholar] [CrossRef]
- Marshall, M.; Belgiu, M.; Boschetti, M.; Pepe, M.; Stein, A.; Nelson, A. Field-level crop yield estimation with PRISMA and Sentinel-2. ISPRS J. Photogramm. Remote Sens. 2022, 187, 191–210. [Google Scholar] [CrossRef]
- Liu, N.; Zhang, W.; Liu, F.; Zhang, M.; Du, C.; Sun, C.; Cao, J.; Ji, S.; Sun, H. Development of a Crop Spectral Reflectance Sensor. Agronomy 2022, 12, 2139. [Google Scholar] [CrossRef]
- El-Hendawy, S.E.; Alotaibi, M.; Al-Suhaibani, N.; Al-Gaadi, K.; Hassan, W.; Dewir, Y.H.; Emam MA, E.G.; Elsayed, S.; Schmidhalter, U. Comparative Performance of Spectral Reflectance Indices and Multivariate Modelling for Assessing Agronomic Parameters in Advanced Spring Wheat Lines Under Two Contrasting Irrigation Regimes. Front. Plant Sci. 2019, 10, 1537. [Google Scholar] [CrossRef]
- Gasmi, A.; Gomez, C.; Chehbouni, A.; Dhiba, D.; El Gharous, M. Using PRISMA Hyperspectral Satellite Imagery and GIS Approaches for Soil Fertility Mapping (FertiMap) in Northern Morocco. Remote Sens. 2022, 14, 4080. [Google Scholar] [CrossRef]
| Disclaimer/Publisher’s Note: The statements, opinions and data contained in all publications are solely those of the individual author(s) and contributor(s) and not of MDPI and/or the editor(s). MDPI and/or the editor(s) disclaim responsibility for any injury to people or property resulting from any ideas, methods, instructions or products referred to in the content. |
© 2024 by the authors. Licensee MDPI, Basel, Switzerland. This article is an open access article distributed under the terms and conditions of the Creative Commons Attribution (CC BY) license (https://creativecommons.org/licenses/by/4.0/).


