1. Introduction
Over the years, microscopy has undergone a remarkable evolution, driven by the current needs and technological advances in this field. In current practice, researchers follow set steps for measuring samples in laboratories. Initially, they collect the fractions of a sample to be analyzed. The samples are then prepared according to protocols to ensure that they are in the necessary conditions for a detailed analysis. The next step is to fix the prepared samples to a plate, to be observed under a microscope in the laboratory. With the help of the microscope, researchers can extract the data and information relevant to their research. However, continuous monitoring is impossible with this procedure.
Recently, we developed a chip-sized microscope, which is based on microelectronic technology, with high optical resolution and a wide field of view [
1,
2,
3,
4]. Due to its miniaturized components, this device is compact and low-cost compared to other microscopy technologies on the market, making it suitable for mass production. Moreover, this microscope has a unique feature compared to others, as it can be placed directly on the sample to be examined, allowing for continuous and parallel analyses. This capability transforms the conventional paradigm of “collecting fractions of samples to be observed in a laboratory with a microscope”, to a new scenario where you can “bring the instrument to the sample in the field and observe it thoroughly”.
In this paper, we present different applications where this microscope can be of interest. Then, we discuss the applicability of the microscope to studying the fermentation process of wine, including a preliminary solution to account for the fermentation status based on artificial intelligence.
2. Background
Microscopes are used extensively to analyze biological and geological specimens. They have several characteristics in common, e.g., microscopes are big instruments and often quite expensive. Moreover, every microscope is operated in a similar way, i.e., the samples are taken from their experimental environment and placed on the sample holder of the microscope for observation. So, we need to interrupt the normal procedure of the experiment in order to make every observation. Such a mode of observation has several problems. The instrument can only be used to observe one sample at a time. However, to assess how an experiment evolves, observations are required at different times. This makes the process of observation unscalable. Additionally, microscopes are managed by humans, and we are prone to errors during the measurement and during the interpretation of the measurements. Also, the samples are often damaged during observation. Moreover, most of the time, sample observation requires a specific sample conditioning. All these issues imply additional costs. Finally, preparing the sample and observing it under the microscope is a time-consuming activity.
3. Purpose of the Research
We propose a compact microscope that can be placed surrounding the sample, grasping it. Then, the images acquired can be sent to the cloud, to be processed by artificial intelligence. Developing machine learning algorithms for every experiment will help in the decision-making process related to that experiment, eliminating possible human errors. Having a microscope in every experiment and for every sample can assist in the advancement of several scientific and commercial fields. We identified some of them, mainly consisting of microfluidic devices and cell counters.
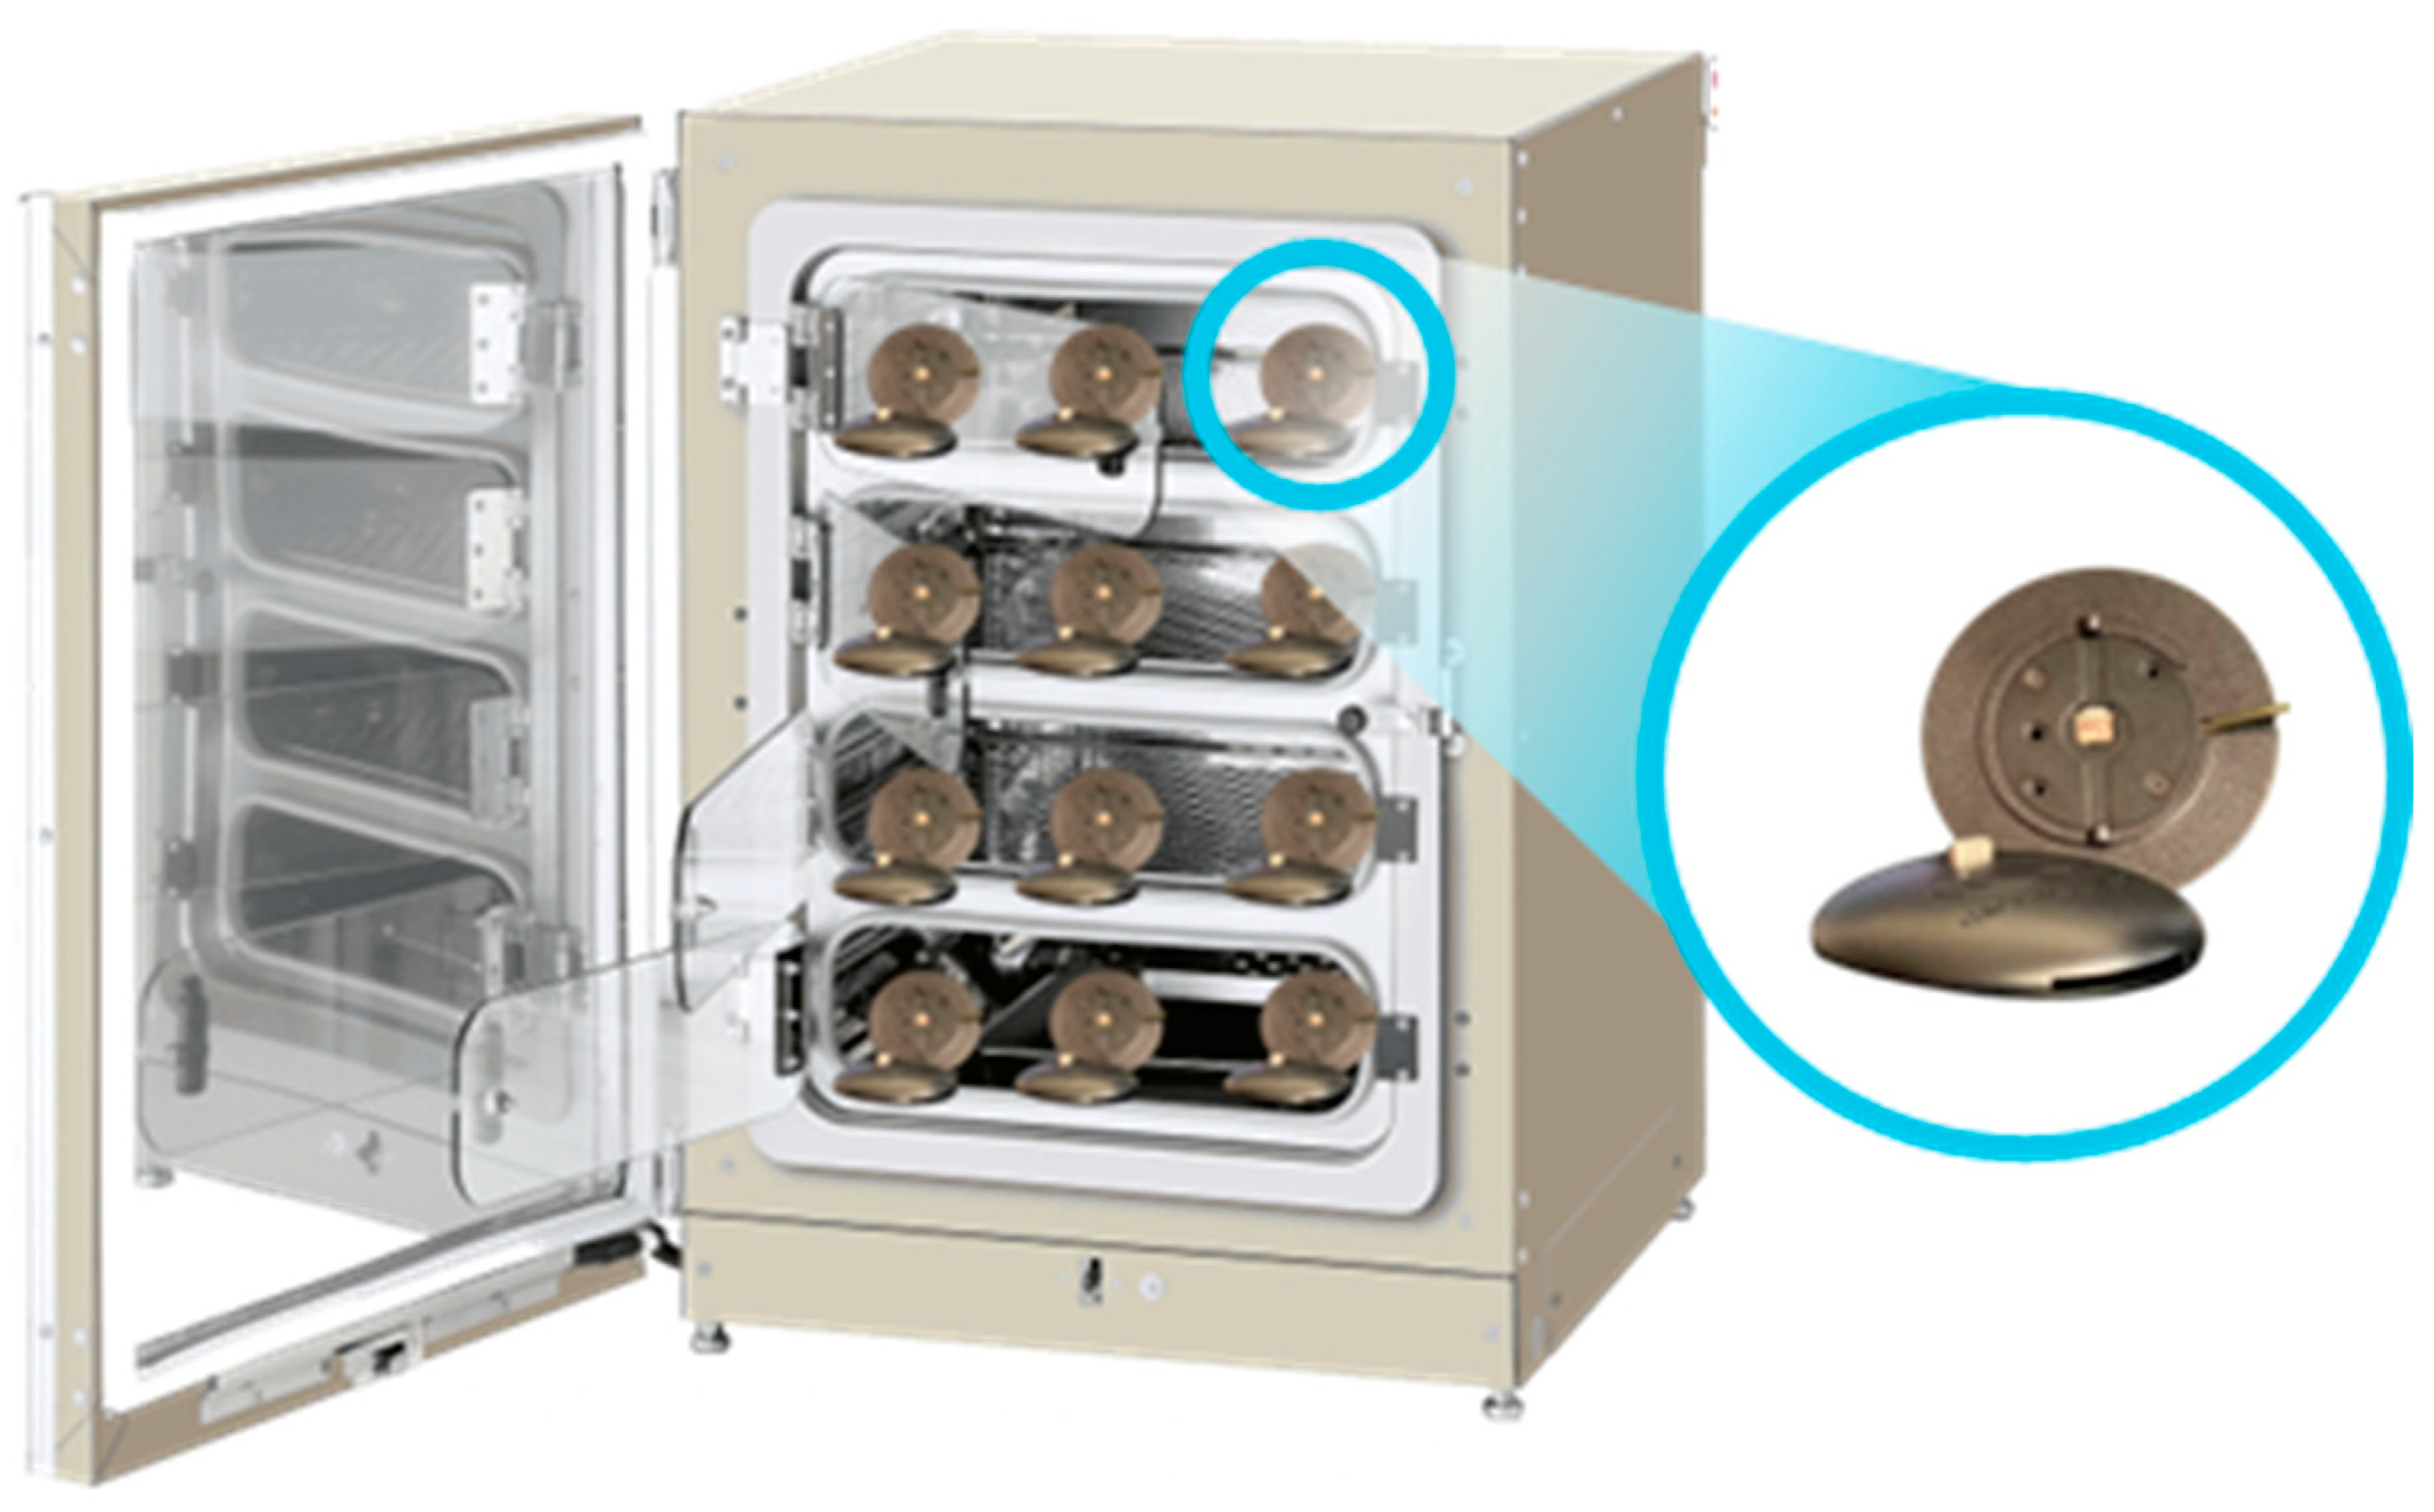
In the first field, we can identify cell and tissue cultures. These cultures are commonly developed after many attempts, which need to be assessed. In traditional microscopy, the sample must be removed from the incubator for imaging, potentially disrupting its environment. However, with the miniature microscope we have developed, samples can remain in the incubator, allowing for continuous monitoring without disturbing the conditions. During the study, the microscope captures images of the sample in its natural environment, eliminating the need to repeatedly take the sample out and place it on a microscope plate. This continuous, non-invasive imaging helps to avoid potential damage to the specimen, although reagents such as culture media may still be needed to maintain its viability. The advantages of using our miniature microscope include the ability to observe the sample in situ within the incubator (
Figure 1), continuous monitoring through of the experiment, parallelizing measurements by applying a microscope to each sample, and collecting large amounts of real-time data during the process, among other benefits.
In the second group, we can identify many applications in the heath sector and food and beverage industry, such as the continuous monitoring of wine making that can be carried out at different stages of production (
Figure 2). The art of winemaking is fully based on the fermentation process, which involves yeast converting sugars into alcohol [
5,
6]. A good yeast must be selected first, free of any contaminant. Then, the fermentation needs to be controlled until the sugar is completely transformed into alcohol, and this can be observed by measuring the increase in the number of yeast cells. The usual procedure for cellars involves periodically taking samples of wine and sending them to a specific center that uses microscopy to analyze the density of yeast cells in the samples. The rate at which the number of cells increases is related to the quality of the final wine. For example, a slow fermentation can be the result of the presence of a toxin [
7]. The purpose of the next section is to explain our experience with our compact microscope when analyzing the number of yeast cells in the process, compared with standard microscopy techniques. In the future, the microscope can be used after grape harvest and pressing (
Figure 2a), integrated into the tank (
Figure 2b) or the bottle (
Figure 2c).
4. Results—Case Study Determination of Cells in Partially Fermented Samples of Wine
The example presented next refers to a white wine that was produced with the yeast of Saccharomyces Cerevisiae from a strain in Catalonia, Spain (S. cerevisiae P29, Catalan Institute of Vine and Wine—INCAVI, Vilafranca del Penedes, Catalonia, Spain). We have compared images obtained with a conventional microscope with the images captured with our prototype. The prototype is presented in
Figure 3. It consists of a LED microdisplay (Jade Bird Display, Shanghai, China, JBD 0.13” display, 2 μm pixel size, 4 μm pixel pitch, 640 × 480 LEDs) in the bottom, a CMOS camera (TIS-DMM 37UX178-ML, Iberoptics Sistemas Ópticos, Madrid, Spain, with 2.4 μm pixel size, 8.92 mm diagonal, 3096 × 2080 pixels) on the top and the sample in between both components. The microscope is operated by switching on one LED and acquiring a hologram with the CMOS sensor. To increase the field of view, several LEDs are switched on sequentially, and then the corresponding holograms are stitched by using the well-known SIFT algorithm. Images are obtained after stitching by applying the light backpropagation and twin-image-removal algorithms.
The liquid sample is inserted through the inlet of a microslide (μ-Slide 0.2 Luer Glass Bottom from Ibidi, Inycom, Zaragoza, Spain), shown in
Figure 3. This microslide has a glass at the bottom with a thickness of ~170 μm. It is important, as with our microscope, that the maximum resolution (2 μm) is obtained with the minimum distance of the sample to the sourcing LED light [
4], and this is achieved thanks to the state-of-the-art microdisplay used, with micrometer sized LEDs. The microfluidic channel is 250 μm thick. A wide field of ~5 mm
2 is obtained by stitching images gathered by the separate LEDs from the microdisplay.
In
Figure 4, the comparison of images acquired with a conventional confocal microscope (
Figure 4a) and our microscope (
Figure 4b) is presented. As can be observed, we obtain a hologram corresponding to the specimen inserted in the microscope, as we did not include any lens. Such a hologram is a superposition of stitched images from 25 different LEDs. After applying a light backpropagation algorithm and twin image removal to this hologram, the image of
Figure 4c, corresponding to the plane of the image, is obtained. In this image, we can measure the density of cells by applying an automated method. For example, by applying Hough Transform, the complete process, up to counting the cells, including the described procedure, is roughly 4 min. Comparing with conventional microscopy, the detection range is very similar to conventional microscopes, from 0.5 to 5 million cells per mL.
In our future research, we want to dynamically quantify yeast cell density by measuring cells flowing in a microfluidic channel attached to the wine tank. With this, we expect to improve the detection limit for this experiment. However, to pursue direct real-time observation, it is necessary to decrease the acquisition and processing time of the images captured by the microscope. Another approach to measure the density of cells, without having to use the computationally expensive backpropagation of the holograms, is to use specialized neural networks and clusterization. For that purpose, we extract relevant data directly form the holograms.
Figure 5a presents a hologram captured with our microscope. The clusters reconstructed with a neural network are presented in
Figure 5b.
Figure 5c presents the projected boxes over the backpropagated image. In the resulting image, we can identify 48 clusters in just 400 ms instead of the four minutes required by the stitching, hologram backpropagation, twin image removal and automatic identification by Hought Transform. The network used was a deep neural network based on mobilenet [
8]. We required a simple neural network to be able to translate it to hardware in the near future. In order to train the network, we generated more than 14,000 synthetic images. These images were obtained considering cells in the channel that were propagated to the plane at which we have the camera to get the holograms.
5. Conclusions
The application of a compact microscope composed only of a GaN-LED microdisplay, a CMOS camera and a package was demonstrated by studying different fermentation stages of a white wine sample with a Saccharomyces Cerevisiae yeast. Images with a large FOV (~500 × 400 μm2) were obtained by stitching and postprocessing holograms, with a high-enough resolution to observe the yeast cells (diameter ~5–10 μm) in samples with a population from 0.5 to 5 million yeast cells per mL. As a method for faster postprocessing, a mobilenet-based deep neural network was used to extract the same information directly from the holograms, achieving a speed improvement from 4 min to 0.4 s. In the near future, and for this application, we plan to implement the neural network in hardware and perform measurements directly in the microchannel to increase the lower detection limit beyond conventional methods.
6. Patents
Optical detection device, its method for operating and computer program, WO2017005792A1 PCT 2017, Europe: EP3320567B1 Active, USA: US10201054B2 Active, Priority 2015/07/07. University of Barcelona and Technical University of Braunschweig.
Methods and device for obtaining a microscopic digital images, WO2023/280920A2 PCT, Priority 2021/07/06. University of Barcelona.
Author Contributions
Conceptualization, Á.D., J.D.P. and A.V.; Methodology Á.D., S.M., S.M.-M., J.C., I.B.-A., J.D. and A.V.; Software I.B.-A., J.D. and O.C.; Validation S.M., J.C., S.M.-M., I.B.-A. and Á.D.; Supervision Á.D., J.D.P. and A.V.; Draft preparation Á.D., J.D. and A.V.; Writing and revision Á.D. and A.V.; Funding acquisition Á.D., J.D. and A.V. All authors have read and agreed to the published version of the manuscript.
Funding
This work has received funding from Grants PID2019-105714RB-I00, PID2022-136833OB-C21 and PDC2023-145805-I00 funded by MICIU/AEI/10.13039/501100011033 and from the European Regional Development Fund and from the European Union NextGenerationEU/PRTR. This work also received funding from Grant PREP2022-000341 funded by MCIN and by “ESF Investing in your future”. Finally, this work has also received funding from FEADER and Departament d’Acció Climàtica, Alimentació i Agenda Rural (DACC) of the Generalitat de Catalunya with grant 56 30123 2021 2A form the budget AG06D/482000100/5741/0000.
Institutional Review Board Statement
Not applicable.
Informed Consent Statement
Not applicable.
Data Availability Statement
Data are contained within the article.
Conflicts of Interest
The authors declare no conflicts of interest.
References
- Franch, N.; Canals, J.; Moro, V.; Vilá, A.; Romano-Rodríguez, A.; Prades, J.D.; Gülink, J.; Bezshlyakh, D.; Waag, A.; Kluczyk-Korch, K.; et al. Nano Illumination Microscopy: A Technique Based on Scanning with an Array of Individually Addressable NanoLEDs. Opt. Express 2020, 28, 19044. [Google Scholar] [CrossRef] [PubMed]
- Moreno, S.; Canals, J.; Moro, V.; Franch, N.; Vilà, A.; Romano-Rodriguez, A.; Prades, J.D.; Bezshlyakh, D.D.; Waag, A.; Kluczyk-Korch, K.; et al. Pursuing the Diffraction Limit with Nano-LED Scanning Transmission Optical Microscopy. Sensors 2021, 21, 3305. [Google Scholar] [CrossRef]
- Vilà, A.; Moreno, S.; Canals, J.; Diéguez, A. A Compact Raster Lensless Microscope Based on a Microdisplay. Sensors 2021, 21, 5941. [Google Scholar] [CrossRef]
- Vilà, A.; Moreno, S.; Diéguez, A. 24-1: Can Light Microscopes Really Be Chip-Sized? SID Symp. Dig. Tech. Pap. 2022, 53, 271–274. [Google Scholar] [CrossRef]
- Chambers, P.J.; Pretorius, I.S. Fermenting Knowledge: The History of Winemaking, Science and Yeast Research. EMBO Rep. 2010, 11, 914–920. [Google Scholar] [CrossRef] [PubMed]
- Alba-Lois, L.; Segal-Kischinevzky, C. Yeast Fermentation and the Making of Beer and Wine. Nat. Educ. 2010, 3, 17. [Google Scholar]
- Bisson, L.F. Stuck and Sluggish Fermentations. Am. J. Enol. Vitic. 1999, 50, 107–119. [Google Scholar] [CrossRef]
- Howard, A.G.; Zhu, M.; Chen, B.; Kalenichenko, D.; Wang, W.; Weyand, T.; Andreetto, M.; Adam, H. MobileNets: Efficient Convolutional Neural Networks for Mobile Vision Applications. arXiv 2017, arXiv:1704.04861. [Google Scholar]
| Disclaimer/Publisher’s Note: The statements, opinions and data contained in all publications are solely those of the individual author(s) and contributor(s) and not of MDPI and/or the editor(s). MDPI and/or the editor(s) disclaim responsibility for any injury to people or property resulting from any ideas, methods, instructions or products referred to in the content. |
© 2024 by the authors. Licensee MDPI, Basel, Switzerland. This article is an open access article distributed under the terms and conditions of the Creative Commons Attribution (CC BY) license (https://creativecommons.org/licenses/by/4.0/).


 ,
, 