
Co-Optimization of Water–Energy Nexus Systems and Challenges †


Abstract
1. Introduction
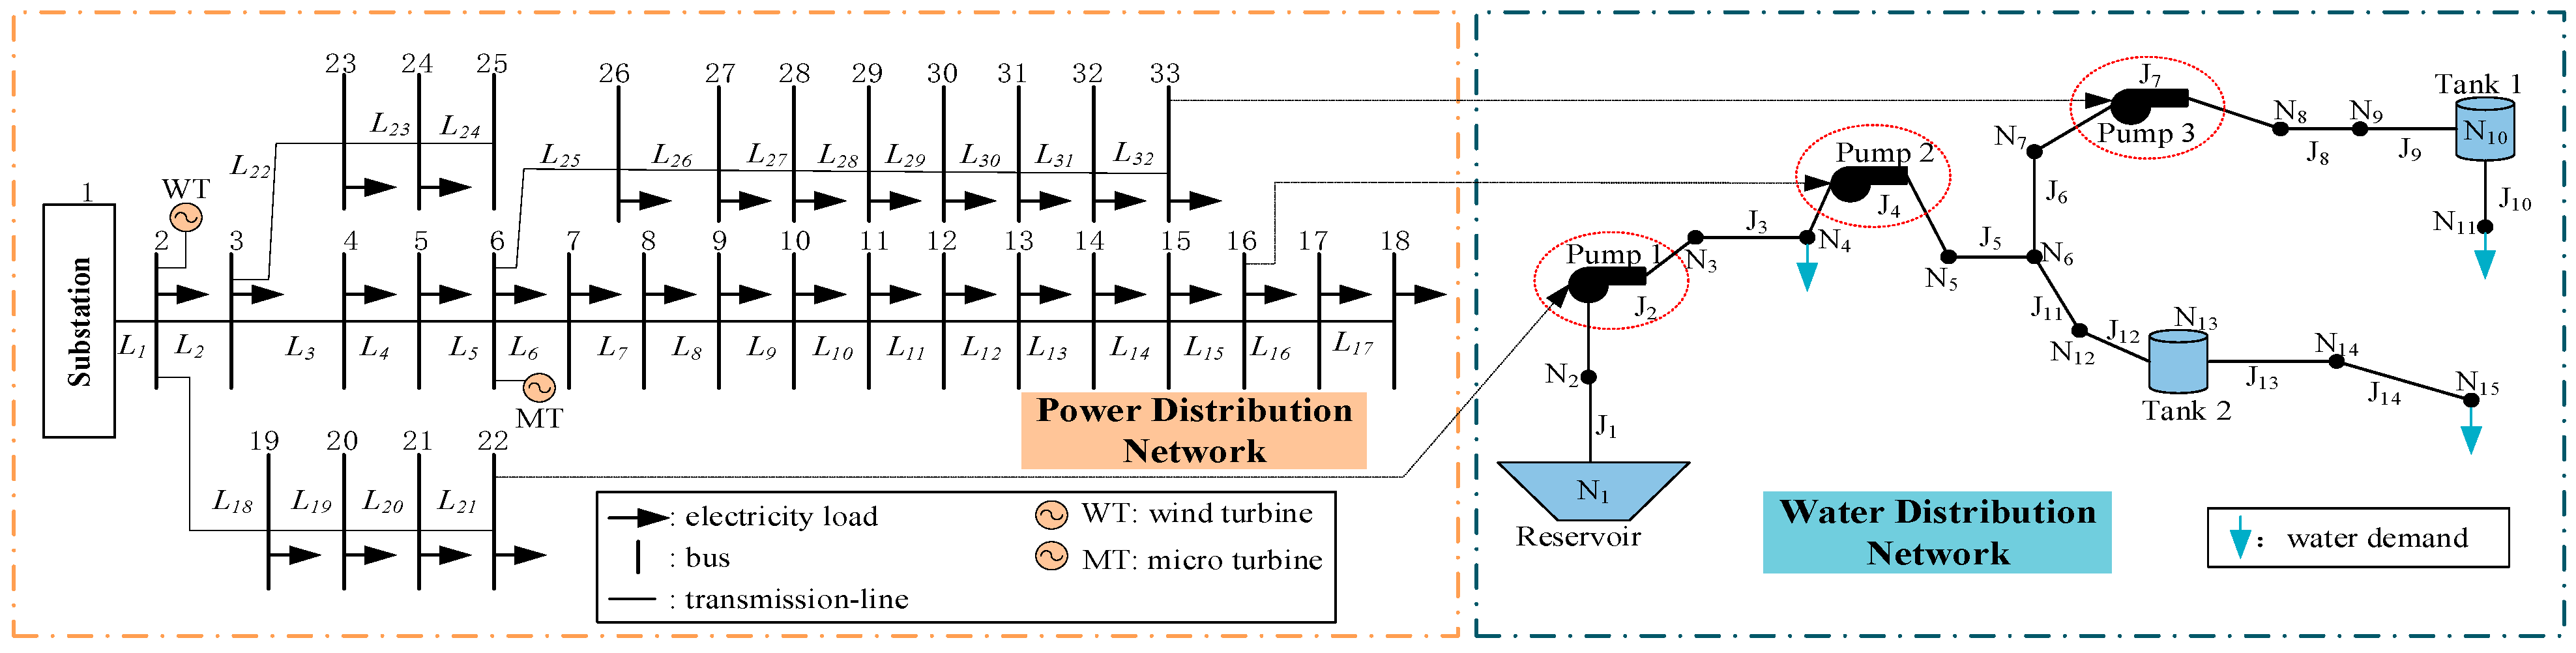
2. WENS Model
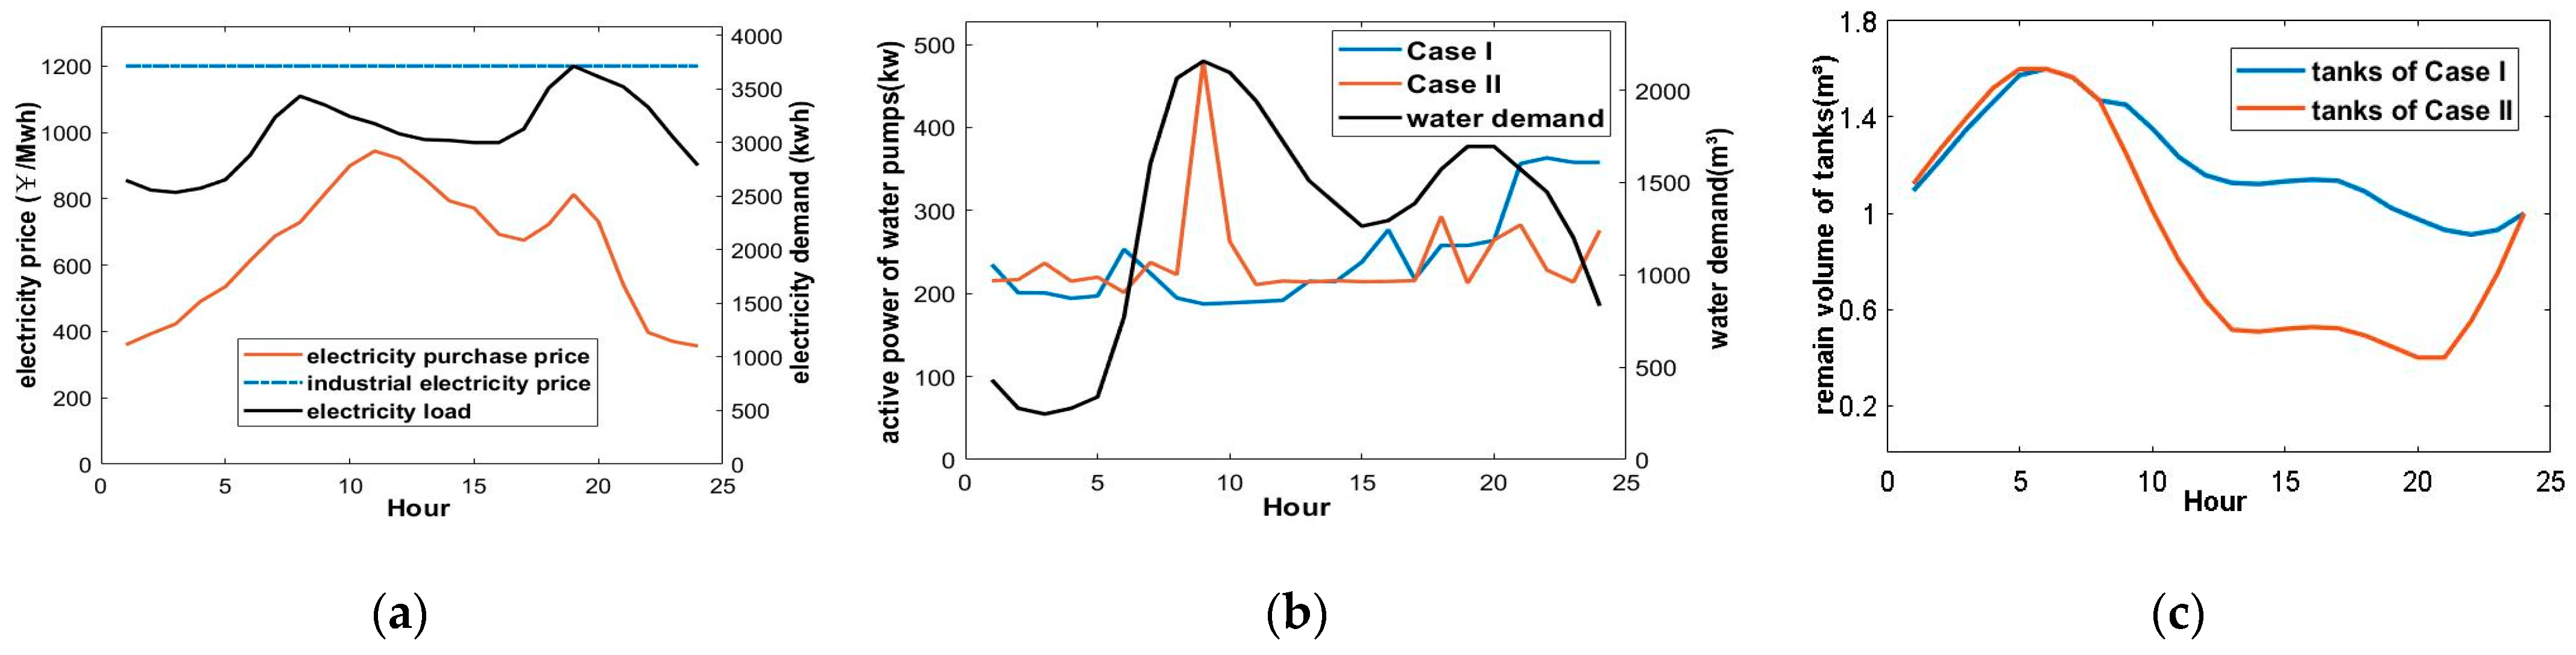
3. Case Study
4. Challenges and Prospects
4.1. System Modeling
4.2. Uncertainty Management and Solution Robustness
4.3. Multi-Stakeholder Management
5. Conclusions
Author Contributions
Funding
Institutional Review Board Statement
Informed Consent Statement
Data Availability Statement
Conflicts of Interest
References
- Birol, F. World Energy Outlook 2016—Analysis. Available online: https://www.iea.org/reports/world-energy-outlook-2016 (accessed on 13 March 2024).
- Grubert, E.; Sanders, K.T. Water Use in the United States Energy System: A National Assessment and Unit Process Inventory of Water Consumption and Withdrawals. Environ. Sci. Technol. 2018, 52, 6695–6703. [Google Scholar] [CrossRef] [PubMed]
- Busby, J.W.; Baker, K.; Bazilian, M.D.; Gilbert, A.Q.; Grubert, E.; Rai, V.; Rhodes, J.D.; Shidore, S.; Smith, C.A.; Webber, M.E. Cascading Risks: Understanding the 2021 Winter Blackout in Texas. Energy Res. Soc. Sci. 2021, 77, 102106. [Google Scholar] [CrossRef]
- Rodriguez-Garcia, L.; Hosseini, M.M.; Mosier, T.M.; Parvania, M. Resilience Analytics for Interdependent Power and Water Distribution Systems. IEEE Trans. Power Syst. 2022, 37, 4244–4257. [Google Scholar] [CrossRef]
- Liou, C.P. Limitations and Proper Use of the Hazen-Williams Equation. J. Hydraul. Eng. 1998, 124, 951–954. [Google Scholar] [CrossRef]
- Baran, M.E.; Wu, F.F. Network Reconfiguration in Distribution Systems for Loss Reduction and Load Balancing. IEEE Trans. Power Deliv. 1989, 4, 1401–1407. [Google Scholar] [CrossRef]

| Item | Case I | Case II | Reduction | Percentage of Reduction |
|---|---|---|---|---|
| Electricity cost of PDN (RMB) | 66,316 | 51,032 | 15,283 | −23.05% |
| Electricity cost of WDN (RMB) | 6934 | 3518.9 | 3415 | −49.25% |
| Sum (RMB) | 73,250 | 54,451 | 18,699 | −25.53% |
Disclaimer/Publisher’s Note: The statements, opinions and data contained in all publications are solely those of the individual author(s) and contributor(s) and not of MDPI and/or the editor(s). MDPI and/or the editor(s) disclaim responsibility for any injury to people or property resulting from any ideas, methods, instructions or products referred to in the content. |
© 2024 by the authors. Licensee MDPI, Basel, Switzerland. This article is an open access article distributed under the terms and conditions of the Creative Commons Attribution (CC BY) license (https://creativecommons.org/licenses/by/4.0/).
Share and Cite
Zeng, J.; Liu, Z. Co-Optimization of Water–Energy Nexus Systems and Challenges. Eng. Proc. 2024, 69, 54. https://doi.org/10.3390/engproc2024069054
Zeng J, Liu Z. Co-Optimization of Water–Energy Nexus Systems and Challenges. Engineering Proceedings. 2024; 69(1):54. https://doi.org/10.3390/engproc2024069054
Chicago/Turabian StyleZeng, Jiawei, and Zhaoxi Liu. 2024. "Co-Optimization of Water–Energy Nexus Systems and Challenges" Engineering Proceedings 69, no. 1: 54. https://doi.org/10.3390/engproc2024069054
APA StyleZeng, J., & Liu, Z. (2024). Co-Optimization of Water–Energy Nexus Systems and Challenges. Engineering Proceedings, 69(1), 54. https://doi.org/10.3390/engproc2024069054