Abstract
A water treatment works in the UK endured elevated inlet turbidity and iron concentrations following increased demands in the raw water supply main, reducing its capacity by blocking filters that required costly extra cleaning. Adding flow and turbidity monitoring allowed novel raw water main variable condition discolouration model (VCDM) simulations to track the accumulation and mobilisation behaviour, showing the full 18.7 km contributing material and risk returning in only 2 months, helping explain the multiple annual events. The utility is now applying operational efficient flow conditioning, developed here using the VCDM, to manage risks and capacity.
1. Introduction and Background
The long-term behaviour of discolouration material in the drinking water distribution system (DWDS) trunk mains has been shown to be driven by pipe wall cohesive material layer processes through the verification of the variable condition discolouration model (VCDM) [,,]. An understanding of the accumulation and mobilisation processes has allowed companies to deploy effective risk mitigation strategies and has importantly shown flow conditioning to be a viable technique to both manage discolouration risk and improve network hydraulic resilience []. Flow conditioning uses network hydraulics, where infrastructure permits, to incrementally increase systems’ shear stress at regular intervals, mobilising wall-bound cohesive material in a controlled manner to mitigate and manage the long-term risk. As this approach can be achieved during normal operation, and with no discharge of water, it eliminates the need for costly and disruptive maintenance. With the accumulation of pipe wall material shown to be a continuous process [], ongoing maintenance is required and flow conditioning can provide a sustainable approach that is also suitable for automated control. As the effects of discolouration are observed by consumers worldwide, research applying the VCDM to track material behaviour has focussed on treated water pipes. Raw water mains are also a critical component of DWDS, but with typically much higher material concentrations and no disinfection, so it is generally considered more biologically active []. They do, however, have comparable hydraulic operating conditions to trunk mains (in particular, mains supplying service reservoirs that are not subject to demand patterns) and can also see periodic elevations in flow, for example, responding to changes in consumer demand during periods of hot weather. Such increases in flow have the potential to mobilise cohesive material and result in discolouration. Although this potential discolouration behaviour in raw water mains may not be observed by consumers, the increased material concentrations in the bulk flow can impact a water treatment works’s (WTW) efficacy, including insufficient coagulation or disinfectant, and the increased need for filter maintenance as they become overloaded. As a result, the treatment capacity may be reduced, and this is at a time when demand is highest, putting strain on other parts of the DWDS to cover supply shortfalls.
With multiple rapid filter blockage issues reported at a UK WTW during hot weather periods, and concerns this would increase with climate change, this work aimed to investigate if the VCDM could be applied, for the first time, to a raw water main. If applicable, calibration could then help identify the pipe sections contributing to the issues and indicate the risk return period. With evidence of material layer processes, operational strategies, such as flow conditioning, could then be proposed to increase resilience and justify maintenance intervals to protect the WTW and safeguard capacity.
2. Materials and Methods
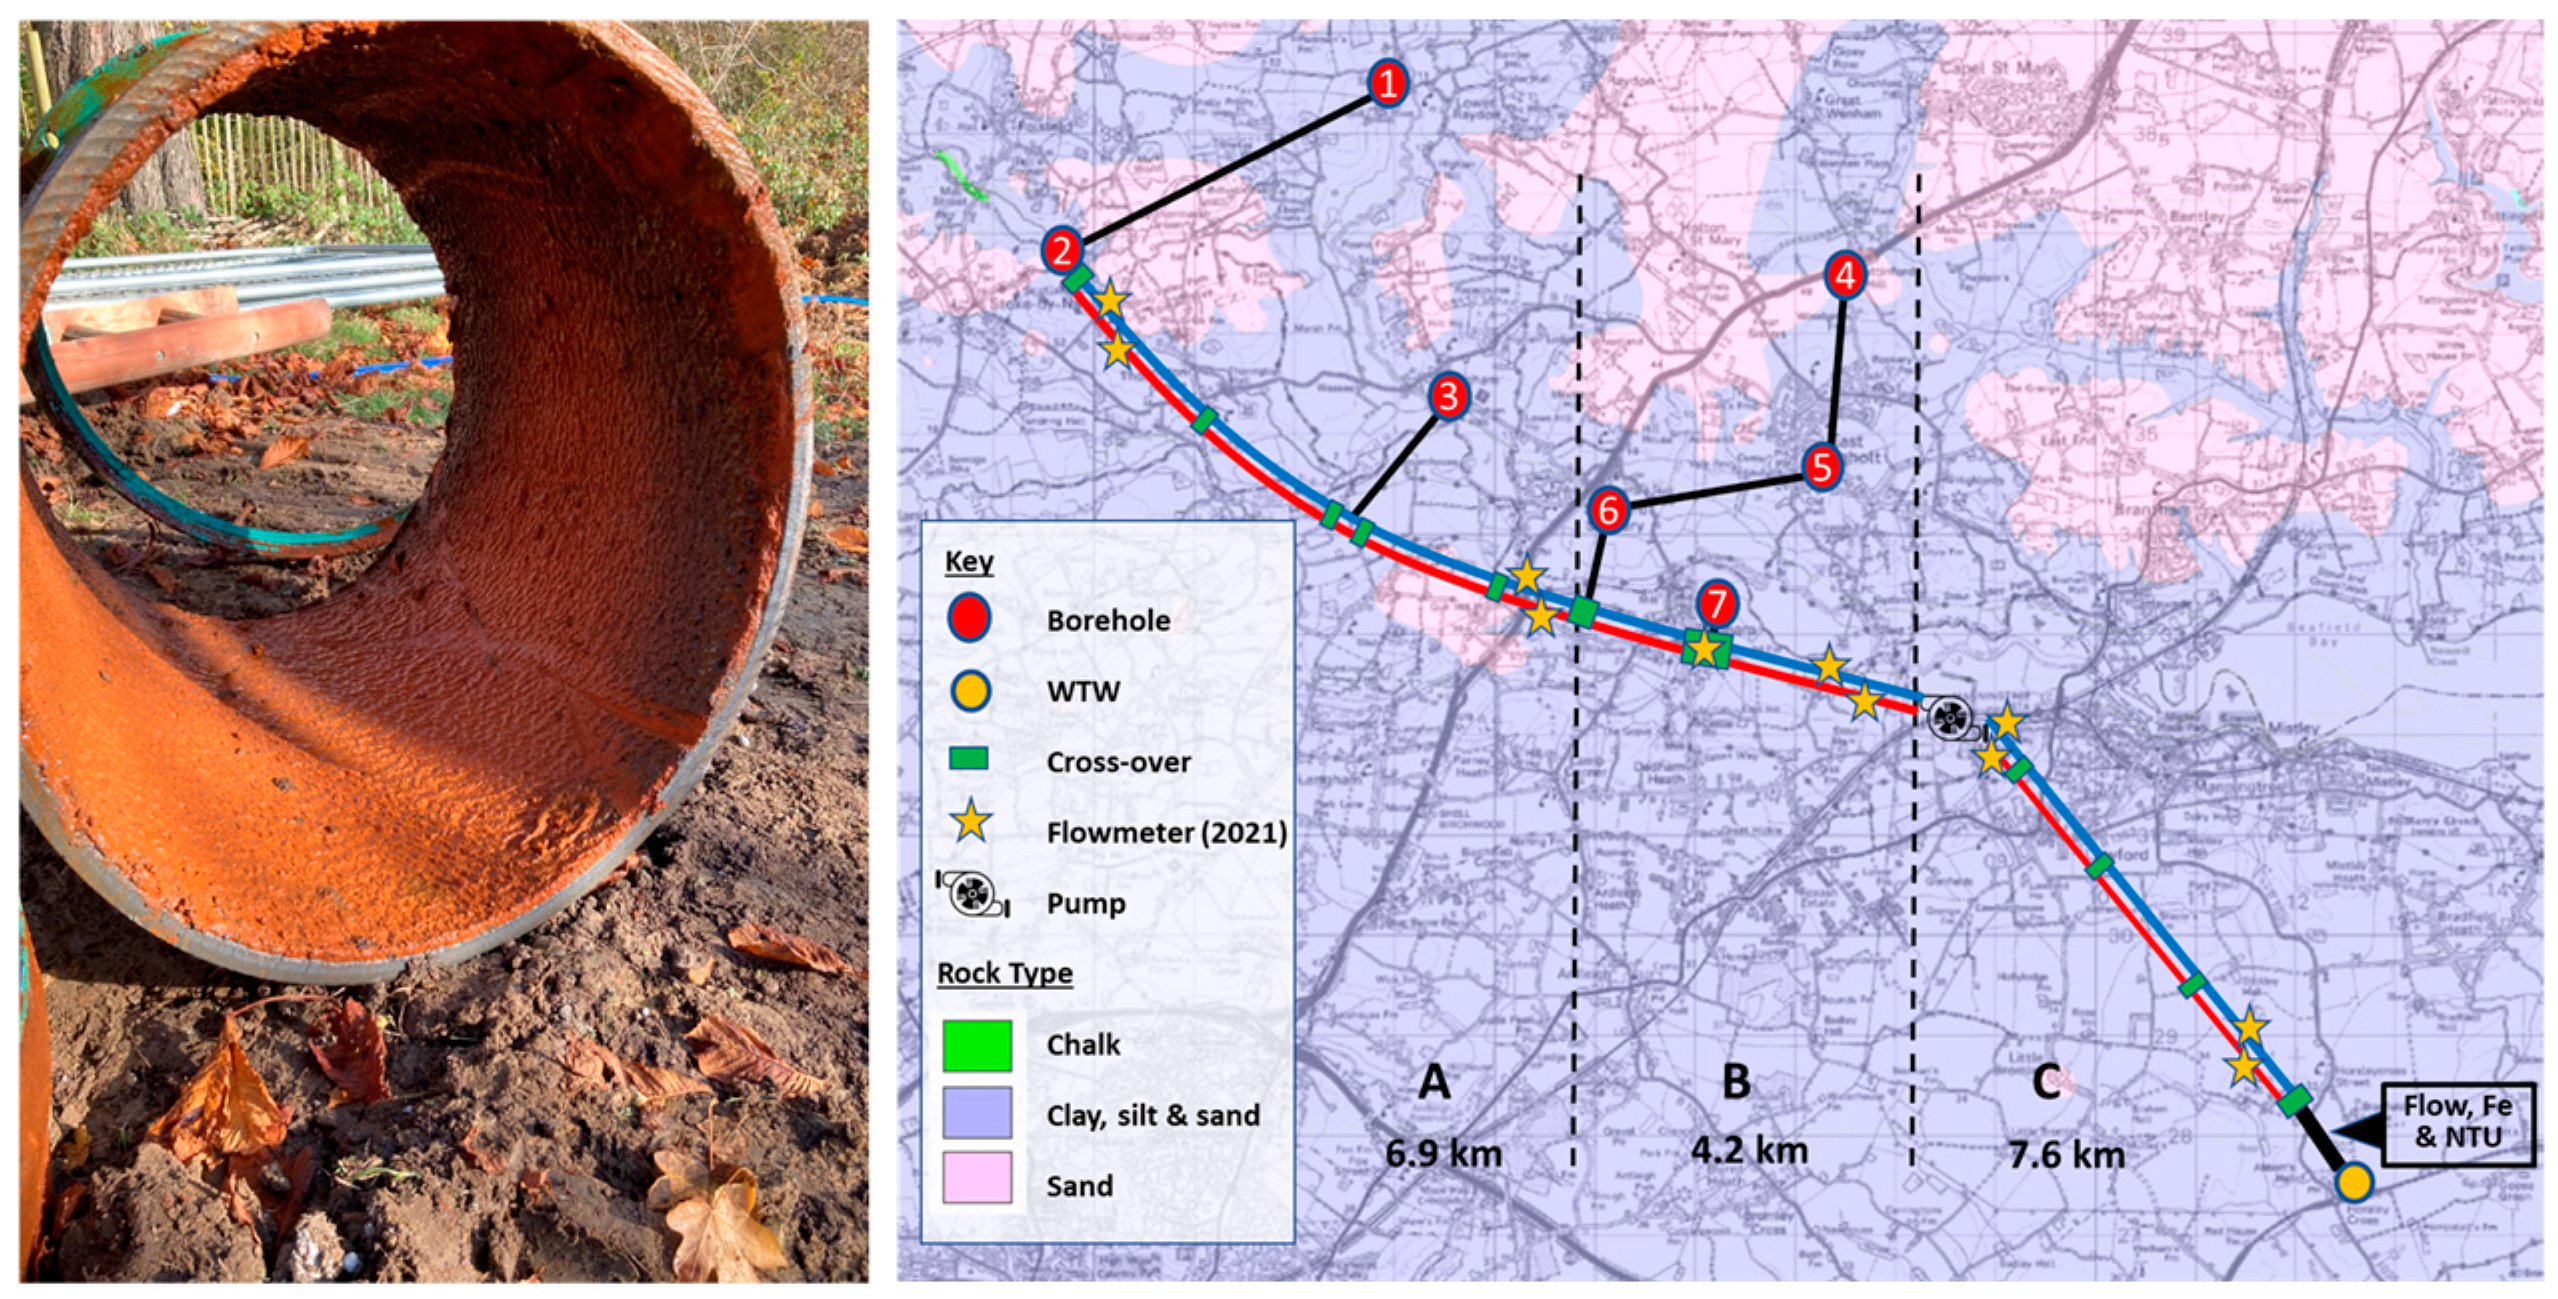
2.1. Study Site
A WTW in the UK endured multiple annual events during hot weather periods when demands increased, causing the fouling of their 6 rapid gravity filters. This required intensive additional cleaning, with the outcome being that the works’ capacity was reduced. This also placed additional strain on the DWDS and even required occasional tanker support to cover the resulting shortfall. The WTW is fed by 7 boreholes, a number with known high iron concentrations, and supplied via twin 500 mm diameter mains, shown schematically in Figure 1. The upstream 6.9 km—comprising asbestos cement mains, the middle 4.2 km concrete and spun iron mains, and the downstream 7.6 km after a pumping station—mixed ductile, spun, and cast-iron mains. Prior to this work, there were multiple open crossovers along the length and a single flow meter at the WTW’s inlet. To address these annual events, the company traditionally ran a flushing operation in April, typically a fully staffed 48-h task with more than 12 filter washes per day, increasing discharge and reducing the works’ throughput. Timings were based on turning over the water in the downstream 7.6 km because iron mains were considered to be the primary source of material, and this was supported during operations when a pipe section was removed for investigation (Figure 1). Although this reactive intervention did not prevent the summer events, it was considered beneficial in reducing the severity. As a further precaution, the company imposed a 31 MLD flow restriction, which was significantly less than the desired 33.8 MLD resilience target.
Figure 1.
Schematic of twin raw water 500 mm mains linking boreholes with WTW, and a section of main removed for investigation.
To investigate the causes and determine if flow conditioning could be applied to support operations in this raw water main, the crossovers were closed, and additional flow monitoring was added in 2021. At the same time, turbidity and iron monitors were installed at the WTW inlet.
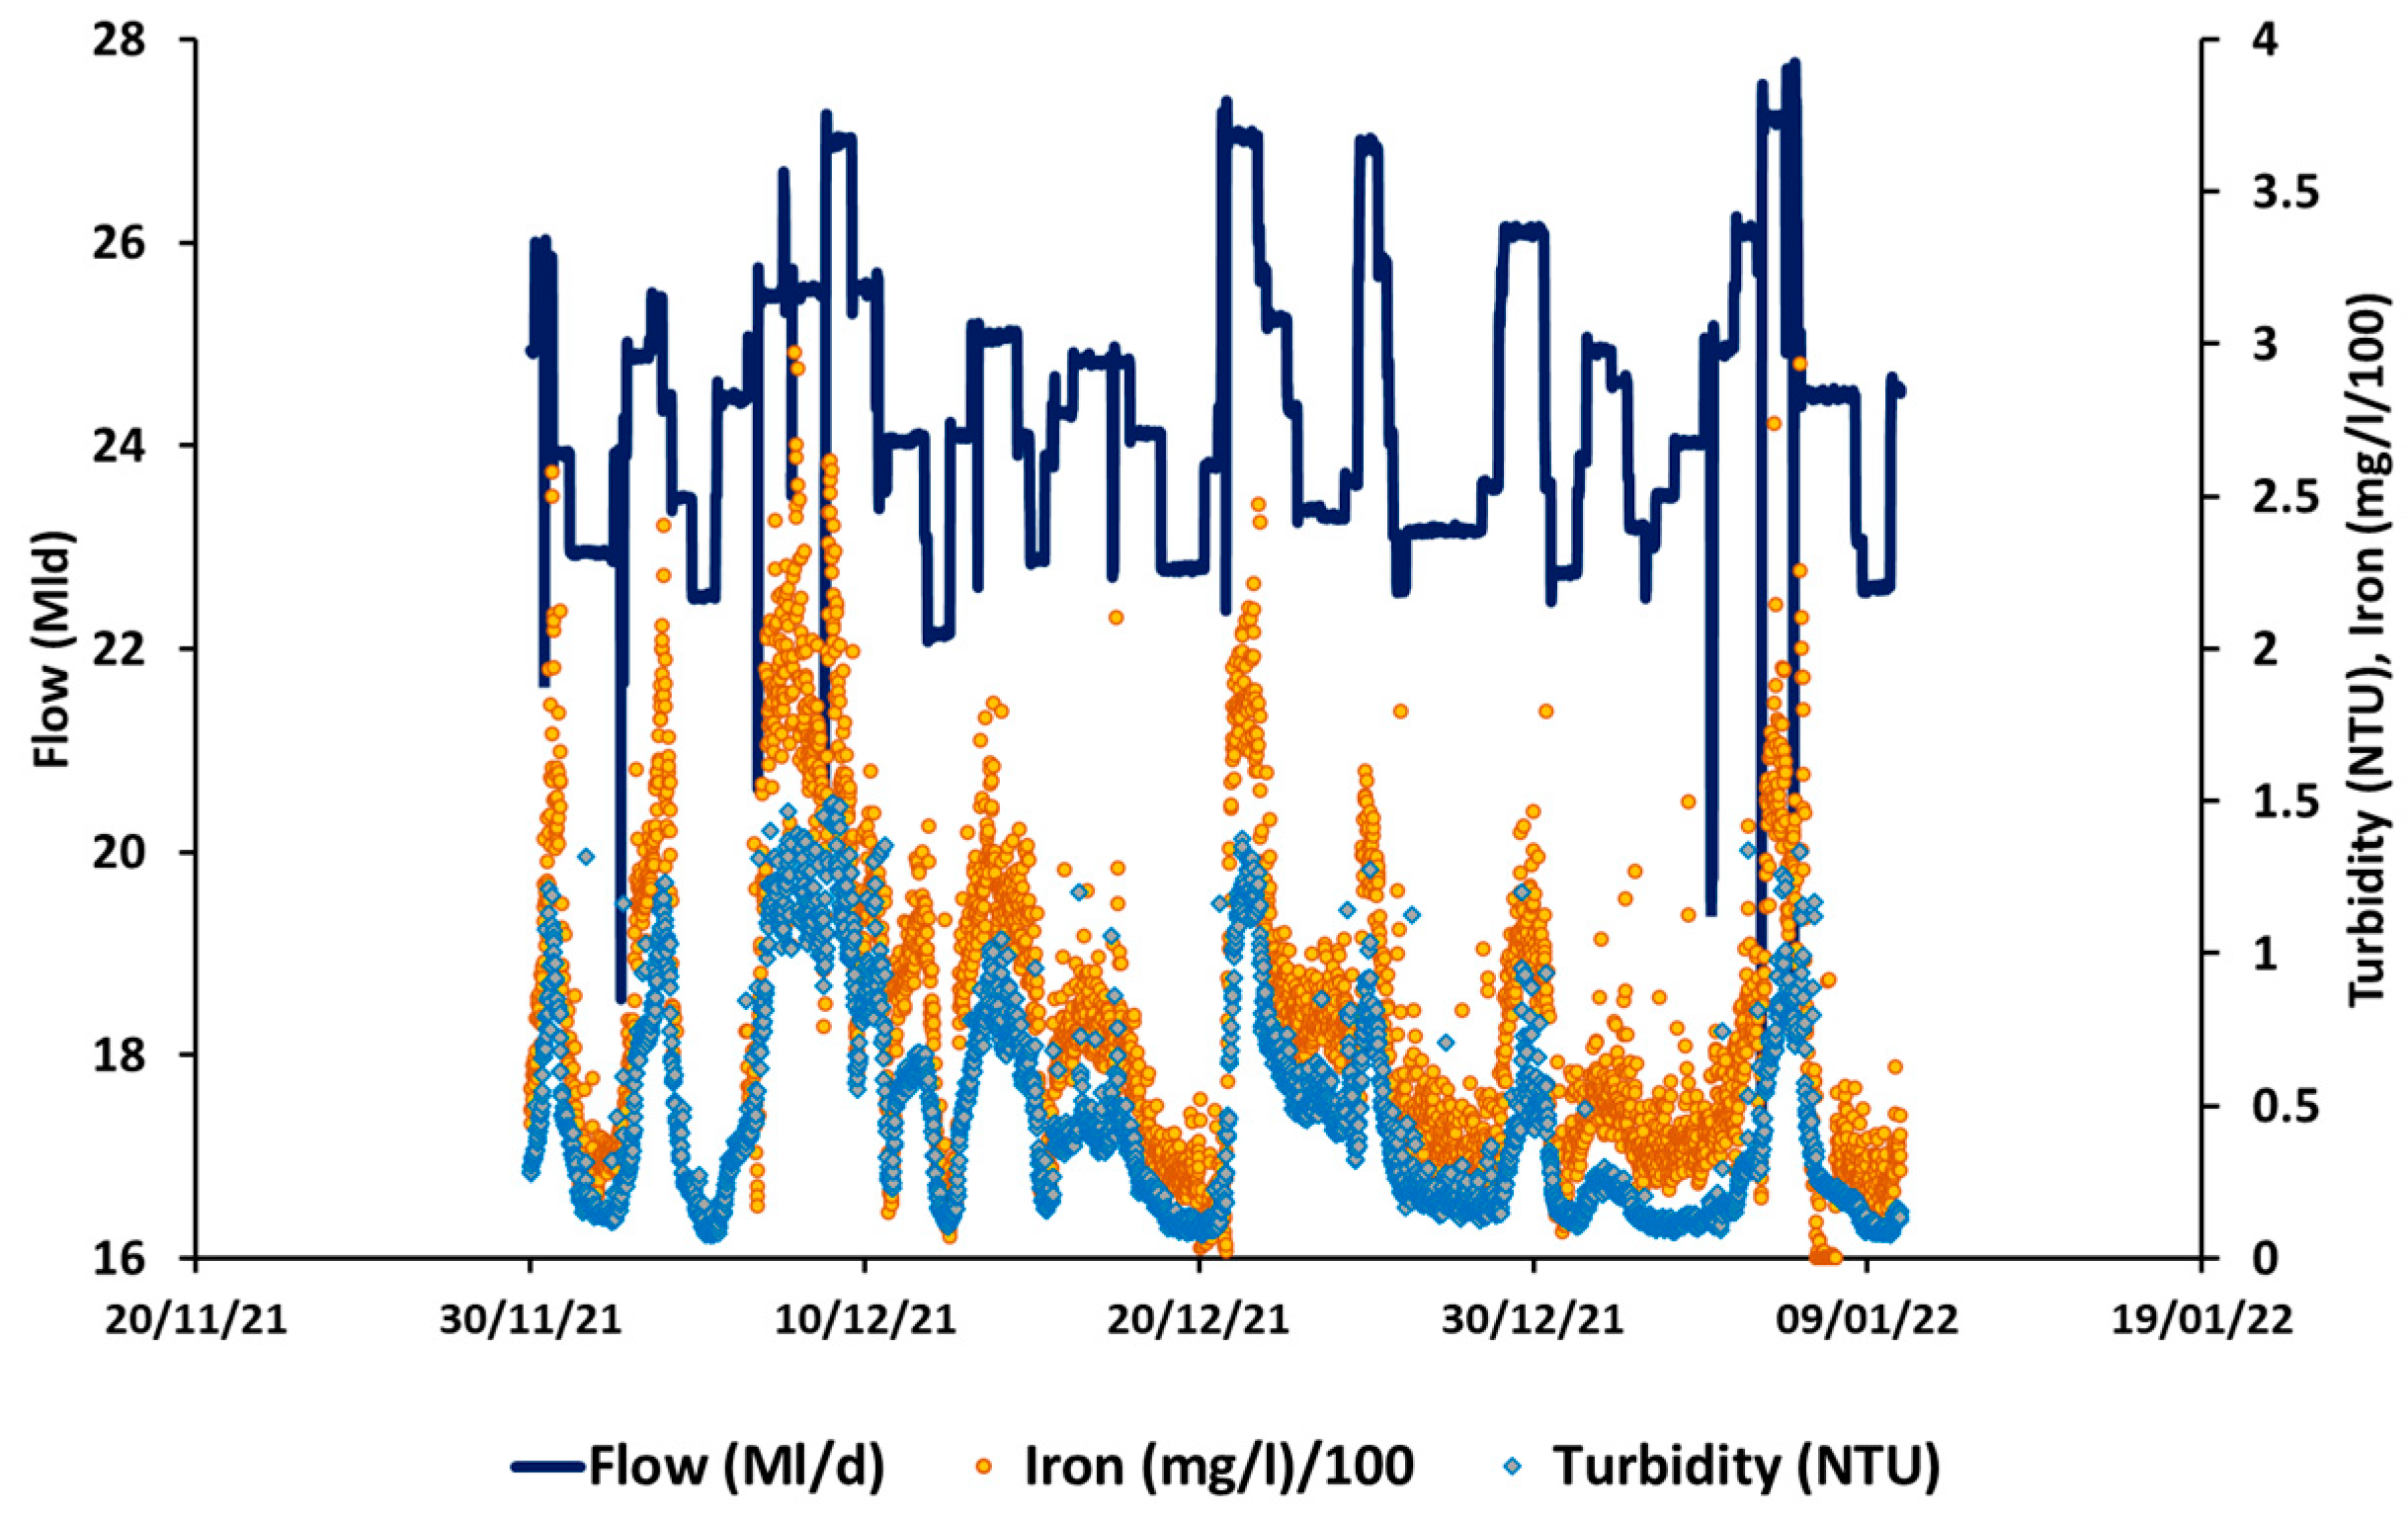
2.2. Flow, Turbidity, and Iron
With monitoring installed, the turbidity and iron responses to changes in flow could be examined, and trials were conducted to examine this behaviour with the results shown in Figure 2. A correlation between turbidity and iron can be observed and these are significantly elevated following each flow increase. With every flow increase eliciting a similarly shaped response, this indicates the material was not accumulating as sediments (where a single step would be expected to clear the main and also reflect low points in the main). In addition, the response magnitude appears to relate to the flow step increase, and where similar consecutive steps occur, a decrease in mobilised material can be observed. These are all the traits of cohesive material layer behaviour, suggesting the VCDM could simulate this behaviour.
Figure 2.
Raw water main turbidity and iron responses at WTW inlet during planned flow trials (PODDS model targeting < 2 NTU); winter 2021/2022.
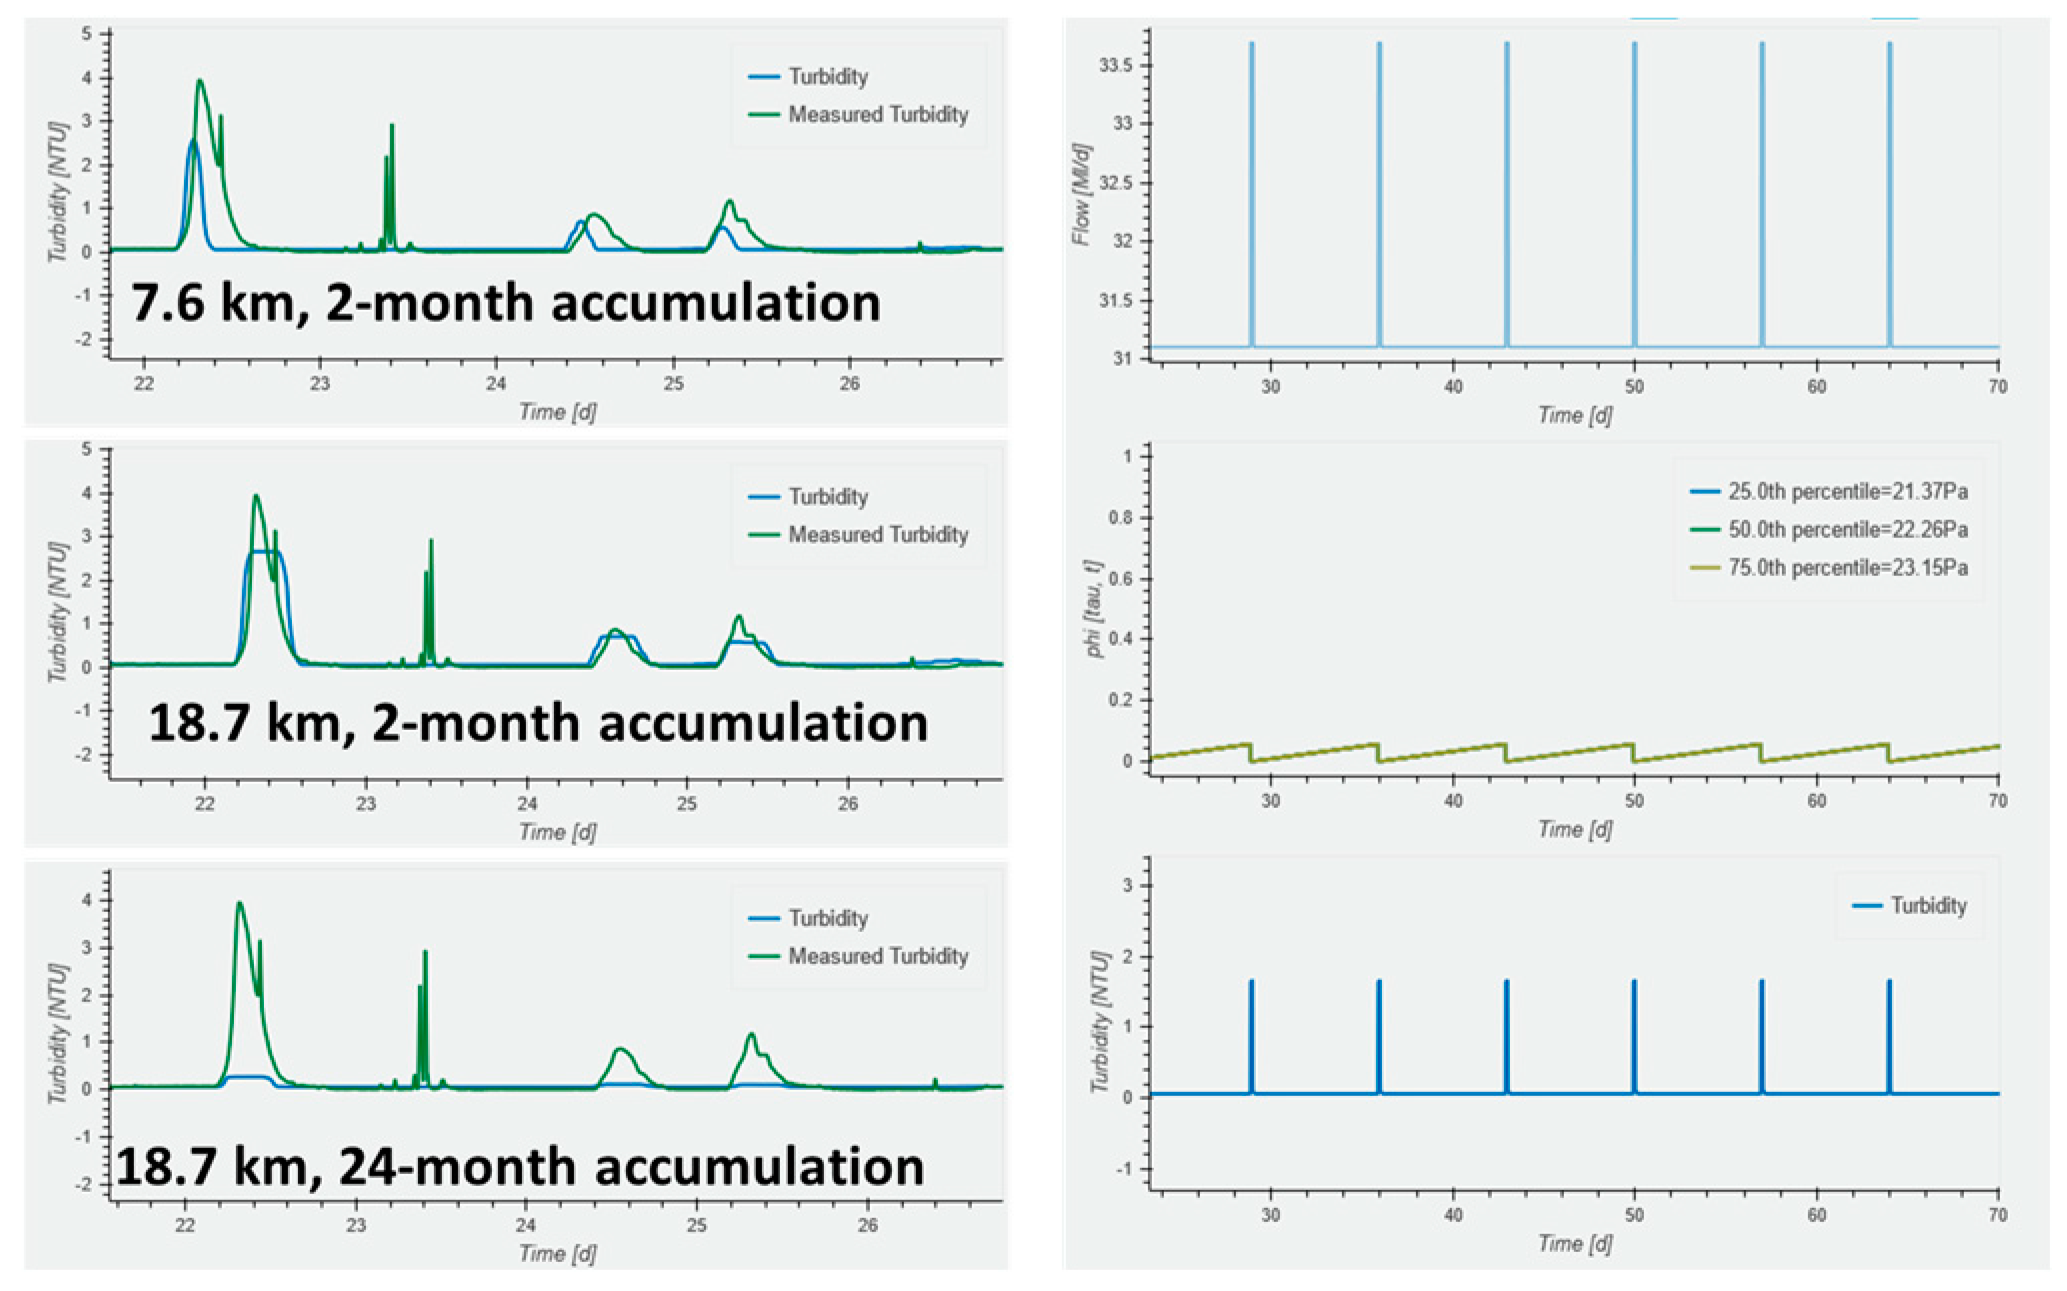
3. VCDM Calibration and Discussion
The VCDM (accessible at www.PODDS.co.uk, accessed on 10 April 2024) describes the discolouration behaviour by calculating a shear stress range from input flow data and splitting this into multiple cohesive layers. Cohesion denotes a shear strength by holding material to the pipe walls, and the model uses empirical parameters to balance this against the hydraulically imposed shear stress, a function of headloss and the pipe diameter. To track the long-term behaviour, the model simultaneously tracks the variable condition of each layer between 0 and 100%, either mobilising material if the shear stress is greater than the layer strength or accumulating material otherwise. In addition to pipe properties (length, diameter, and roughness), a mobilisation and accumulation rate are required, the latter to aid in the practical understanding that is reported as an accumulation period, which is the time for layers to go from no material to the maximum risk. Examples of the model outputs, used to investigate the length of the contributing raw water main and the accumulation period, are shown in Figure 3. The calibration results indicate the full pipe length of 18.7 km, contributing to the risk, not just the downstream 7.6 km, and the full risk returning within just 2 months. The mobilisation rate was consistent with that of DWDS mains.
Figure 3.
VCDM model turbidity outputs against measured turbidity to investigate the pipe length and accumulation period. The right-side plot shows a weekly flow conditioning strategy to sustain a 33.8 MLD resilience with < 2 NTU responses (top plot flow profile, middle plot example layer conditions, and bottom plot turbidity response; VCDM model from www.PODDS.co.uk, accessed on 10 April 2024).
With the model calibrated, future scenarios can be investigated, such as weekly flow conditioning, to sustain a 33.8 MLD resilience without exceeding a 2 NTU limit, as seen in Figure 3.
4. Conclusions
The accumulation and mobilisation behaviour in raw water mains are simulated by the VCDM, highlighting cohesive layer behaviour as the dominant material process in this system. With a calibrated model, flow conditioning strategies were developed, and the company has been able to implement these to remove flow restrictions and successfully sustain a 33.8 MLD capacity and achieve peak flows of 36 MLD without the need for flushing operations.
Author Contributions
Conceptualization, S.H. and J.B.; methodology, S.H.; data curation, S.H. and N.W.-M.; writing—original draft preparation, S.H.; writing—review and editing, S.H., N.W.-M. and J.B.; project administration, S.H.; funding acquisition, S.H. and J.B.; All authors have read and agreed to the published version of the manuscript.
Funding
This research was funded by Affinity Water.
Institutional Review Board Statement
Not applicable.
Informed Consent Statement
Not applicable.
Data Availability Statement
Data belongs to a water utility and cannot be shared publicly.
Acknowledgments
The authors are grateful for the support and data provided by Affinity Water Services that made this research possible. For the purpose of open access, the authors have applied a creative commons attribution (CC BY) license to any author-accepted manuscript versions arising.
Conflicts of Interest
The authors declare that the research was conducted in the absence of any commercial or financial relationships that could be construed as potential conflicts of interest.
References
- Boxall, J.; Blokker, E.J.M.; Schaap, P.G.; Speight, V.; Husband, S. Managing discolouration in drinking water distribution systems by integrating understanding of material behaviour. Water Res. 2023, 243, 120416. [Google Scholar] [CrossRef]
- Sunny, I.; Husband, S.; Boxall, J. Simulating long term discolouration behaviour in large diameter trunk mains. Environ. Sci. Water Res. Technol. 2023, 9, 756–771. [Google Scholar] [CrossRef]
- Furnass, W.R.; Collins, R.; Husband, S.; Sharpe, R.L.; Mounce, S.; Boxall, J. Modelling both the continual erosion and regeneration of discolouration material in drinking water distribution systems. Water Sci. Technol. Water Supply 2014, 14, 81–90. [Google Scholar] [CrossRef]
- Husband, S.; Boxall, J. Understanding and managing discolouration risk in trunk mains. Water Res. 2016, 107, 127–140. [Google Scholar] [CrossRef] [PubMed]
- Blokker, E.J.M.; Schaap, P.G. Particle accumulation rate of drinking water distribution systems determined by incoming turbidity. Procedia Eng. 2015, 119, 290–298. [Google Scholar] [CrossRef]
- Fish, K.; Reeves-McLaren, N.; Husband, S.; Boxall, J. Unchartered waters: The unintended impacts of residual chlorine on water quality and biofilms. NPJ Biofilms Microbiomes 2020, 6, 34. [Google Scholar] [CrossRef] [PubMed]
Disclaimer/Publisher’s Note: The statements, opinions and data contained in all publications are solely those of the individual author(s) and contributor(s) and not of MDPI and/or the editor(s). MDPI and/or the editor(s) disclaim responsibility for any injury to people or property resulting from any ideas, methods, instructions or products referred to in the content. |
© 2024 by the authors. Licensee MDPI, Basel, Switzerland. This article is an open access article distributed under the terms and conditions of the Creative Commons Attribution (CC BY) license (https://creativecommons.org/licenses/by/4.0/).