
Performance Evaluation of Machine Learning Methods for Drinking Water Contamination Detection †

 , , , ,
Abstract
1. Introduction
- Biological contaminants (bacteria, viruses, etc.);
- Inorganic contaminants (heavy metals, etc.);
- Organic contaminants (phenols, pesticides, etc.);
- Emerging contaminants (microplastics, pharmaceuticals, etc.);
- Radiological contaminants.
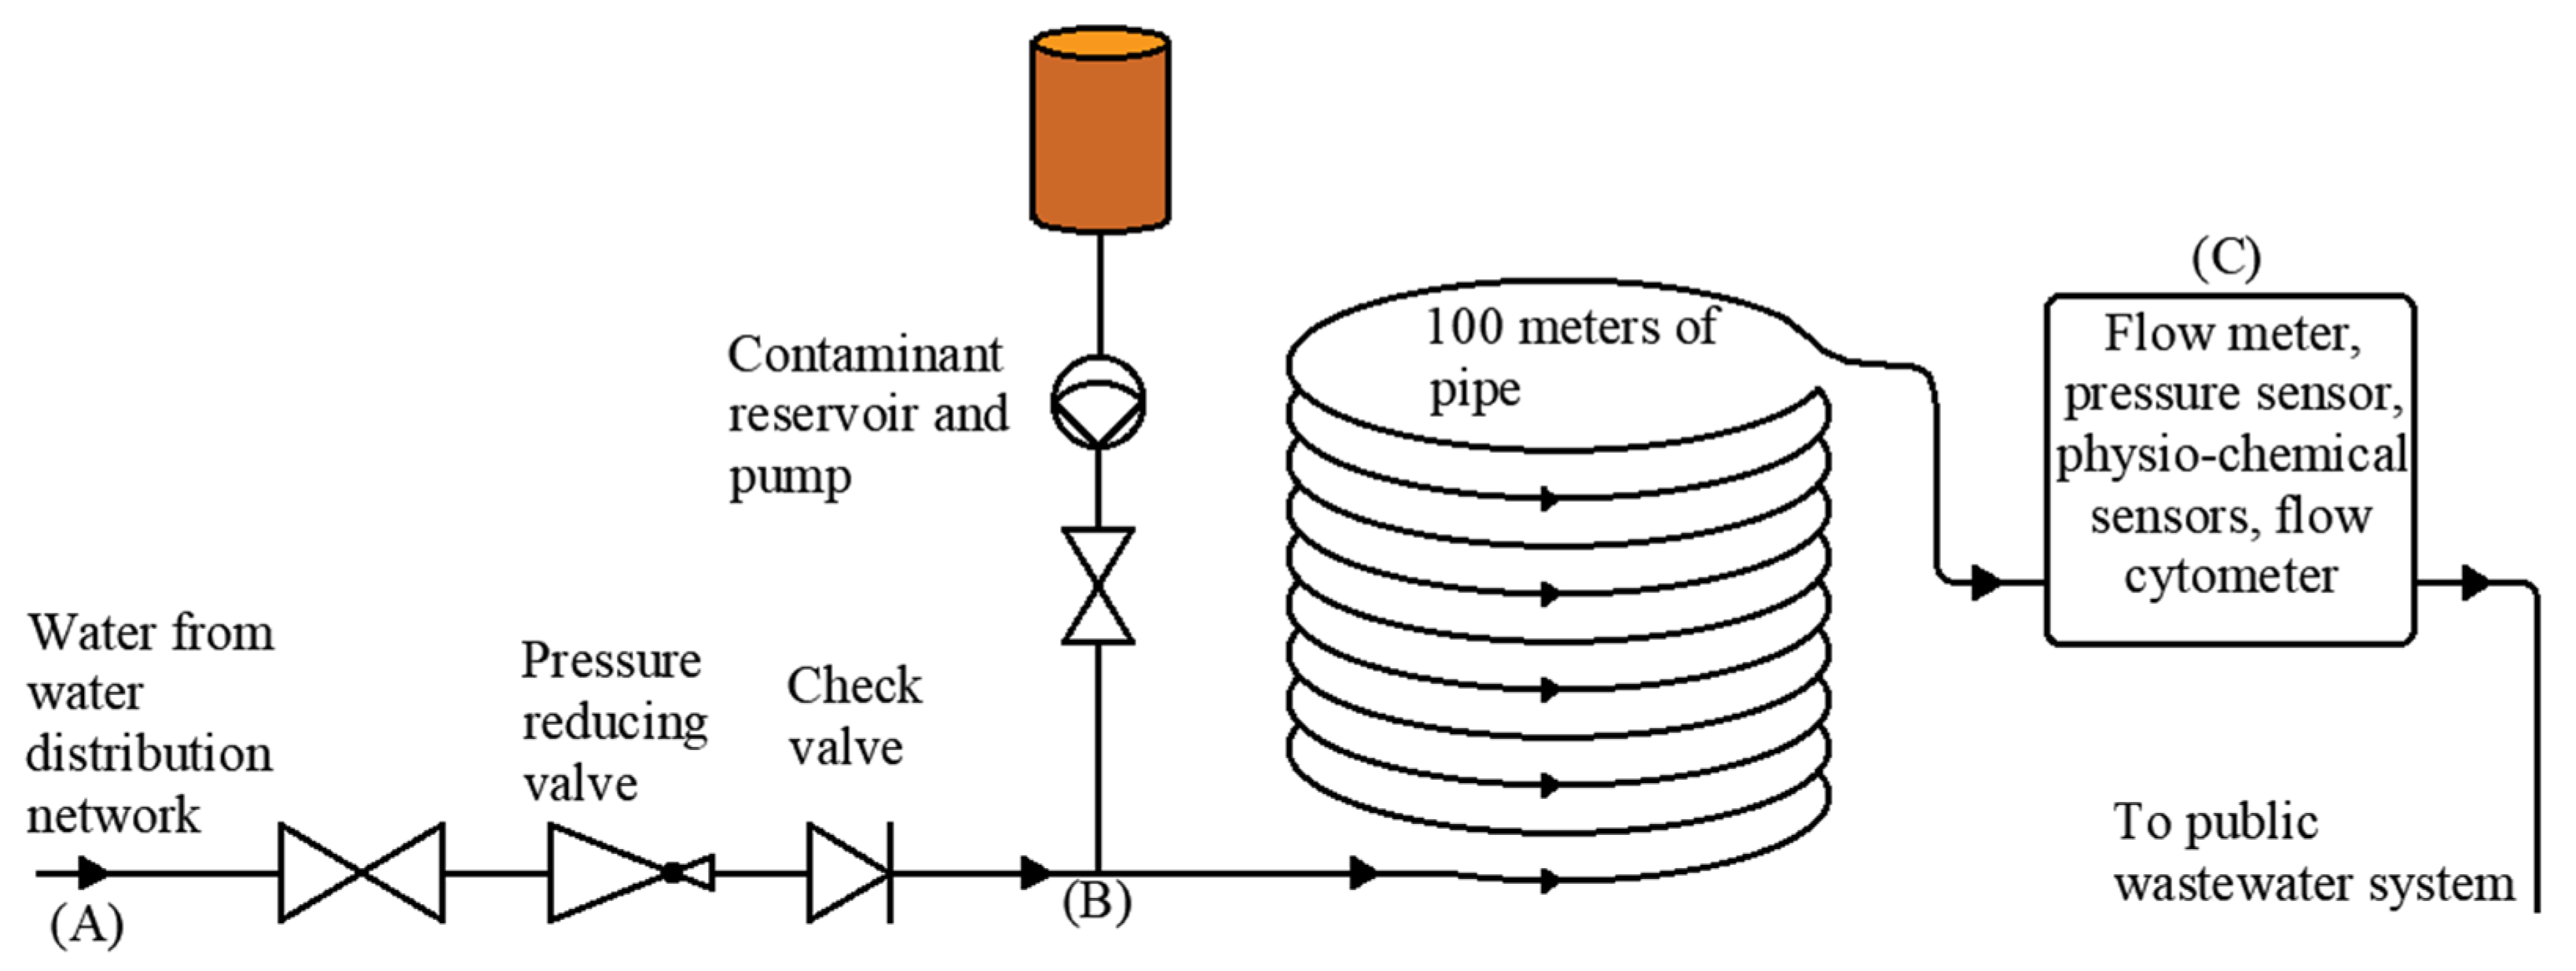
2. Materials and Methods
- Waste water (concentrations of 0.01%, 0.05%, and 0,5%);
- Surface water (concentrations of 0.1%, 0.5%, and 1%);
- Ground water (concentrations of 0.1%, 0.5%, and 1%).
3. Results
4. Discussion
5. Conclusions
Author Contributions
Funding
Institutional Review Board Statement
Informed Consent Statement
Data Availability Statement
Conflicts of Interest
References
- Hemdan, B.A.; El-Taweel, G.E.; Goswami, P.; Pant, D.; Sevda, S. The role of biofilm in the development and dissemination of ubiquitous pathogens in drinking water distribution systems: An overview of surveillance, outbreaks, and prevention. World J. Microbiol. Biotechnol. 2021, 37, 36. [Google Scholar] [CrossRef] [PubMed]
- Paranthaman, K.; Harrison, H. Drinking water incidents due to chemical contamination in England and Wales, 2006–2008. J. Water Health 2010, 8, 735–740. [Google Scholar] [CrossRef] [PubMed]
- Gunnarsdottir, M.J.; Gardarsson, S.M.; Figueras, M.J.; Puigdomènech, C.; Juárez, R.; Saucedo, G.; Arnedo, M.J.; Santos, R.; Monteiro, S.; Avery, L.; et al. Water safety plan enhancements with improved drinking water quality detection techniques. Sci. Total Environ. 2020, 698, 134185. [Google Scholar] [CrossRef] [PubMed]
- Graham, J.; Russell, K.; Gilpin, B. When the implementation of water safety plans fail: Rethinking the approach to water safety planning following a serious waterborne outbreak and implications for subsequent water sector reforms. J. Water Health 2023, 21, 1562–1571. [Google Scholar] [CrossRef] [PubMed]
- Muharemi, F.; Logofătu, D.; Leon, F. Machine learning approaches for anomaly detection of water quality on a real-world data set. J. Inf. Telecommun. 2019, 3, 294–307. [Google Scholar] [CrossRef]
- Sharma, S.; Bhattacharya, A. Drinking water contamination and treatment techniques. Appl. Water Sci. 2017, 7, 1043–1067. [Google Scholar] [CrossRef]
- Dejus, S.; Nescerecka, A.; Kurcalts, G.; Juhna, T. Detection of drinking water contamination event with Mahalanobis distance method, using on-line monitoring sensors and manual measurement data. Water Supply 2018, 18, 2133–2141. [Google Scholar] [CrossRef]
- Hart, D.B.; McKenna, S.A. CANARY User’s Manual Version 4.3.2; Sandia National Laboratories: Albuquerque, NM, USA, 2012. [Google Scholar]
- McKenna, S.A.; Hart, D.; Klise, K.; Cruz, V.; Wilson, M. Event Detection from Water Quality Time Series. In Proceedings of the World Environmental and Water Resources Congress 2007, Tampa, FL, USA, 15–19 May 2007. [Google Scholar] [CrossRef]

| Parameter | Sensor |
|---|---|
| Flow | E+H Picomag DMA25 |
| Pressure | E+H Cerabar PMP11 |
| Total organic carbon + temperature | E+H Viomax CAS51D |
| Turbidity | E+H Turbimax CUS52D |
| pH | E+H Orbisint CPS11D |
| Oxidation–reduction potential | E+H Orbisint CPS12D |
| Electrical conductivity | E+H Condumax CLS21D |
| Flow cytometry cell counts | bNovate BactoSense |
| Metric | MD | BED + NN | NN |
|---|---|---|---|
| Accuracy | 0.76 | 0.995 | 0.999 |
| Precision | 0.41 | 0.984 | 0.984 |
| Recall | 0.76 | 0.985 | 0.983 |
| F-score | 0.53 | 0.984 | 0.983 |
Disclaimer/Publisher’s Note: The statements, opinions and data contained in all publications are solely those of the individual author(s) and contributor(s) and not of MDPI and/or the editor(s). MDPI and/or the editor(s) disclaim responsibility for any injury to people or property resulting from any ideas, methods, instructions or products referred to in the content. |
© 2024 by the authors. Licensee MDPI, Basel, Switzerland. This article is an open access article distributed under the terms and conditions of the Creative Commons Attribution (CC BY) license (https://creativecommons.org/licenses/by/4.0/).
Share and Cite
Urbanovičs, V.; Parshutin, S.; Rubulis, J.; Bonders, M.; Dambeniece, K.; Ozols, R.; Štēbelis, D.; Dejus, S. Performance Evaluation of Machine Learning Methods for Drinking Water Contamination Detection. Eng. Proc. 2024, 69, 110. https://doi.org/10.3390/engproc2024069110
Urbanovičs V, Parshutin S, Rubulis J, Bonders M, Dambeniece K, Ozols R, Štēbelis D, Dejus S. Performance Evaluation of Machine Learning Methods for Drinking Water Contamination Detection. Engineering Proceedings. 2024; 69(1):110. https://doi.org/10.3390/engproc2024069110
Chicago/Turabian StyleUrbanovičs, Valts, Sergei Parshutin, Jānis Rubulis, Mārtiņš Bonders, Katrīna Dambeniece, Roberts Ozols, Dāvids Štēbelis, and Sandis Dejus. 2024. "Performance Evaluation of Machine Learning Methods for Drinking Water Contamination Detection" Engineering Proceedings 69, no. 1: 110. https://doi.org/10.3390/engproc2024069110
APA StyleUrbanovičs, V., Parshutin, S., Rubulis, J., Bonders, M., Dambeniece, K., Ozols, R., Štēbelis, D., & Dejus, S. (2024). Performance Evaluation of Machine Learning Methods for Drinking Water Contamination Detection. Engineering Proceedings, 69(1), 110. https://doi.org/10.3390/engproc2024069110