Abstract
Dry event duration analysis from series of daily rainfall observations in a Ghézala Dam catchment in Northern Tunisia, where the average rainfall is about 600 mm, was executed. The dry events are a series of dry days framed by a rainfall event. Rainfall events are defined as an uninterrupted series of rainfall days lasting at least a day having received a precipitation superior or equal to a threshold value of 4 mm d−1. The rainfall events are characterized by depth and duration. A correlation exists between these two parameters. Therefore, the rainfall depth per event is conditioned by the event duration. Respectively, the negative binomial and the geometric distribution best fits the dry event duration and the rainfall event duration. For the length of the climatical cycle, the incomplete gamma was found to be the appropriate distribution.
1. Introduction
Precipitation is a very important element of climate that affects both the natural environment and human society. Whether short or long, droughts or high intensities of rainfall have harmful consequences on society and the environment [1].
It is recognized in the literature that the wet–dry spell model is used to simulate wet and dry spells separately by fitting their durations to an appropriate probability distribution [2,3].
In this contribution, we are interested in the intensive statistical analysis of the uninterrupted sequences of dry and rainfall days, and, consequently, their alternation during the rainy season. We use discrete and continuous probability distribution functions.
The case study is a dam watershed with a Mediterranean climate located in the north of Tunisia.
This concept of event-based investigation takes a step ahead of continuous data generation methods. Synthetic data can be used in irrigation management studies or analysis of the effects of climate change.
2. Main Data
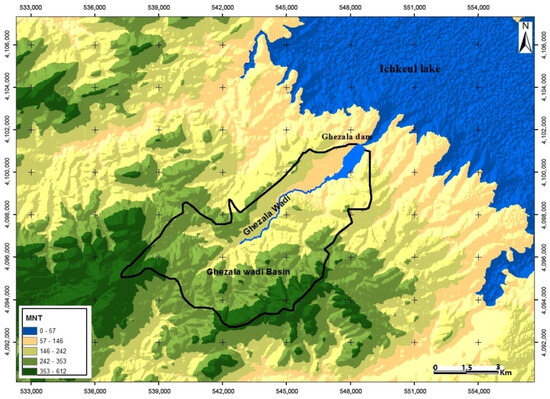
The case study is the watershed of the Ghézala dam (lat. 37°02′75″ N, long. 9°32′07″ E) Northern Tunisia (Figure 1).

Figure 1.
Ghézala dam river basin.
The rainy season lasts from September to April, where the average annual rainfall is 680 mm. The dry season lasts almost from May to August. The climate is sub-humid, where the greatest percentage of rain is recorded during the three winter months (December, January, and February).
Here, we use daily rainfall records from the rain gauge installed at the Ghézala dam site for the period from 1968 to 2007.
3. Method
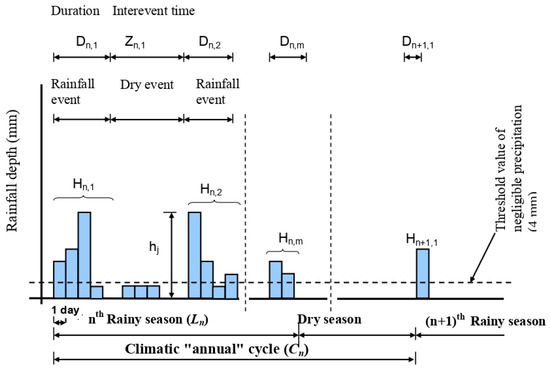
The methodology used here is based on the characterization of rainfall and dry events following the principle in Figure 2. We first define a negligible rainfall threshold. Here, a threshold of 4 mm d−1 was chosen corresponding to the average daily evapotranspiration in the watershed. Thus, according to Figure 2, a rainfall event is an uninterrupted sequence of rainy days including at least one day having received precipitation greater than or equal to the threshold value. The dry event is, then, the time interval between two successive rainfall events.

Figure 2.
Wet–dry spell–based analysis.
The process is therefore specified by the probability laws of the duration of wet periods and the duration of dry periods (Figure 2).
To index the climatic parameters in the time marker, the rainy season takes the letter n and the event the letter m, as follows:
According to Figure 2, during any rainy season, the duration of any rainfall event will be denoted Dn,m and that of a dry event Zn,m. The cumulative rainfall amounts corresponding to this rainfall event will be calculated as follows (Equation (3)):
where hj is the daily rainfall amount recorded in mm; note that hj is positive.
The varying duration of the events requires that the duration of the event should condition the cumulative rainfall amounts corresponding to each event. The identifying and fitting of conditional probability distributions to rainfall amounts can be a problem, particularly in the case of short records and extreme (long) duration events [4].
In the same way as shown in Figure 2, we define the length Ln of the rainy season as the time interval between the start of the first and the end of the last event. The climate cycle Cn is determined as the time between the start of two subsequent rainy seasons.
4. Results and Discussion
In order to study the dependence relationship between the different parameters extracted from the wet–dry period analysis, a regression analysis was carried out. The results of the maximum determination coefficients obtained are shown in Table 1.

Table 1.
Coefficients of determination for the parameters of the analysis by events.
As expected, Table 1 shows that there is a relationship between the duration of the rainfall event and its corresponding rainfall depth, while no significant pairwise correlation between Zn,m and the duration Dn,m and cumulative rainfall amounts Hn,m could be recorded (Table 1). Therefore, the assumption made that precipitation during a rainy season is part of an independent random process appears to be justified.
Table 1 shows that the number of events per season Nn is independent of other parameters except, as expected, the total precipitation amount Ht,n. In fact, this amount of rain is, among other things, the sum of the cumulative precipitation amounts Hn,m.
The length of the climatic cycle Cn is independent of the number of events per rainy season Nn; however, it shows a dependence on the length of the rainy season Ln.
Fitting Probability Distribution Functions to Event Based Analysis Parameters
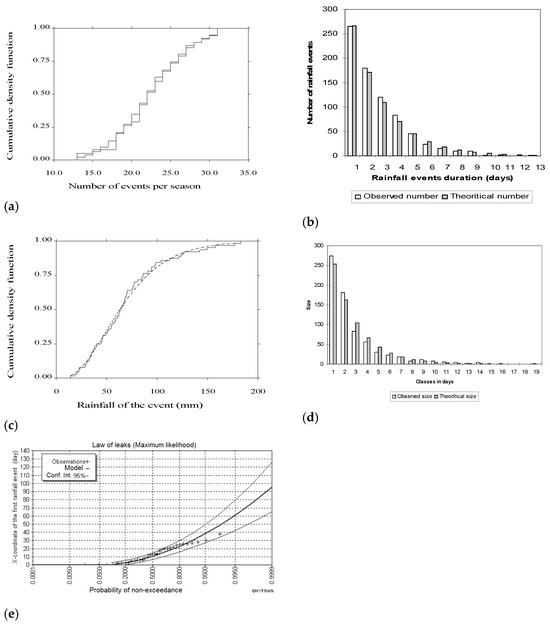
Table 2 gives the probability distribution functions, pdf, fitted, and Figure 3 shows some adjustments of this pdf to the different parameters extracted from the event based analysis. It appears that the Poisson density function adequately describes the distribution of the number of events per season (Figure 3a). The arithmetic mean and the standard deviation are, respectively, 22.54 and 4.67. The Kolmogorov–Smirnov test assessed the goodness-of-fit at the 95% significance level using the SIMFIT software version 5.5 [5].

Table 2.
Probability distribution functions, pdf, fitted to the different parameters extracted from the event-based analysis. The Kolmogorov–Smirnov test was used to assess the goodness-of-fit at the 95% significance level.

Figure 3.
Fitting the probability distribution function to parameters extracted from the event-based analysis: (a) number of events per season, (b) rainfall events duration, (c) the rainfall depth of the ≥6-day-long rainfall events, (d) dry events duration, (e) the chronological position of the first rainfall event in the rainy season.
Analysis of the results obtained shows that approximately 33% of rainfall events last at most one day. The maximum duration observed is 13 days. However, the frequency of these long-lasting events decreases rapidly with increasing duration. The arithmetic mean is 2.79 days and the standard deviation is 1.87. The geometric pdf proved to be the most adequate for the fitting (Figure 3b).
Since there is a relationship between rainfall depth Hn,m and duration Dn,m (Table 1), we used conditional pdfs of the rainfall depth for different values of event duration. The Hn,m recorded during the events are grouped into 4 mm wide classes, starting with the 4–8 mm class. For example, for events lasting at least 6 days, the gamma distribution provided the best fit (Figure 3c). The fit was assessed by the Kolmogorov–Smirnov test. The two statistical parameters arithmetic mean and standard deviation of this class are 69.81 mm and 38.02 mm, respectively.
From the results in Table 1 the dry event can be assumed to be independent of the rainfall event and the rainfall depth per event. Therefore, the distribution of the dry event, which can only take integer values (Figure 2), follows an unconditional probability distribution function.
Therefore, the negative binomial pdf was found to be the best form for the fitting (Figure 3d).
The interpretation of the results found highlights that dry periods of up to 30 days, or even more, can be recorded (a maximum of 56 days is recorded). The arithmetic mean and standard deviation for the dry event are 7.3 days and 7.9, respectively; i.e., 30.2 days and 3.6 for extreme events.
The best fit of the X-axis of the first rainfall event in the time axis (see Figure 2) is a law of the leaks (Figure 3e), using the HYFRAN software version 1.1 [6]. On average, the first rainfall event occurs in mid-September, while the probability of exceeding this value is 0.52 for a biennial return period. In the extreme case, the hydrological year begins around the first decade of October.
5. Conclusions
The dry spell phenomenon using rainfall records from the Ghézala dam can be well described by fitting a pdf to the length of the interevent period. An excellent fit is provided by the negative binomial pdf for prolonged dry periods between subsequent rainfall events. Conceptually, in a true Poisson process, the time “without event” should follow the exponential pdf or, in a discrete case, the geometric pdf [7]. Notably, this “flaw” could be eliminated by defining the interevent time as the dry event. Consequently, the present role of the interevent time would be taken over by the rainfall events duration. The theoretical requirements of the fitted geometric pdf are satisfied (Figure 3b).
Event-based analysis was used to generate synthetic rainfall event time series; coupling this with a rainfall–runoff model, one can obtain synthetic streamflow series to be used for reservoir simulation studies and the design of flood estimations.
Author Contributions
Conceptualization, M.M. and F.L.; methodology, M.M.; software, M.M.; validation, M.M. and F.L.; formal analysis, M.M.; investigation, M.M.; resources, M.M.; data curation, M.M.; writing—original draft preparation, M.M.; writing—review and editing, M.M.; visualization, M.M. All authors have read and agreed to the published version of the manuscript.
Funding
This research received no external funding.
Institutional Review Board Statement
Not applicable.
Informed Consent Statement
Not applicable.
Data Availability Statement
The data are printed in paper documents stored (archived) in office of the General Directorate of Water Resources and the Division of Dam Operation of Extreme North and Ichkeul of the Ministry of Agriculture of Tunisia, (http://www.agriculture.tn/). These data are the property of this organization, and are available in situ.
Conflicts of Interest
The authors declare no conflict of interest.
References
- Wan, H.; Zhang, X.; Barrow, E.M. Stochastic Modelling of Daily Precipitation for Canada. Atmos.-Ocean. 2005, 43, 23–32. [Google Scholar] [CrossRef]
- Bogardi, J.J.; Duckstein, L. Evénements de période sèche en pays semi-aride. Rev. des Sci. de L’eau 1993, 6, 23–44. [Google Scholar] [CrossRef][Green Version]
- Mathlouthi, M.; Lebdi, F. Comprehensive study of the wet and dry spells and their extremes in the Mediterranean climate basin Northern Tunisia. SN Appl. Sci. 2021, 3, 850. [Google Scholar] [CrossRef]
- Foufoula-Georgiou, E.; Georgakakos, K.P. Hydrologic advances in space-time precipitation modeling and forecasting. In Recent Advances in the Modeling of Hydrologic Systems; Bowles, D.S., O’Connell, P.E., Eds.; NATO ASI Series, Serie C: Mathematical and Physical Sciences; Kluwer Academic Publishers: Dordrecht, The Netherlands, 1991; Volume 345, pp. 47–65. [Google Scholar]
- Bardsley, W.G. SIMFIT, A package for Simulation, Curve Fitting, Statistical Analysis and Graph Plotting; University of Manchester, School of Biological Sciences: Manchester, UK, 2004. [Google Scholar]
- INRS-ETE Logiciel Hyfran, version 1.1; Chaire industrielle CRSNG/Hydro-Québec/ALCAN en hydrologie statistique Institut national de la recherche scientifique: Québec, QC, Canada, 2002.
- Fogel, M.M.; Duckstein, L. Stochastic precipitation modelling for evaluating non-point source pollution in statistical analysis of rainfall and runoff. In Proceeding of the International Symposium on Rainfall-Runoff Modelling; Water Resources Publications: Littleton, CO, USA, 1982; pp. 119–136. [Google Scholar]
Disclaimer/Publisher’s Note: The statements, opinions and data contained in all publications are solely those of the individual author(s) and contributor(s) and not of MDPI and/or the editor(s). MDPI and/or the editor(s) disclaim responsibility for any injury to people or property resulting from any ideas, methods, instructions or products referred to in the content. |
© 2024 by the authors. Licensee MDPI, Basel, Switzerland. This article is an open access article distributed under the terms and conditions of the Creative Commons Attribution (CC BY) license (https://creativecommons.org/licenses/by/4.0/).