Proceeding Paper

Additive Manufacturing Powder Particle Size Distributions: Comparison of Histogram Binning Methods †

1
Faculty of Computing, Engineering and the Built Environment, Ulster University, Londonderry BT48 7JL, UK
2
Department of Electronic and Mechanical Engineering, Atlantic Technological University Donegal, F92 FC93 Letterkenny, Ireland
*
Author to whom correspondence should be addressed.
Presented at the 39th International Manufacturing Conference, Derry/Londonderry, UK, 24–25 August 2023.
Eng. Proc. 2024, 65(1), 14; https://doi.org/10.3390/engproc2024065014
Published: 25 March 2024
(This article belongs to the Proceedings of The 39th International Manufacturing Conference)

Abstract

:
Additive manufacturing powders require a well-defined particle size distribution (PSD) and spherical morphology to ensure good flowability. To simplify characterisation, powders can be prepared using standard metallurgical techniques followed by optical imaging of the cross-sectioned particles. Measured PSDs of particle sections are typically underestimates of the true PSD; hence, stereological corrections are required. Variations arise in the histogram binning methods (central binning versus upper limit binning) of commonly used stereological corrections. Although the results show some sensitivity to the binning method used, the GCO method seemed reasonably robust to changes in the binning method. However, authors are encouraged to follow the method as it is intended within the literature, which was found to be especially true when using Saltykov’s method.

1. Introduction

A well-graded particle size distribution (PSD) of spherical particles is necessary for good powder flowability and particle packing in powder-based additive manufacturing processes [1,2]. Hence, users of powder-based additive manufacturing processes must regularly assess the PSD to ensure optimal part production. However, many users are small and medium-sized enterprises (SMEs) without direct access to dedicated particle analysis facilities such as laser size diffraction (LSD) or scanning electron microscopy. This introduces the need to outsource analysis to third-party laboratories, increasing costs and lead times.
Preparing powders for optical analysis using standard metallurgical procedures of hot-mounting, grinding, and polishing provides a low-cost procedure of analysis with a quick turnaround, thereby reducing the frequency of third-party outsourcing. However, as shown in Figure 1, the diameters of the particle sections observed on the polished plane are typically an underestimate of the true particle size. Hence, stereological corrections must be applied to the apparent PSD of the sections to estimate the true PSD.
Stereology involves using probability, statistical measures, and integral geometry to relate 2D measurements to parameters defining 3D structures. In this case, a histogram of measured particle section profiles is used to derive a histogram of sphere sizes which could have produced the profile histogram via reconstruction of sphere size distribution approach. However, a question that arises is which binning method to use. Some techniques use central binning whilst others use upper limit binning.
The first reconstructive procedure of this kind was proposed by Wicksell [3] who considered the probability of finding an apparent section diameter, d , centered within a bin and derived a transformation matrix for 15 bins in which the bin limits were i 0.5 Δ and i + 0.5 Δ , where i represents the bin number and Δ represents the bin size. Wicksell also had a 1 / 4 th bin with a range of 0 0.5 Δ . Saltykov [4] proposed a successive subtraction method based on a method developed by Scheil [5] which had been modified by Schwartz [6]. Saltykov constructed a histogram using bin limits of i 1 Δ and i Δ . The upper limits of the bins represented the profile and particle size for each class. Goldsmith [7] and Cruz-Orive [8] each independently improved these previous methods, resulting in a method that used the same bin limits as Saltykov but used class midpoints as a measure of the particle size, similar to Wicksell’s method.
In some cases, binning methods are used interchangeably without explanation or critical evaluation. Applications of Saltykov’s method (an upper limit method) have been found in studies using the central binning method [9]. Differences in outcomes have not been investigated to determine whether it is an acceptable practice to change binning methods. Changes to binning are therefore investigated in this work.

2. Materials and Methods

Plasma-atomised Grade 23 Ti-6Al-4V titanium alloy powder was used in this study. The sample preparation, digital imaging and image analysis were conducted as described in refs. [10,11]. LSD analysis was performed to provide a ground truth for comparison purposes. The apparent PSD was generated via automated image analysis. The Saltykov (SSS) and Goldsmith–Cruz–Orive (GCO) methods were compared using both central and upper limit binning. Mean absolute errors (MAE) between each stereological correction output and ground truth (LSD) data were calculated.

3. Results

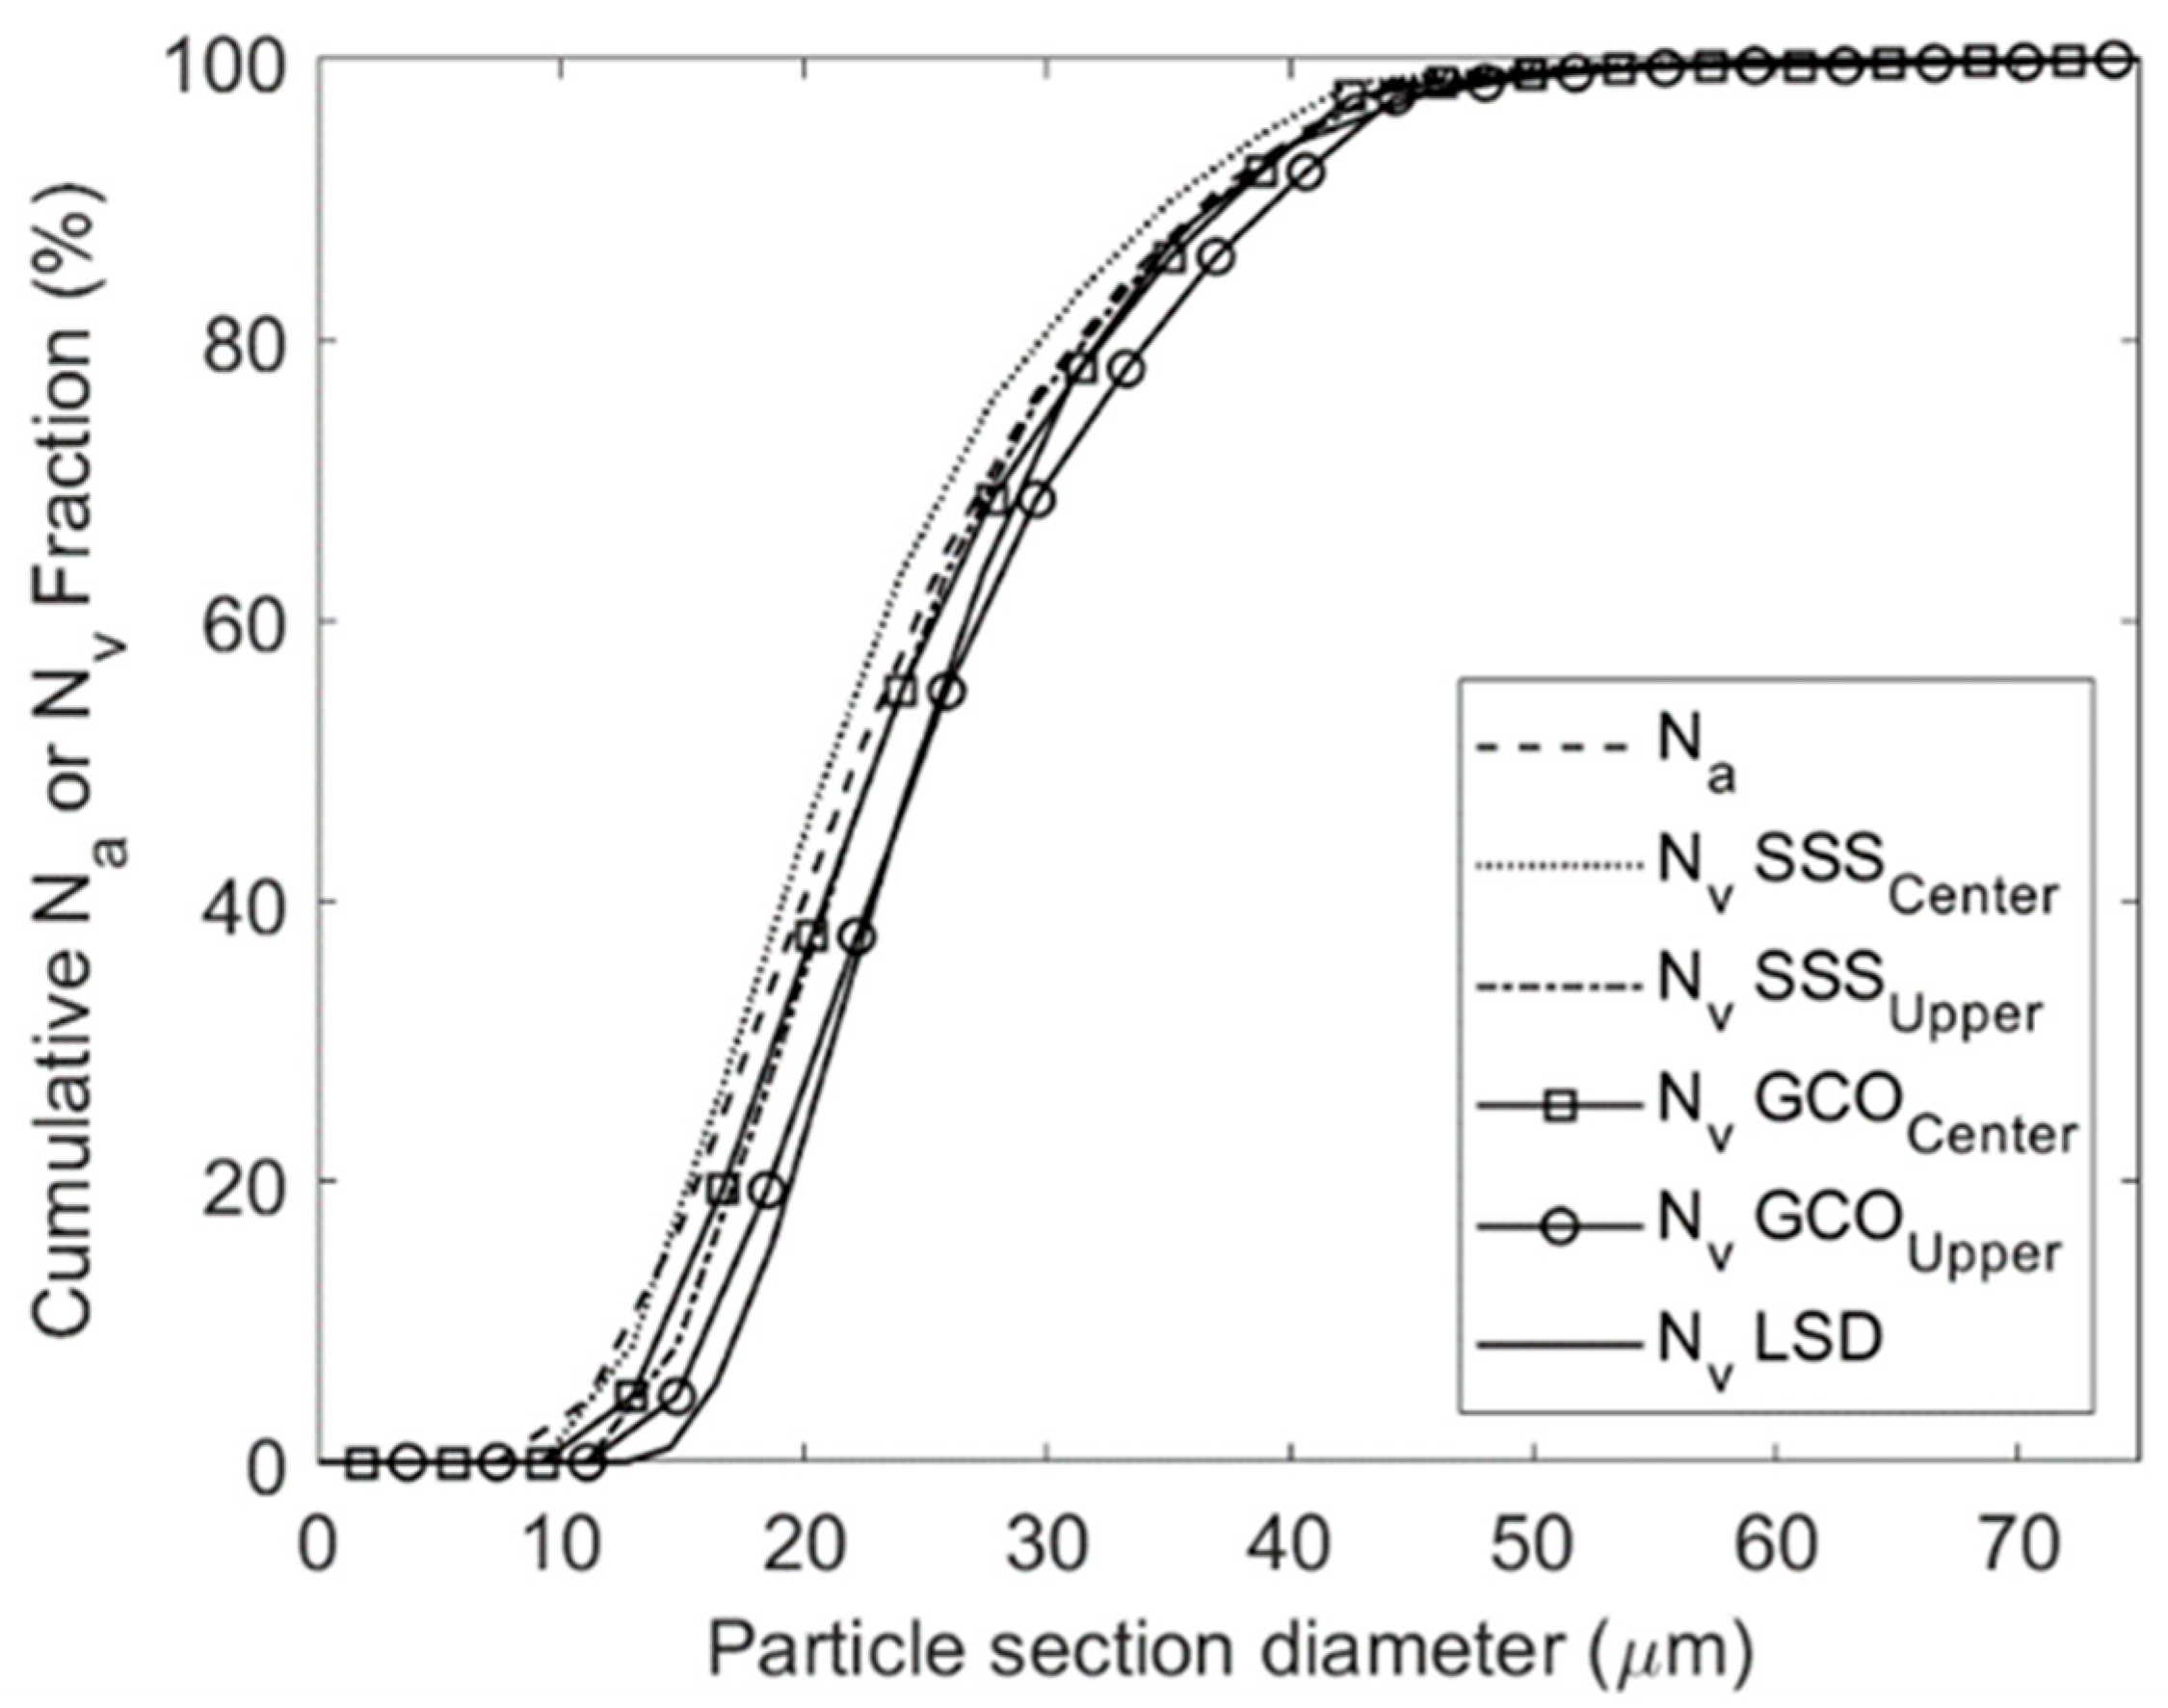
The resulting cumulative size distributions from the SSS and GCO methods, plotted using upper and central binning methods, are shown in Figure 2 with the cumulative size distributions of the particle sections ( N a ) and the LSD data.
Measures of central tendency and dispersion for each PSD are provided in Table 1 along with the calculated MAE.

4. Discussion

Although the literature recommends using the coefficients of the GCO method rather than those of the SSS method [12], in this work, the SSSUpper method performs slightly better than the GCOCenter method. Both methods produce the same mean particle size (26.5 μm), skewness (1.0) and kurtosis (4.5) values, but the SSSUpper method results in a lower standard deviation (8.6 μm vs. 9.0 μm) and lower MAE (2.3% vs. 2.4%) when compared to the GCOCenter method. However, if the coefficients of the GCO method are used but the resulting Nv distribution is placed at the upper bin limits (GCOUpper), the MAE value decreases from 2.4% to 1.3%, which becomes the smallest MAE value, indicating the best fit to the ground truth (LSD) data in this study. Furthermore, the GCOUpper method results in a mean particle size of 28.3 μm which, although larger than the mean from LSD, results in a smaller percentage difference of 1.4% (0.4 μm) compared to 5.0% for both the GCOCenter and SSSUpper methods (1.4 μm), and 11.8% for the SSSCenter method (3.3 μm). Using the coefficients of Saltykov’s method and plotting at the central bin limits is not advised in this case as it produces a PSD with a greater MAE than even the apparent PSD.

5. Conclusions

Although results show limited sensitivity in the GCO method to changes in the binning method used (central binning or upper limit binning), seemingly, no significant differences could be established. However, authors are encouraged to follow any method as it is described in the literature. This is particularly recommended for the application of Saltykov’s method, where upper limit binning must be used as originally intended. As shown here, the Saltykov method with central binning gave an erroneous result.

Author Contributions

Conceptualization, C.G., E.K. and S.M.; methodology, C.G.; software, C.G.; validation, C.G.; formal analysis, C.G.; investigation, C.G.; resources, S.M.; data curation, C.G.; writing—original draft preparation, C.G.; writing—review and editing, C.G., E.K. and S.M.; visualization, C.G.; supervision, E.K. and S.M.; project administration, S.M.; funding acquisition, C.G. All authors have read and agreed to the published version of the manuscript.

Funding

This research was funded by the Department for the Economy, Northern Ireland, in the form of a Postgraduate Research Studentship.

Institutional Review Board Statement

Not applicable.

Informed Consent Statement

Not applicable.

Data Availability Statement

Data are contained within the article.

Conflicts of Interest

The authors declare no conflicts of interest. The funders had no role in the design of the study; in the collection, analyses, or interpretation of data; in the writing of the manuscript; or in the decision to publish the results.

References

  1. Stavrou, A.G.; Hare, C.; Hassanpour, A.; Wu, C. Investigation of powder flowability at low stresses: Influence of particle size and size distribution. Powder Technol. 2020, 364, 98–114. [Google Scholar] [CrossRef]
  2. Zhao, Y.; Cui, Y.; Hasebe, Y.; Bian, H.; Yamanaka, K.; Aoyagi, K.; Hagisawa, T.; Chiba, A. Controlling factors determining flowability of powders for additive manufacturing: A combined experimental and simulation study. Powder Technol. 2021, 393, 482–493. [Google Scholar] [CrossRef]
  3. Wicksell, S.D. The Corpuscle Problem: A Mathematical Study of a Biometric Problem. Biometrika 1925, 17, 84–99. [Google Scholar]
  4. Saltykov, S.A. Calculation of the Distribution Curve for the Size of Dispersed Grains. Plant Lab. 1949, 15, 1317–1319. [Google Scholar]
  5. Scheil, E. Die Berechnung der Anzahl und Gröβenverteilung kugelförmiger Kristalle in undurchsichtigen Körpern mit Hilfe der durch einen ebenen Schnitt erhaltenen Schnittkreise. Z. Anorg. Allg. Chem. 1931, 201, 259–264. [Google Scholar] [CrossRef]
  6. Schwartz, H.A. The metallographic determination of the size distribution of temper carbon nodules. Met. Alloys 1934, 5, 139–140. [Google Scholar]
  7. Goldsmith, P.L. The calculation of true particle size distributions from the sizes observed in a thin slice. Br. J. Appl. Phys. 1967, 18, 813–830. [Google Scholar] [CrossRef]
  8. Cruz-Orive, L.M. Particle size-shape distributions: The general spheroid problem. I. Mathematical model. J. Microsc. 1976, 107, 235–253. [Google Scholar] [CrossRef]
  9. Lopez-Sanchez, M.A.; Llana-Fúnez, S. An extension of the Saltykov method to quantify 3D grain size distributions in mylonites. J. Struct. Geol. 2016, 93, 149–161. [Google Scholar] [CrossRef]
  10. Gallagher, C.; Harkin, R.; Kerr, E.; McFadden, S. Examining the Quality of New and Reused Powder in the Powder Bed Fusion Process via Optical Microscopy. In Proceedings of the 38th International Manufacturing Conference (IMC38), Dublin, Ireland, 30 August 2022. [Google Scholar]
  11. Gallagher, C.; Kerr, E.; McFadden, S. Particle size distribution for additive manufacturing powder using stereological corrections. Powder Technol. 2023, 429, 118873. [Google Scholar] [CrossRef]
  12. Weibel, E.R. Stereological Methods, Vol. 2: Theoretical Foundations; Academic Press Inc.: London, UK, 1980. [Google Scholar]
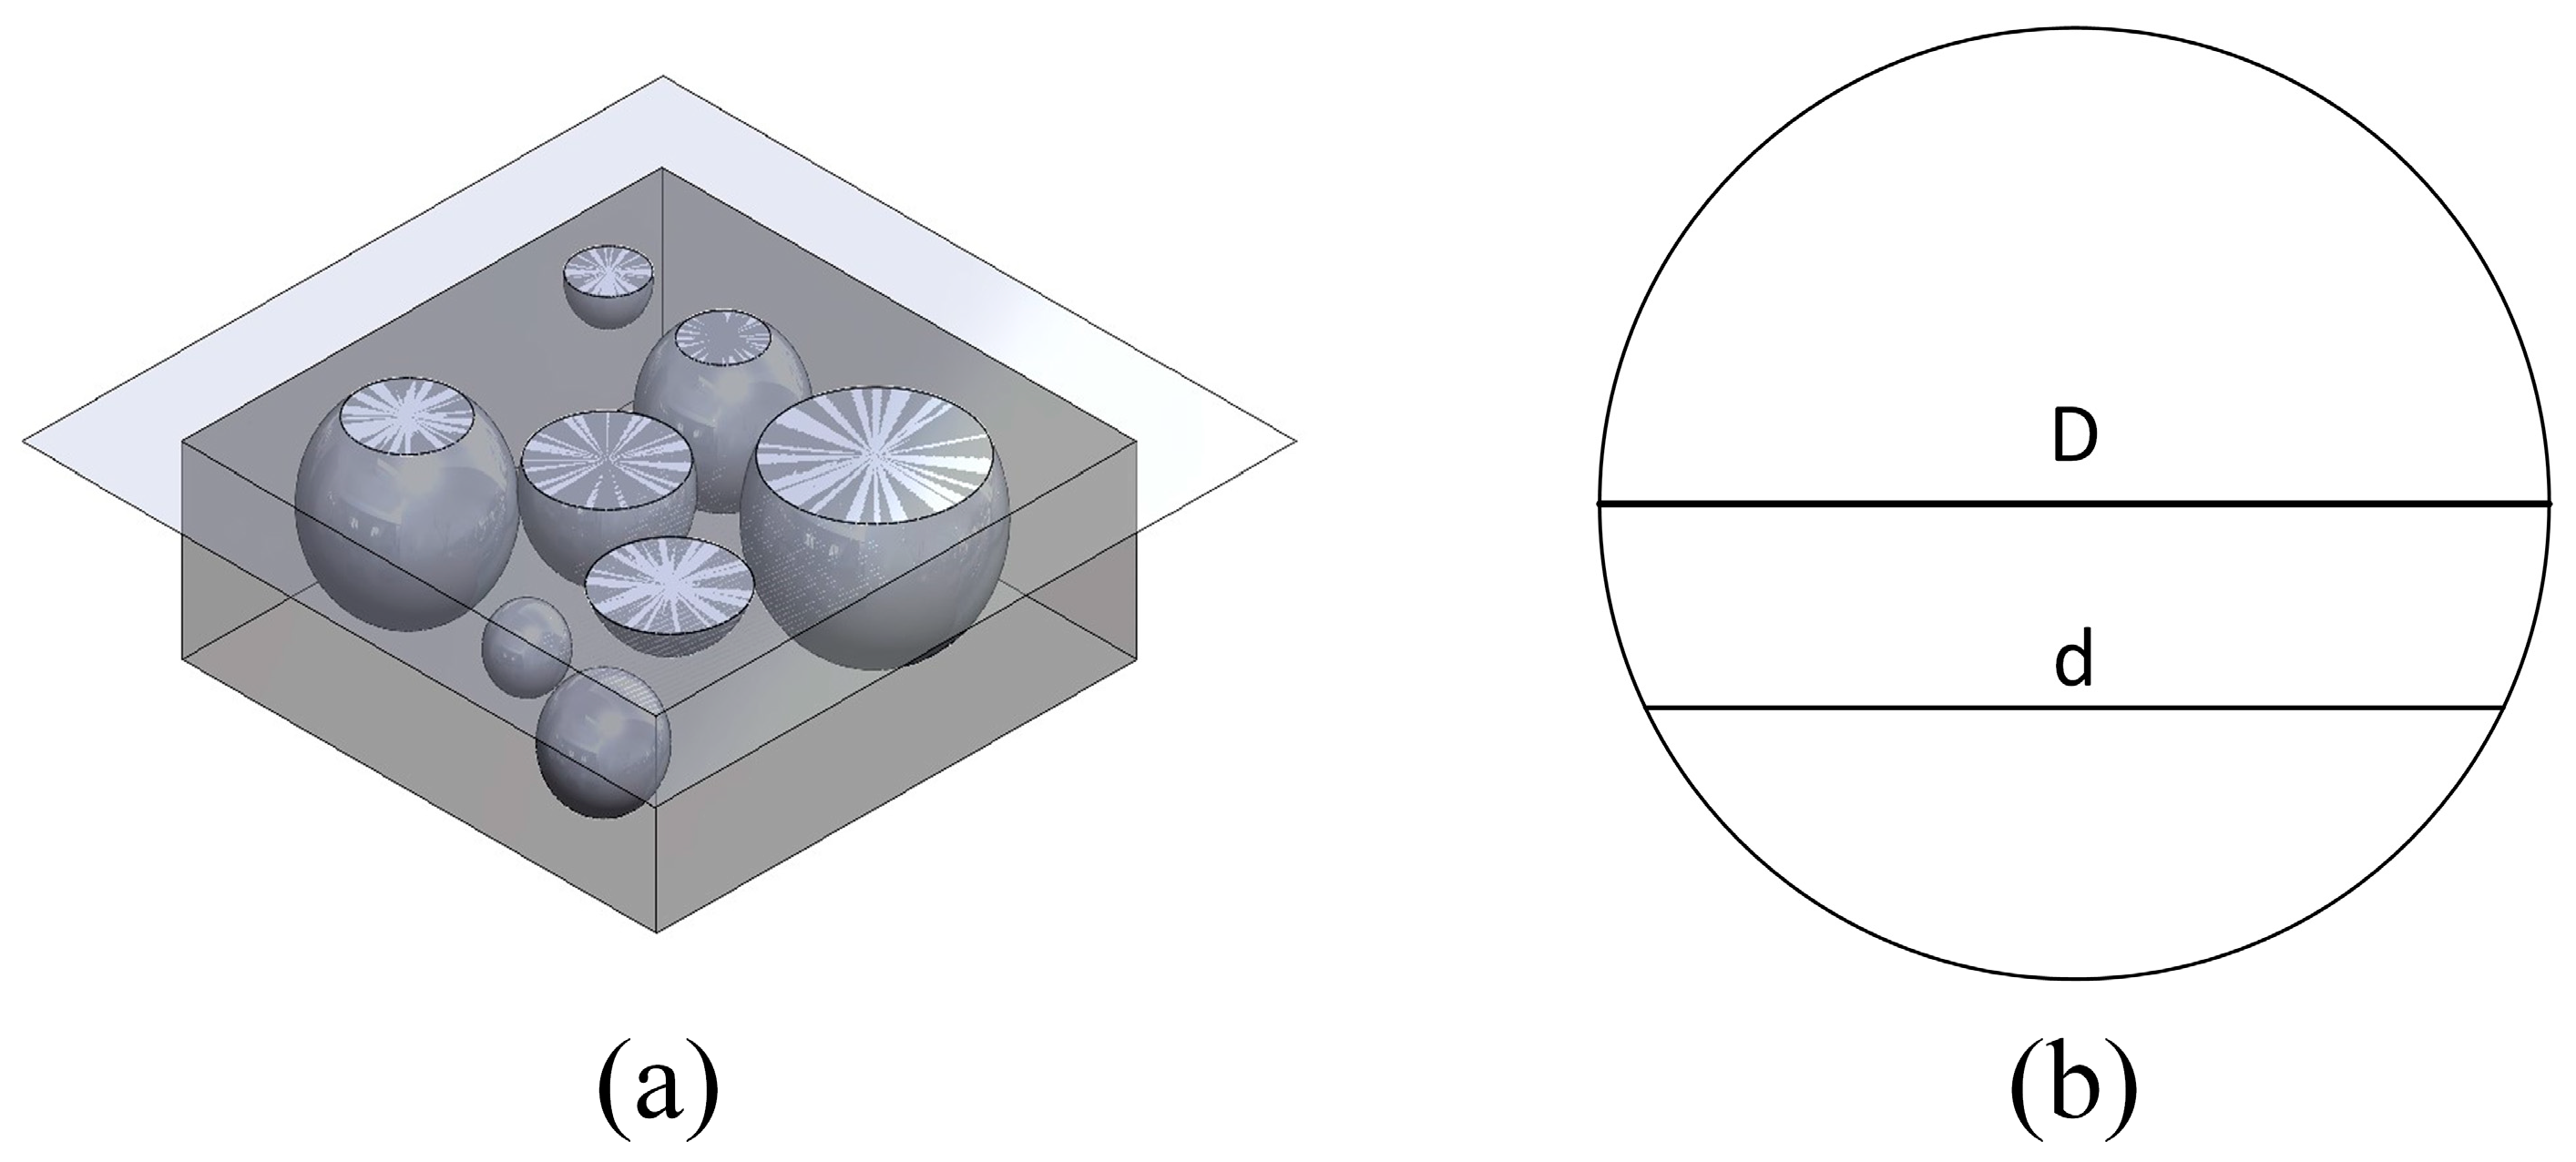
Figure 1. Diagrams in (a) 3D and (b) 2D showing how particle section diameter, d, is typically an underestimate of true particle diameter, D.
Engproc 65 00014 g001
Figure 2. Cumulative fraction line graphs comparing the particle size distributions obtained from 2D apparent section sizes, LSD analysis, and stereological corrections via the SSS and GCO methods.
Engproc 65 00014 g002
Table 1. Measures of central tendency and dispersion with mean absolute error calculation for each size distribution.
Mean
(μm)
Standard
Deviation
(μm)
Skewness
(–)
Kurtosis
(–)
MAE
(%)
Na23.79.20.94.33.6
NvSSSCenter24.68.61.04.54.7
NvSSSUpper26.58.61.04.52.3
NvGCOCenter26.59.01.04.52.4
NvGCOUpper28.39.01.04.51.3
NvLSD27.98.01.14.6
Disclaimer/Publisher’s Note: The statements, opinions and data contained in all publications are solely those of the individual author(s) and contributor(s) and not of MDPI and/or the editor(s). MDPI and/or the editor(s) disclaim responsibility for any injury to people or property resulting from any ideas, methods, instructions or products referred to in the content.