
Maintenance Analysis of Raw Mill Machines in Cement Production †


Abstract
1. Introduction
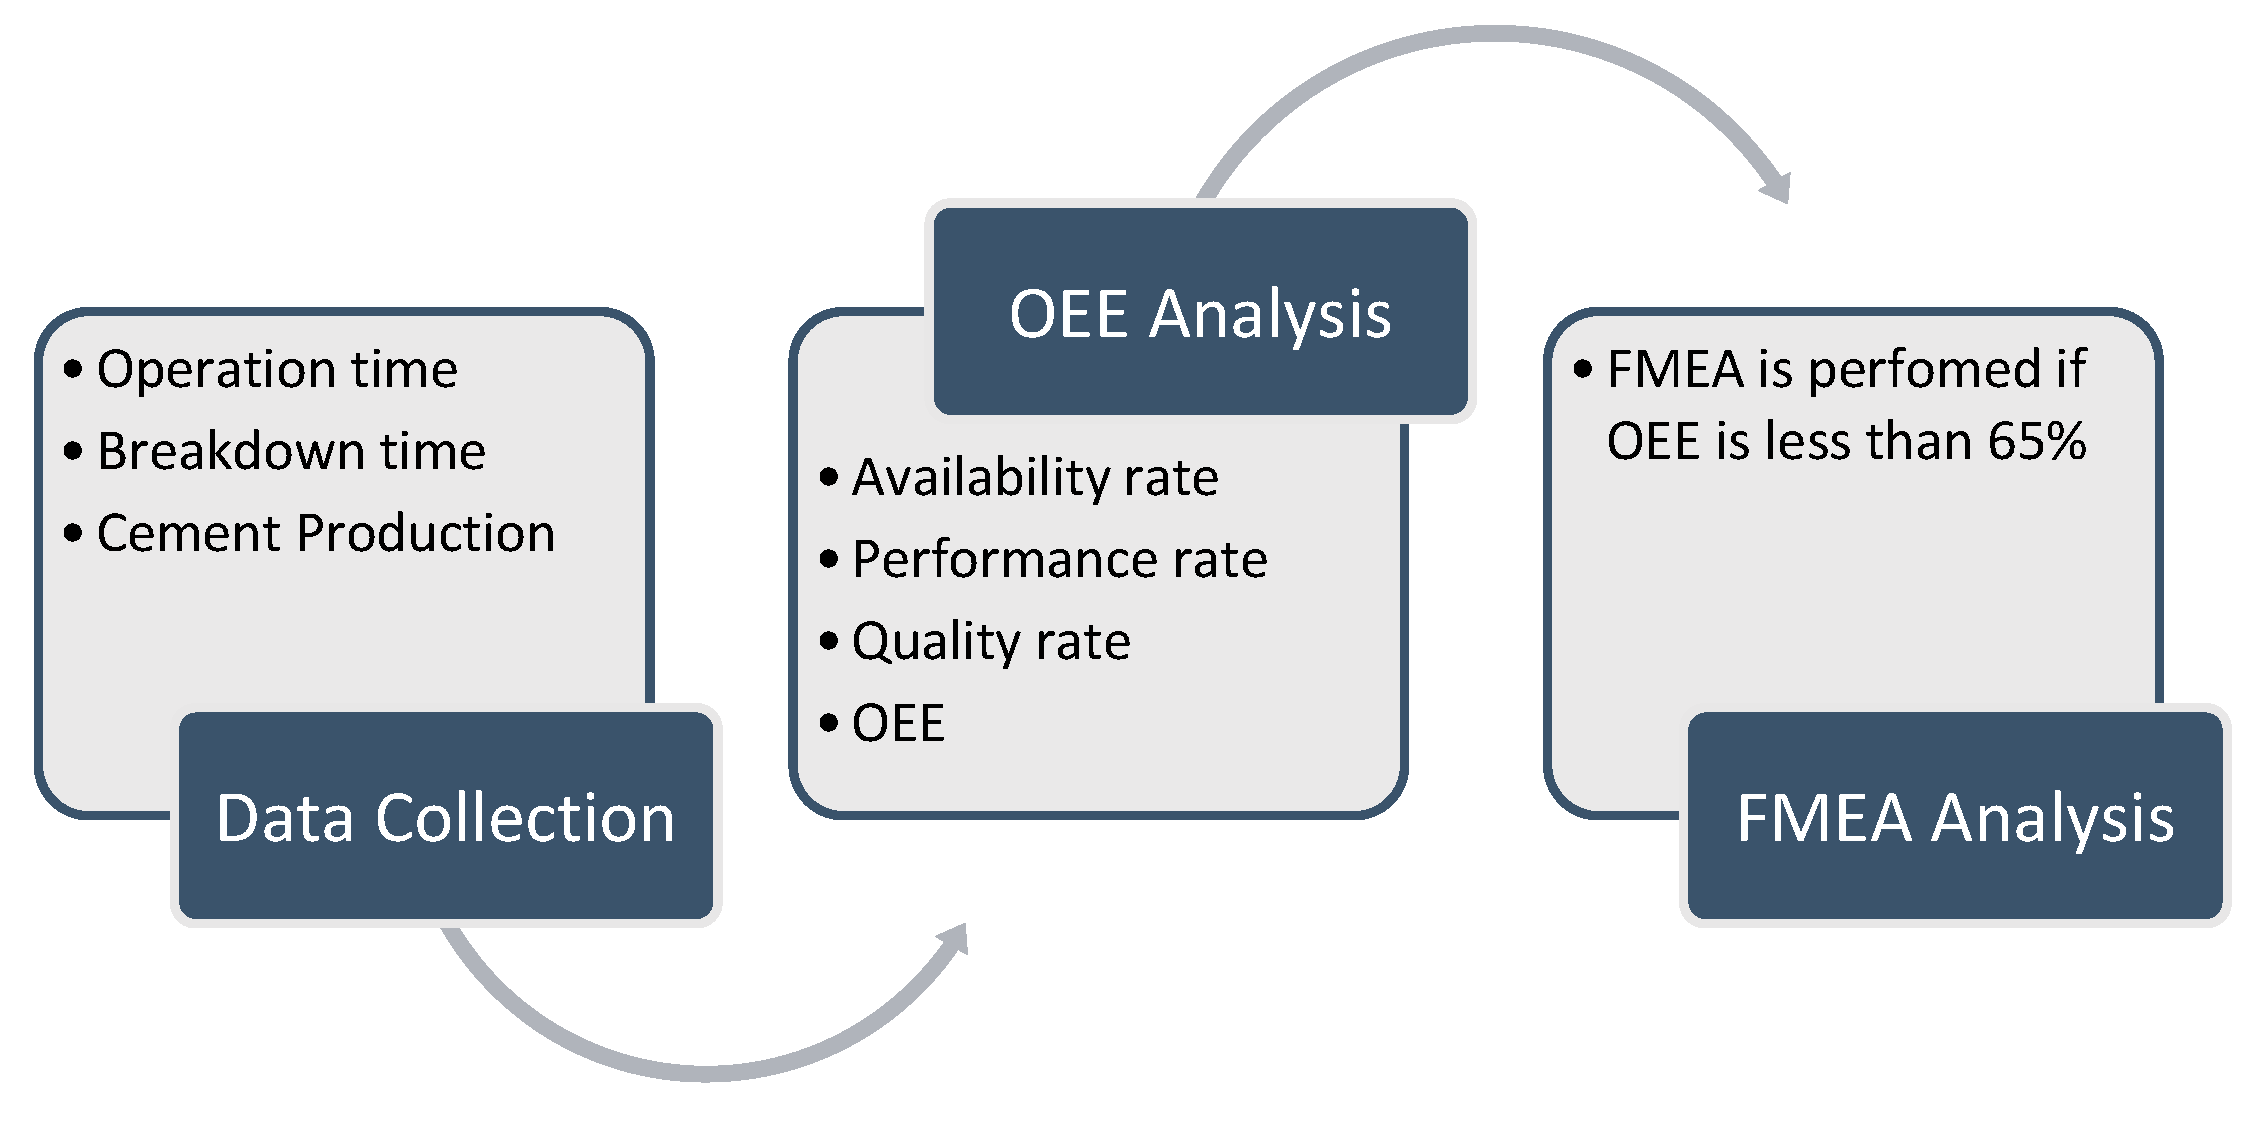
2. Methods
2.1. Data Collection
2.2. OEE
2.2.1. Availability Rate
2.2.2. Performance Rate
2.2.3. Quality Rate
2.3. FMEA
3. Results and Discussions
3.1. Operational Data
3.2. Breakdown Time Data
3.3. Cement Production Data
3.4. Availability Rate
3.5. Performance Rate
3.6. Quality Rate
3.7. OEE
3.8. Failure Mode and Effects Analysis
4. Conclusions
Author Contributions
Funding
Institutional Review Board Statement
Informed Consent Statement
Data Availability Statement
Acknowledgments
Conflicts of Interest
References
- Sari, R.M.; Syahputri, K.; Rizkya, I.; Nadhirah, N. Analysis of raw mill machines maintenance in cement industry. IOP Conf. Ser. Mater. Sci. Eng. 2020, 851, 012051. [Google Scholar] [CrossRef]
- Chaurey, S.; Kalpande, S.D.; Gupta, R.C.; Toke, L.K. A review on the identification of total productive maintenance critical success factors for effective implementation in the manufacturing sector. J. Qual. Maint. Eng. 2023, 29, 114–135. [Google Scholar] [CrossRef]
- Ali, A.Y. Application of total productive maintenance in service organization. Int. J. Res. Ind. Eng. 2019, 8, 176–186. [Google Scholar]
- Rizkya, I.; Sari, R.M.; Syahputri, K.; Tarigan, U. Evaluation of total productive maintenance implementation in manufacture. IOP Conf. Ser. Mater. Sci. Eng. 2021, 1122, 012059. [Google Scholar] [CrossRef]
- Singh, S.; Agrawal, A.; Sharma, D.; Saini, V.; Kumar, A.; Praveenkumar, S. Implementation of total productive maintenance approach: Improving overall equipment efficiency of a metal industry. Inventions 2022, 7, 119. [Google Scholar] [CrossRef]
- Kigsirisin, S.; Pussawiro, S.; Noohawn, O. Approach for TPM evaluation in water productivity: A case study at Mahasawat water treatment plant. Procedia Eng. 2016, 154, 260–267. [Google Scholar] [CrossRef]
- Singh, S.; Khamba, J.S.; Singh, D. Analyzing the role of six big losses in OEE to enhance the performance: Literature review and directions. In Advances in Industrial and Production Engineering; Phanden, R.K., Mathiyazhagan, K., Kumar, R., Paulo Davim, J., Eds.; Lecture Notes in Mechanical Engineering; Springer: Singapore, 2023. [Google Scholar]
- Wardani, I.K.; Atmaji, F.T.D.; Alhilman, J. An autonomous maintenance design based on overall resource effectiveness (ORE) analysis: A case study of paving moulding machine. J. Ilm. Tek. Ind. 2021, 20, 173–183. [Google Scholar] [CrossRef]
- Djunaidi, M.; Athallaric, C.; Munawir, H. The effectiveness level analysis of flask less molding machine using overall equipment effectiveness (oee) as an improvement of machine productivity. J. Ilm. Tek. Ind. 2022, 21, 162–168. [Google Scholar] [CrossRef]
- Hafidh Munawir, H.; Astuti, F.T.; Setiawan, E.; Sufa, M.F. Mitigation of halal risk in the production process of processing beef using the FMEA method in UMKM Dendeng Sapi Asri. War. LPM 2021, 24, 779–787. [Google Scholar]
- Wahyuni, H.C.; Putra, B.I.; Handayani, P.; Maulidah, W.U. Risk assessment and mitigation strategy in the halal food supply chain in the covid-19 pandemic. J. Ilm. Tek. Ind. 2021, 20, 1–8. [Google Scholar] [CrossRef]
- Zuniawan, A. A systematic literature review of failure mode and effect analysis. Indones. J. Ind. Eng. Manag. 2020, 1, 59–68. [Google Scholar]
- Ng Corrales, L.D.C.; Lambán, M.P.; Hernandez Korner, M.E.; Royo, J. Overall equipment effectiveness: Systematic literature review and overview of different approaches. Appl. Sci. 2020, 10, 6469. [Google Scholar] [CrossRef]
- Hansen, R.C. Overall Equipment Effectiveness: A Powerful Production/Maintenance Tool for Increased Profits, 1st ed.; Industrial Press: New York, NY, USA, 2001; p. 12. [Google Scholar]


| Period (Every Week) | Operational Time (Days) | Total Operational Time (Hours) |
|---|---|---|
| 1 (1st s/d 5th August 2023) | 3.6 | 86.4 |
| 2 (6th s/d 12th August 2023) | 5.7 | 136.8 |
| 3 (13th s/d 19th August 2023) | 3.9 | 93.6 |
| 4 (20th s/d 26th August 2023) | 6.5 | 156 |
| 5 (27th s/d 31st August 2023) | 4.3 | 103.2 |
| Total | 24 | 576 |
| Average | 4.8 | 115.2 |
| Period (Every Week) | Total Breakdown Time (Hours) | Breakdown Frequency |
|---|---|---|
| 1 (1st s/d 5th August 2023) | 40.8 | 5.7 |
| 2 (6th s/d 12th August 2023) | 25.2 | 7.9 |
| 3 (13th s/d 19th August 2023) | 47.28 | 8.7 |
| 4 (20th s/d 26th August 2023) | 38.9 | 5.9 |
| 5 (27th s/d 31st August 2023) | 24.48 | 7.5 |
| Total | 137.76 | 35.7 |
| Average | 27.552 | 7.14 |
| Period (Every Week) | Production (Tons) |
|---|---|
| 1 (1st s/d 5th August 2023) | 80.656 |
| 2 (6th s/d 12th August 2023) | 96.698 |
| 3 (13th s/d 19th August 2023) | 83.897 |
| 4 (20th s/d 26th August 2023) | 80.655 |
| 5 (27th s/d 31st August 2023) | 97.032 |
| Total | 438.938 |
| Average | 87.788 |
| Period | Total Available Time (Hours) | Loading Time (Hours) | Operational Time (Hours) | Availability Rate (%) |
|---|---|---|---|---|
| 1 (1st s/d 5th August 2023) | 120 | 118.95 | 116.335 | 97.8 |
| 2 (6th s/d 12th August 2023) | 168 | 168 | 165.55 | 98.5 |
| 3 (13th s/d 19th August 2023) | 168 | 168 | 165.41 | 98.4 |
| 4 (20th s/d 26th August 2023) | 168 | 168 | 164.92 | 98.1 |
| 5 (27th s/d 31st August 2023) | 120 | 117.7 | 111.068 | 94.3 |
| Average | 97.4 | |||
| Period | Production (Tons) | Machine Capacity | Performance Rate (%) |
|---|---|---|---|
| 1 (1st s/d 5th August 2023) | 80.656 | 15,000 | 53.77% |
| 2 (6th s/d 12th August 2023) | 96.698 | 15,000 | 64.47% |
| 3 (13th s/d 19th August 2023) | 73.897 | 15,000 | 49.26% |
| 4 (20th s/d 26th August 2023) | 78.655 | 15,000 | 52.44% |
| 5 (27th s/d 31st August 2023) | 97.032 | 15,000 | 64.69% |
| Average | 56.93% | ||
| Period | Total Production (Tons) | Total Defect (Tons) | Quality Rate (%) |
|---|---|---|---|
| 1 (1st s/d 5th August 2023) | 80.656 | 0 | 100 |
| 2 (6th s/d 12th August 2023) | 96.698 | 0 | 100 |
| 3 (13th s/d 19th August 2023) | 73.897 | 0 | 100 |
| 4 (20th s/d 26th August 2023) | 78.655 | 0 | 100 |
| 5 (27th s/d 31st August 2023) | 97.032 | 0 | 100 |
| Average | 100 | ||
| Period | Performance Rate (%) | Quality Rate (%) | Availability Rate (%) | OEE (%) |
|---|---|---|---|---|
| 1 (1st s/d 5th August 2023) | 53.8 | 100 | 97.8 | 52.59 |
| 2 (6th s/d 12th August 2023) | 64.5 | 100 | 98.5 | 63.53 |
| 3 (13th s/d 19th August 2023) | 55.9 | 100 | 98.5 | 55.07 |
| 4 (20th s/d 26th August 2023) | 53.8 | 100 | 98.2 | 52.78 |
| 5 (27th s/d 31st August 2023) | 64.7 | 100 | 94.4 | 61.04 |
| Average | 57.00 | |||
| Stop Date | Start Date | Description | Major Cause | Cause Detail |
|---|---|---|---|---|
| 1 August 2023 23:36:00 | 2 August 2023 08:27:00 | The kiln was stopped because the carbon brush temperature was high at 180 °C | Idle Time | Gas supply failure |
| 3 August 2023 13:02:00 | 3 August 2023 21:44:00 | BC2 trips simultaneously, idler is not parallel, roller is locked | Electrical/ Instrumentation | Wear/Fatigue |
| 7 August 2023 03:30:00 | 7 August 2023 07:24:00 | BE1 trip OLS | Electrical/ Instrumentation | Outside operational limits |
| 8 August 2023 06:56:00 | 8 August 2023 19:21:00 | Blending silo full | Idle Time | Lack of consumer demand |
| 10 August 2023 16:38:00 | 10 August 2023 17:48:00 | Kiln stop under voltage | Idle Time | Electricity |
| 12 August 2023 16:38:00 | 15 August 2023 01:07:00 | Kiln stop due to 442 4ZA (cyclone 4 ILC) blocking | Idle Time | Power usage |
| 15 August 2023 17:18:00 | 17 August 2023 15:06:00 | Raw mill stop due to kiln stop | Idle Time | Wear/Fatigue |
| 21 August 2023 21:51:00 | 21 August 2023 23:40:00 | Raw mill stopped because there was a large plate blocking the reject hopper 362-FV2 | Idle Time | Power usage |
| 23 August 2023 06:19:00 | 23 August 2023 17:08:00 | Silo full PMS | Mechanical | Lack of consumer demand |
| 26 August 2023 06:19:00 | 26 August 2023 02:34:00 | Manhole hopper 362-BC3 is loose, lots of material coming out | Idle Time | Incorrect installation/parts/materials |
| 26 August 2023 13:52:00 | 26 August 2023 02:34:00 | RM1 stop overload (interlock stop load mill > 4300 kW) landslide material | Production and Proses | Raw material quality |
| 28 August 2023 13:52:00 | 28 August 2023 13:35:00 | Blending silo full | Idle Time | Lack of consumer demand |
| Description | Cause Detail | Solution |
|---|---|---|
| The kiln was stopped because the carbon brush temperature was high at 180 °C | Gas supply failure | Carry out repairs by dumping the outer walls of the kiln, carry out a thorough check on the kiln walls |
| BC2 trips simultaneously, idler is not parallel, roller is locked | Wear/Fatigue | Replace the rollers and balance the idler and rollers regularly to ensure they are in a parallel position and the rollers are working, apply lubricant to the roller bearings, check the quality of the lubricant |
| BE1 Trip Overload | Outside operational limits | Control capacity on BE1 and need to add an overload alarm so that overloads do not occur again |
| Kiln stop under voltage | Electricity | Check the condition of the cable to ensure there are no leaks, repair the cable or replace the cable with a new one |
| Kiln stop because 442 4ZA (cyclone 4 ILC) blocking | Power usage | Set the temperature in the kiln and add an alarm so that the power remains stable and there is no blocking in the cyclone 4 ILC area |
| Raw mill stop due to kiln stop | Wear/Fatigue | Carrying out preventive maintenance to ensure the functioning of the machine and extend the service life of the machine |
| Raw mill stopped because there was a large plate blocking the reject hopper 362-FV2 | Power usage | Thoroughly check the inner edge plate of the hopper, patch/dumping if there is a plate that has become porous |
| Manhole hopper 362-BC3 is loose, lots of material coming out | Incorrect installation/parts/materials | Field workers must be more careful in monitoring hopper 362, so that material from BC3 is not wasted |
| RM1 stop overload (interlock stop load mill > 4300 kW) landslide material | Raw material quality | Installation of overload alarms to prevent overloading and material collapsing |
| Blending silo full | Lack of consumer demand | Carry out product innovation to attract consumer interest, do something better than other companies, for example, in terms of service, product design, payment systems |
Disclaimer/Publisher’s Note: The statements, opinions and data contained in all publications are solely those of the individual author(s) and contributor(s) and not of MDPI and/or the editor(s). MDPI and/or the editor(s) disclaim responsibility for any injury to people or property resulting from any ideas, methods, instructions or products referred to in the content. |
© 2024 by the authors. Licensee MDPI, Basel, Switzerland. This article is an open access article distributed under the terms and conditions of the Creative Commons Attribution (CC BY) license (https://creativecommons.org/licenses/by/4.0/).
Share and Cite
Nugroho, A.C.; Syawitri, T.P.; An’am, R.M. Maintenance Analysis of Raw Mill Machines in Cement Production. Eng. Proc. 2024, 63, 5. https://doi.org/10.3390/engproc2024063005
Nugroho AC, Syawitri TP, An’am RM. Maintenance Analysis of Raw Mill Machines in Cement Production. Engineering Proceedings. 2024; 63(1):5. https://doi.org/10.3390/engproc2024063005
Chicago/Turabian StyleNugroho, Aditya Chandra, Taurista Perdana Syawitri, and Rafi Miftachul An’am. 2024. "Maintenance Analysis of Raw Mill Machines in Cement Production" Engineering Proceedings 63, no. 1: 5. https://doi.org/10.3390/engproc2024063005
APA StyleNugroho, A. C., Syawitri, T. P., & An’am, R. M. (2024). Maintenance Analysis of Raw Mill Machines in Cement Production. Engineering Proceedings, 63(1), 5. https://doi.org/10.3390/engproc2024063005