1. Introduction
A brain–computer interface (BCI), often referred to as a “mind–machine interface” or “neural control interface”, is a revolutionary technology that establishes a direct communication pathway between the human brain and external devices or computer systems. BCIs bridge the gap between the human brain’s electrical activity, as measured through techniques like electroencephalography (EEG) or invasive neural recordings, and the digital world. This groundbreaking interface allows individuals to control and interact with computers, prosthetic devices, or other assistive technologies solely through their thoughts, bypassing the need for traditional physical inputs such as keyboards or mice.
Brain–computer interfaces (BCIs) offer a transformative potential for enhancing societal well-being on multiple fronts. Firstly, in the realm of neurodisease detection, BCIs enable an early and accurate diagnosis of neurological abnormalities by analyzing brainwave patterns. This breakthrough can revolutionize healthcare by facilitating timely interventions and personalized treatments, ultimately improving the quality of life for individuals affected by conditions such as epilepsy, Alzheimer’s disease, etc.
Moreover, BCIs significantly contribute to biofeedback mechanisms, empowering individuals to monitor and regulate their cognitive and emotional states. These biofeedback mechanisms aid in stress reduction, improved concentration, and enhanced emotional well-being, fostering mental health and resilience across diverse populations.
BCIs also serve as indispensable assistive mechanisms for individuals with disabilities. They offer newfound independence to those with mobility impairments by controlling prosthetic limbs, wheelchairs, or communication devices directly through neural signals. This not only enhances their physical autonomy but also fosters a sense of inclusion and equality within society.
Physiology of Brainwave Patterns
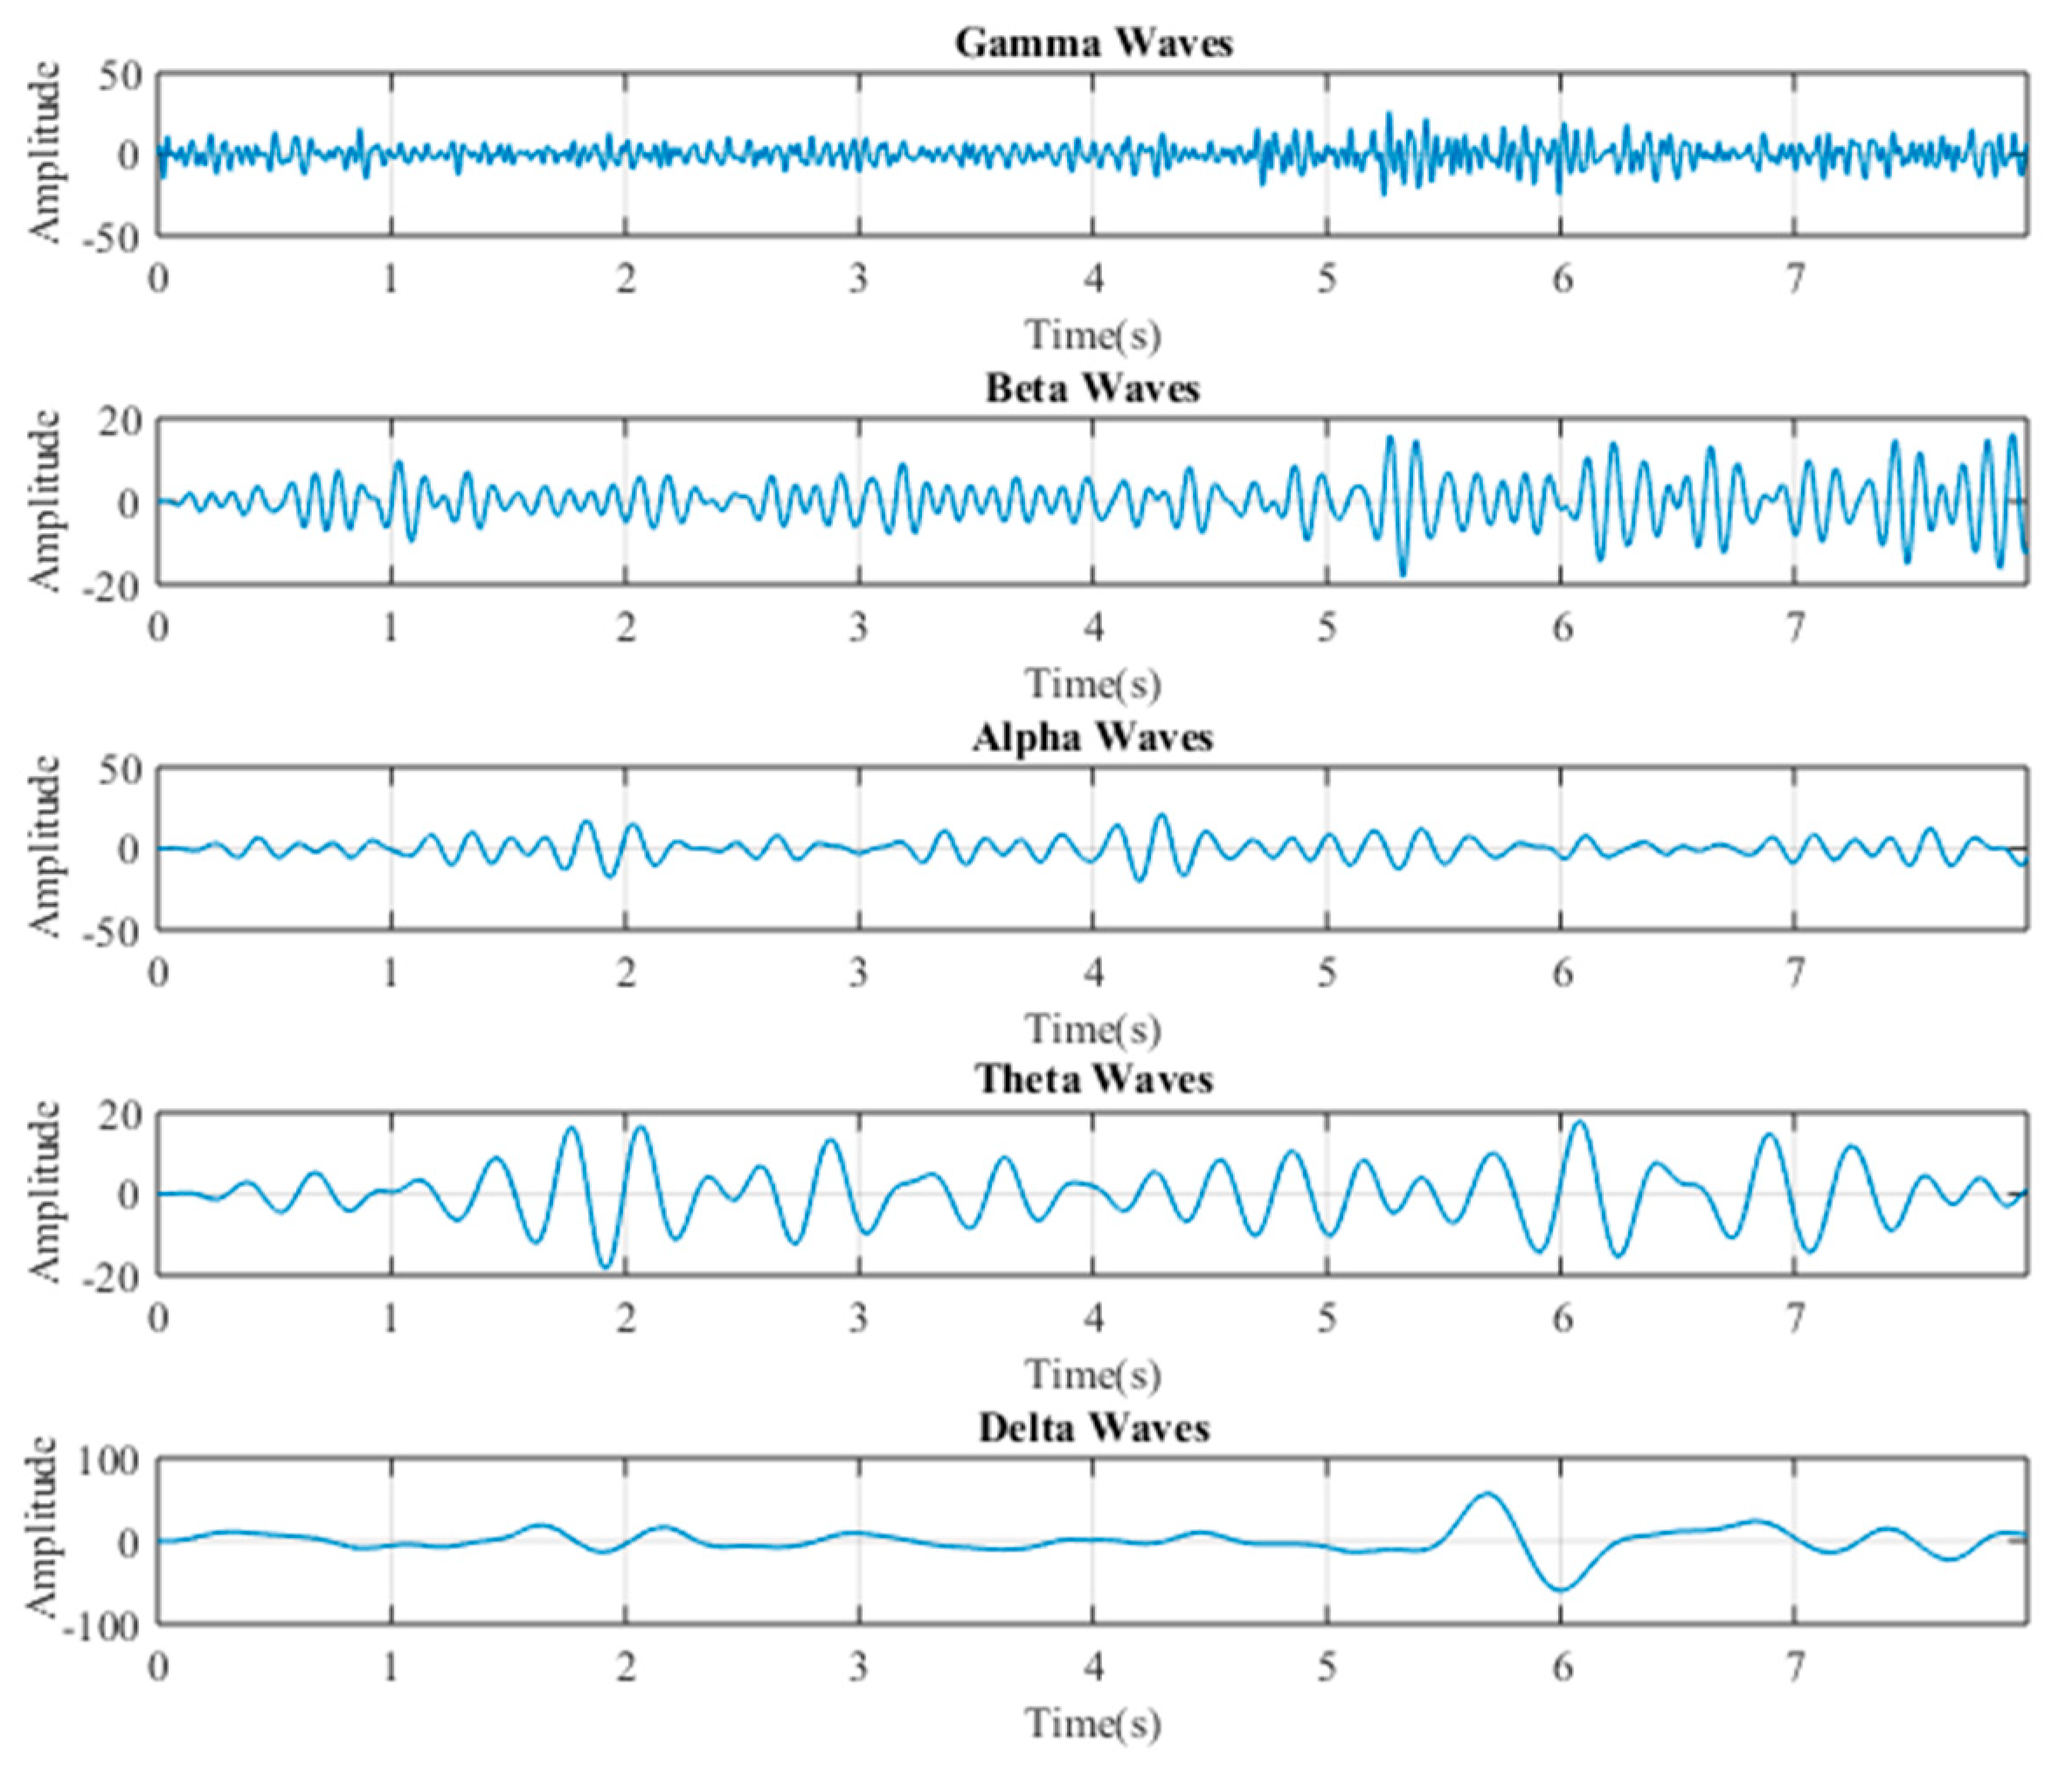
The human brain generates various electrical wave patterns that are quantifiable through electroencephalography (EEG) technology. These waves are categorized based on their frequencies and amplitudes, and each type corresponds to distinct mental states and conditions [
1].
The first wave type, known as delta waves, covers the lowest frequency range of 0.5 to 4 Hz and exhibits the highest amplitude. Delta waves are typically present during deep sleep or in situations involving brain damage or tumors.
The second wave category is theta waves, which fall within the frequency range of 4 to 8 Hz and have a lower amplitude than delta waves. Theta waves are observed during sleep, meditation, and deep relaxation.
Alpha waves represent the third wave type. They have a frequency range of 8 to 13 Hz and a lower amplitude than theta waves. Alpha waves emerge when an individual is awake yet relaxed, such as during meditation or creative thinking.
The fourth type is beta waves, spanning a frequency range of 13 to 30 Hz and featuring a higher amplitude than alpha waves. Beta waves manifest when an individual is awake, alert, and focused, often during activities like problem-solving or mental tasks.
Lastly, the fifth wave category comprises gamma waves, characterized by the highest frequency range, spanning from 30 to 100 Hz and with a lower amplitude than beta waves. Gamma waves come into play during periods of high mental activity, including problem-solving activities, perception, and heightened consciousness.
2. Architecture of Brain–Machine Interface
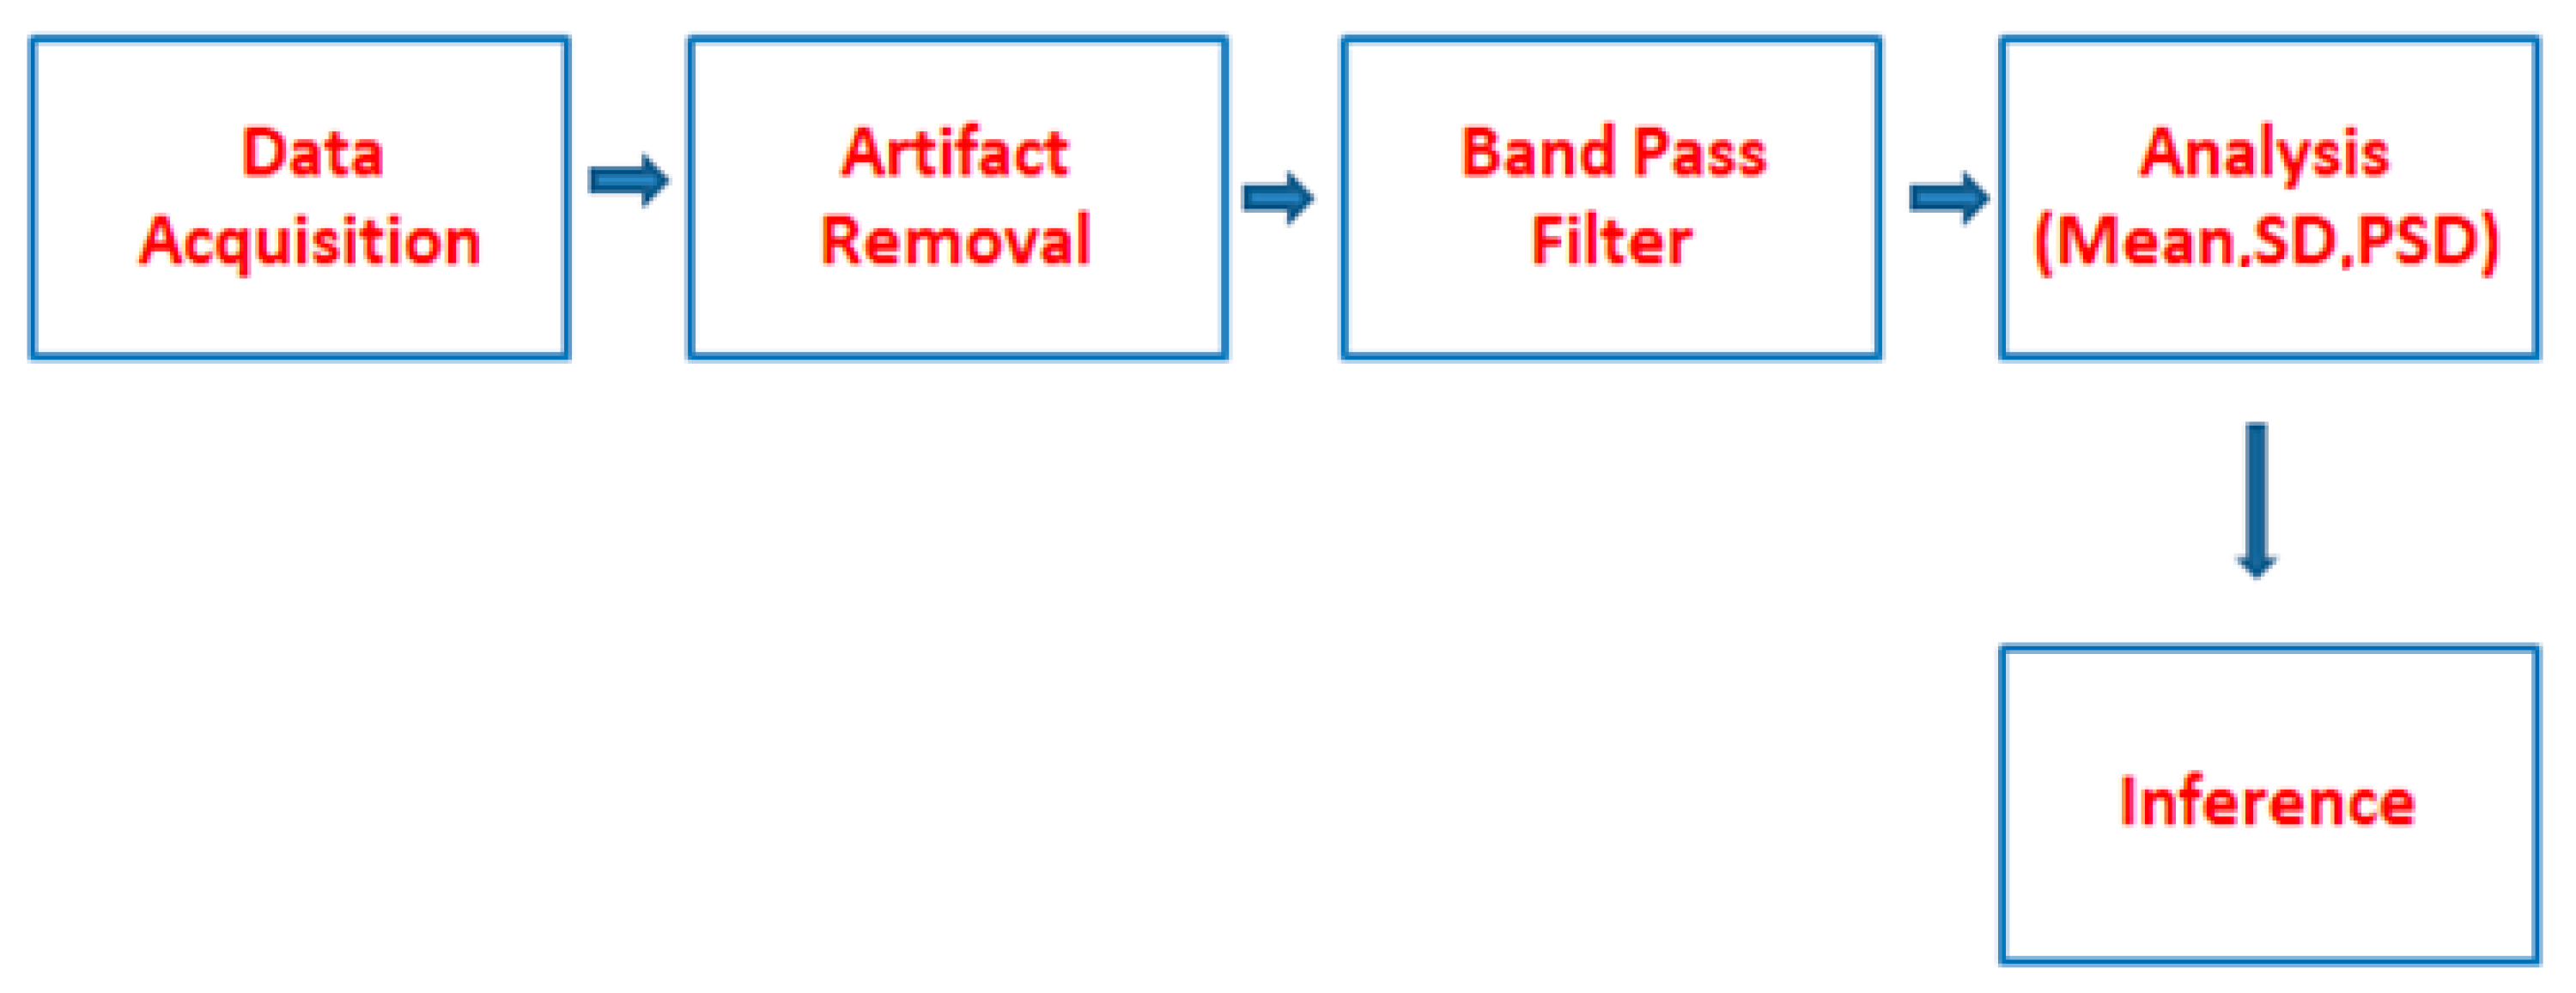
A brain–computer interface (BCI) is a remarkable technology that enables direct communication between the human brain and external devices. As shown in
Figure 1, its block diagram consists of several key stages. Firstly, data acquisition is achieved using the Neurosky Mindwave 2 EEG headset, which captures the brain’s electrical signals. Secondly, an artifact removal process helps eliminate unwanted noise and artifacts from the acquired EEG data, ensuring the accuracy of subsequent analysis. Following this, a bandpass filter is applied to isolate specific frequency ranges of interest. The bandpass filter in a brain–computer interface (BCI) system plays a pivotal role in isolating specific frequency ranges within the acquired electroencephalography (EEG) data. Its primary function is to extract brainwave frequencies of interest while attenuating or removing frequencies outside the desired range. This is essential because the brain generates electrical signals at various frequencies, each associated with different cognitive states and functions. By using the bandpass filter, researchers and engineers can focus on specific frequency bands, such as alpha, beta, theta, or gamma waves, depending on the application’s requirements. These filtered EEG data are then more effectively used in subsequent analysis and interpretation stages of the BCI system, enhancing its accuracy and reliability for tasks like thought recognition, control of external devices, or neurofeedback applications. In the analysis block, critical parameters such as mean, standard deviation, and power spectral density are calculated, providing valuable insights into the brain’s electrical activity patterns. Lastly, in the inference block, these processed data are used to make interpretations or drive actions, facilitating real-time communication or control with external devices (
Figure 2).
3. BCI’s Impact on Society: Real-World Applications
3.1. Enhancing Assistive Technology through BCI
Assistive technology, empowered by brain–computer interfaces (BCIs), represents a groundbreaking frontier in enhancing the lives of individuals with severe physical disabilities [
3]. BCIs enable direct communication between the human brain and external devices, allowing users to control computers, wheelchairs, communication aids, and other assistive tools through their neural signals [
4]. This transformative technology has the potential to restore a sense of independence and autonomy to those with conditions like paralysis, locked-in syndrome, or spinal cord injuries, who may have limited or no control over their motor functions.
3.2. Unlocking the Cognitive Potential—Biofeedback
Biofeedback, in the context of brain–computer interfaces (BCIs), is a process that involves the real-time monitoring and presentation of physiological or neurological information to individuals, allowing them to gain insight and control over their own bodily processes [
5]. BCIs equipped with biofeedback capabilities provide users with immediate feedback regarding their brain activity, often in the form of visual or auditory cues. This feedback helps individuals learn to modulate their neural patterns consciously [
6].
3.3. BCI Studies in Neurophysiological Abnormalities and Brain Disorders
BCI studies have emerged as a promising avenue for investigating neurophysiological abnormalities and brain disorders [
7]. By directly interfacing with the brain’s electrical signals, BCIs offer a unique window into the neural activity underlying various conditions. Researchers can utilize BCIs to study and monitor changes in brainwave patterns, detect anomalies, and explore how these patterns correlate with neurological disorders. This technology has been particularly valuable in conditions like epilepsy, where BCIs can predict and prevent seizures, or in disorders like amyotrophic lateral sclerosis (ALS), by providing a means of communication when motor control is compromised [
8]. Furthermore, BCIs have expanded our understanding of brain disorders such as Alzheimer’s disease, autism spectrum disorders, and Parkinson’s disease by revealing distinctive neural signatures [
9]. As BCIs continue to evolve and become more accessible, they have the potential to unveil new insights, improve diagnostics, and advance treatments for a wide range of neurophysiological abnormalities and brain disorders.
4. Methodology
In this study, we conducted an experiment designed to investigate the intricate relationship between brainwave patterns and varying levels of focus. We leveraged EEG data to capture real-time neural activity, shedding light on how the human brain adapts its oscillatory behavior in response to cognitive demands. These findings pave the way for a deeper understanding of the potential applications of neurofeedback and biofeedback interventions aimed at enhancing concentration, particularly in educational and cognitive enhancement contexts.
In this EEG experiment exploring the association between brainwave patterns and varying levels of focus, a group of ten healthy adult participants (aged 20–30) was recruited and screened for neurological or psychological disorders. The study was carried out in a controlled, distraction-minimized environment where participants were seated comfortably. EEG data were collected using the Neurosky MW2 EEG electrode system, with precise placement on the frontal lobe, i.e., the forehead. To induce differing focus levels, a series of cognitive tasks with varying cognitive demands, ranging from relaxation to complex problem-solving tasks, were employed. Continuous EEG data acquisition at a specified sampling rate was conducted throughout the experiment, with the recorded raw data subsequently undergoing preprocessing to eliminate noise and artifacts. Data segmentation into epochs, corresponding to each cognitive task, enabled the application of fast Fourier transform (FFT) analysis for frequency domain transformation, yielding power spectral density (PSD) values in delta (0.5–4 Hz), theta (4–8 Hz), alpha (8–12 Hz), beta (12–30 Hz), and gamma (30–40 Hz) frequency bands. The classification of focus levels was achieved through subjective self-assessment. EEG data analysis was performed using Neurosky MindWave Version 2.0 and LabView 2021 software, adhering to ethical guidelines and prioritizing participant comfort and safety throughout the study.
5. Results and Discussion
In this experiment, conducted with the use of Neurosky MW2 EEG electrodes, the primary objective was to investigate the relationship between brainwave patterns and varying levels of focus. Ten participants, aged between 20 and 30 years, were recruited for the study. Each participant was seated comfortably in a controlled environment with minimal distractions. EEG electrodes were precisely placed on their scalps according to the manufacturer’s guidelines to ensure accurate data collection.
The EEG data collected from these participants were subsequently analyzed using Neurosky’s dedicated software, which provides information on different brainwave frequencies, including delta, theta, alpha, beta, and gamma waves. The participants’ levels of focus were manipulated and measured at five different points, namely low, medium-low, medium, medium-high, and high attention levels. For each level of focus, the EEG readings, represented in microvolts (µV), were recorded, and the mean and standard deviation were calculated for each brainwave frequency.
The findings from this experiment revealed a noticeable correlation between the participants’ levels of focus and specific brainwave patterns. As focus increased, there was a consistent trend of decreasing delta and theta waves, typically associated with relaxation and daydreaming, while alpha, beta, and gamma waves, linked to alertness and cognitive processing, increased.
The analysis of EEG data in our study provides valuable insights into the brainwave patterns associated with varying levels of focus as shown in
Table 1. Our findings as showin in
Table 2 indicate distinct changes in brainwave activity as the level of focus increases. Notably, the mean power spectral density (PSD) values in decibels (dB) shed light on these alterations in neural activity. In the delta frequency range, which typically represents a state of deep relaxation and sleep, we observed a PSD value of approximately 20.07 dB. As focus levels increased, there was a consistent trend of decreasing delta wave activity. Conversely, in the beta frequency range, associated with alertness and cognitive engagement, the mean PSD value was approximately 13.84 dB, indicating heightened brain activity during periods of high focus. Our results further support the notion that the human brain adapts its neural oscillations in response to cognitive demands. These findings underscore the potential for neurofeedback and biofeedback interventions to optimize cognitive performance and enhance focus levels, particularly in educational and clinical settings.
6. Conclusions
In conclusion, the exploration of brainwaves and the evolution of brain–computer interfaces (BCIs) have opened up a remarkable frontier for societal betterment. The discussion presented here illuminates the vast potential of BCIs across a myriad of applications, ranging from assisting individuals with disabilities to deepening our understanding of neurological disorders and enhancing cognitive abilities [
10]. The transformative impact of BCIs on society becomes ever more apparent. The EEG experiment’s results, which correlated distinct brainwave patterns with different levels of focus, offer a promising avenue for the development of a biofeedback-based concentration enhancement program for students. By leveraging the real-time monitoring of brainwave activity and providing feedback, this program can empower students to improve their concentration during classroom learning, study sessions, and test preparation. Additionally, it holds potential benefits for students with attention-related disorders, contributing to better academic performance and enhanced learning experiences.
Author Contributions
Conceptualization, H.S.S.V. and R.K.; methodology, H.S.S.V.; software, H.S.S.V.; validation, H.S.S.V., R.K. and P.P.; formal analysis, H.S.S.V.; investigation, H.S.S.V.; resources, H.S.S.V.; data curation, H.S.S.V.; writing—original draft preparation, H.S.S.V.; writing—review and editing, H.S.S.V.; visualization, H.S.S.V.; supervision, H.S.S.V.; project administration, H.S.S.V.; funding acquisition, R.K. All authors have read and agreed to the published version of the manuscript.
Funding
This research received no external funding.
Institutional Review Board Statement
Not applicable.
Informed Consent Statement
Ethical review and approval were waived for this study due to the fact that it involved non-invasive measurements of EEG waves in normal individuals without any interventions or potential risks to their well-being. EEG (Electroencephalography) is a safe and widely used technique for recording electrical activity of the brain and is routinely employed in research settings without posing any significant physical risks or discomfort to participants. Since the study exclusively focused on observing EEG patterns in healthy subjects without any invasive procedures or potential harm, it was deemed to present minimal or negligible ethical concerns by the relevant authorities, thus justifying the waiver of ethical review and approval.
Data Availability Statement
Due to privacy and ethical restrictions, the data for this study is unavailable for sharing.
Conflicts of Interest
The authors declare no conflicts of interest.
References
- Abhang, P.A.; Gawali, B.W.; Mehrotra, S.C. Chapter 2. In Introduction to EEG- and Speech-Based Emotion Recognition; Academic Press: Cambridge, MA, USA, 2016; pp. 19–50. [Google Scholar]
- Hossan, A.; Chowdhury, A.M. Real Time EEG Based Automatic Brainwave Regulation by Music. In Proceedings of the 2016 5th International Conference on Informatics, Electronics and Vision (ICIEV), Dhaka, Bangladesh, 13–14 May 2016. [Google Scholar] [CrossRef]
- Herwig, U.; Satrapi, P.; Schönfeldt-Lecuona, C. Using the international 10–20 EEG system for positioning of transcranial magnetic stimulation. Brain Topogr. 2003, 16, 95–99. [Google Scholar] [CrossRef] [PubMed]
- Metsomaa, J.; Sarvas, J.; Ilmoniemi, R.J. Blind Source Separation of Event-Related EEG/MEG. IEEE Trans. Biomed. Eng. 2017, 64, 2054–2064. [Google Scholar] [CrossRef] [PubMed]
- Byvatov, E.; Schneider, G. Support vector machine applications in bioinformatics. Appl. Bioinform. 2003, 2, 67–77. [Google Scholar]
- Sharma, A.; Kaur, S.; Memon, N.; Fathima, A.J.; Ray, S.; Bhatt, M.W. Alzheimer’s patients detection using support vector machine (SVM) with quantitative analysis. Neurosci. Inform. 2021, 1, 100012. [Google Scholar] [CrossRef]
- Abiyev, R.H.; Akkaya, N.; Aytac, E.; Günsel, I.; Çağman, A. Brain-Computer Interface for Control of Wheelchair Using Fuzzy Neural Networks. BioMed Res. Int. 2016, 2016, 9359868. [Google Scholar] [CrossRef] [PubMed]
- Young, M.J.; Lin, D.J.; Hochberg, L.R. Brain-Computer Interfaces in Neurorecovery and Neurorehabilitation. Semin. Neurol. 2021, 41, 206–216. [Google Scholar] [CrossRef] [PubMed]
- Chatterjee, A.; Aggarwal, V.; Ramos, A.; Acharya, S.; Thakor, N.V. A brain-computer interface with vibrotactile biofeedback for haptic information. J. NeuroEng. Rehabil. 2007, 4, 40. [Google Scholar] [CrossRef] [PubMed]
- Lim, C.G.; Lee, T.S.; Guan, C.; Fung, D.S.; Zhao, Y.; Teng, S.S.; Zhang, H.; Krishnan, K.R. A brain-computer interface based attention training program for treating attention deficit hyperactivity disorder. PLoS ONE 2012, 7, e46692. [Google Scholar] [CrossRef] [PubMed]
| Disclaimer/Publisher’s Note: The statements, opinions and data contained in all publications are solely those of the individual author(s) and contributor(s) and not of MDPI and/or the editor(s). MDPI and/or the editor(s) disclaim responsibility for any injury to people or property resulting from any ideas, methods, instructions or products referred to in the content. |
© 2024 by the authors. Licensee MDPI, Basel, Switzerland. This article is an open access article distributed under the terms and conditions of the Creative Commons Attribution (CC BY) license (https://creativecommons.org/licenses/by/4.0/).


