Abstract
Antimicrobial resistance (AMR) is a significant global concern that endangers human health. To overcome this resistance, β-lactames are used in combination with β -lactamase inhibitors to bypass the enzymatic action. The current study incorporates the techniques of machine learning to cluster the patterns of the proteins which may be antibiotic resistant. K-Means Clustering is applied along with PCA analysis, to verify and validate the model’s accuracy where Mean Clustering Analysis was used to validate the number of clusters formed. The result showed 3 clusters in Class A and 4 clusters in Class B representing various characteristics of these mutants.
1. Introduction
Antimicrobial resistance (AMR) refers to the ability of bacteria and fungi to withstand the effects of medications designed to eliminate them. This phenomenon occurs when these pathogens adapt and become resistant to drugs. Treating infections caused by resistant microorganisms becomes difficult and sometimes even impossible [1,2,3]. In 2019, 1.27 million deaths were directly attributable to resistance. Six pathogens were each responsible for more than 250,000 deaths associated with AMR: E. coli, Staphylococcus aureus, K. pneumoniae, S. pneumoniae, Acinetobacter baumannii, and Pseudomonas aeruginosa, by order of number of deaths. Five regions had all-age death rates associated with bacterial AMR higher than 75 per 100,000: all four regions of sub-Saharan Africa and south Asia [4,5]. Figure 1 represents what antibiotics are currently in use and their share in the market. β-lactam antibiotics, such as penicillin and cephalosporins, are widely used in the field of antibiotics. As a result, the integrity of the bacterial cell wall is compromised, leading to cell lysis and ultimately bacterial death [6].
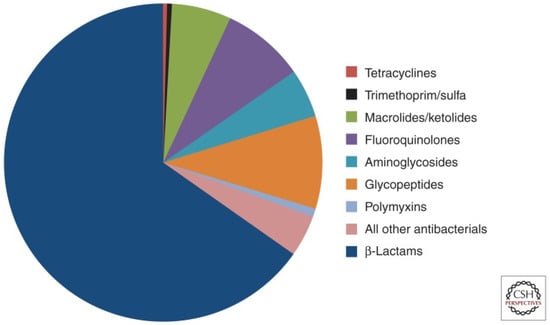
Figure 1.
Proportion of prescriptions in the United States for injectable antibiotics from 2004 to 2014.
2. Literature Review
2.1. Resistance to β-Lactam Drugs
Bacteria can develop resistance through numerous mechanisms. Firstly, they can modify the active sites of proteins that bind to penicillin. Secondly, resistance can occur when the porin proteins in the outer membrane of Gram-negative bacterial cell walls undergo changes, impairing the passage of β-lactam antibiotics or their interaction with “penicillin-binding proteins” on the inner membrane [7]. Thirdly, bacteria can possess “multicomponent drug efflux pump systems (mex)” that actively transport a range of substances outside the periplasm of Gram-negative bacteria, either through acquired external factors or as intrinsic trait [8,9,10].
2.2. β-Lactamase Enzymes
Bacteria have the capacity to produce β-lactamases, which are enzymes capable of degrading and rendering β-lactam antibiotics, such as penicillins, cephalosporins, and carbapenems, ineffective. Based on their genetic characteristics, β-lactamases can be classified as Class A β-lactamases: they can be effectively suppressed by β-lactamase inhibitors such as clavulanic acid. Subtypes include the following: “-TEM (e.g., TEM-1, TEM-2), SHV (e.g., SHV-1, SHV-2), CTX m (e.g., CTX-M- 15, CTX-M-14)” and Class B β-lactamases.
These enzymes, also known as metallo-β-lactamases, depend on the presence of metal ions, such as zinc, to exhibit their enzymatic activity. Subtypes include the following: IMP (e.g., IMP-1, IMP-2), VIM (e.g., VIM-1, VIM-2), NDM (e.g., NDM-1, NDM-2) [11,12]. Most AmpC-lactamases are plasmid-mediated and contain resistance genes for various kinds of antibiotics. The most well-researched antibiotic resistance enzymes are TEM-lactamases. They work by hydrolyzing the lactam ring found in antibiotics like cephalosporins, penicillin, and similar substances [13].
2.3. β-Lactamase Inhibitors and Inhibitor Resistance in Class A and Class B β-Lactamases
β-lactamase inhibitors, such as clavulanic acid, are effective at inhibiting β-lactamase. They primarily work through two main mechanisms: high-affinity binding of substrates to the β-lactamase enzyme and irreversible inactivation of the enzyme through secondary chemical reactions within the active site. Common inhibitors, including clavulanic acid, sulbactam, and tazobactam, act through the former mechanism of action [14,15]. The omega loop, a structural component present in class A β-lactamases, plays a crucial role in facilitating the binding of β-lactam antibiotics and β-lactamase inhibitors. As a result, the binding affinity of the inhibitor is diminished. Consequently, this increased flexibility could alleviate steric hindrance between the omega loop and the bulky 7b-side chain of ceftazidime, ultimately improving ceftazidime’s accessibility to the binding pockets of β-lactamases [16,17]. These mutations hinder the inhibitor’s ability to bind to the zinc ion, thereby impeding its capacity to inhibit the enzyme’s activity [18]. EDTA (ethylene diamine tetraacetic acid) is a frequently utilized inhibitor for metallo-β-lactamases (MBLs) which functions by chelating the vital zinc ions required for the catalytic activity of MBLs [19].
2.4. Machine Learning in AMR Research
Over the past two decades, AI and ML have been used for several healthcare applications, one of them being antimicrobial resistance. The focus of ML in AMR research is basically towards the development of medication, forecasting treatment, epidemic pattern detection, clinical microbiology, analysis of bacterial genomes, or proposing new drug treatment strategies.
3. Methodology
3.1. Dataset Retrieval
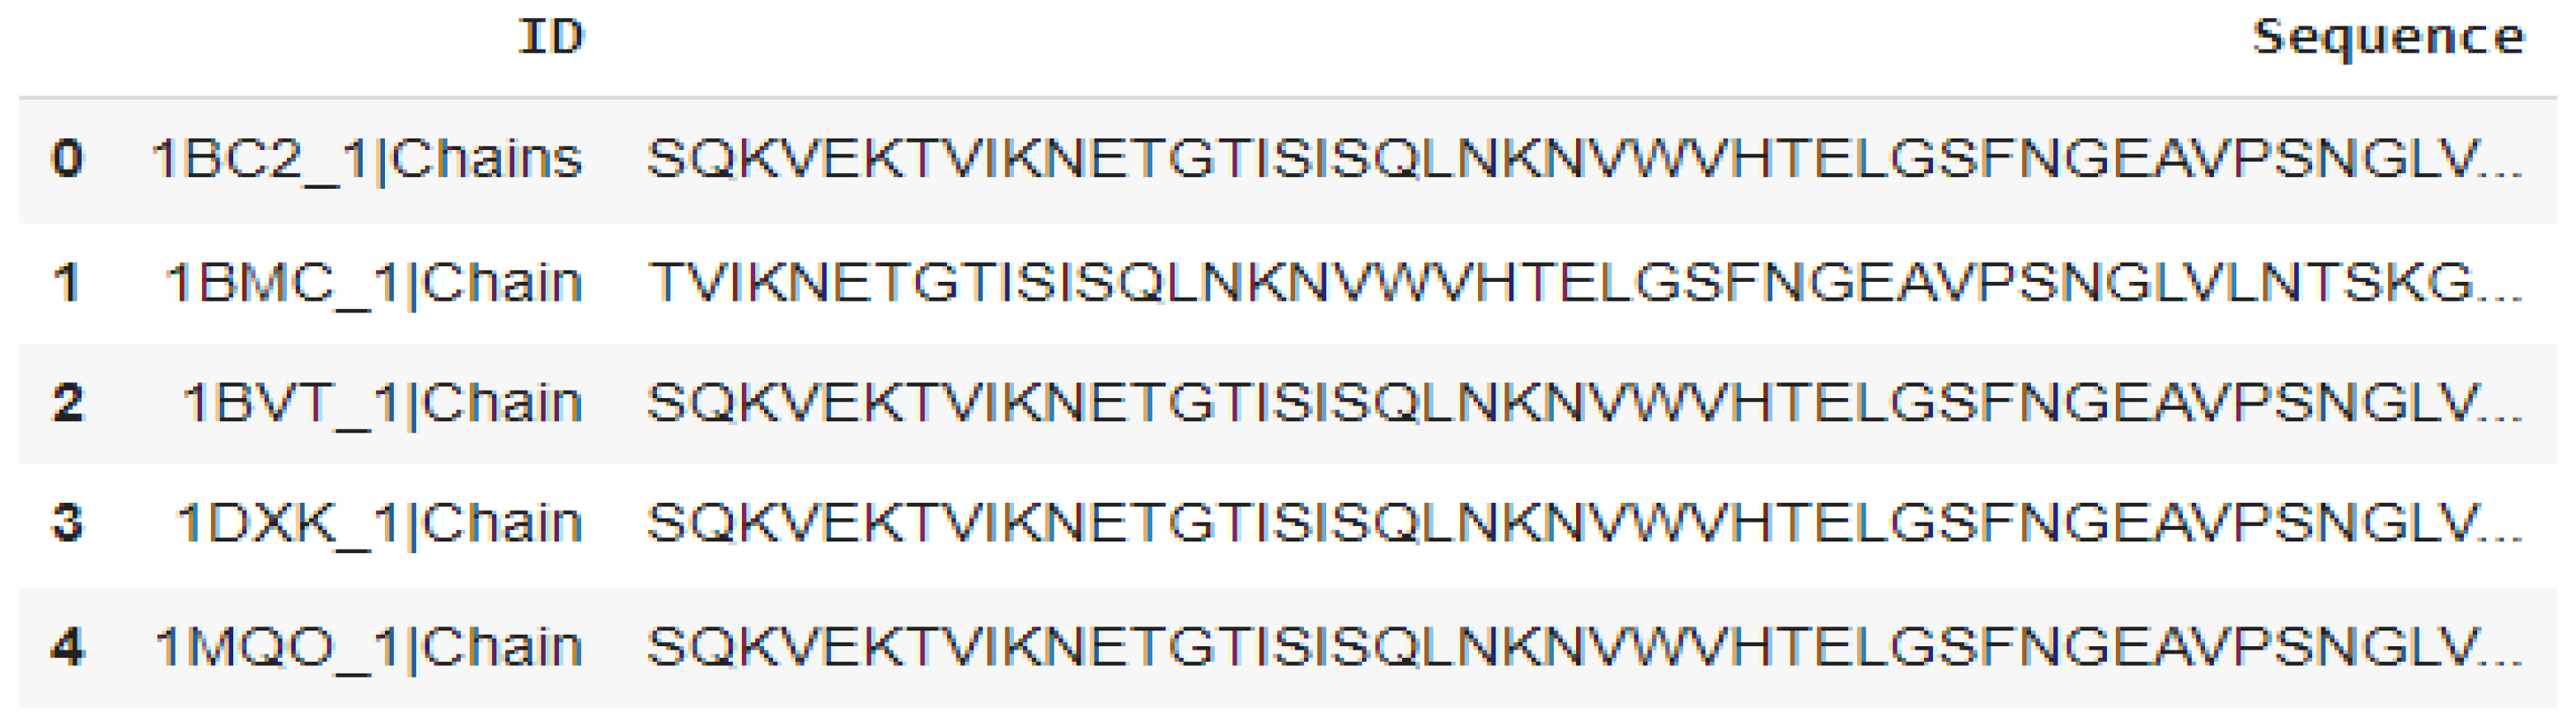
A comprehensive list of all β-lactamases is found in the β-Lactamase database [20] “BLDB is a database that compiles sequence information as well as biochemical and structural information on all the currently known β-lactamases” [20]. The third column of that database was retrieved into a csv file. This csv file was fed into the downloads page of RCSB PDB to obtain a single fasta file containing all the sequences [20]. The first column of the dataset refers to the pdb code of the β-lactamase and the second column contains the protein sequence. “Statistics (number of structures): Overall (1540); Class A (579); subClass B1 (364); subclass B2 (15); subclass B3 (97)”; [21]. Figure 2 shows the first row of the Class B dataset.
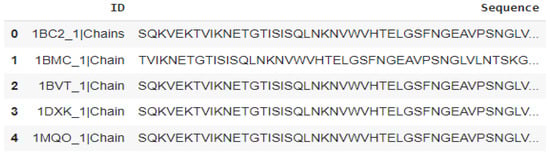
Figure 2.
A few rows of Class B dataset retrieved using the panda’s library.
3.2. Data Preprocessing and Visualization
Data encoding is an essential process that enables the representation and storage of information in a format suitable for algorithmic processing and comprehension. To use an algorithm on data, we need to convert the sequence data into numerical data and normalize them. This encoding technique was utilized to transform a set of textual data into a matrix that represents the frequency of tokens. PCA (principal component analysis) is a popular technique used for dimensionality reduction in data analysis. One of the benefits of PCA is that it can be used for data visualization. Alternatively, if there are data points that are outliers in the reduced space, we can investigate these data points to understand why they vary from the rest.
3.3. Algorithm
K-Means Clustering
K-means is a popular clustering algorithm that is highly favored for its efficiency, simplicity, and ability to effectively address the widely known clustering problem. The fundamental idea behind the algorithm is to define k centers, representing k clusters, in such a way that they are placed far apart from each other since different locations of centers can result in different outcomes [22].
3.4. Determining K Value Using Elbow and Silhouette Plots
3.4.1. Elbow Plot and Silhouette Plot
The elbow method is a commonly employed technique in cluster analysis for identifying the most suitable number of clusters in a dataset. Therefore, the graph of explained variation versus the number of clusters will increase rapidly up to k, representing the under-fitting region, and then increase slowly after k, representing the over-fitting region. By selecting the elbow point, we can strike a balance between fitting the data well and avoiding overfitting, thereby obtaining the optimal number of clusters for the dataset. A silhouette plot is a visualization tool used to evaluate the quality of clustering results, with well-separated clusters having high silhouette coefficients and clusters that overlap or having low silhouette coefficients that are poorly separated. By inspecting the silhouette plot, we can assess the appropriateness of the number of clusters and identify potential misclassifications or outliers.
3.4.2. Validation of Clusters Using Phylogenetic Tree
Multiple sequence alignment (MSA) is the process of arranging multiple biological sequences (such as DNA, RNA, or protein sequences) in a way that aligns the corresponding positions of similarity or homology [23]. The goal is to identify conserved regions, insertions, deletions, and other structural or functional motifs shared among the sequences. MSA provides insights into sequence conservation and evolutionary relationships [23]. The MSA tool we used is CLUSTALW. With this, we constructed a phylogenetic tree. A phylogenetic tree for protein sequences is a graphical representation that illustrates the evolutionary relationships among different proteins. It depicts how proteins have diverged from a common ancestor and how they have evolved over time.
4. Results
4.1. Results for Class-A
Upon comparison of the silhouette plots after count vectorizer and tokenizer encoding, we found that count vectorizer encoded data are prone to giving more negative scores than tokenizer encoded data. The following elbow plot in Figure 3 shows the plot for clusters.
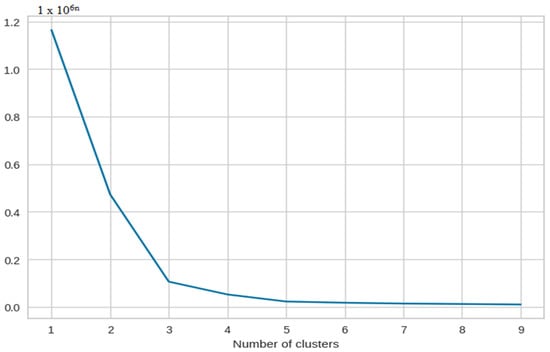
Figure 3.
The X-axis is principal component 1 and the Y-axis is principal component 2.
4.1.1. Feature Engineering (Dimensionality Reduction)
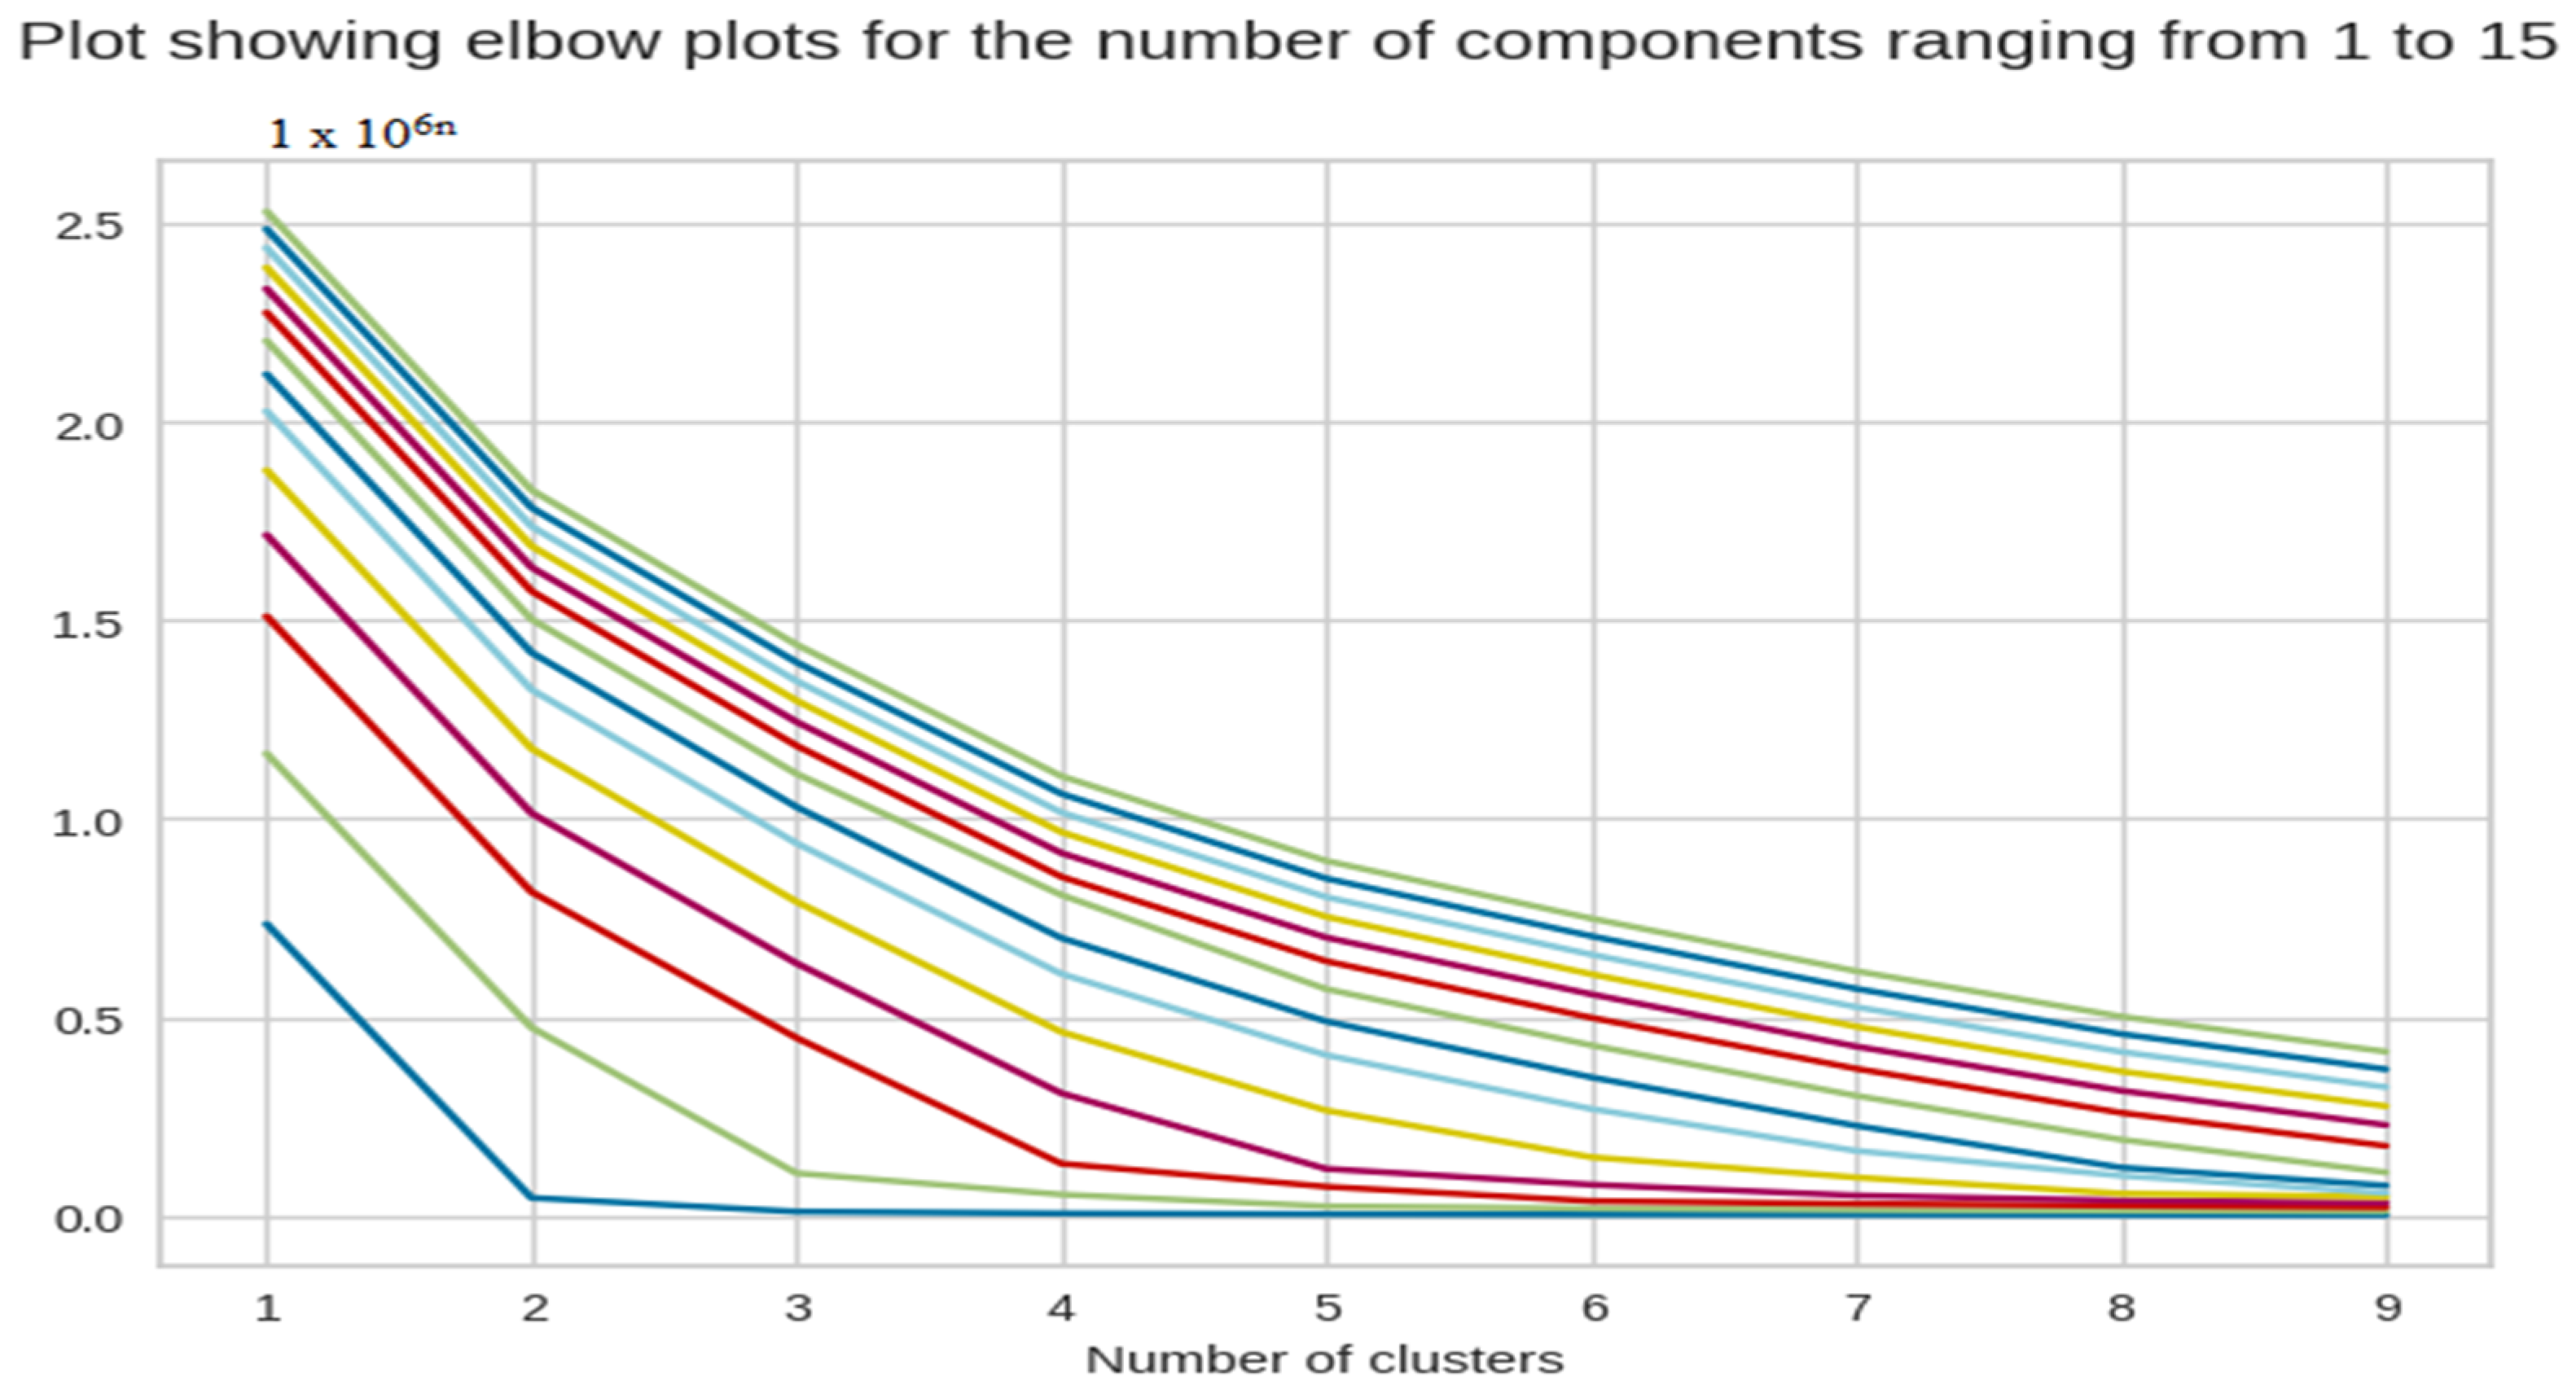
We tested the number of components in PCA from 1 to 15 to try and determine the optimal number of components. This way, we could reduce the number of dimensions without having to compromise on the efficiency, which can be seen in Figure 4.
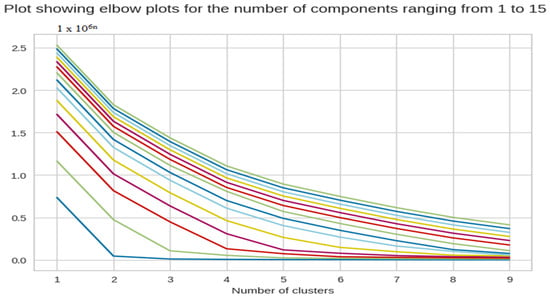
Figure 4.
The X-axis of the plot is the number of clusters and the Y-axis is the Within Clusters Sum of Squares (WCSS) for each number of clusters.
4.1.2. Performance of Clusters (Silhouette Plots)
From the scores alone, we can identify that the ideal number of clusters is 3.
The result from the plots can be seen from Figure 5. The silhouette analysis result for the two-component dataset is shown in Table 1.
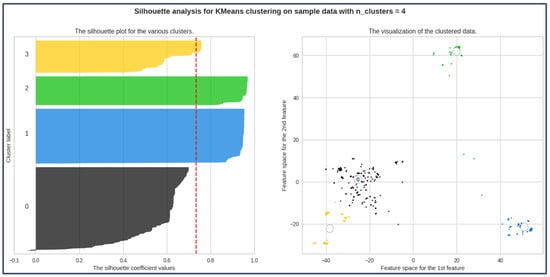
Figure 5.
Highest avg silhouette_score; silhouette coefficient values for all labels > 0.

Table 1.
Average silhouette score for Class A.
4.1.3. Validation of Clusters
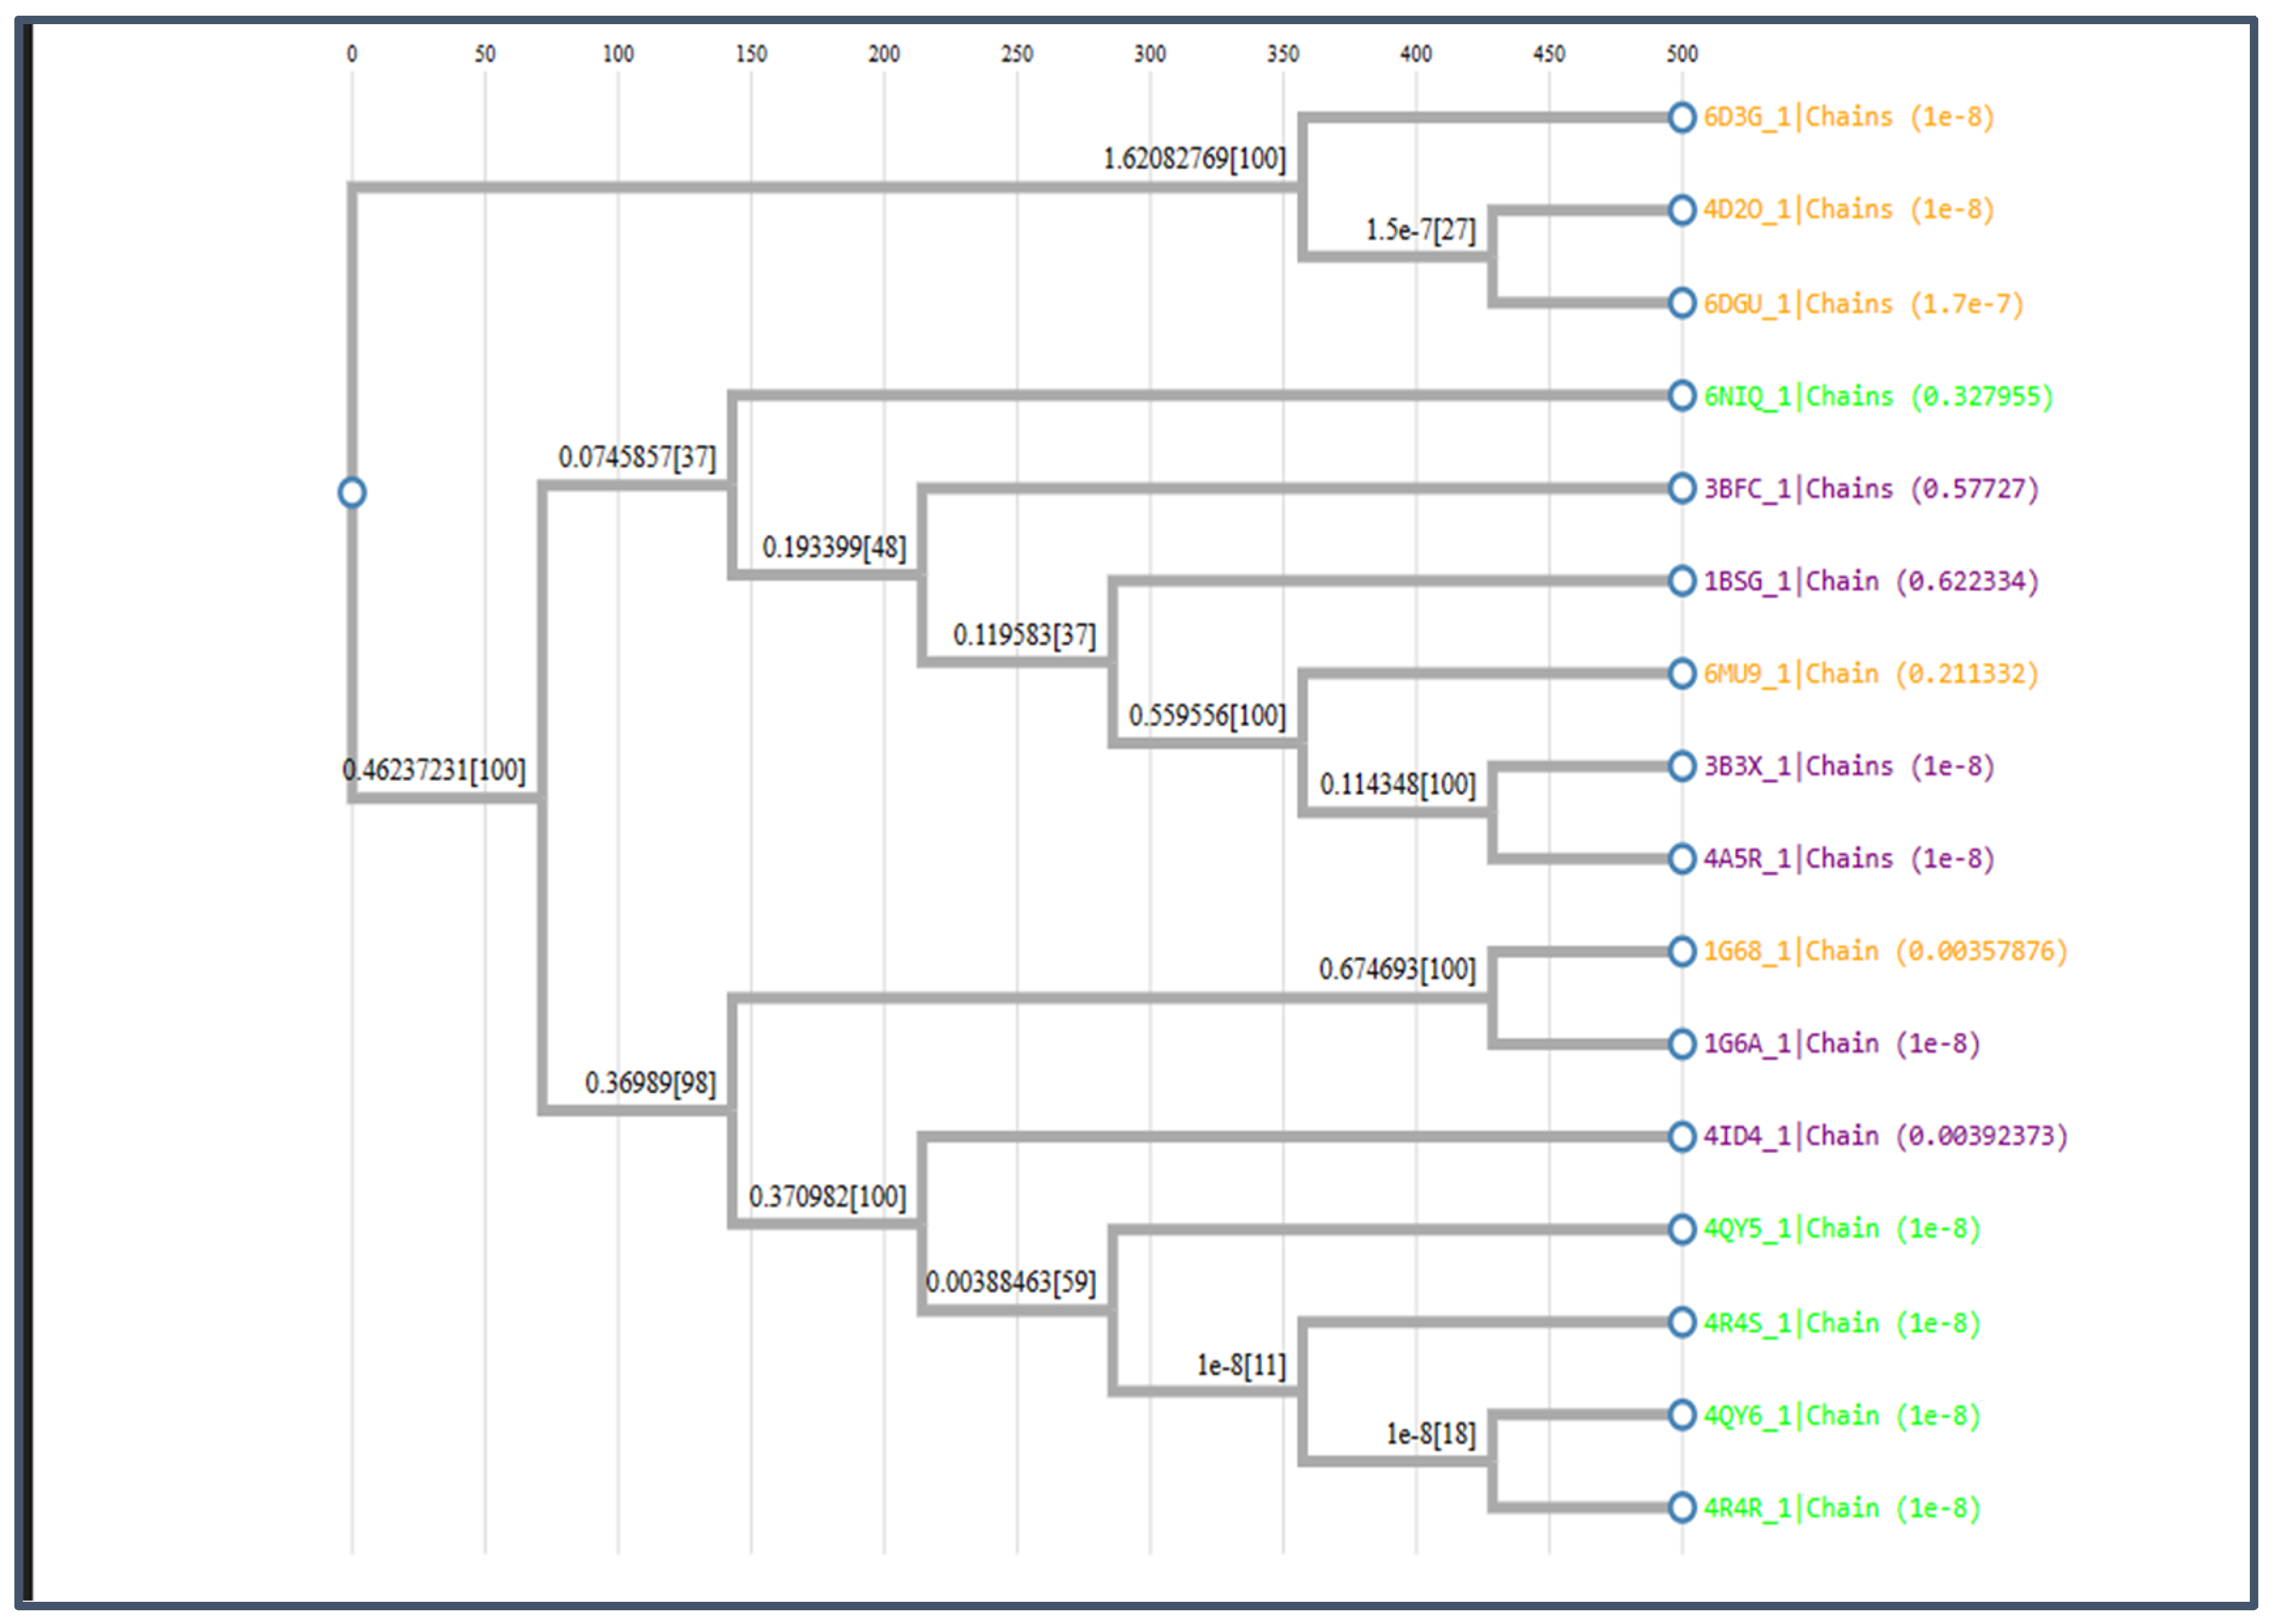
MSA was performed to validate the cluster performance. A phylogenetic tree was constructed, as shown in Figure 6.
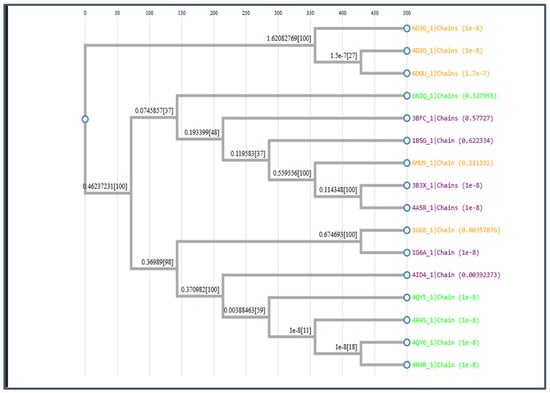
Figure 6.
Describes the phylogenetic tree to validate cluster performance.
4.2. Results for Class-B
Upon comparison of silhouette plots after count vectorizer and tokenizer encoding, we found that count vectorizer encoded data are prone to giving more negative scores than tokenizer encoded data. Hence, we decided to use the tokenizer encoding.
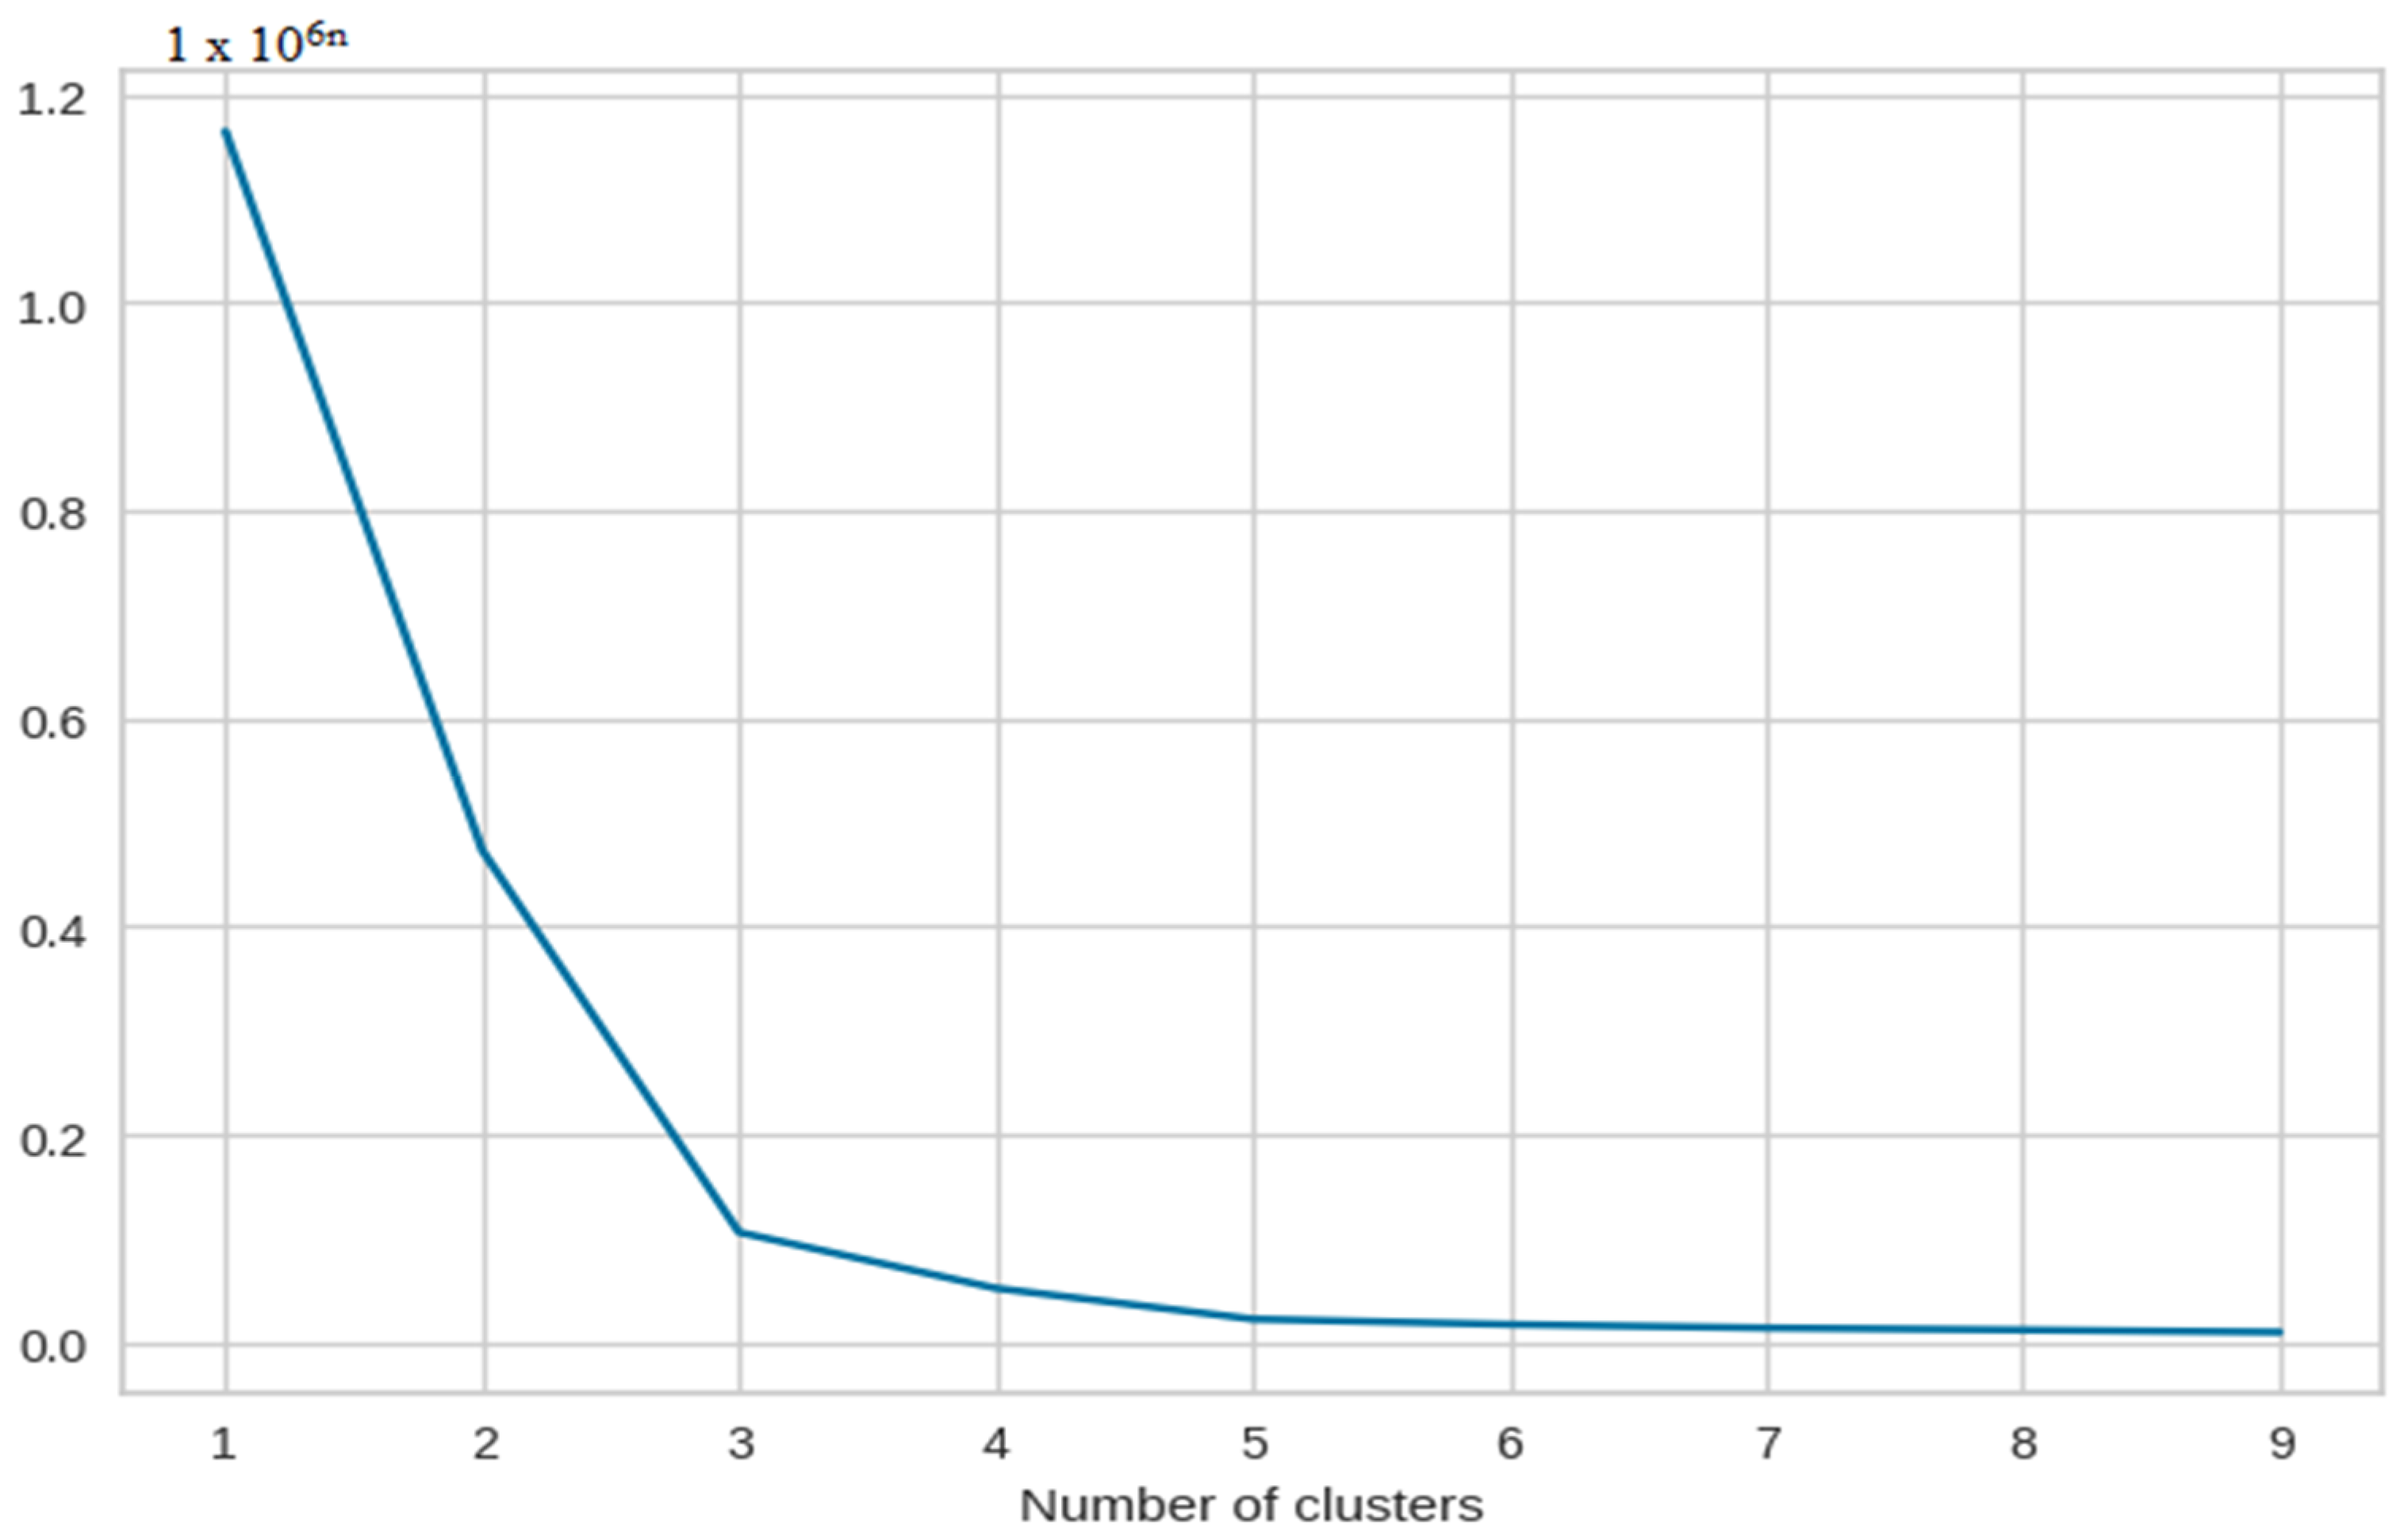
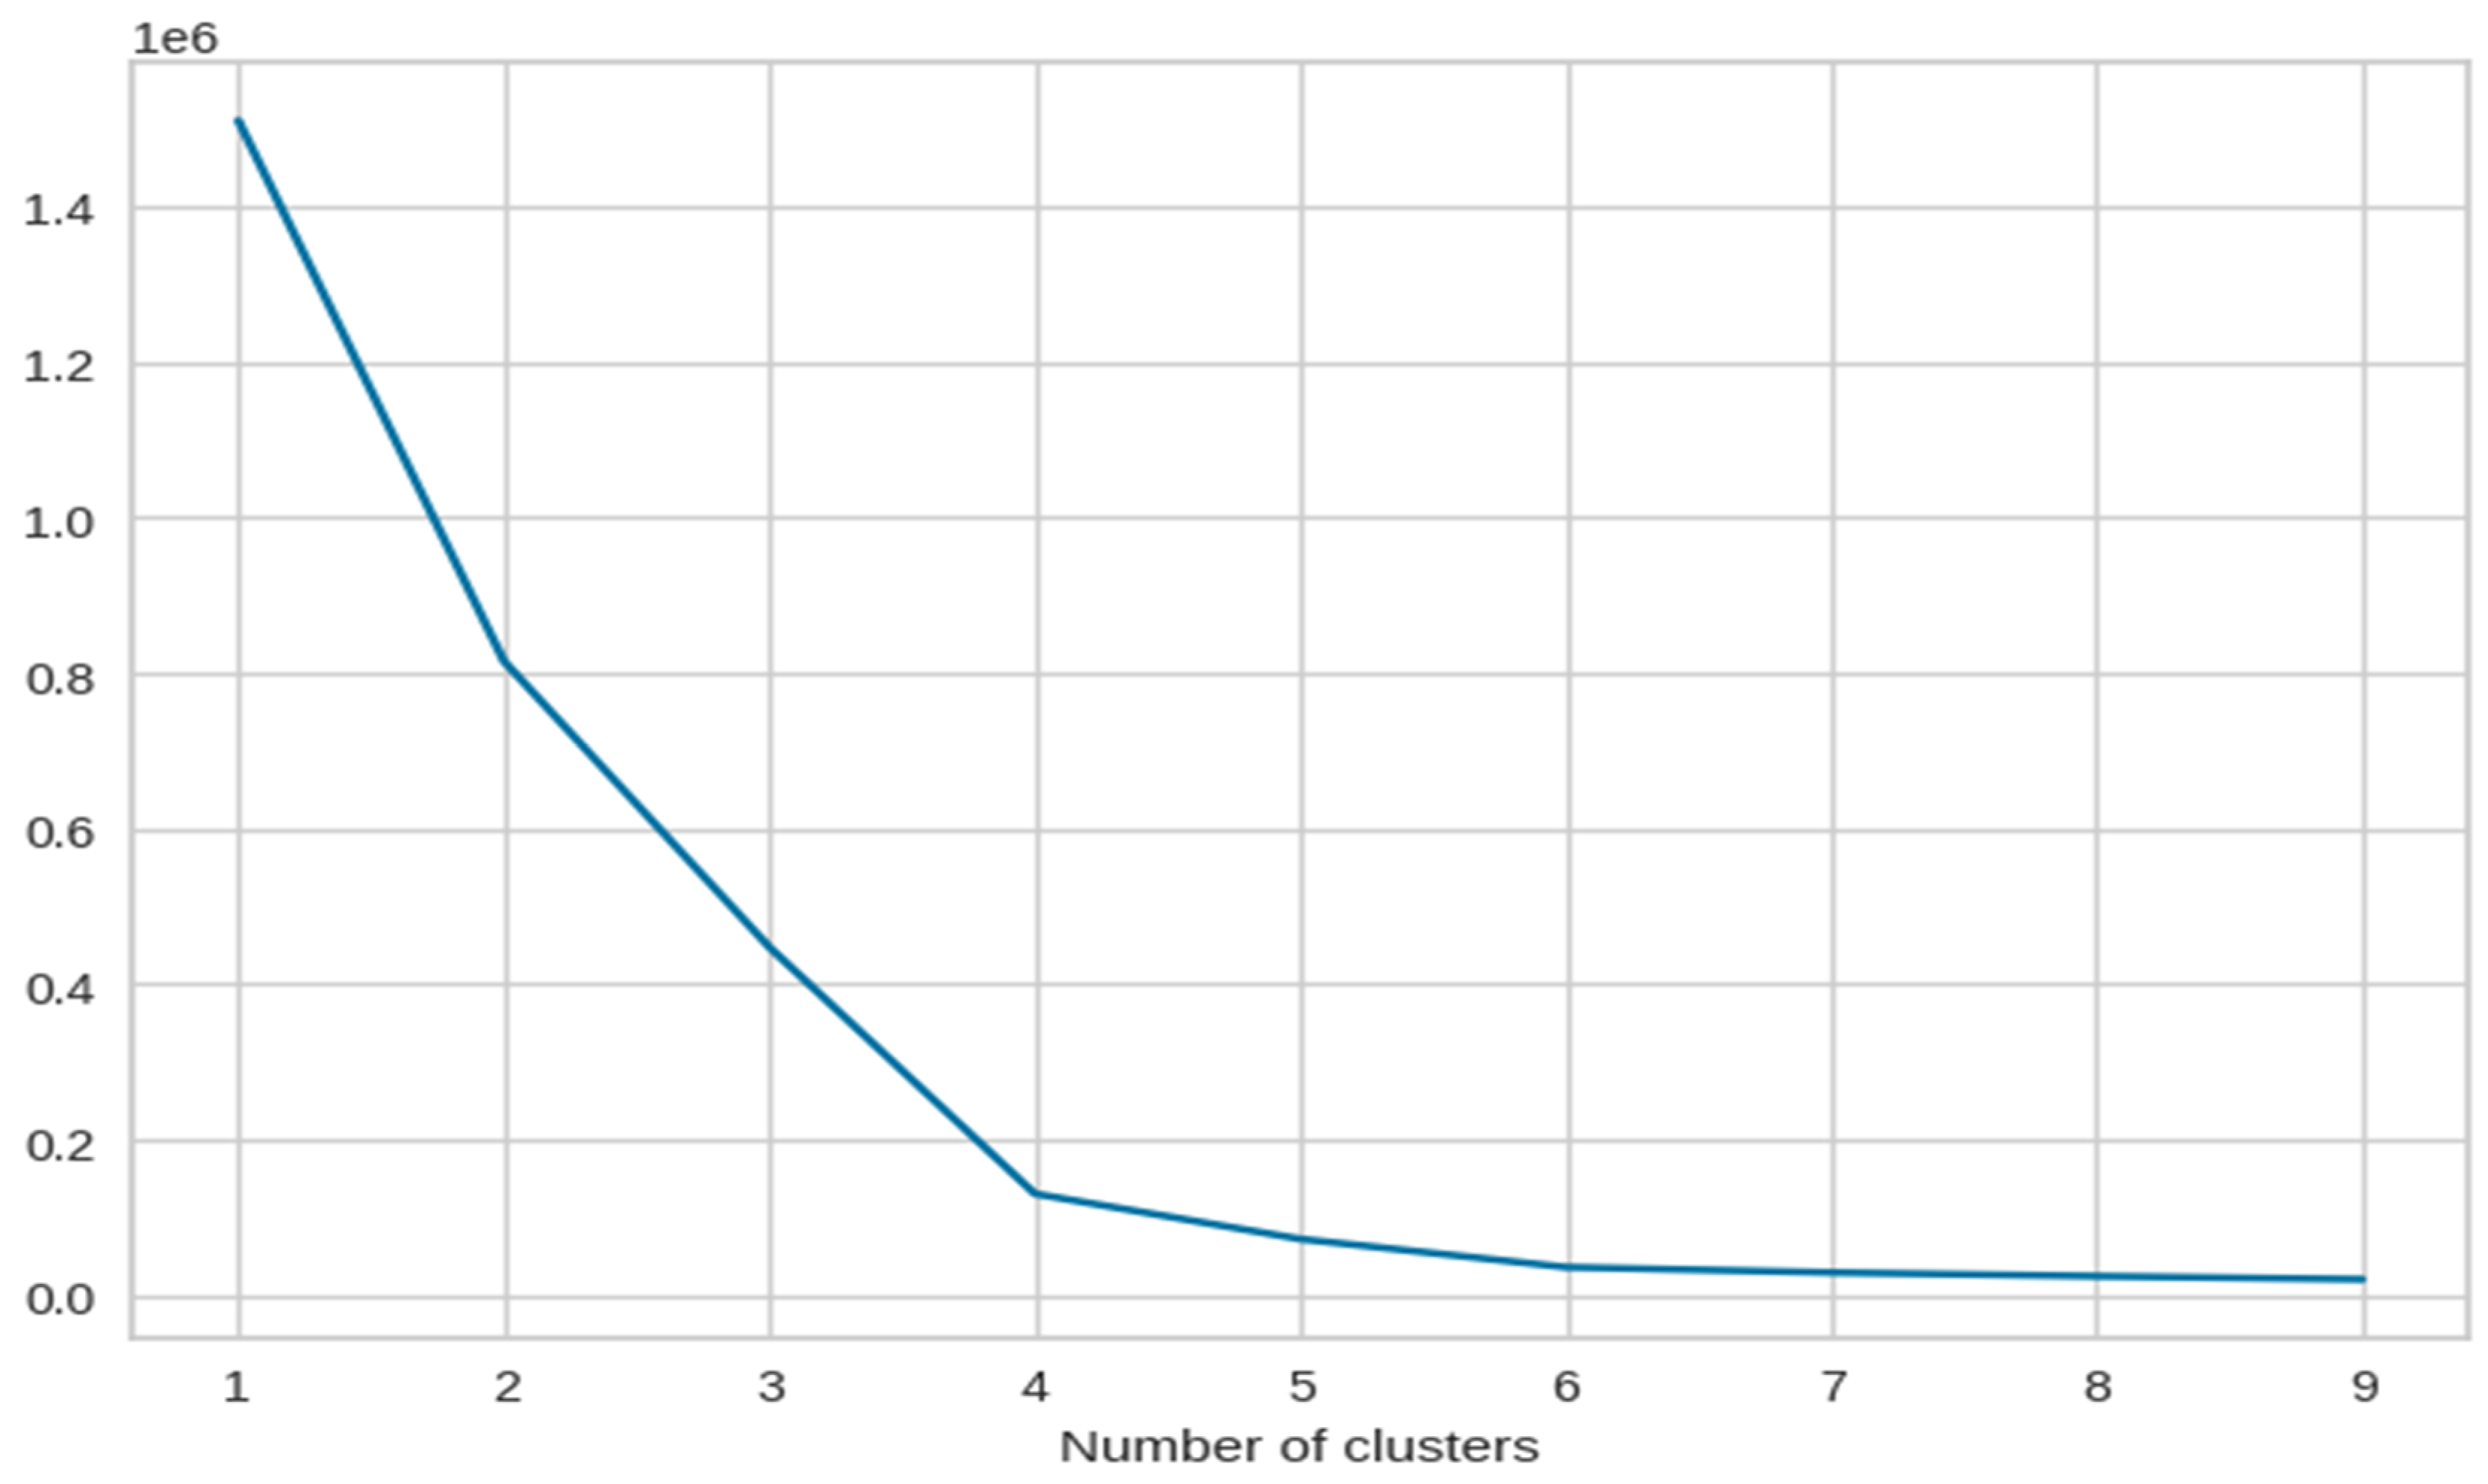
As we can see, Figure 7 has the maximum number of components where we can observe a sharp elbow. After that, it becomes difficult to observe a clear elbow point. This could be due to various reasons such as noise in the data or overlapping of the clusters. For this reason, we decided to continue with only 3 dimensions in our dataset.
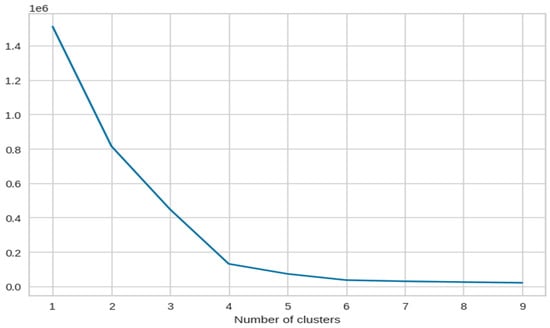
Figure 7.
The X-axis of the plot is the number of clusters and the Y-axis is the Within Clusters Sum of Squares (WCSS) for each number of clusters.
From the scores and Figure 8, we can identify that the ideal number of clusters is 4, and Table 2 describes the average Silhouette score for Class B.
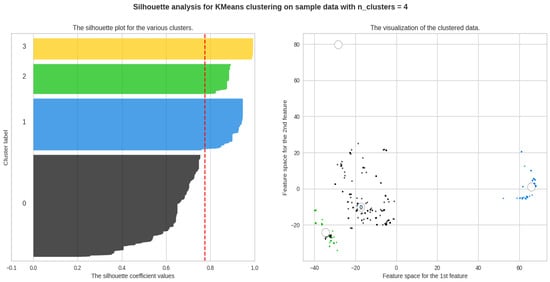
Figure 8.
The silhouette plot describing the clusters.
Table 2.
Average silhouette score for Class B.
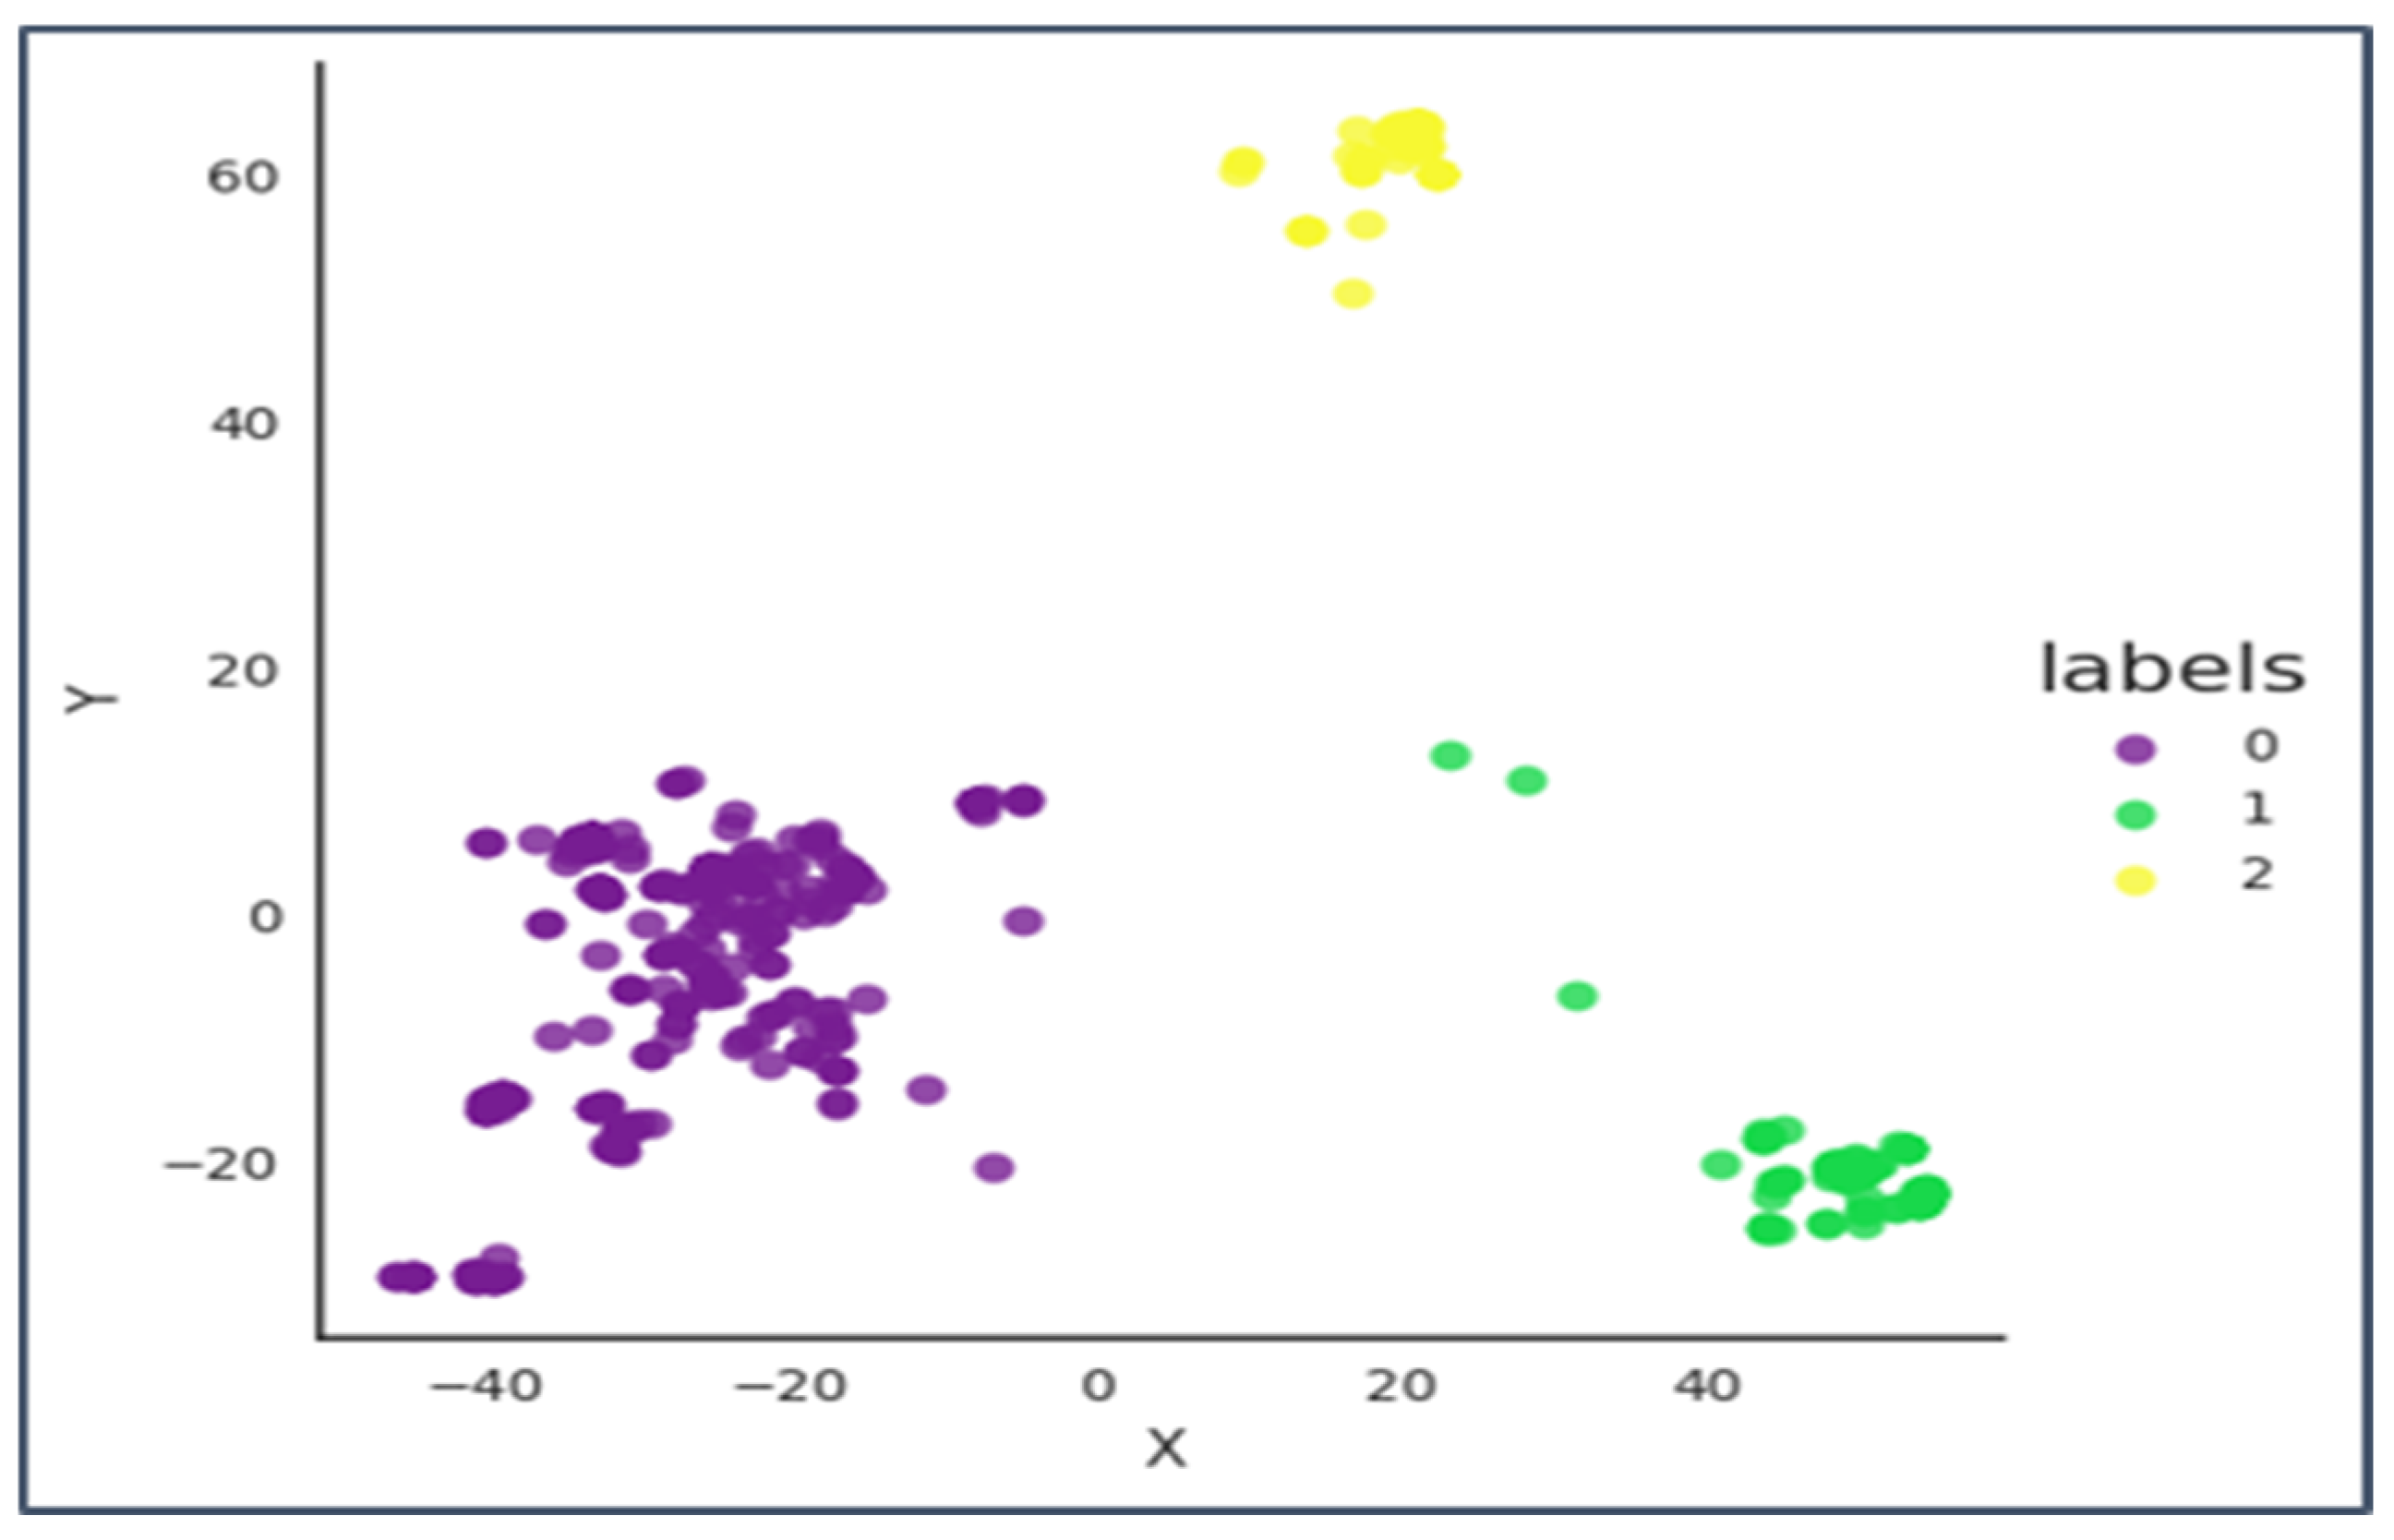
Therefore, we can conclude from Figure 9 that 4 well-separated clusters are formed in the ambler Class B of Beta-lactamases.
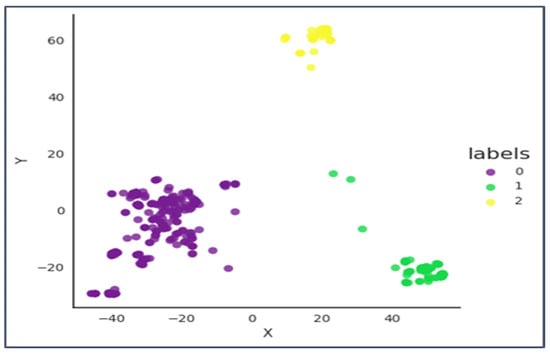
Figure 9.
The X-axis is principal component 1 and the Y axis is principal component 2.
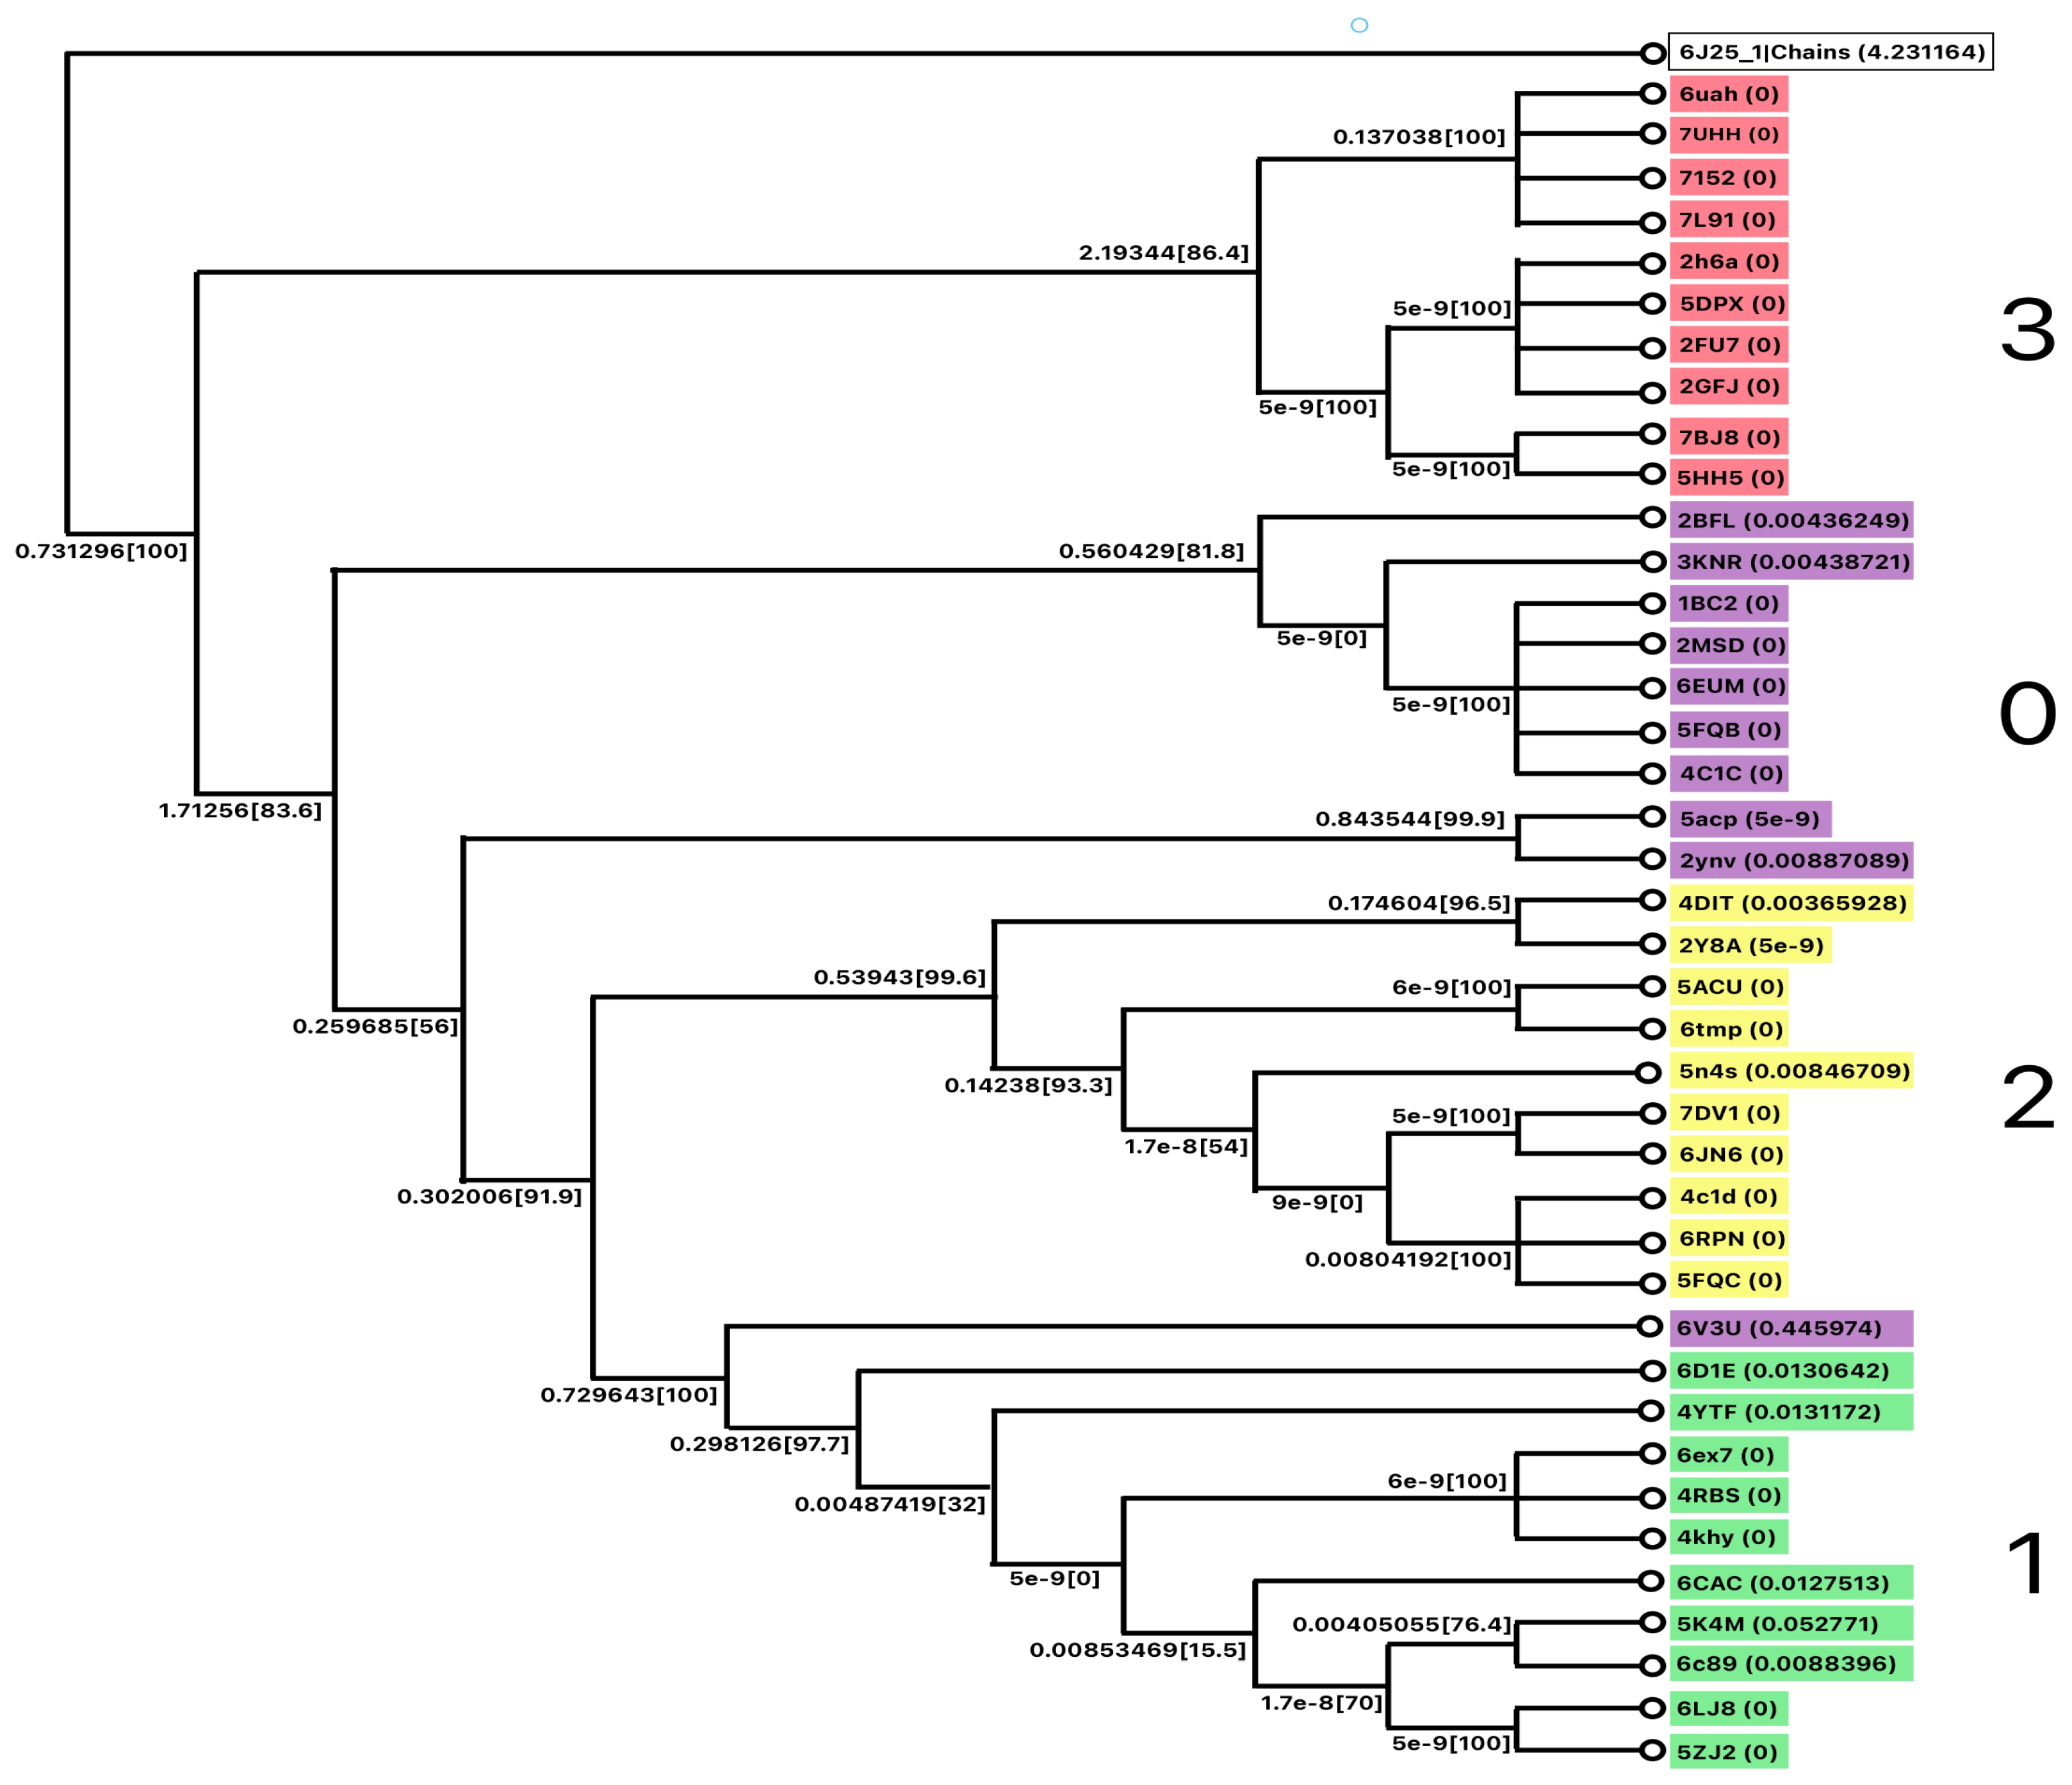
Validation of Clusters
MSA was performed to validate the cluster performance. A phylogenetic tree was constructed as shown in Figure 10.
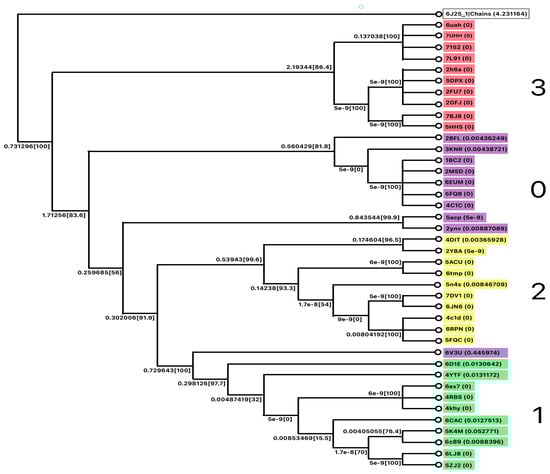
Figure 10.
The phylogenetic tree for Class B.
5. Conclusions
Two classes of β-lactamases (A, B) were taken for the study. From the various techniques applied to check for the similarity on the basis of the protein structures of Class A and Class B, different clusters were formed depending upon the principal components. The silhouette score and elbow plot through K-means clustering analysis generated the ideal number of clusters. Class A was found to have 3 clusters and Class B was found to have 4 clusters. MSA was also performed to validate the clustering performance. It was seen that 3 clusters in Class A and 4 clusters in Class B represent the various characteristics of these mutants. Our findings indicate that the resistant enzymes exhibit similar patterns and hence were clustered in one category. This could be used as predictive model where, by giving the protein sequence as a test, we could predict if it might show resistance or not. Our study is limited to the available dataset. To classify β-lactamases as resistant or wild-type, we have tried clustering the proteins based on the protein sequence alone. This minimizes the ambiguity if we consider the whole genome sequence. The sequences are very close to each other, hence clustering them is challenging. Nevertheless, we could successfully find some patterns for Class A and B of β-lactamases. This study would be beneficial to classifying newly identified variants as antibiotic resistant or not by just observing their amino acid sequence, which would also be very cost-effective and time saving for the researchers.
Author Contributions
Concept and bio-informatics data requirement for dataset: S.L.R.; Machine learning model implementation, writing, review and methodology: S.M.; Result and insights: V.G. All authors have read and agreed to the published version of the manuscript.
Funding
This research received no external funding.
Institutional Review Board Statement
Not applicable.
Informed Consent Statement
Not applicable.
Data Availability Statement
Data are contained within the article.
Conflicts of Interest
The authors declare no conflicts of interest.
References
- Nikaido, A.H. Multidrug resistance in bacteria. Annu. Rev. Biochem. 2009, 78, 119–146. [Google Scholar] [CrossRef] [PubMed]
- National Institute of Allergy and Infectious Diseases. Antimicrobial (Drug) Resistance. Available online: https://www.niaid.nih.gov/research/antimicrobial-resistance (accessed on 17 September 2021).
- Medline Plus. Antibiotics. Available online: https://medlineplus.gov/antibiotics.html#summar (accessed on 17 September 2021).
- Purohit, M.R.; Lindahl, L.F.; Diwan, V.; Mar-rone, G.; Lundborg, C.S. High levels of drug resistance in commensal E. coli in a cohort of children from rural central india. Sci. Rep. 2019, 9, 6682. [Google Scholar] [CrossRef] [PubMed]
- Worthington, R.J.; Melander, C. Overcoming resistance to β-lactam antibiotics. J. Org. Chem. 2013, 78, 4207–4421. [Google Scholar] [CrossRef]
- Sievers, F.; Higgins, D.G. Clustal omega, accurate alignment of very large numbers of sequences. Methods Mol. Biol. 2014, 1079, 105–116. [Google Scholar]
- Bush, K.; Bradford, P.A. β-lactams and β-lactamase inhibitors: An overview. Cold Spring Harb. Perspect. Med. 2016, 6, a025247. [Google Scholar] [CrossRef]
- Bonomo, R.A. β-lactamases: A focus on current challenges. Cold Spring Harb. Perspect. Med. 2017, 7, a025239. [Google Scholar] [CrossRef]
- Yi, H.; Cho, K.H.; Cho, Y.S.; Kim, K.; Nierman, W.C.; Kim, H.S. Twelve positions in a β-lactamase that can expand its substrate spectrum with a single amino acid substitution. PLoS ONE 2012, 7, e37585. [Google Scholar] [CrossRef]
- Williams, J.D. Beta-lactamases and beta-lactamase inhibitors. Int. J. Antimicrob. Agents 1999, 12 (Suppl. S1), S3–S7. [Google Scholar] [CrossRef]
- Bonomo, R.A.; Szabo, D. Mechanisms of multidrug resistance in acinetobacter species and pseudomonas aeruginosa. Clin. Infect. Dis. 2006, 43 (Suppl. S2), S49–S56. [Google Scholar] [PubMed]
- Bush, K. Past and present perspectives on β-lactamases. Antimicrob. Agents Chemother. 2018, 62, e01076-18. [Google Scholar] [CrossRef] [PubMed]
- Hussain, H.I.; Aqib, A.I.; Seleem, M.N.; Shabbir, M.A.; Hao, H.; Iqbal, Z.; Kulyar, M.F.; Zaheer, T.; Li, K. Genetic basis of molecular mechanisms in β -lactam resistant gram-negative bacteria. Microb. Pathog. 2021, 158, 105040. [Google Scholar] [CrossRef] [PubMed]
- Carcione, D.; Siracusa, C.; Sulejmani, A.; Leoni, V.; Intra, J. Old and new beta-lactamase inhibitors: Molecular structure, mechanism of action, and clinical use. Antibiotics 2021, 10, 995. [Google Scholar] [CrossRef] [PubMed]
- Drawz, S.M.; Bonomo, R.A. Three decades of β-lactamase inhibitors. Clin. Microbiol. Rev. 2010, 23, 160–201. [Google Scholar] [CrossRef] [PubMed]
- Sawa, T.; Kooguchi, K.; Moriyama, K. Molecular diversity of extended- spectrum β-lactamases and carbapenemases, and antimicrobial resistance. J. Intensive Care 2020, 8, 13. [Google Scholar] [CrossRef]
- Hidalgo, J.A.; Vinluan, C.M.; Antony, C.M. Ceftazidime/avibactam: A novel cephalosporin/nonbeta-lactam beta-lactamase inhibitor for the treatment of complicated urinary tract infections and complicated intra- abdominal infections. Drug Des. Dev. Ther. 2016, 10, 2379–2386. [Google Scholar]
- Palacios, A.R.; Rossi, M.A.; Mahler, G.S.; Vila, A.J. Metallo-β-lactamase inhibitors inspired on snapshots from the catalytic mechanism. Biomolecules 2020, 10, 854. [Google Scholar] [CrossRef]
- Paetzel, M.; Danel, F.; de Castro, L.; Mosimann, S.C.; Page, M.G.; Strynadka, N.C. Crystal structure of the class d beta-lactamase oxa-10. Nat. Struct. Biol. 2000, 7, 918–925. [Google Scholar] [PubMed]
- Naas, T.; Oueslati, S.; Bonnin, R.A.; Dabos, L.L.; Zavala, A.; Dortet, L.; Retailleau, P.; Iorga, B.I. Beta-lactamase database (bldb)-structure and function. J. Enzym. Inhib. Med. Chem. 2017, 32, 917–919. [Google Scholar] [CrossRef] [PubMed]
- Lahiri, S.D.; Johnstone, M.R.; Ross, P.L.; McLaughlin, R.E.; Olivier, N.B.; Alm, R.A. Avibactam and class c β-lactamases: Mechanism of inhibition, conservation of the binding pocket, and implications for resistance. Antimicrob. Agents Chemother. 2014, 58, 5704–5713. [Google Scholar] [CrossRef] [PubMed]
- Rath, S.L.; Sinha, C.; Kasturi, S.; Mohapatra, S.; Jain, K. An Unsupervised Clustering Algorithm to Cluster the New SARS-CoV-2 Virus Mutation. In Innovations in Computer Science and Engineering; Springer: Singapore, 2022. [Google Scholar] [CrossRef]
- Durbin, R.; Eddy, S.R.; Krogh, A.; Mitchison, G. Biological Sequence Analysis: Probabilistic Models of Proteins and Nucleic Acids; Cambridge University Press: Cambridge, UK, 1998. [Google Scholar]


Disclaimer/Publisher’s Note: The statements, opinions and data contained in all publications are solely those of the individual author(s) and contributor(s) and not of MDPI and/or the editor(s). MDPI and/or the editor(s) disclaim responsibility for any injury to people or property resulting from any ideas, methods, instructions or products referred to in the content. |
© 2024 by the authors. Licensee MDPI, Basel, Switzerland. This article is an open access article distributed under the terms and conditions of the Creative Commons Attribution (CC BY) license (https://creativecommons.org/licenses/by/4.0/).