Abstract
This work aims to determine the hydrogeological potential in the community of Langos-San Andrés, belonging to the canton Guano. This was done by interpreting the regional geology–specific and subsurface stratigraphy. Stratigraphy was obtained by mathematical modeling of the electrical resistivity tomography results obtained in the study area. The interpretation of this information allowed us to know the structure of the soil and the levels at which the groundwater was located. Also, determining the optimal level of extraction of groundwater is a partition of 50 m depth onwards. Furthermore, the location of this water level will allow 1000 families in this area to obtain good quality water, reducing the water access gap that exists in the region and in Ecuador.
1. Introduction
Water is of global interest mainly because in several places on the planet it is difficult to access [1,2,3]. The situation in Latin America is similar, with access to water being a problem in several countries, as it is not possible to provide drinking water to areas that are far from surface water sources [4,5]. In this sense, Ecuador has similar circumstances, even though it is one of the countries with many water resources because there are several sectors of the population that do not have access to water, especially for human use [6]. On the other hand, groundwater in Ecuador is the main source of water for human consumption because the existing springs are mostly located in areas with volcanic features, allowing water to be stored in subway strata [7].
However, the complexity of studying groundwater due to the cost of traditional methods, such as drilling, means that there is a shortage of hydrogeological data in the country [8]. In this context, geophysical methods are a solution to this problem because they are widely used worldwide and provide acceptable results, which allow an understanding of the behavior of groundwater in the subsurface strata [9,10,11].
In this context, according to data from the Decentralized Autonomous Government of Guano Canton (CAD Guano), the Langos–San Andres sector has a water distribution system for only a few families. This has changed due to population growth in the area since the construction of the new access road to Riobamba along Avenida de la República has led to the urbanization of the sector, which means that drinking water distribution does not supply the entire area, leaving more than 80% of the population in this sector without water [12]. In relation to this, as indicated by [7], this area is located within the perimeter of the Chambo aquifer, which has a large amount of groundwater and could serve to cover the needs of this sector.
Therefore, this work will allow the determination of stratigraphic characteristics in the Langos sector, using electrical resistivity tomography, to determine the groundwater level for water resource exploitation purposes.
2. Methodology
2.1. Study Area
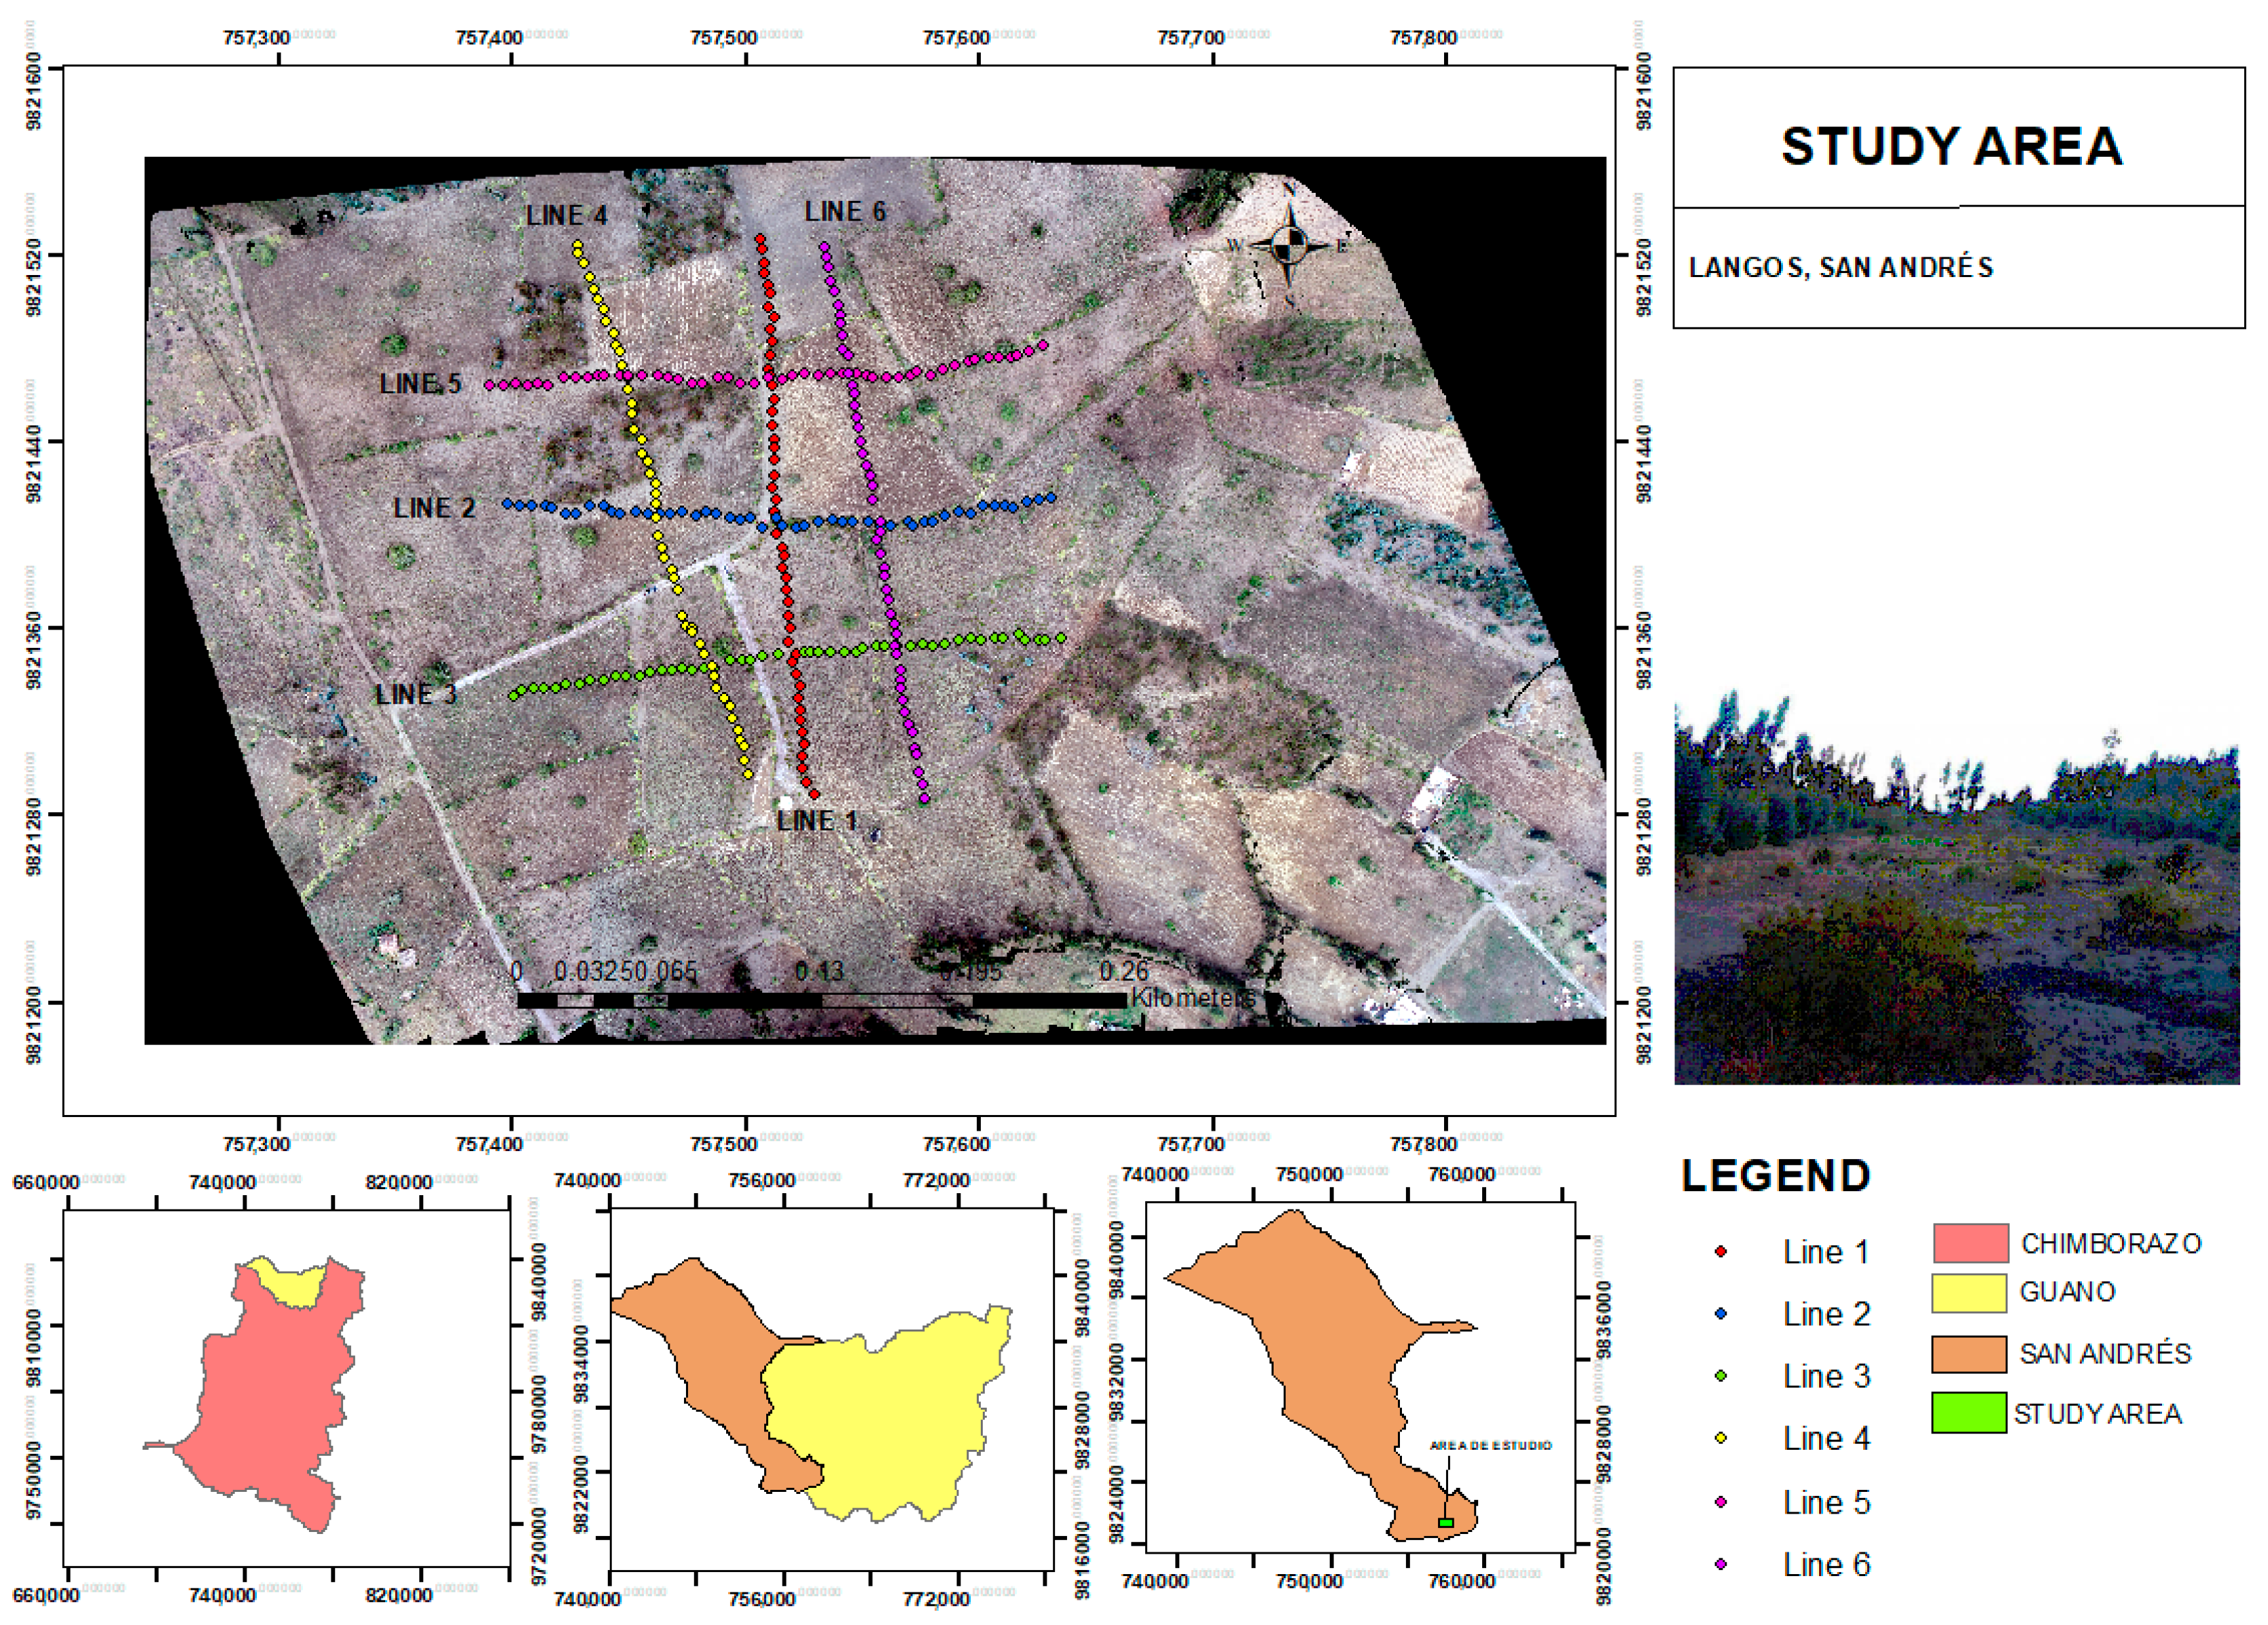
The study area is located in the northwestern part of the Province of Chimborazo, in the Guano canton, San Andres parish, 8 km from the city of Riobamba. This zone was selected because of its physical and topographic characteristics. The San Andres parish has an average annual temperature of 11.19 °C and an altitudinal range of 2900 to 6310 msmn (Figure 1).
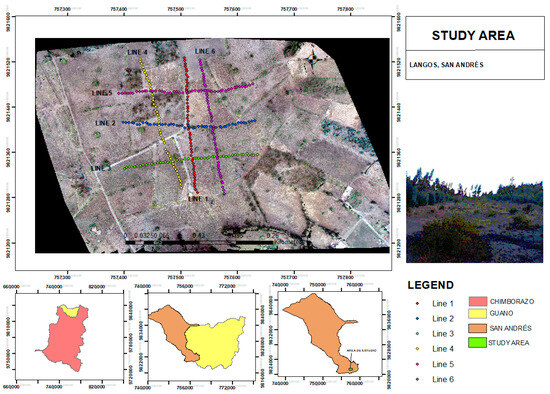
Figure 1.
Location map of the tomography area in the Langos, Guano canton.
The methodology used was developed based on national and regional geological information [13] to determine the areas of hydrogeological interest in the Langos sector.
Then, by means of electrical resistivity topographies in the areas of interest, data were obtained for the reconstruction of the stratigraphy in two and three dimensions. The methods used to implement the proposed approach are described below:
2.2. Electrical Resistivity Tomography (ERT)
Electrical resistivity tomography allowed us to distinguish the distribution of the electrical resistivity of the subsoil by relating the solid constituents of the soil, water content, and temperature with respect to the electrical resistivity. This can be considered as a way to interpret the variability in the physical properties of the soil [10,14,15]. The results of this study are from a distance–depth stratigraphic section with a distribution of subsurface resistivity, which is easily understandable in geological terms, in which the electrical resistivity of the medium depends on the amount of water in the subsurface [16]. To determine the electrical resistivity of the structures, Equation (1) is used [17]:
where is the electrical resistivity of the structure, is the electrical resistivity of the pore water, is the degree of saturation, and are constants related to the saturation coefficient and the cementation factor, respectively, and is a parameter related to the degree of saturation.
2.3. Acquisition of Data for Electrical Resistivity Tomography
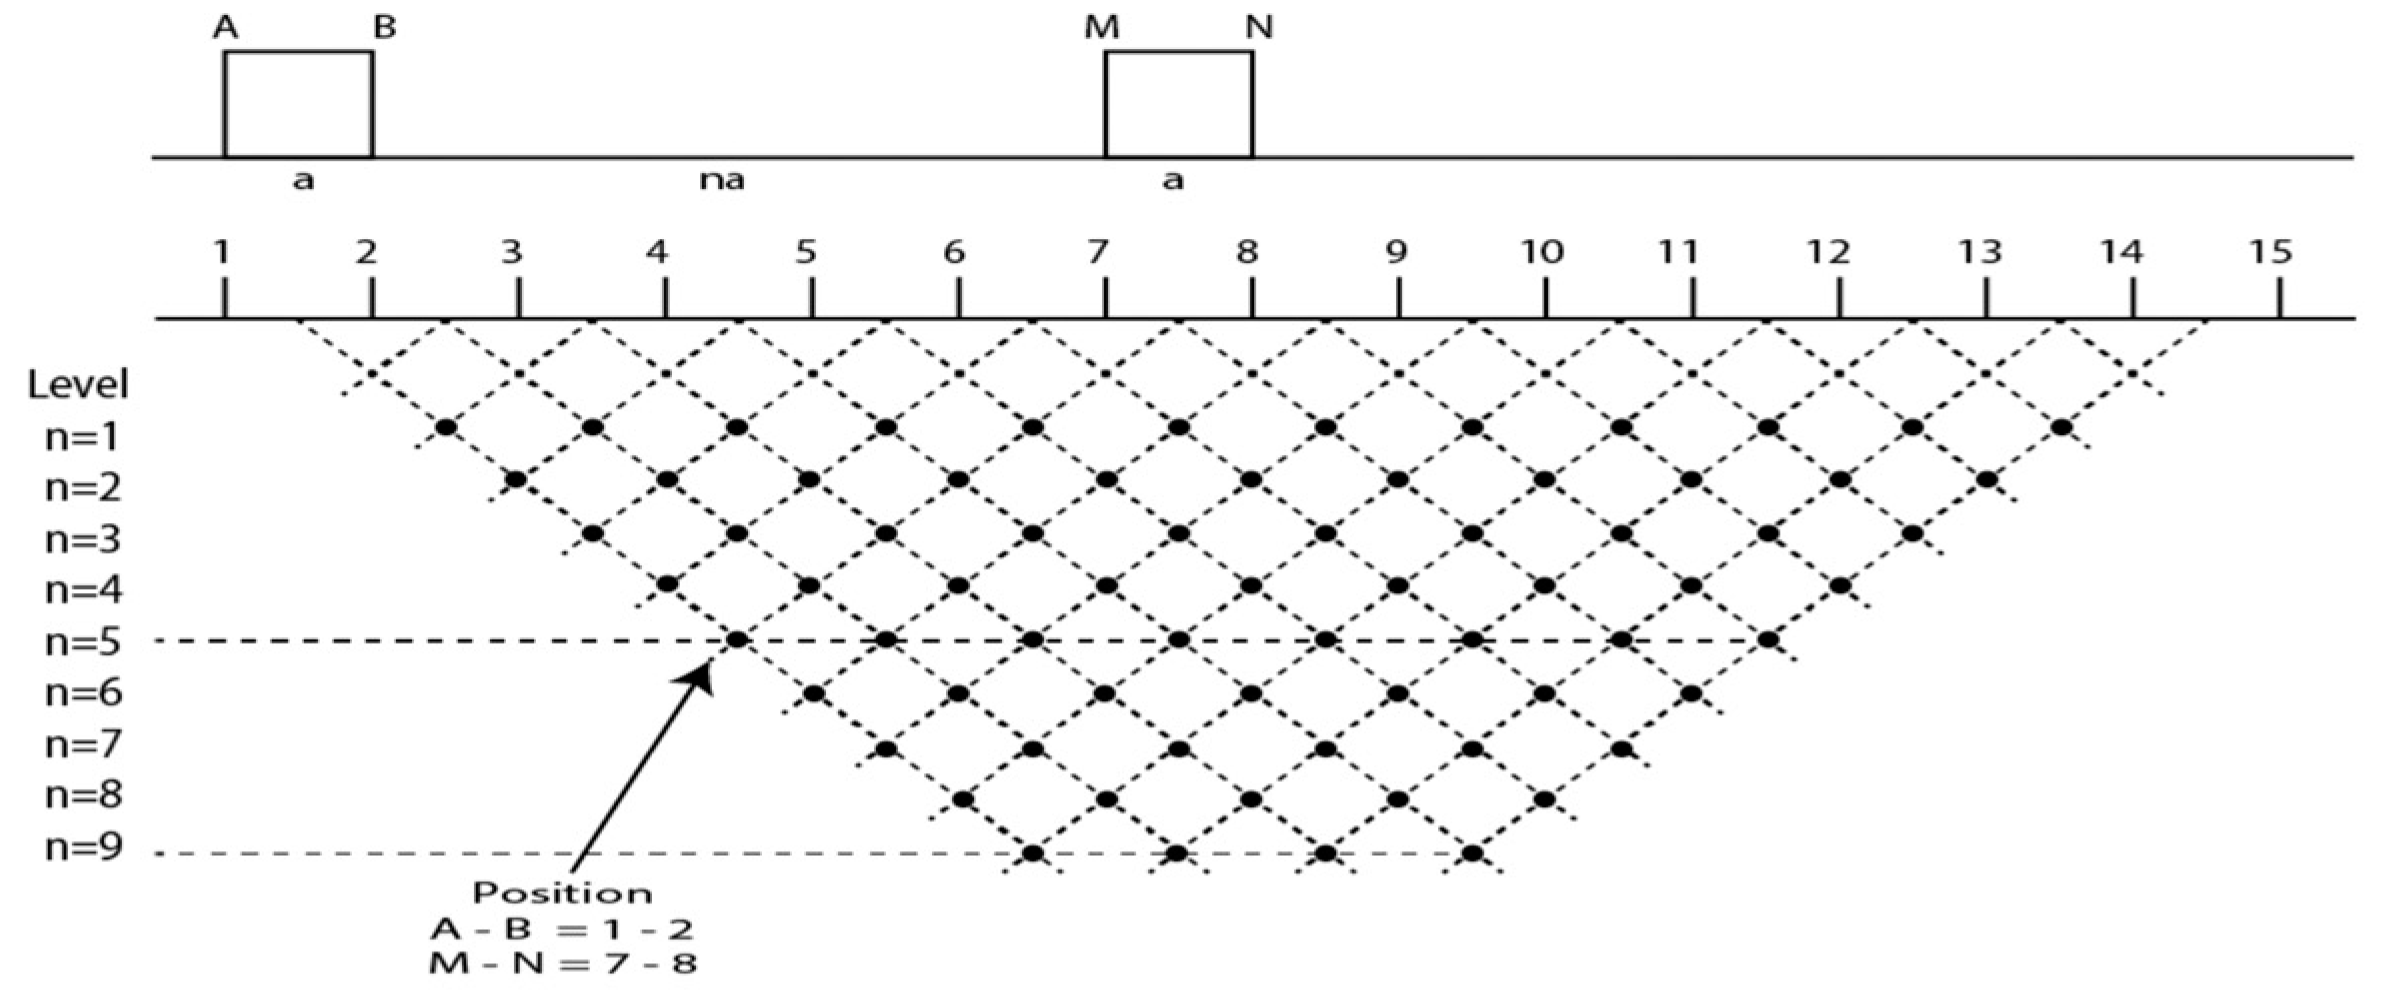
To acquire data in the field, a place with easy access was determined, without interference from construction or trees, so that the cables used would not collide with these obstacles. The equipment used was the Syscal Pro, with two cables, 240 m long each, and 48 electrodes arranged at a distance of 5 m in such a way that it allows acquiring information up to an approximate depth of 60 m [15].
2.4. Electrical Resistivity Tomography Data Processing
The collected data were entered into the Res2dinvx64 ver. 4.07 software (licensed from the National University of Chimborazo) to perform the inversion in two dimensions, which is based on a smoothed least squares sequence with damping; the same sequence was refined with a trial–and–error comparison (Figure 2), using the finite difference method or the finite element method.
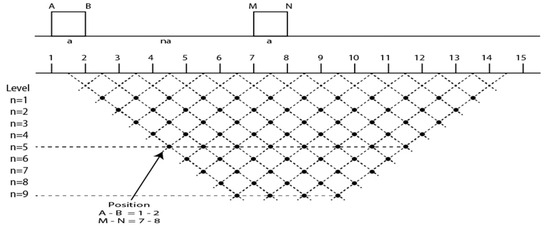
Figure 2.
Rectangular block arrangement in 2D model [14].
From the data obtained in the inversion of the Res2dinv software, all the electrical topographies were projected in three dimensions using the Res3D software 3.13.50 (National University of Chimborazo license), which performs an inverse three-dimensional visualization of the resistivity data of the lithological materials that exist in the subsoil [18].
2.5. Electrical Resistivity Tomography Interpretation
To determine the groundwater level in the study area, the resistivity of rocks of water present in the found stratum was used (Table 1)

Table 1.
Electrical resistivity of rocks or water [8].
3. Results & Discussion
To understand the stratigraphy of the soil, it was found that the study area is located in the Riobamba Formation (PR) (Pleistocene), most of this formation is composed of rounded and angular gravels, which constitute the linarite volcanic phase of Chimborazo, and are also present in some stratification sectors in soil [7,8]. As described in the methodology, once the points where the ERTs should be performed according to the geological characteristics of the area under study were identified, 6 ERTs were performed that allowed to know the characteristics of the subsoil in this area, their results are presented below.
The results of tomography A (Figure 3A) show electrical resistivity ranges between 13.1 and 44.2 Ohm·m (blue color), revealing that groundwater could be found at approximately 50 m depth. On the other hand, resistivity ranges between 813 and 150 Ohm·m were observed in the green color range, and according to their resistivities, they were semi-permeable zones. In addition, in several parts of the tomography, the high resistivity ranges of 275 and 507 Ohm·m (sandy brown and red color) are characteristic of impermeable zones composed mostly of healthy lavas and granites.
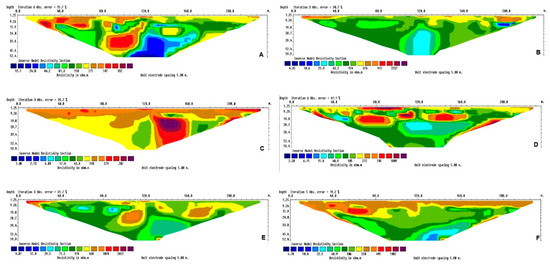
Figure 3.
Electrical Resistivity Lines (A–F).
The second line (Figure 3B) has electrical resistivities of 25.9 Ohm·m in the light blue scale. These are semi-permeable zones in the lower center of the tomography at an approximate depth of 20 to 60 m. In the same way, resistivities between 632 and 154 Ohm·m are observed in the range of green colors that represent less permeable zones composed mostly of clayey sandstones and altered granite. There are also zones with resistivities between 376 and 917 Ohm·m, which were also observed in sandy brown and yellow colors at the corners of the upper limits, which represent impermeable zones of the subsoil.
The results of the third line (Figure 3C) show that there are resistivities of 43.8 Ohm·m, green color; this shows the presence of semi–permeable zones representing a good part of the tomography; there are also resistivities ranging between 110 and 702 Ohm·m (yellow, sandy brown, red and purple color) representing areas with low permeability, also the presence of large rocks that prevent the infiltration of rainwater to the subsoil, these lithological materials may be composed of healthy lavas and granites.
The fourth line (Figure 3D) shows electrical resistivities between 6.15 and 15.8 Ohm·m (light blue color), showing semi-permeable zones containing small pockets of water. In addition, there are resistivities between 40.9 and 105 Ohm·m in the green color range; this shows semi–permeable zones that allow water flow; likewise, we find resistivities ranging between 272 and 1809 Ohm·m in red and purple color, which indicates the presence of impermeable zones and rock intrusions.
The results of the fifth tomography (Figure 3E) represent electrical resistivities between 12 and 29.5 Ohm·m, in light blue color, which indicates the permeable zones of the subsoil, in the same way resistivities ranging between 72.5 and 178 Ohm·m are observed, which are observed in green color, this shows semi-permeable zones representing the majority of the tomography, resistivities between 438 and 1078 Ohm·m can also be observed, represented in sandy brown and yellow color, which reveals zones of low permeability.
The Sixth tomography (Figure 3F) shows electrical resistivities between 10.4 and 22.5 Ohm·m (light blue color), indicating the presence of permeable zones with a small water pocket that is surrounded by semi- permeable material since there are also resistivities that are between 48.9 and 106 Ohm·m, represented in the range of green colors that are the semi-permeable zones that are observed in most of the subsoil, in the same way we find resistivities ranging between 230 and 499 Ohm·m, graphically represented in sandy brown and yellow color that are found at shallow depths, these zones are of low permeability thus preventing the infiltration of rainwater to the subsoil.
From the data obtained in the topographies, the 3D reconstruction was performed (Figure 4), which revealed in a better way the presence of different lithological materials present in the study area. As shown in the figure, there are areas with low resistivity at depths of up to 50 m. There are also areas where the intrusions of rocks of different sizes have been observed. In addition, it was possible to detect the presence of a possible groundwater zone at a depth of 55 m.
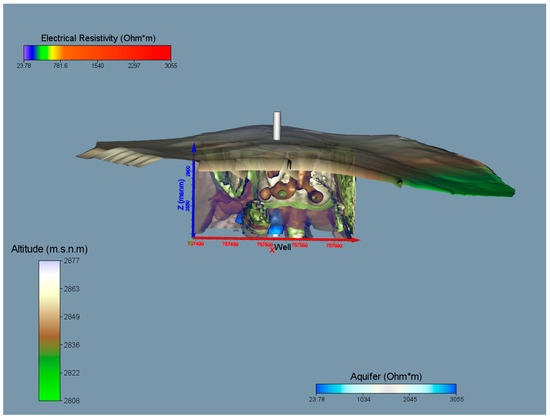
Figure 4.
3D model of ERT in Lagos San Antonio.
4. Conclusions
The sector selected for the topographies met the criteria in terms of accessibility and the absence of obstacles. The tomographic lines were performed in a high area of the Langos sector since in this sector there is a water supply tank for consumption in this area, so if in the future the exploitation of groundwater is carried out, it would save on the costs of construction of a storage tank, in addition to the fact that the land belongs to the GAD of Guano.
In this context, the ERTs and the interpretation of the obtained values of electrical resistivity determined that the stratigraphy of the area is of a heterogeneous type; that is, it does not have the same composition of rocky materials and soil because of traces of rock intrusions, poorly permeable zones and all this at a depth between 5 to 50 m were found, in this sense although the study area is located in an area with good hydrogeological power. It is not likely that there is a large volume of groundwater in this section of depth studied. It was observed that the low electrical resistivities were from 50 m depth, showing the possible presence of groundwater from here and towards greater depths. Therefore, if a water extraction project is to be conducted in this area, it is necessary to reach a drilling depth of approximately 120 m to ensure that a good flow of groundwater is obtained.
In this sense, it is advisable to continue with the geophysical study of the Langos area to determine more sectors that offer groundwater supply at less depth, implying a cost reduction in the drilling of possible groundwater production wells.
As shown in the site description, drilling a well in this area will allow the Langos community to access good–quality water, benefiting approximately 1000 families. This also demonstrates that these noninvasive methods are an acceptable solution for preliminary groundwater studies, reducing the cost of conducting test drillings that are not accessible to economically disadvantaged communities.
Author Contributions
Conceptualization and methodology: B.G.M.T. and A.S.C.B.; Software, validation, formal analysis, investigation, and data curation: B.G.M.T. and L.S.C.R.; Writing—original draft preparation, writing—review and editing: B.G.M.T., L.S.C.R. and A.S.C.B. All authors have read and agreed to the published version of the manuscript.
Funding
This research received no external funding.
Institutional Review Board Statement
Not applicable.
Informed Consent Statement
Not applicable.
Data Availability Statement
Data are contained within the article.
Conflicts of Interest
There are no conflicts of interest of any nature.
References
- Coulibaly, H.; Santacruz de León, G. La Visión Africana Del Agua 2025 y La Realidad Sobre El Acceso Al Agua Para Consumo Humano En Mali, África. Soc. Y Ambiente 2019, 20, 29–51. [Google Scholar] [CrossRef]
- Husic, A.; Fox, J.; Adams, E.; Pollock, E.; Ford, W.; Agouridis, C.; Backus, J. Quantification of Nitrate Fate in a Karst Conduit Using Stable Isotopes and Numerical Modeling. Water Res. 2020, 170, 115348. [Google Scholar] [CrossRef] [PubMed]
- Liemberger, R.; Wyatt, A. Quantifying the Global Non-Revenue Water Problem. Water Sci. Technol. Water Supply 2019, 19, 831–837. [Google Scholar] [CrossRef]
- Somma, N.M.; Bargsted, M.; Disi Pavlic, R.; Medel, R.M. No Water in the Oasis: The Chilean Spring of 2019–2020. Soc. Mov. Stud. 2021, 20, 495–502. [Google Scholar] [CrossRef]
- Yager, K.; Valdivia, C.; Slayback, D.; Jimenez, E.; Meneses, R.I.; Palabral, A.; Bracho, M.; Romero, D.; Hubbard, A.; Pacheco, P.; et al. Socio-Ecological Dimensions of Andean Pastoral Landscape Change: Bridging Traditional Ecological Knowledge and Satellite Image Analysis in Sajama National Park, Bolivia. Reg. Environ. Chang. 2019, 19, 1353–1369. [Google Scholar] [CrossRef]
- Wingfield, S.; Martínez-Moscoso, A.; Quiroga, D.; Ochoa-Herrera, V. Challenges to Water Management in Ecuador: Legal Authorization, Quality Parameters, and Socio-Political Responses. Water 2021, 13, 1017. [Google Scholar] [CrossRef]
- Chidichimo, F.; Mendoza, B.T.; De Biase, M.; Catelan, P.; Straface, S.; Di Gregorio, S. Hydrogeological Modeling of the Groundwater Recharge Feeding the Chambo Aquifer, Ecuador. AIP Conf. Proc. 2018, 2022, 020003. [Google Scholar] [CrossRef]
- Mendoza, B.T. Characterization of Real Aquifers Using Hydrogeophysical Measurements. An Application to the Chambo Aquifer (ecuador). Doctoral dissertation, Università Della Calabria, Rende, Italy, 2012. [Google Scholar]
- Anomohanran, O. Hydrogeophysical Investigation of Aquifer Properties and Lithological Strata in Abraka, Nigeria. J. Afr. Earth Sci. 2015, 102, 247–253. [Google Scholar] [CrossRef]
- Mahmoud, H.H.; Ghoubachi, S.Y. Geophysical and Hydrogeological Investigation to Study Groundwater Occurrences in the Taref Formation, South Mut Area–Dakhla Oasis-Egypt. J. Afr. Earth Sci. 2017, 129, 610–622. [Google Scholar] [CrossRef]
- You, A.; Be, M.; In, I. Application of Geoelectric Method for Groundwater. AIP Conf. Proc. 2022, 1977, 020018. [Google Scholar]
- Manya, P. Valoración Ambiental Del Recurso Hídrico De La Parroquia San Andrés, Cantón Guano, Provincia De Chimborazo; Escuela Superior Politécnica de Chimborazo: Riobamba, Ecuador, 2021. [Google Scholar]
- Berrezueta, E.; Sánchez-Cortez, J.L.; Aguilar-Aguilar, M. Inventory and Characterization of Geosites in Ecuador: A Review. Geoheritage 2021, 13, 93. [Google Scholar] [CrossRef]
- Holmes, J.; Chambers, J.; Meldrum, P.; Wilkinson, P.; Boyd, J.; Williamson, P.; Huntley, D.; Sattler, K.; Elwood, D.; Sivakumar, V.; et al. Four-Dimensional Electrical Resistivity Tomography for Continuous, near-Real-Time Monitoring of a Landslide Affecting Transport Infrastructure in British Columbia, Canada. Near Surf. Geophys. 2020, 18, 337–351. [Google Scholar] [CrossRef]
- Mendoza, B.; Carretero Poblete, P.A.; Loaiza Peñafie, J.M.; Peñafiel Barros, G.O.; Tuaza Castro, L.A.; Osorio Rivera, M.A. Location of Archaeological Elements in the Puruha Necropolis of Payacucha (Rumicruz, Riobamba, Ecuador) by Means of Electrical Tomography Analysis|Localización de Elementos Arqueológicos En La Necrópolis Puruhá de Payacucha (Rumicruz, Riobamba, Ecuador). Arqueol. Iberoam. 2019, 43, 12–19. [Google Scholar]
- Swileam, G.S.; Shahin, R.R.; Nasr, H.M.; Essa, K.S. Spatial Variability Assessment of Nile Alluvial Soils Using Electrical Resistivity Technique. Eurasian J. Soil Sci. 2019, 8, 110–117. [Google Scholar] [CrossRef]
- Masi, M.; Ferdos, F.; Losito, G.; Solari, L. Monitoring of Internal Erosion Processes by Time-Lapse Electrical Resistivity Tomography. J. Hydrol. 2020, 589, 125340. [Google Scholar] [CrossRef]
- Su, M.; Liu, Y.; Xue, Y.; Cheng, K.; Kong, F.; Guan, L. Detection Method for Boulders in Subway Shield Zones Based on Data Fusion Multi-Resistivity Three-Dimensional Tomography. Bull. Eng. Geol. Environ. 2021, 80, 8171–8187. [Google Scholar] [CrossRef]


Disclaimer/Publisher’s Note: The statements, opinions and data contained in all publications are solely those of the individual author(s) and contributor(s) and not of MDPI and/or the editor(s). MDPI and/or the editor(s) disclaim responsibility for any injury to people or property resulting from any ideas, methods, instructions or products referred to in the content. |
© 2024 by the authors. Licensee MDPI, Basel, Switzerland. This article is an open access article distributed under the terms and conditions of the Creative Commons Attribution (CC BY) license (https://creativecommons.org/licenses/by/4.0/).