1. Introduction
The nonlinear dynamic analysis of buildings requires the selection of a suite of seismic records representative of seismic scenarios. Recorded accelerograms usually come from earthquakes of different magnitudes, leading to a wide variety of soil intensities. After selecting a suite of seismic records, they have to be scaled to be representative of a seismic scenario. To scale the seismic records, different seismic intensity measures (IMs) have been used. Some of them depend directly on parameters of the seismic records, such as peak ground acceleration (PGA), cumulative absolute velocity (CAV), peak ground velocity (PGV), Arias intensity (IA), and maximum incremental velocity (MIV). Others depend on spectral parameters, such as effective peak acceleration (EPA), effective peak velocity (EPV), Housner intensity (HI), spectral acceleration at the fundamental period of the structure, Sa(T1), or over a range of periods, Sa(T1–T2), among others.
Several studies concluded that peak ground acceleration (PGA), cumulative absolute velocity (CAV), and spectral acceleration at a fundamental period, Sa(T
1), can be used to scale seismic records in the nonlinear analysis of buildings [
1,
2,
3]. The spectral acceleration at the fundamental period, Sa(T
1), has been frequently used as an IM in the nonlinear analysis of highway bridges [
4,
5,
6]. Padgett [
7] found that PGA can be an optimal IM to compute the fragility curves of highway bridges. Avsar [
8] analyzed PGA, PGV, and ASI as intensity measures. The authors found that ASI was an adequate IM to assess the seismic vulnerability of bridges. Kurama [
9] reported that the best IM to scale the seismic records depends on the characteristics of the seismic records, and these authors also found that the use of MIV as an intensity measure provided better results as compared with other IMs.
This study analyzes the expected damage limit states of RC buildings in a high-seismicity region by using different scaling methodologies. It is not the purpose of the study to propose a methodology for selecting the most appropriate scaling technique, as has been done in other studies [
7,
10], but to quantify the differences in the expected seismic response when using different scaling techniques. The results show that the expected damage of the buildings, based on damage limit states, when using different scaling techniques of the seismic records can have great variations that place the buildings in the zone of no damage in some cases and in the region of extensive damage in others.
2. Intensity Measures
To scale the seismic records, the following ten intensity measures, used in different studies, were selected. Peak Ground Acceleration (PGA): maximum value of the seismic ground acceleration. Effective Peak Acceleration (EPA): mean value of the spectral acceleration between 0.1 and 0.5 s divided by 2.5, for a damping ratio of 5%. Effective Peak Velocity (EPV): spectral velocity value at period T = 1.0 s, for a damping ratio of 5%, selected as the mean spectral velocity between 0.8 and 1.2 s. Arias Intensity (IA): time integral of the square ground acceleration. Cumulative Absolute Velocity (CAV): Area under the absolute ground acceleration. Spectral acceleration at the building fundamental period for a damping ratio of 5% Sa(T1). Spectral Acceleration over a range of periods Sa(To–Tμ): Mean spectral acceleration in the range To–Tμ, for a damping ratio of 5%. Tμ is the elongated period computed with the secant stiffness for a ductility demand. Maximum Incremental Velocity (MIV): maximum value of the incremental velocity, defined as the area under the ground acceleration between two successive zero-crossings. Housner Intensity (HI): area under pseudovelocity response spectrum in the period range of 0.1–2.5 s. Acceleration Spectrum Intensity (ASI): area under the spectral acceleration between two periods, for a damping ratio of 5%. The seismic records were scaled using each of the ten methodologies according to a uniform hazard spectrum (UHS) for a return period Tr = 2500 years in the location site of the buildings.
3. Numerical Models
Figure 1 shows the plan and elevation of the buildings selected to assess the influence of the scaling techniques on the seismic demands of buildings. Two- and ten-story RC buildings were subjected to a suite of scaled seismic records. The story height of the three buildings is 280 cm. The buildings were designed assuming they are in a site of high seismicity on the Pacific coast of Mexico (coordinates: 16°10′57″ N 95°11′45″ O). The concrete compressive strength of columns and beams used to design the buildings was f′c = 24.5 Mpa, the yield strength of the reinforcing bars was fy = 411.9 Mpa, and the concrete modulus of elasticity was 14,000
. Live load amplitudes and load combinations specified in [
11] were used to create the numerical model in the SAP2000 program [
12]. The design spectrum for the seismic analysis of the buildings was obtained from the PRODISIS software V4.1 [
13]. This software is based on the most recent seismic hazard study carried out in the Mexican Republic. The elastic response spectrum was reduced using a seismic behavior factor Q = 4, overstrength factor R = 2.5, and redundancy factor ρ = 1.25.
Figure 2 shows the elastic design spectrum for firm soil used to design the buildings.
Table 1 shows the dimensions of the cross section and longitudinal reinforcement of beams and columns of the buildings. The fundamental periods of the buildings were 0.33 s and 1.81 s for the two- and ten-story buildings, respectively.
4. Nonlinear Analysis
The numerical model to perform the nonlinear analysis of the buildings was created with PERFORM 3D V5.0 software [
14], using a concentrated plasticity model by assigning plastic hinges at both ends of the columns and beams. Moment–rotation relationships were determined using constitutive models of Mander [
15] for confined and unconfined concrete, and the Park proposal [
16] for the reinforcement steel. The building was subjected to a suite of 28 scaled accelerograms selected from earthquakes which originated in the interplate seismic source in the Pacific trench in Mexico.
Figure 3 shows the response spectra of the seismic records and the uniform hazard spectrum for a return period Tr = 2500 years.
5. Results
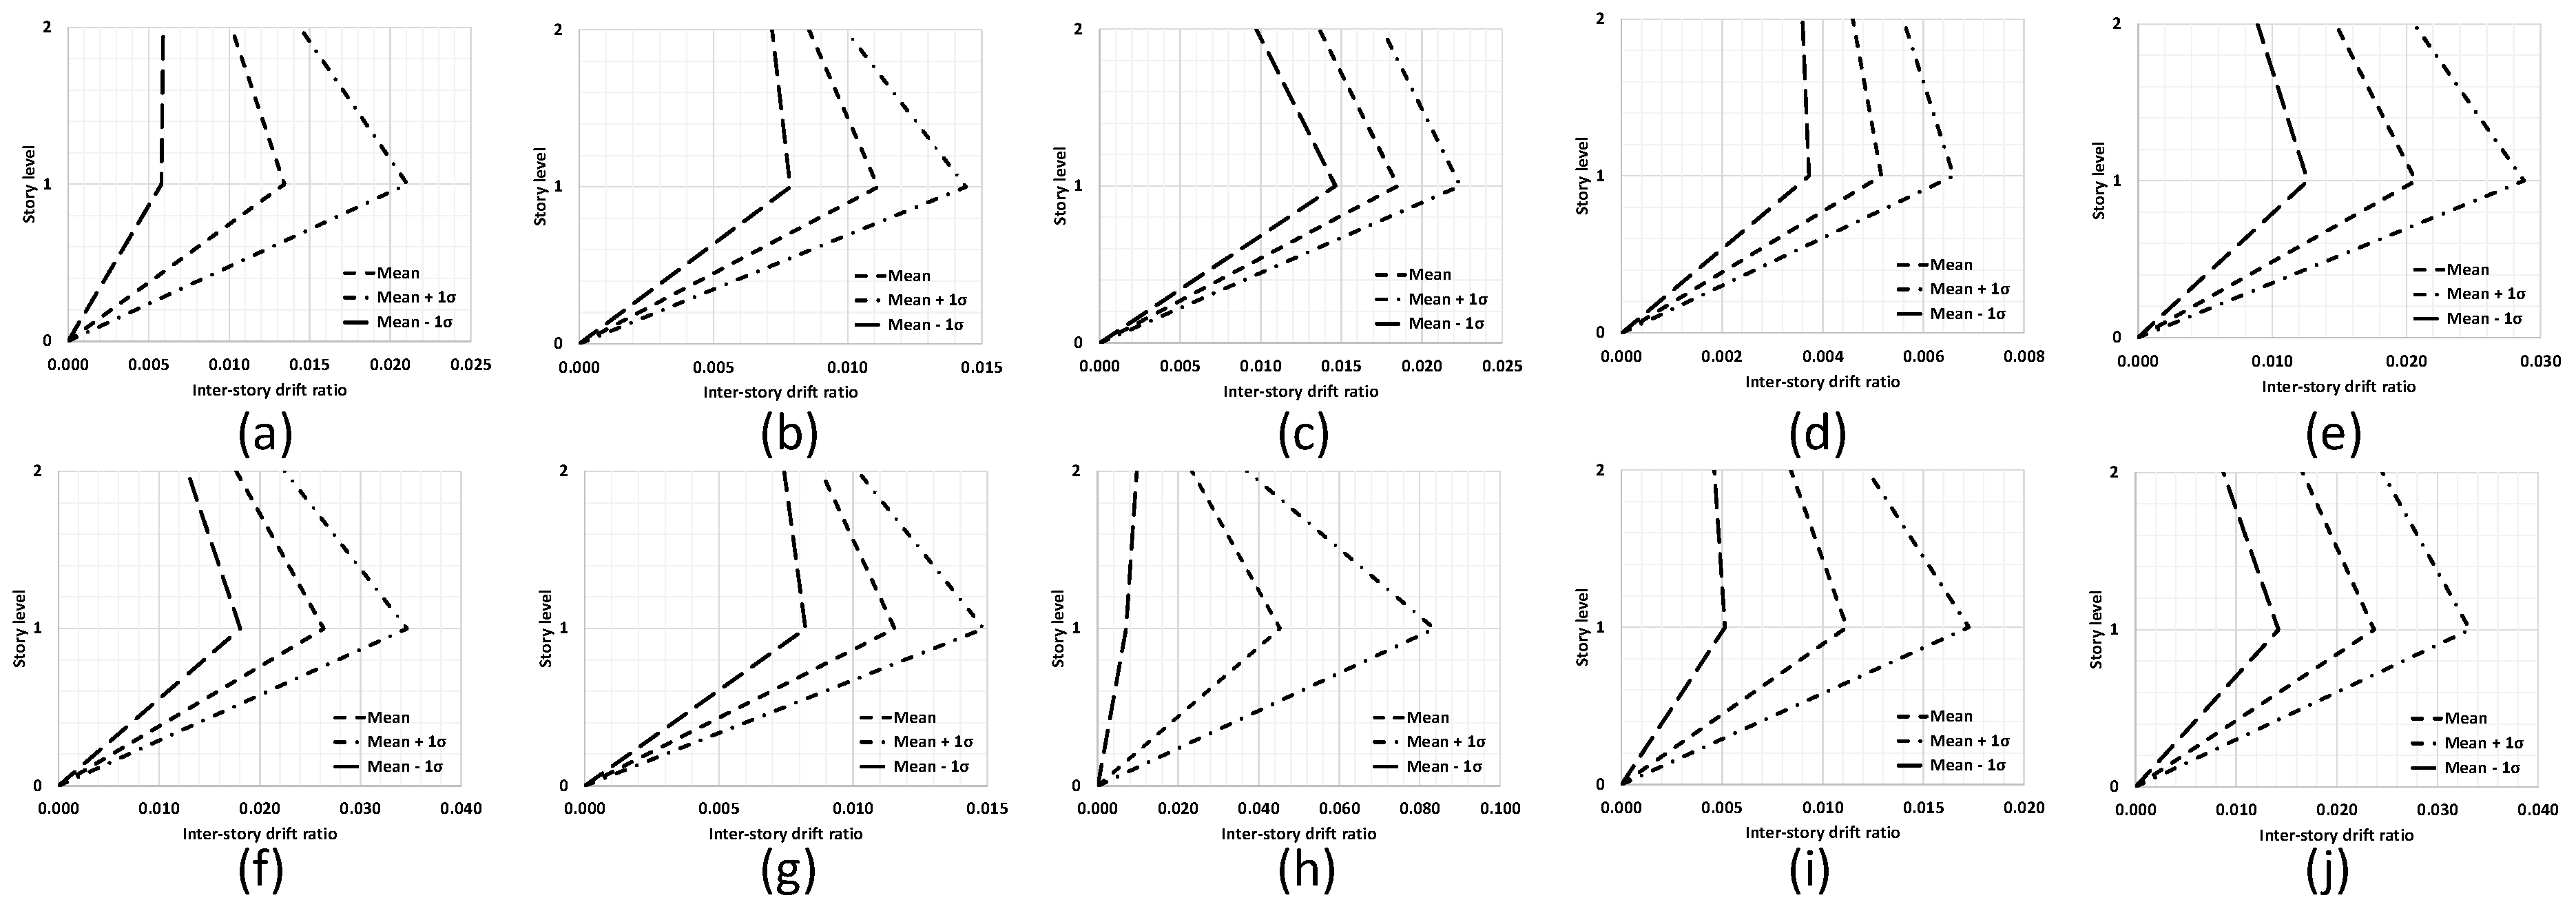
Figure 4 shows the mean interstory drift demands of the two-story building subjected to the suite of 28 seismic records scaled with each of the ten different methodologies described in
Section 2.
Figure 4 also includes the mean ± standard deviation.
The PGA, EPA, ASI, and CAV methodologies presented similar drift demands, whereas the EPV methodology increased the seismic response. The Arias intensity (IA) and HI techniques, separate from the other scaling methodologies, had considerably higher demands. HAZUS 5.1 [
17] stated damage limit states based on drift demands as follows: below 0.0033, no damage; in the range of 0.0033–0.0067, slight damage; in the range of 0.0067–0.020, moderate damage; in the range of 0.020–0.053, extensive damage; and above 0.053, complete damage. The mean drift ratio demands of MIV IM led the two-story building to the slight damage limit state, whereas the Arias intensity measure (IA) placed the building in the extensive damage limit state, close to complete damage. Sa(T
1), Sa(T
o–T
μ), and HI placed the building in the extensive damage limit state, and PGA, EPA, EPV, ASI, and CAV situated the structure in the moderate damage limit state. Clearly, the more disperse IM was Arias Intensity (IA), followed by CAV, HI, PGA, and Sa(T
1). The rest of the IMs presented smaller coefficients of variation (ratio of the standard deviation to the mean).
One demand parameter of interest to assess damages in building contents is the floor acceleration.
Figure 5 shows mean floor acceleration demands in the two-story building subjected to the suite of 28 seismic records. The PGA, EPA CAV, and ASI methodologies led to similar rooftop amplifications, whereas the EPV, Sa(T
1) and Sa(T
o–T
μ) methodologies produced lower ratios. However, the latter group presented higher peak ground accelerations. Despite the fact that MIV displayed the lowest PGA demand, it had the highest rooftop amplification (close to 2.5 times PGA). The coefficient of variation was in the range of 0.15(PGA)–0.54(HI) and the IMs with less dispersion were PGA, EPA, and ASI.
Figure 6 shows the mean drift ratio demands of the ten-story building. The PGA, EPA, ASI and CAV scaling techniques produced similar mean drift ratios. However, EPA and ASI displayed less dispersion than the other two methodologies. MIV had the lowest drift ratios, which placed the building in the slight damage limit state. Conversely, the Sa(T
1), Sa(T
o–T
μ), and IA techniques produced drift ratio demands that placed the building in the extensive damage limit state. The coefficient of variation was in the range of 0.24–0.78 and HI, EPA, EPV, MIV, and ASI presented less disperse results than the other scaling methodologies.
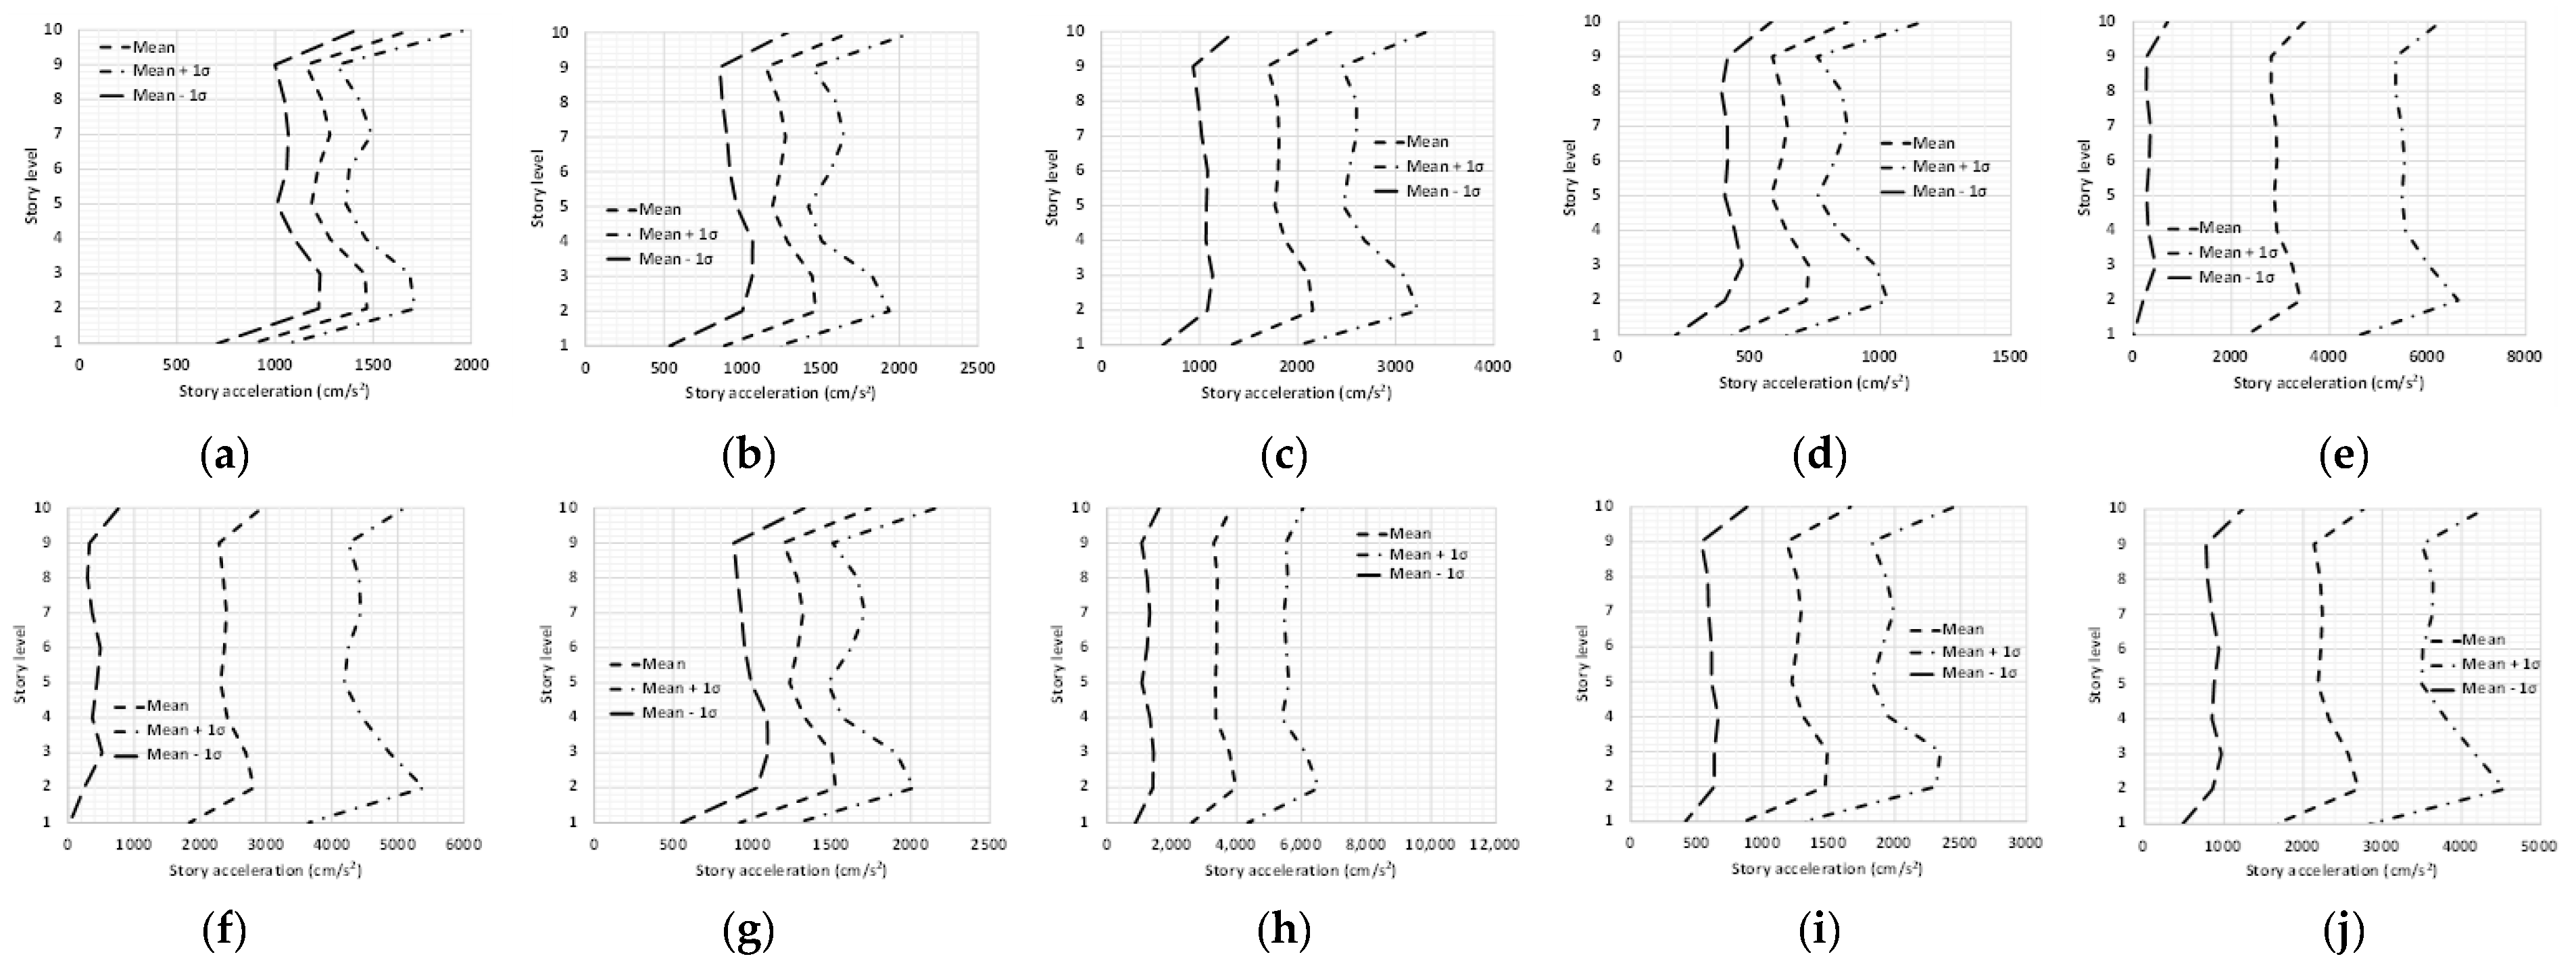
Figure 7 shows the mean floor acceleration demands of the ten-story building. The PGA, EPA, ASI and CAV scaling methodologies had similar floor acceleration values and rooftop amplifications as well. The IA scaling technique led to the maximum floor acceleration demands, followed by Sa(T
1), (T
o–T
μ), and HI. MIV presented the lowest floor acceleration demands. The ratio of rooftop acceleration between the scaling methodology with the maximum and the minimum demands was 4.4 (IA/MIV). The PGA scaling methodology presented a maximum coefficient of variation of 0.20, whereas IA, Sa(T
1), and Sa(T
o–T
μ) displayed high disperse results (CV > 0.85). The rest of the scaling techniques had maximum coefficients of variation in the range of 0.39–0.58.
6. Conclusions
This study presented the nonlinear analysis of a low- and mid-rise RC concrete buildings subjected to a suite of 28 seismic records scaled with ten different methodologies. The results allow us to draw the following conclusions:
Regardless of the building height, the MIV scaling technique presented the smallest interstory drift ratio demands. On the contrary, the Arias Intensity (IA) scaling methodology led to the largest drift ratio demands, which were considerably higher than those computed with other scaling techniques. The enormous differences in the seismic demands of the buildings when scaling the accelerograms with different methodologies led us to conclude that a specific building in a seismic zone could be placed in some cases in the slight damage limit state and in others close to complete damage.
The IA scaling technique produced drift ratio demands that were several times higher than the drift ratio demands of the MIV scaling methodology. Conversely, the scaling process based on PGA, EPA, ASI, and CAV produced similar seismic demands regardless of the building height.
Finally, the results showed that the differences among the building demands when applying different scaling techniques were smaller for floor acceleration demands than those of the drift ratio demands.
Author Contributions
Conceptualization, J.M.J.; methodology, J.M.J. and B.A.O.; investigation, J.I.L.; data curation, J.M.J. and J.I.L.; original draft preparation, J.M.J. and B.A.O.; writing, review and editing, J.M.J., B.A.O. and J.I.L. All authors have read and agreed to the published version of the manuscript.
Funding
This research received no external funding.
Institutional Review Board Statement
Not applicable.
Informed Consent Statement
Not applicable.
Data Availability Statement
Data are available upon request from the authors.
Conflicts of Interest
The authors declare no conflict of interest.
References
- Ebrahimian, H.; Jalayer, F.; Lucchini, A.; Mollaioli, F.; Manfredi, G. Preliminary ranking of alternative scalar and vector intensity measures of ground shaking. Bull. Earthq. Eng. 2015, 13, 2805–2840. [Google Scholar] [CrossRef]
- Vidic, T.; Fajfar, P.; Fischinger, M. Consistent inelastic design spectra: Strength and displacement. Earthq. Eng. Struct. 1994, 23, 507–521. [Google Scholar] [CrossRef]
- Shome, N.; Cornell, C.; Bazurro, P.; Carballo, J. Earthquakes, records, and nonlinear responses. Earthq. Spectra 1998, 14, 469–500. [Google Scholar] [CrossRef]
- Lee, K.H.; Rosowsky, D.V. Fragility analysis of wood frame buildings considering combined snow and earthquake loading. Struct. Saf. 2006, 28, 289–303. [Google Scholar] [CrossRef]
- Yin, Y.J.; Li, Y. Probabilistic loss assessment of light-frame wood construction subjected to combined seismic and snow loads. Eng. Struct. 2011, 33, 380–390. [Google Scholar] [CrossRef]
- Mackie, K.; Stojadinovic, B. Probabilistic seismic demand model for California highway bridges. J. Bridge Eng. 2001, 6, 468–481. [Google Scholar] [CrossRef]
- Padgett, J.E.; Nielson, B.G.; DesRoches, R. Selection of optimal intensity measures in probabilistic seismic demand models of highway bridge portfolios. Earthq. Eng. Struct. Dyn. 2008, 37, 711–725. [Google Scholar] [CrossRef]
- Avsar, Ö.; Yakut, A.; Caner, A. Analytical Fragility Curves for Ordinary Highway Bridges in Turkey. Earthq. Spectra 2011, 27, 971–996. [Google Scholar] [CrossRef]
- Kurama, Y.C.; Farrow, K.T. Ground motion scaling methods for different site conditions and structure characteristics. Earthq. Eng. Struct. Dyn. 2003, 32, 2425–2450. [Google Scholar] [CrossRef]
- Dehghanpoor, A.; Thambiratnam, D.; Zhang, W.; Chan, T.; Taciroglu, E. An extended probabilistic demand model with optimal intensity measures for performance characterization of isolated bridges under coupled horizontal and vertical motions. Bull. Earthq. Eng. 2021, 19, 2291–2323. [Google Scholar] [CrossRef]
- NTC. Complementary Technical Standards. In Criteria and Actions for the Structural Design of Buildings in Mexico City; Diario Oficial de la Federación: Mexico City, Mexico, 2017. [Google Scholar]
- SAP2000, V15.0; Computer and Structures Inc.: Berkeley, CA, USA, 2015.
- MOC. Design Manual for Civil Works, Seismic Design; Electrical Research Institute (IIE): Cuernavaca, Mexico, 2015. [Google Scholar]
- PERFORM3D, V5.0; Computer and Structures Inc.: Berkeley, CA, USA, 2015.
- Mander, J.B.; Priestley, M.J.; Park, R. Theoretical stress-strain model for confined concrete. J. Struct. Div. ASCE 1998, 144, 1804–1826. [Google Scholar] [CrossRef]
- Park, R.; Paulay, T. Reinforced Concrete Structures, 1st ed.; John Wiley & Sons: Hoboken, NJ, USA, 1975; pp. 36–45. [Google Scholar]
- Hazus 5.1. Hazus Earthquake Model Technical Manual; Federal Emergency Management Agency: Washington, DC, USA, 2020. [Google Scholar]
Figure 1.
Plan and elevation of the ten-story building (lengths in cm).
Figure 1.
Plan and elevation of the ten-story building (lengths in cm).
Figure 2.
Design spectrum used to design the buildings.
Figure 2.
Design spectrum used to design the buildings.
Figure 3.
Response spectra and uniform hazard spectrum (dotted line) for Tr = 2500 years.
Figure 3.
Response spectra and uniform hazard spectrum (dotted line) for Tr = 2500 years.
Figure 4.
Mean interstory drift demands of the two-story building subjected to scaled accelerograms: (a) PGA, (b) EPA, (c) EPV, (d) MIV, (e) Sa(T1), (f) Sa(To–Tμ), (g) ASI, (h) IA, (i) CAV, and (j) HI.
Figure 4.
Mean interstory drift demands of the two-story building subjected to scaled accelerograms: (a) PGA, (b) EPA, (c) EPV, (d) MIV, (e) Sa(T1), (f) Sa(To–Tμ), (g) ASI, (h) IA, (i) CAV, and (j) HI.
Figure 5.
Mean floor acceleration demands of the two-story building subjected to scaled accelerograms: (a) PGA, (b) EPA, (c) EPV, (d) MIV, (e) Sa(T1), (f) Sa(To–Tμ), (g) ASI, (h) IA, (i) CAV, and (j) HI.
Figure 5.
Mean floor acceleration demands of the two-story building subjected to scaled accelerograms: (a) PGA, (b) EPA, (c) EPV, (d) MIV, (e) Sa(T1), (f) Sa(To–Tμ), (g) ASI, (h) IA, (i) CAV, and (j) HI.
Figure 6.
Mean interstory drift demands of the ten-story building subjected to scaled accelerograms: (a) PGA, (b) EPA, (c) EPV, (d) MIV, (e) Sa(T), (f) Sa(To–Tμ), (g) ASI, (h) IA, (i) CAV, and (j) HI.
Figure 6.
Mean interstory drift demands of the ten-story building subjected to scaled accelerograms: (a) PGA, (b) EPA, (c) EPV, (d) MIV, (e) Sa(T), (f) Sa(To–Tμ), (g) ASI, (h) IA, (i) CAV, and (j) HI.
Figure 7.
Mean floor acceleration demands of the ten-story building subjected to scaled accelerograms: (a) PGA, (b) EPA, (c) EPV, (d) MIV, (e) Sa(T1), (f) Sa(To–Tμ), (g) ASI, (h) IA, (i) CAV, and (j) HI.
Figure 7.
Mean floor acceleration demands of the ten-story building subjected to scaled accelerograms: (a) PGA, (b) EPA, (c) EPV, (d) MIV, (e) Sa(T1), (f) Sa(To–Tμ), (g) ASI, (h) IA, (i) CAV, and (j) HI.
Table 1.
Building ID, dimension of cross section (in cm), and steel ratios of beam and columns.
Table 1.
Building ID, dimension of cross section (in cm), and steel ratios of beam and columns.
| Building ID | Beam 1 | Column 1 | Beam Steel Ratio | Column Steel Ratio |
|---|
| 2SB | 25 × 50 | 40 × 40 | 0.0052 | 0.0143 |
| 10SB | 25 × 60 | 55 × 55 | 0.0051–0.0068 | 0.0134–0.0268 |
| Disclaimer/Publisher’s Note: The statements, opinions and data contained in all publications are solely those of the individual author(s) and contributor(s) and not of MDPI and/or the editor(s). MDPI and/or the editor(s) disclaim responsibility for any injury to people or property resulting from any ideas, methods, instructions or products referred to in the content. |
© 2023 by the authors. Licensee MDPI, Basel, Switzerland. This article is an open access article distributed under the terms and conditions of the Creative Commons Attribution (CC BY) license (https://creativecommons.org/licenses/by/4.0/).


