Proceeding Paper

Simulation of Thermal–Electrical and Mechanical Behavior of Conductive Yarns †

Institute for Microelectronic Systems, Workgroup: Reliability, Simulation & Risk Analysis, Leibniz Universität Hannover, Appelstrasse 4, 30655 Hannover, Germany
*
Author to whom correspondence should be addressed.
Presented at the 5th International Conference on the Challenges, Opportunities, Innovations and Applications in Electronic Textiles, Ghent, Belgium, 14–16 November 2023.
Eng. Proc. 2023, 52(1), 17; https://doi.org/10.3390/engproc2023052017
Published: 18 January 2024
(This article belongs to the Proceedings of Eng. Proc., 2023, RAiSE-2023)

Abstract

:
The reliability of conductive yarns used for textiles is, among other things, affected by washing and sweating as well as mechanical issues. This leads to corrosion of the metal surface and to breaks. The aim of this work was to gain a better understanding of the influence of different materials (metal as well as non-conductive cores) on electrical behavior and material loss. Different yarns coated with copper, silver, NiCu and NiCuCo with nylon or polyester cores were investigated. The coating thickness as well as the grain distribution was modified. The temperature distribution, the displacements and the vacancy concentration in the metal grains were determined.

1. Introduction

Currently, only a few simulations regarding thermo-electrical and mechanical behavior are known [1,2,3].
After washing or dry-cleaning, the oxidation and/or corrosion of materials was reported in [4]. A resistance analysis including the determination of material composition with EDS was given in [5]. The metal around the plastic core of a conductive yarn is mostly polycrystalline and therefore consists of metal grains which can have different material properties in the direction of their axes. The interfaces (grain boundaries) are diffusion paths for materials due to mechanical or electrical stress. If a material diffuses or migrates, vacancies can occur.

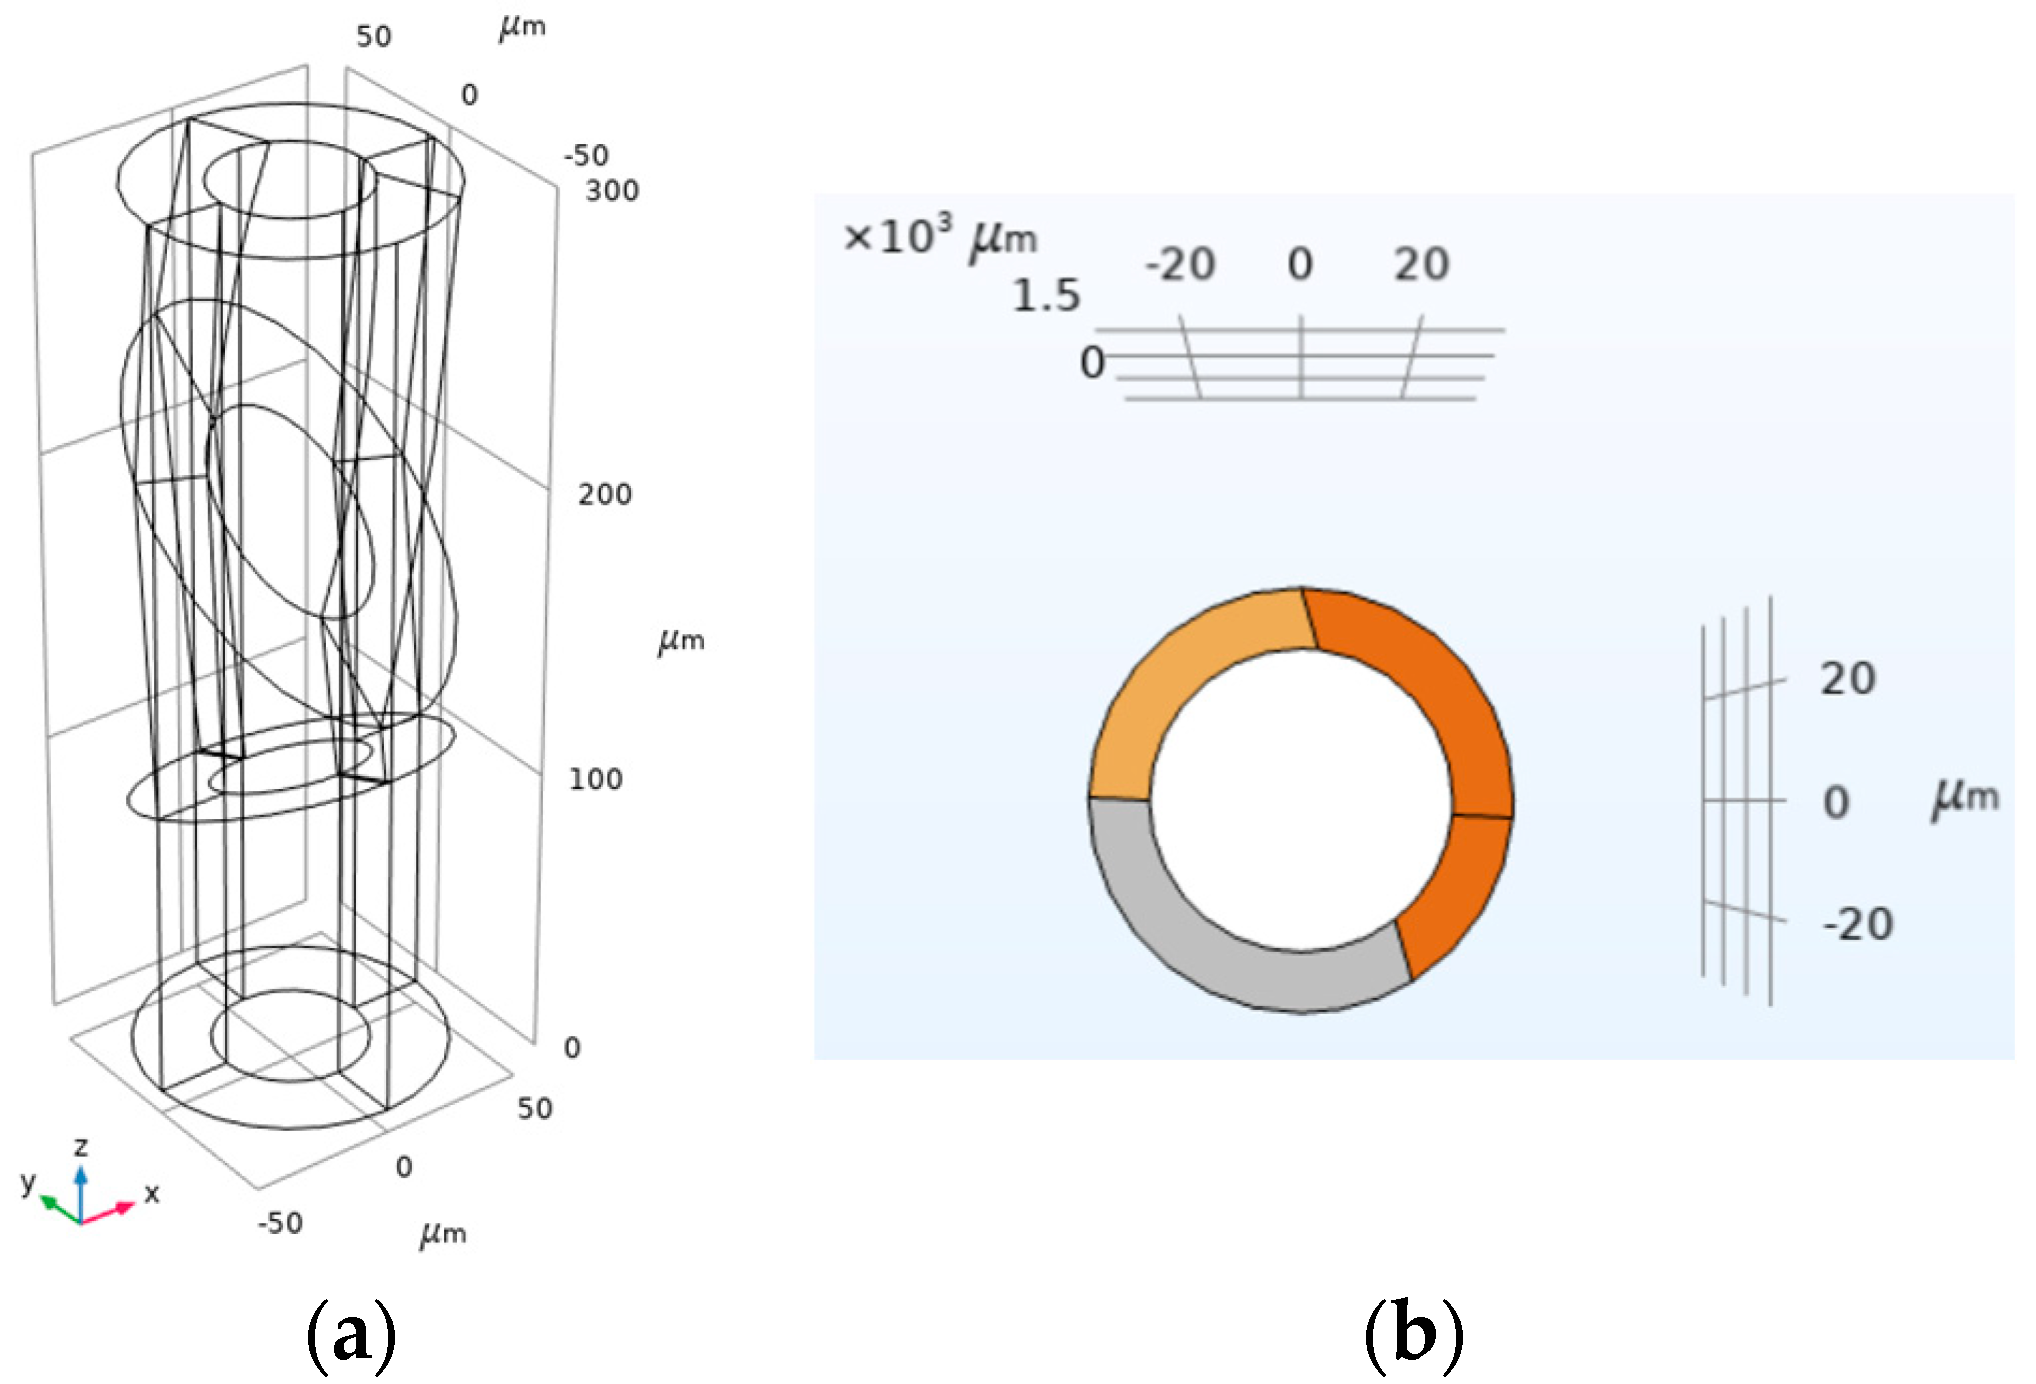
2. Model Description

For the simulation, the finite element program COMSOL Multiphysics® [6] was used. In Figure 1, the model of a part of a conductive yarn with different grains is shown.
The material properties were taken from the literature. The exemplary yarns in the simulation consisted of a metal-coating/core: Cu/polyester; Ag/nylon like Shieldex®; and NiCu/polyester and NiCuCo/polyester. The material properties are given in Table 1 and Table 2.

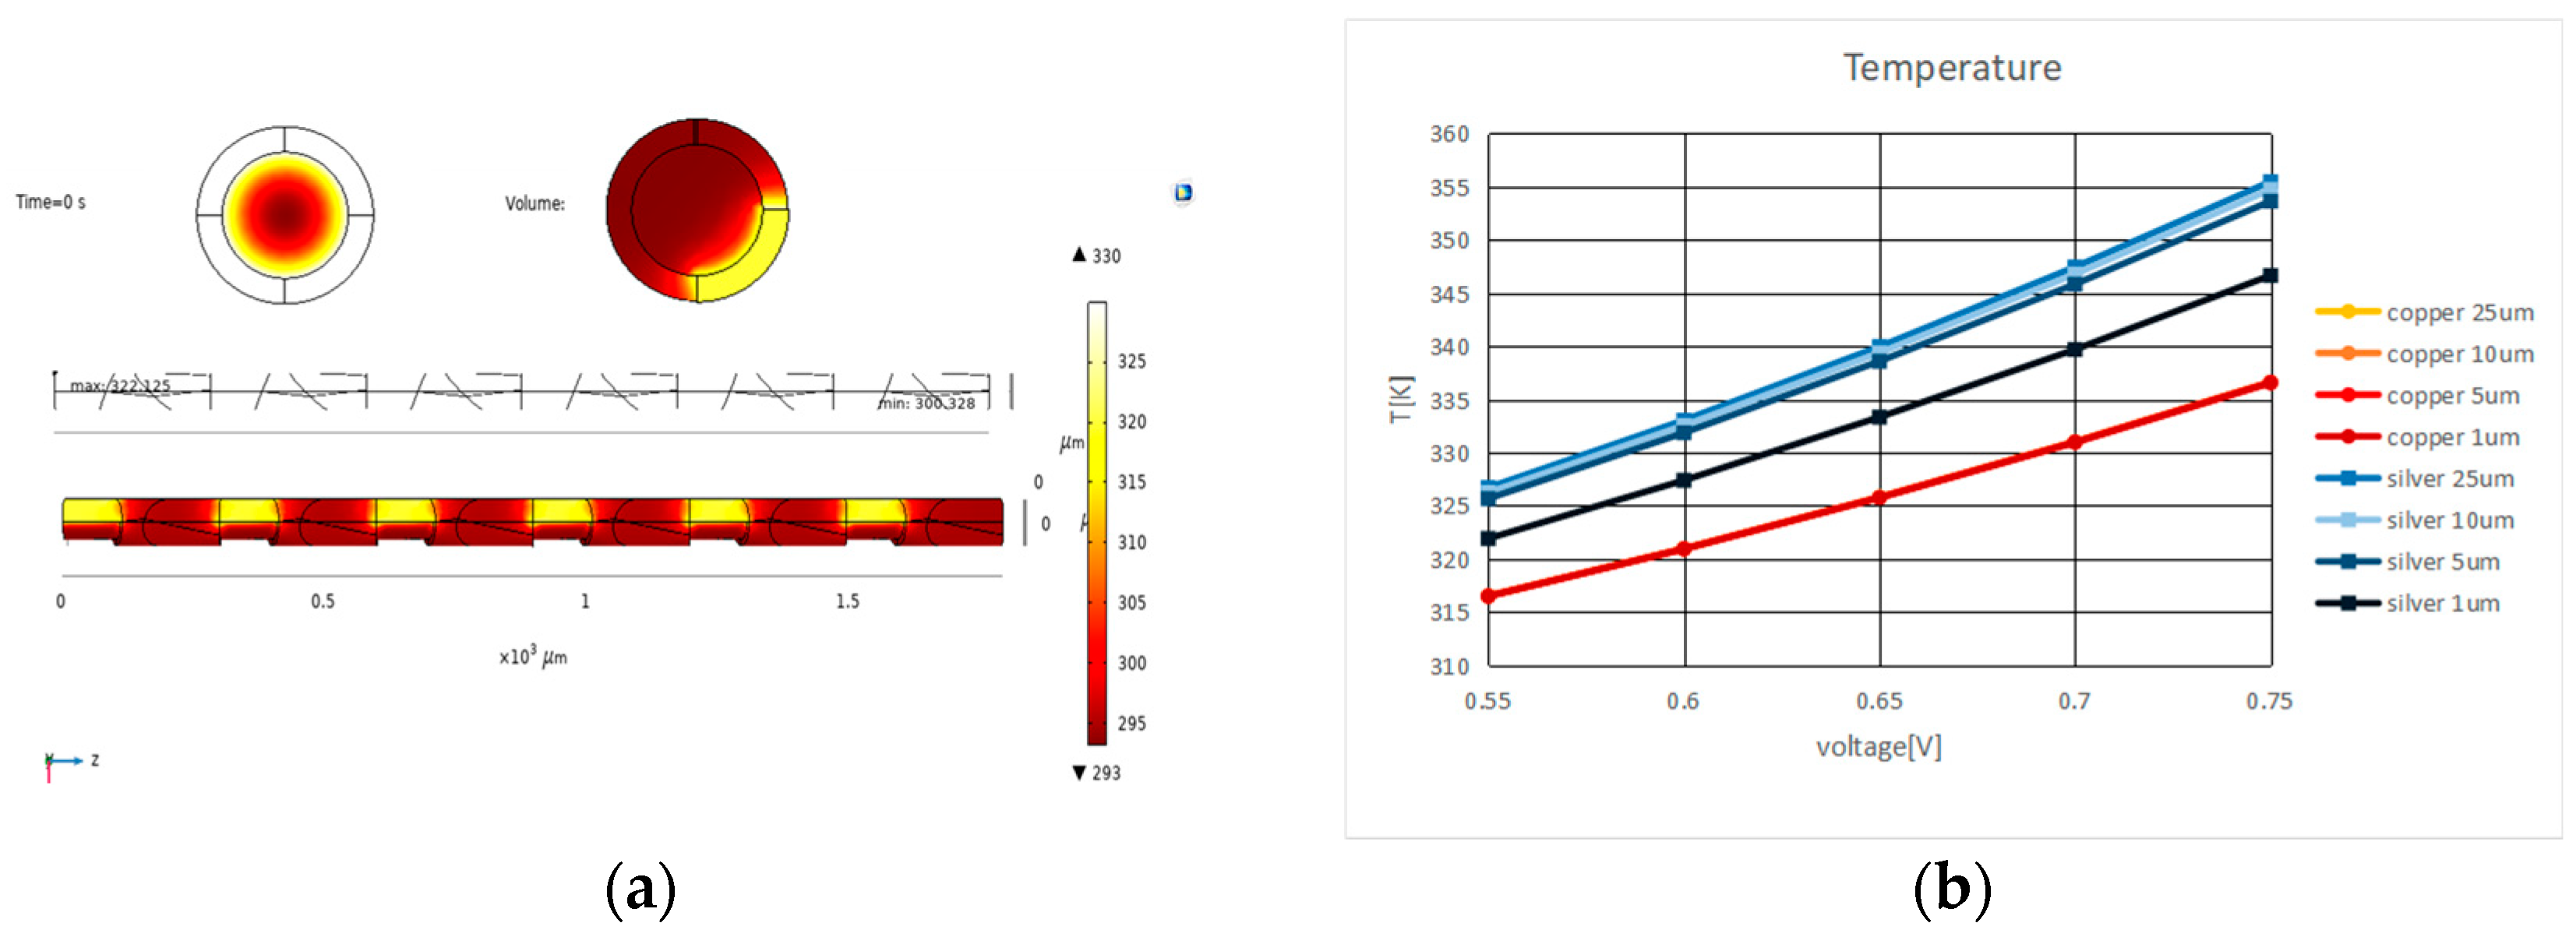
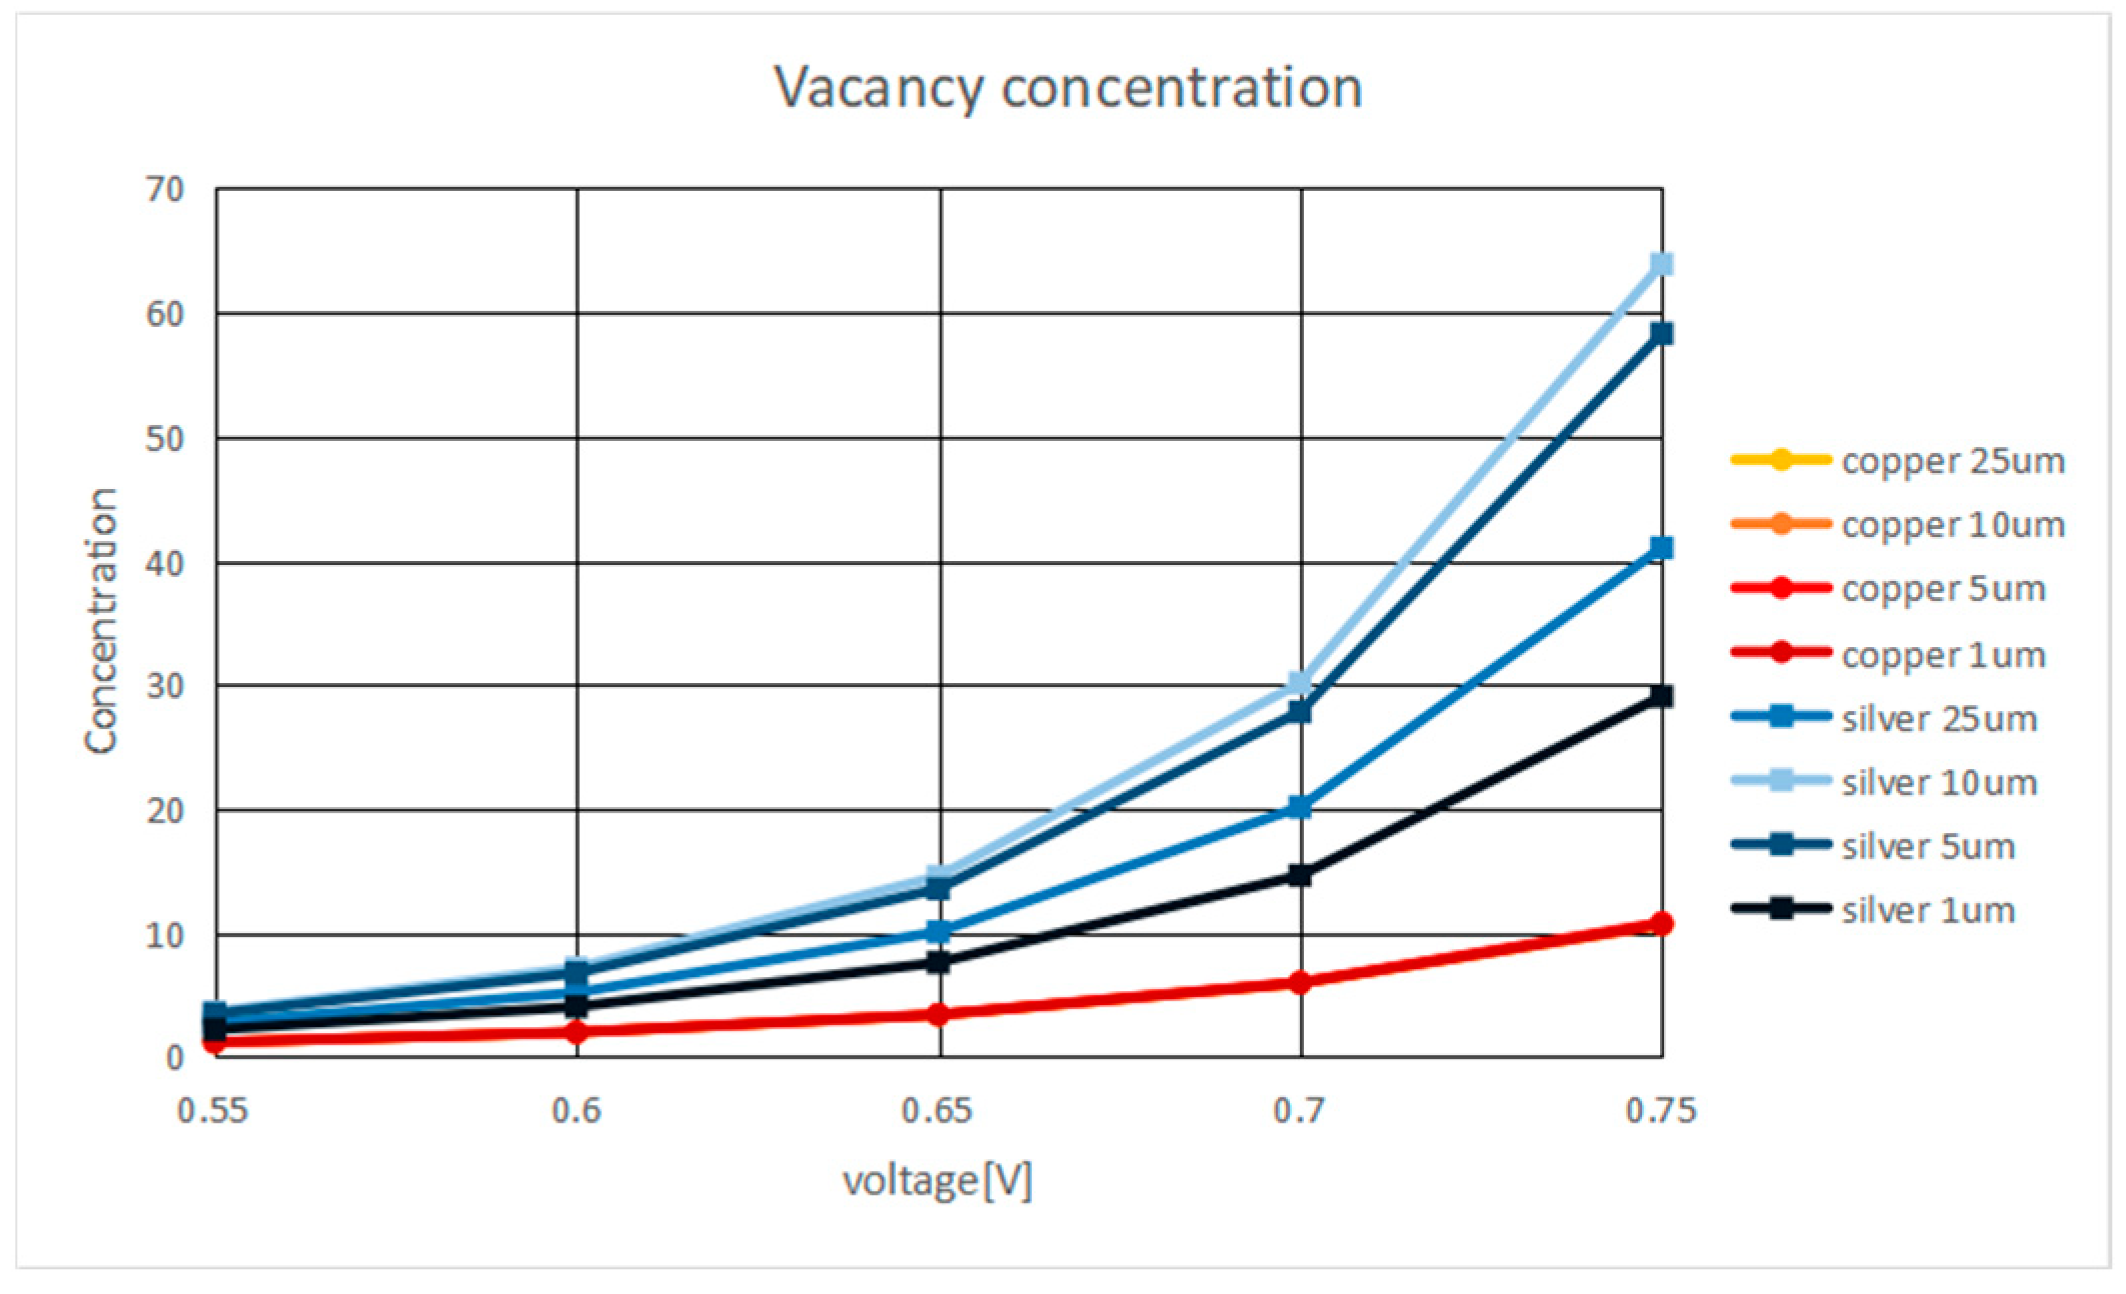
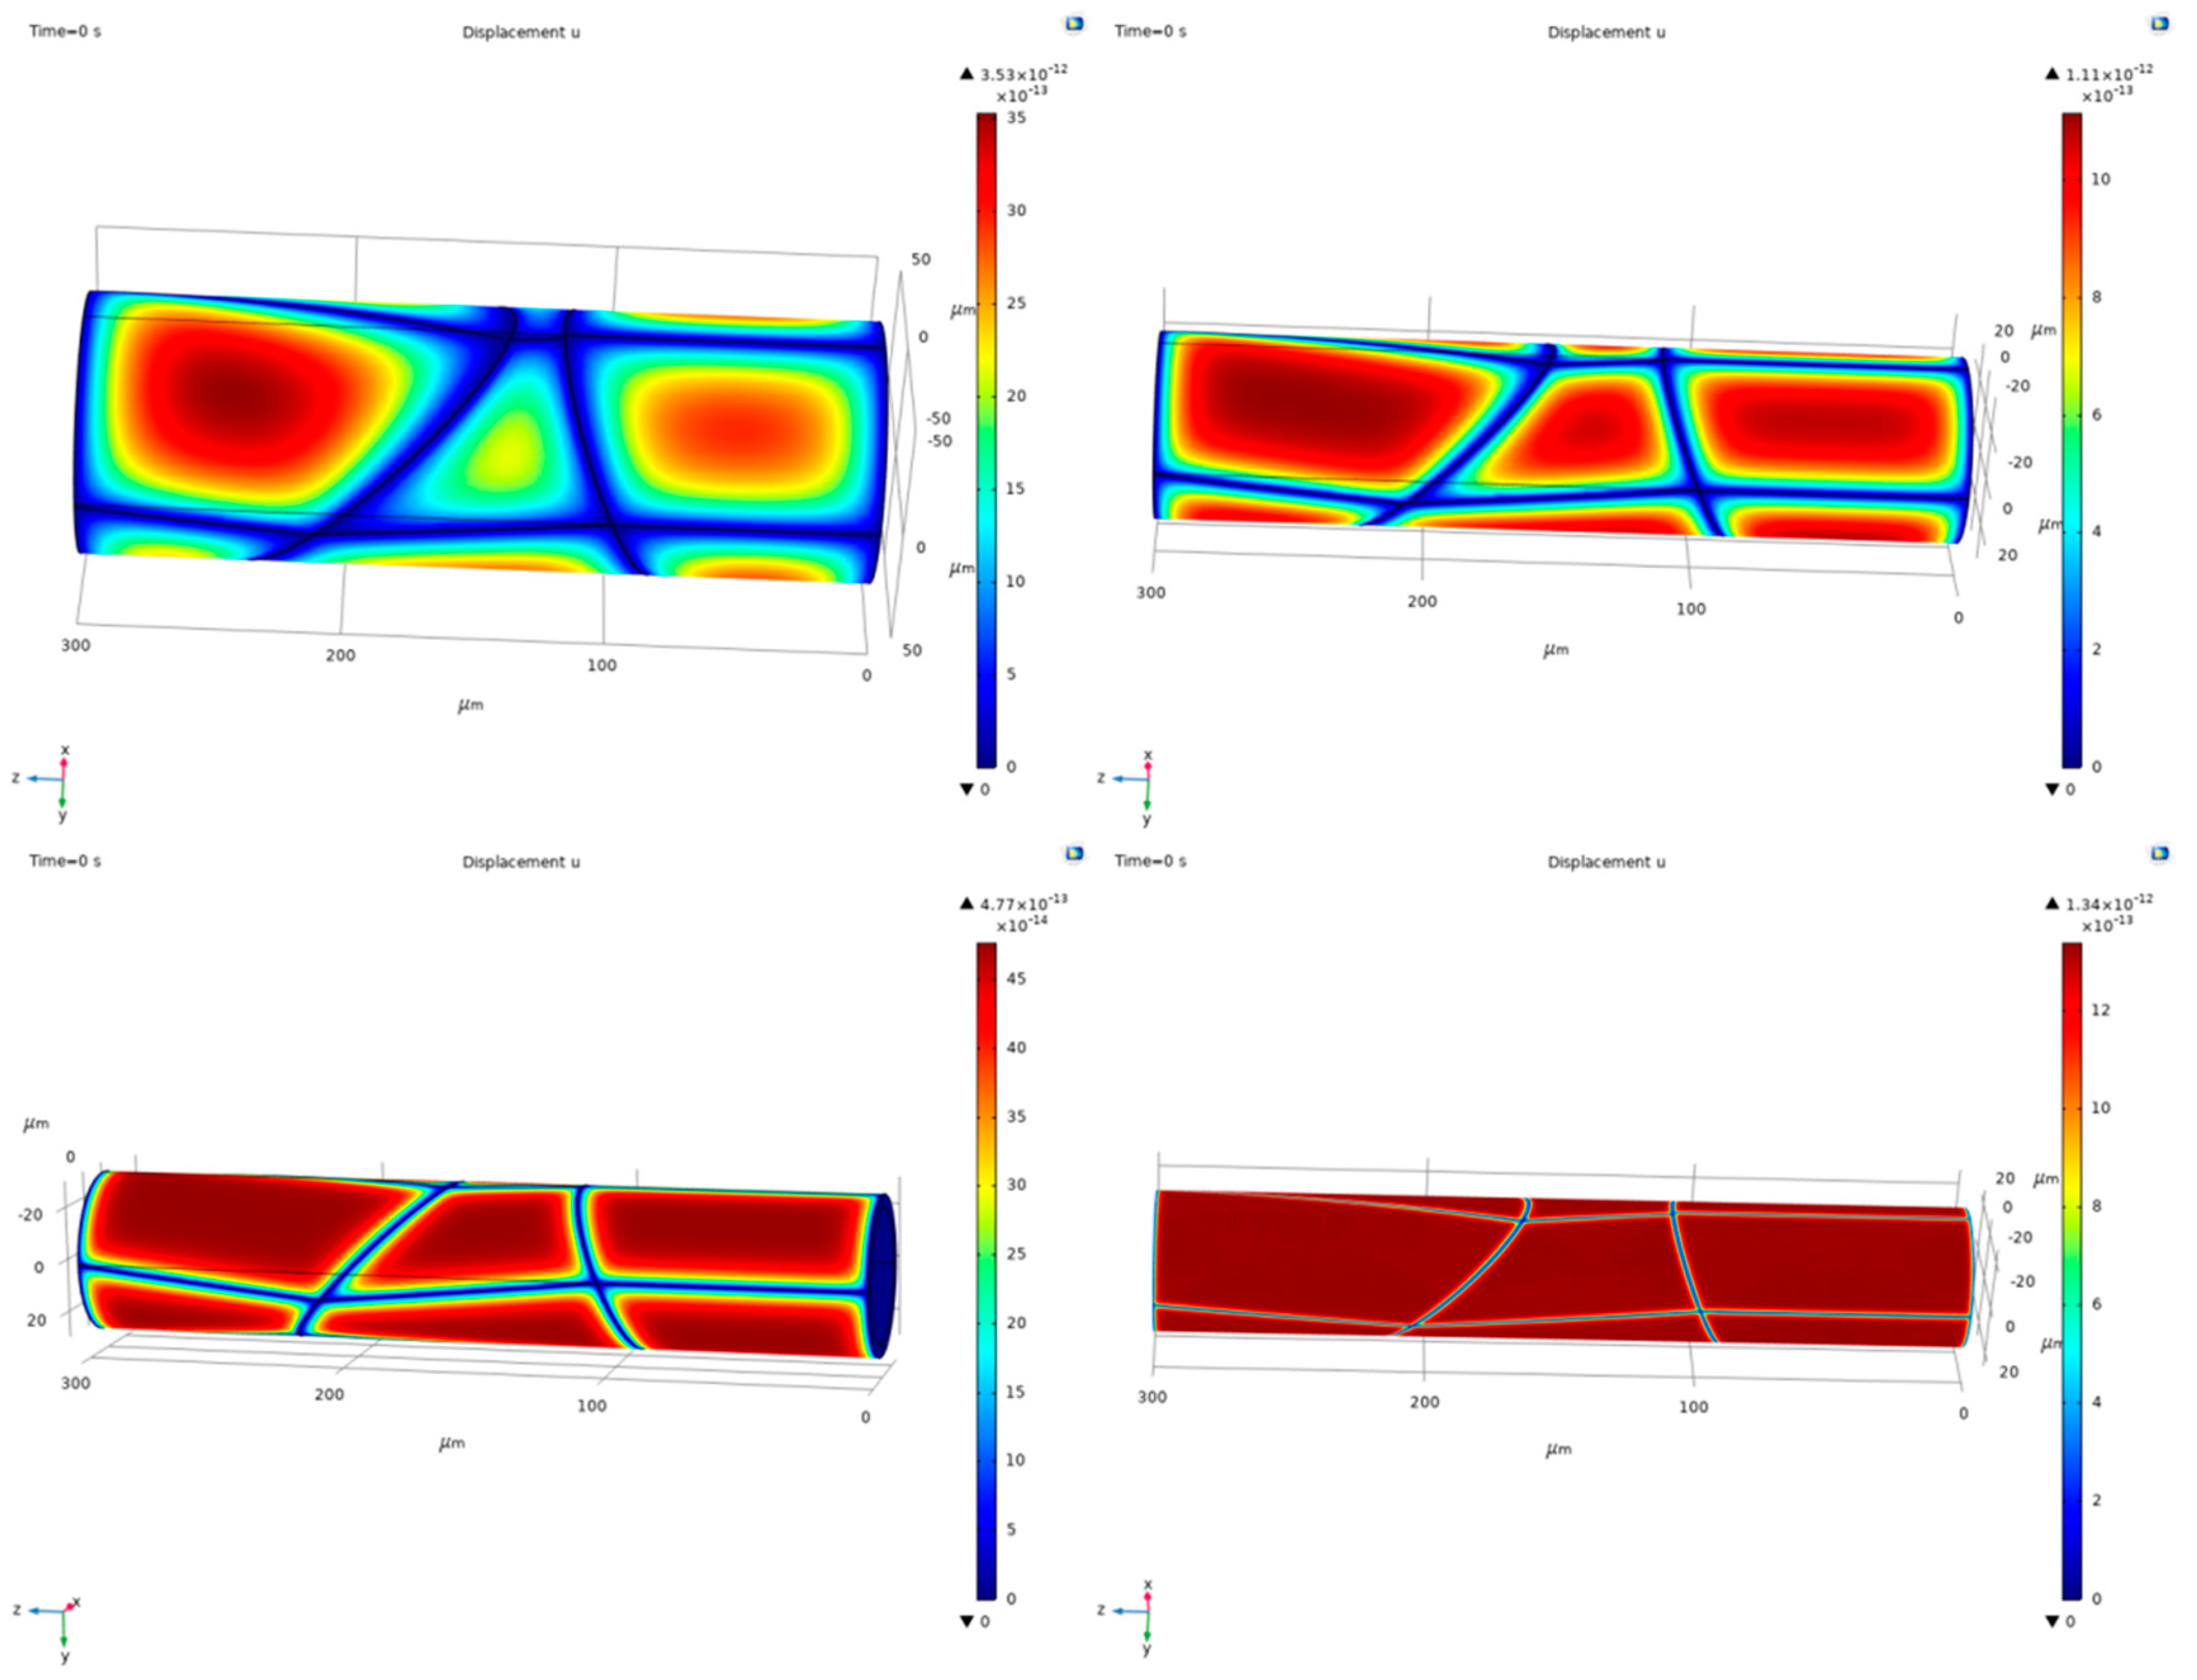
3. Simulation Results

A simplified model of a straight part of the yarn was built with an inner core and outer metal in the form of grains. For the inner core and outer metal, different materials as well as different coating thicknesses were investigated.
In Figure 2a, the temperature distribution in a yarn with missing grains is shown. A local temperature increase was found. This led to an increase in material movement at that position. In Figure 2b, the temperature depending on the applied voltage and the current density that was thus achieved for different coating thicknesses from 1 µm up to 25 µm are given. Under the same applied voltage, it was found that the silver-coated yarn showed higher temperatures compared to the copper-coated yarn. Furthermore, compared to the copper-coated yarn, the thickness of the silver-coated yarn influenced the maximum temperature.
In the second step of the simulation, the vacancy concentration was determined. From the crystallographic point of view, vacancies are point defects where atoms are missing and voids occur. It was found that the migration effect had a greater influence on thicker metal layers compared to the thinner metal layers (Figure 3) with increasing voltage as well as temperature. The reason for this was the higher material-dependent diffusion rate. The higher the values, the more probable it was that holes in the metal layer might have been created. The silver coating with 10 μm thickness was strongly affected by the migration effect and also might have had the highest risk of damage.
In the third step, the displacements based on the vacancy concentration were calculated. In Figure 4, the exemplary displacement distribution for the different metal coating thicknesses of 1 µm up to 25 µm for the 0.55 V copper metal is shown. It is obvious that, with the decreases in the thickness of the metal coating, the differences between the regions also decreased. In the boundary area of each grain size region, the displacement was always the smallest, and in the center area, the displacement was the largest. For the thickness under 5 μm, the maximum displacement of every region was the same. The direction of displacement was towards the outer side of the yarn surface. This means that the diffusion effect forced the metal coating to expand outward, while the amount of material on the inside surface decreased due to migration to the outside.
In the next case, the Cu/polyester; Ag/nylon like Shieldex®; and NiCu/polyester and NiCuCo/polyester yarns with thicknesses of 0.49 µm, 2.5 µm and 3.44 µm were investigated. The displacement increased with increasing voltage and coating thickness (Figure 5). The maximum displacement for the NiCuCo coating was found to be the lowest.

4. Conclusions

For different yarn coatings as well as coating thicknesses, the vacancy concentration as well as the displacement were determined. It was found that silver was most affected by the migration effect, followed by copper, and then the NiCu alloy, and the NiCuCo alloy was the least affected. Furthermore, missing grains influenced the thermal–electrical as well as mechanical behavior. In future, the investigation of mixed materials as well as a bended model will also be carried out. SEM and EDX analyses of different samples concerning the metal thickness and material composition will be carried out to better adapt these pre-analyses into real cases. In our investigation, we acquired better knowledge about the influence of the grain structure as well as the material on thermo-electrical and mechanical behavior.

Author Contributions

Conceptualization, K.W.-Z.; formal analysis, Y.H.; writing—original draft preparation, K.W.-Z.; writing—review and editing, K.W.-Z.; supervision, K.W.-Z. All authors have read and agreed to the published version of the manuscript.

Funding

This research received no external funding.

Conflicts of Interest

The authors declare no conflict of interest.

References

  1. Gonzalez, M.; Axisa, F.; Bulcke, M.V.; Brosteaux, D.; Vandevelde, B.; Vanfleteren, J. Design of metal interconnects for stretchable electronic circuits. Microelectron. Reliab. 2008, 48, 825–832. [Google Scholar] [CrossRef]
  2. Zhang, C.; Xiao, Y.; Qian, L. Study on the Modelling and tensile performance simulation of knitted fabric-based conductive line. J. Phys. Conf. Ser. 2021, 1759, 012030. [Google Scholar] [CrossRef]
  3. Dinh, T.D.; Weeger, O.; Kaijima, S.; Yeung, S.K. Prediction of mechanical properties of knitted fabrics under tensile and shear loading: Mesoscale analysis using representative unit cells and its validation. Compos. Part B 2018, 148, 81–92. [Google Scholar]
  4. Slade, J.; Agpaoa-Kraus, M.; Bowman, J.; Riecker, A.; Tiano, T.; Carey, C.; Wilson, P. Washing of Electrotextiles. MRS Proc. 2002, 736, D3.1.1–D3.1.7. [Google Scholar] [CrossRef]
  5. Eskandarian, L.; Lam, E.; Rupnow, C.; Meghrazi, M.A.; Naguib, H.E. Robust and Multifunctional Conductive Yarns for Biomedical Textile Computing. ACS Appl. Electron. Mater. 2020, 2, 1554–1566. [Google Scholar] [CrossRef]
  6. COMSOL Multiphysics®, version 6.2; COMSOL AB: Stockholm, Sweden, 2023. Available online: www.comsol.com(accessed on 20 December 2023).
Figure 1. (a) Geometry of the model with simplified grains; (b) sectional image along the z-axis.
Engproc 52 00017 g001
Figure 2. (a) Temperature distribution in a yarn with missing grains; (b) temperature depending on the applied voltage for copper and silver as the metal and metal thicknesses of 1 to 25 µm.
Engproc 52 00017 g002
Figure 3. Vacancy concentration depending on the applied voltage for copper- and silver-coated yarn with a metal thickness of 1 µm to 25 µm.
Engproc 52 00017 g003
Figure 4. Exemplary displacement distribution for the different metal coating thicknesses of 1 µm up to 25 µm for the 0.55 V applied voltage and Cu/polyester.
Engproc 52 00017 g004
Figure 5. Displacements vs. applied voltage for Cu/polyester; Ag/nylon like Shieldex®; and NiCu/polyester and NiCuCo/polyester yarns with thicknesses of 0.49 µm, 2.5 µm and 3.44 µm.
Engproc 52 00017 g005
Table 1. Yarn parameters and dimensions.
ParametersDimension (µm)
Length of the yarn300
Radius of the core25
Radius of the yarn with 25 µm coating 50
Radius of the yarn with 15 µm coating40
Radius of the yarn with 5 µm coating30
Radius of the yarn with 3.44 µm coating28.44
Radius of the yarn with 2.5 µm coating27.5
Radius of the yarn with 1 µm coating26
Radius of the yarn with 0.49 µm coating25.49
Table 2. Material properties of the materials used in the simulation.
Metal Coating/CoreCuAgNiCuNiCoCuNylonPolyester
Electrical Conductivity (S/m)5.998 × 1076.16 × 1073.448 × 1079.709 × 1051.00 × 10−111.00 × 10⁻¹³
Heat Capacity (J/(kg·K))38523538542017001700
Density (kg/m3)896010,5008940843011501380
1.91 × 10111.10 × 1011
Young’s Modulus (Pa)1.30 × 10119.00 × 10101.24 × 10112.35 × 10117.00 × 1081.0 × 109
6.70 × 10107.5 × 1010
Poisson’s Ratio0.350.370.320.450.390.35
Thermal Conductivity (W/(m·K))40042920911.20.260.19
Thermal Expansion Coefficient (1/K)1.7 × 10−51.89 × 10−51.76 × 10−51.28 × 10−51.0 × 10−51.50 × 10−5
Disclaimer/Publisher’s Note: The statements, opinions and data contained in all publications are solely those of the individual author(s) and contributor(s) and not of MDPI and/or the editor(s). MDPI and/or the editor(s) disclaim responsibility for any injury to people or property resulting from any ideas, methods, instructions or products referred to in the content.

