Abstract
In this work, the land surface temperature time series derived using Thermal InfraRed (TIR) satellite data offers the possibility to detect thermal anomalies by using the PCA method. This approach produces very detailed maps of thermal anomalies, both in geothermal areas and in urban areas. Tests were conducted on the following three Italian sites: Solfatara-Campi Flegrei (Naples), Parco delle Biancane (Grosseto) and Modena city.
1. Introduction
Thermal anomalies, i.e., areas where the surface temperature has a value significantly different from the background, are potentially related to the underground energy sources or to land use and coverage variations in urban areas where the urban heat island (UHI) phenomenon can be observed. Current satellite missions, providing imagery in the Thermal InfraRed (TIR) spectral region at 90–100 m of spatial resolution, provide the potential to estimate the land surface temperature (LST) and highlight the main surface thermal anomalies [1,2,3,4,5,6]. In this work, two case studies were carried out. The first case study is the detection of thermal anomalies on geothermal active areas (volcanic or not). The second focuses on the detection of UHIs [7,8]. Both the studies are based on the remote sensing LST time series. In both the case studies, the thermal anomalies’ detection is also inspected using the principal component analysis (PCA) of the LST time series.
2. Materials and Methods
All the analyses are based on the following two types of data: Advanced Spaceborne Thermal Emission and Reflection Radiometer (ASTER) and the Landsat 8 satellite data, with a 90-m and 100-m pixel spatial resolution, respectively, in TIR channels (8–12 µm) and a temporal resolution of 16 days.
In the first study, nighttime ASTER and TIRS/Landsat 8 time series have been processed using the following two different methodologies: the Temperature and Emissivity Separation (TES, [9]) algorithm for ASTER and the Single Channel Algorithm (SCA, inverting radiative transfer equation, already tested in [10,11]) for Landsat 8. Two LST time series have been obtained and the results are cross-compared and validated with ground measurements. TES and SCA are well-known methodologies and have been used to evaluate LST on the following two different test sites with different geological features: the volcanic area of Solfatara-Campi Flegrei (near Naples, Italy) and the geothermal area of Parco delle Biancane (near Grosseto, Italy).
The second case study has been addressed to the characterization of the UHI of the city of Modena (Italy). The analysis is based on nighttime TIRS/Landsat 8 image time series processed using the SCA methodology.
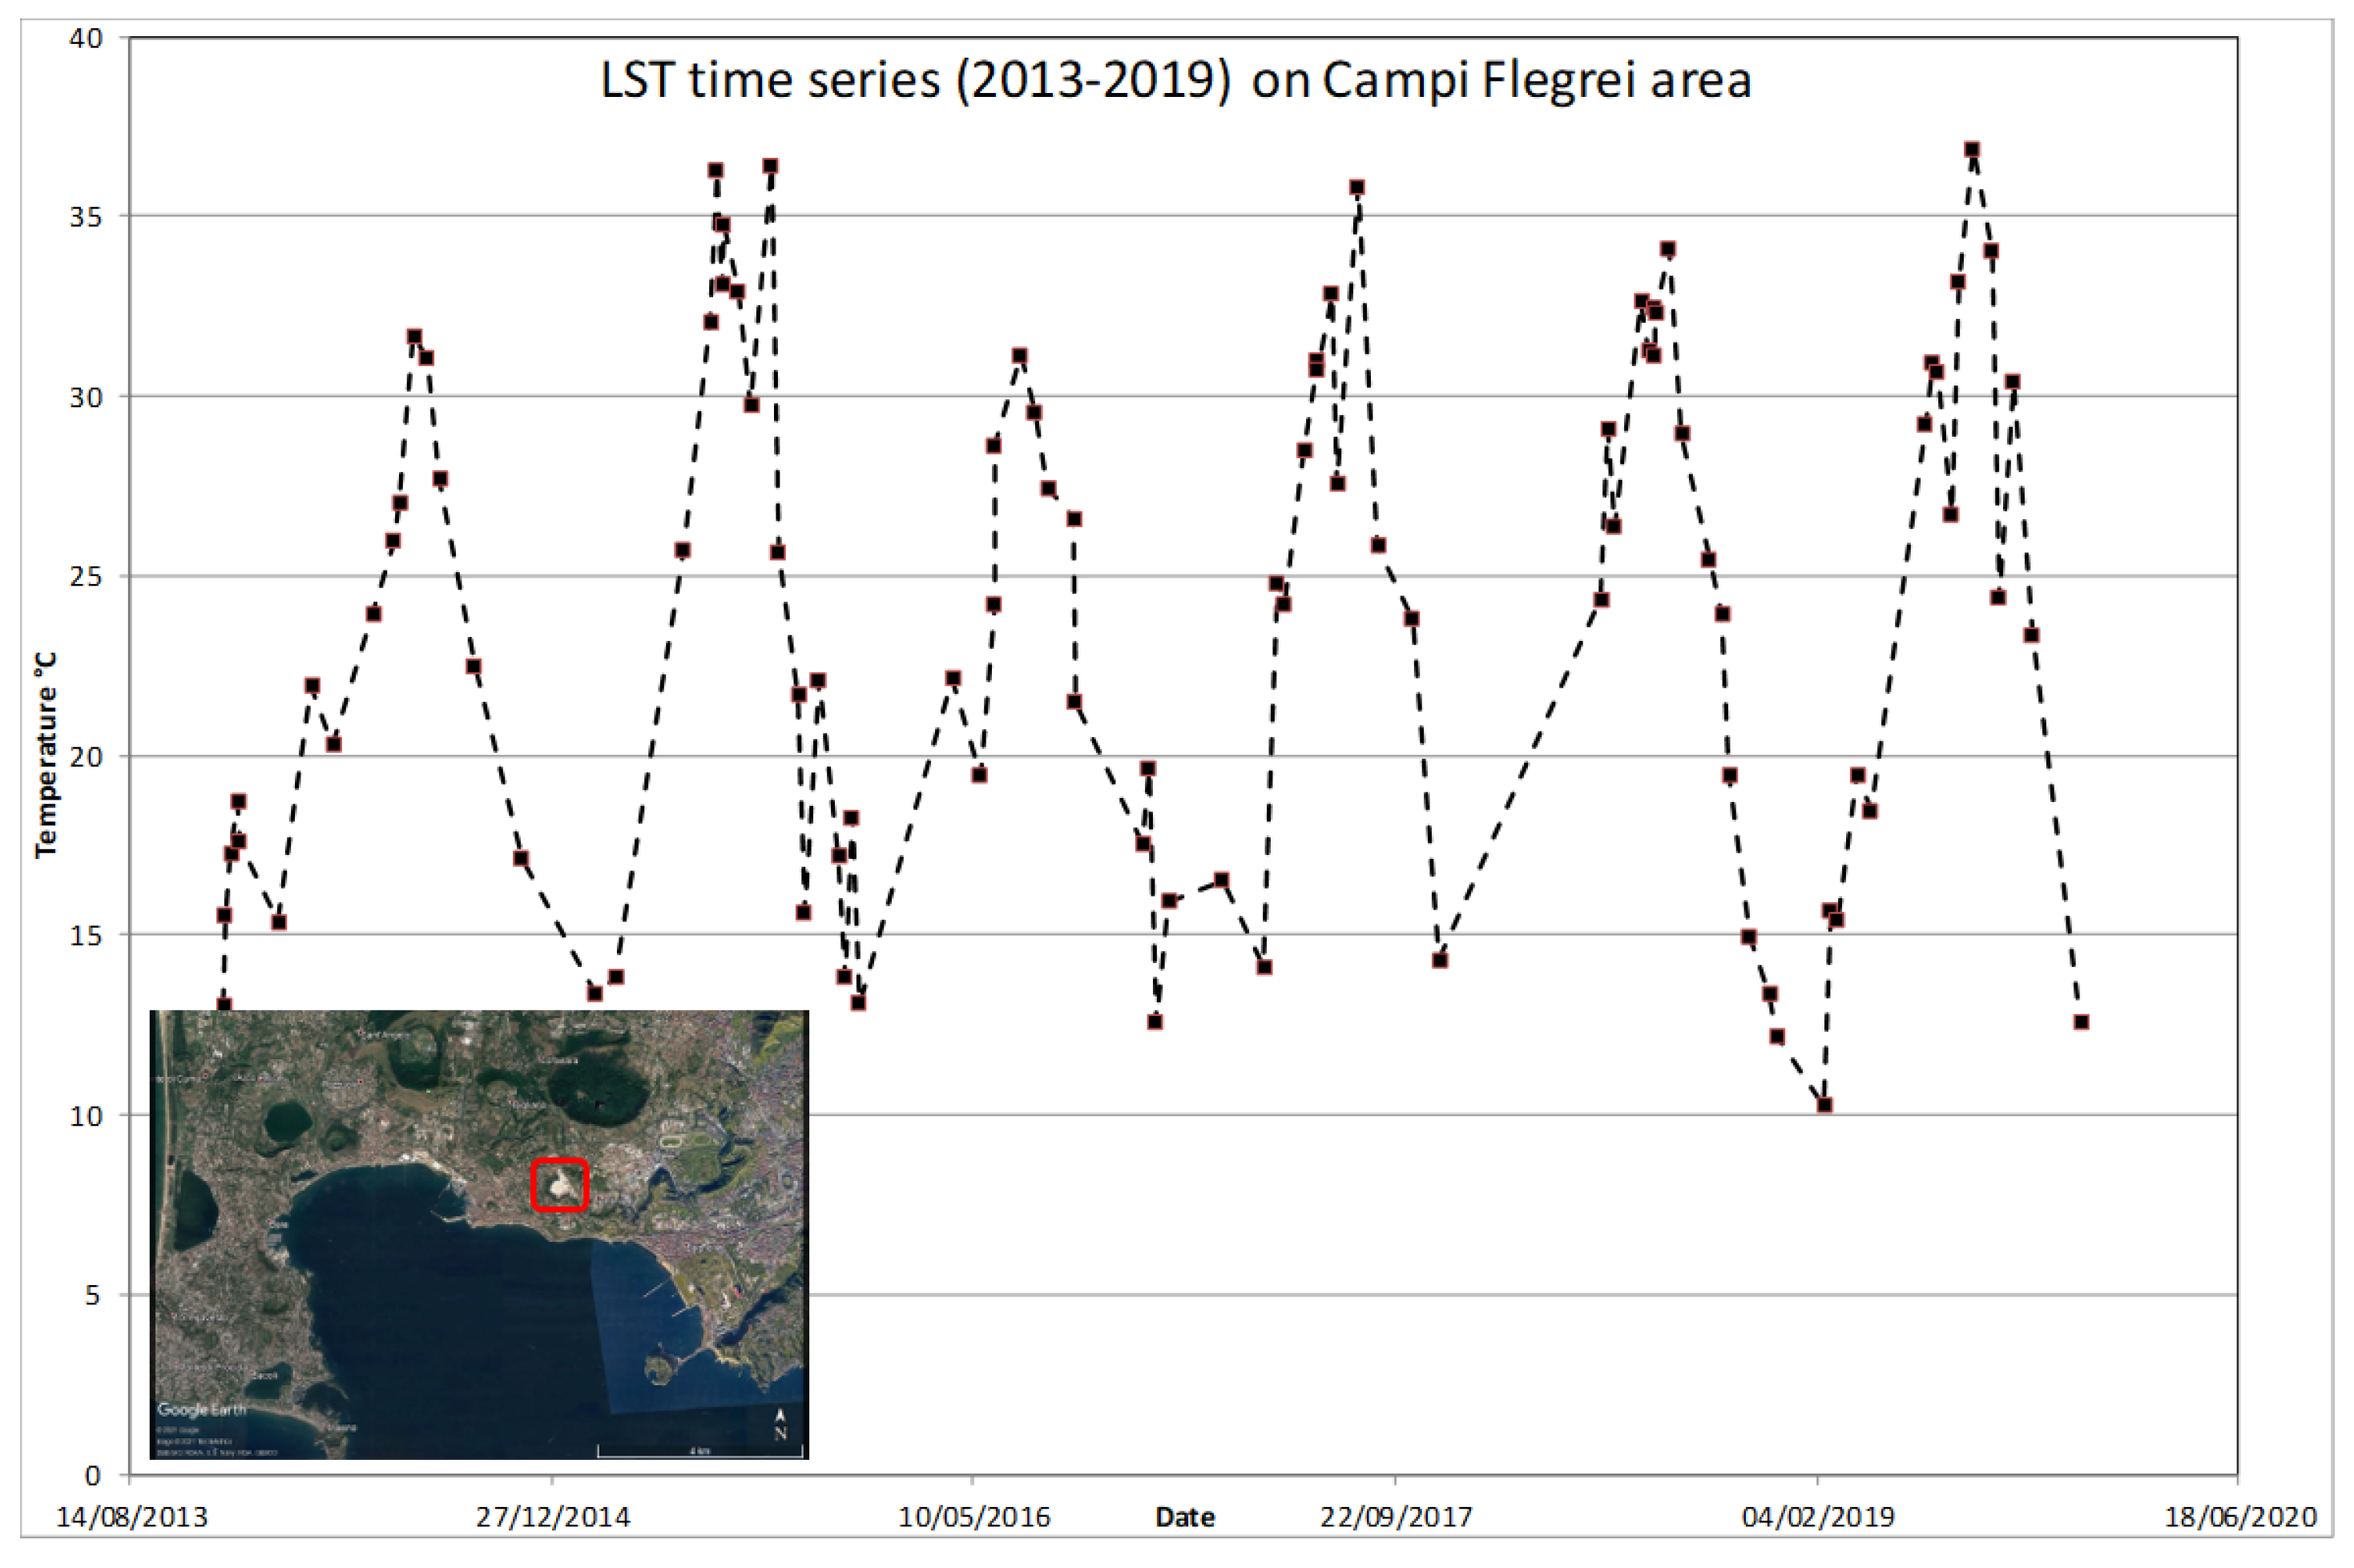
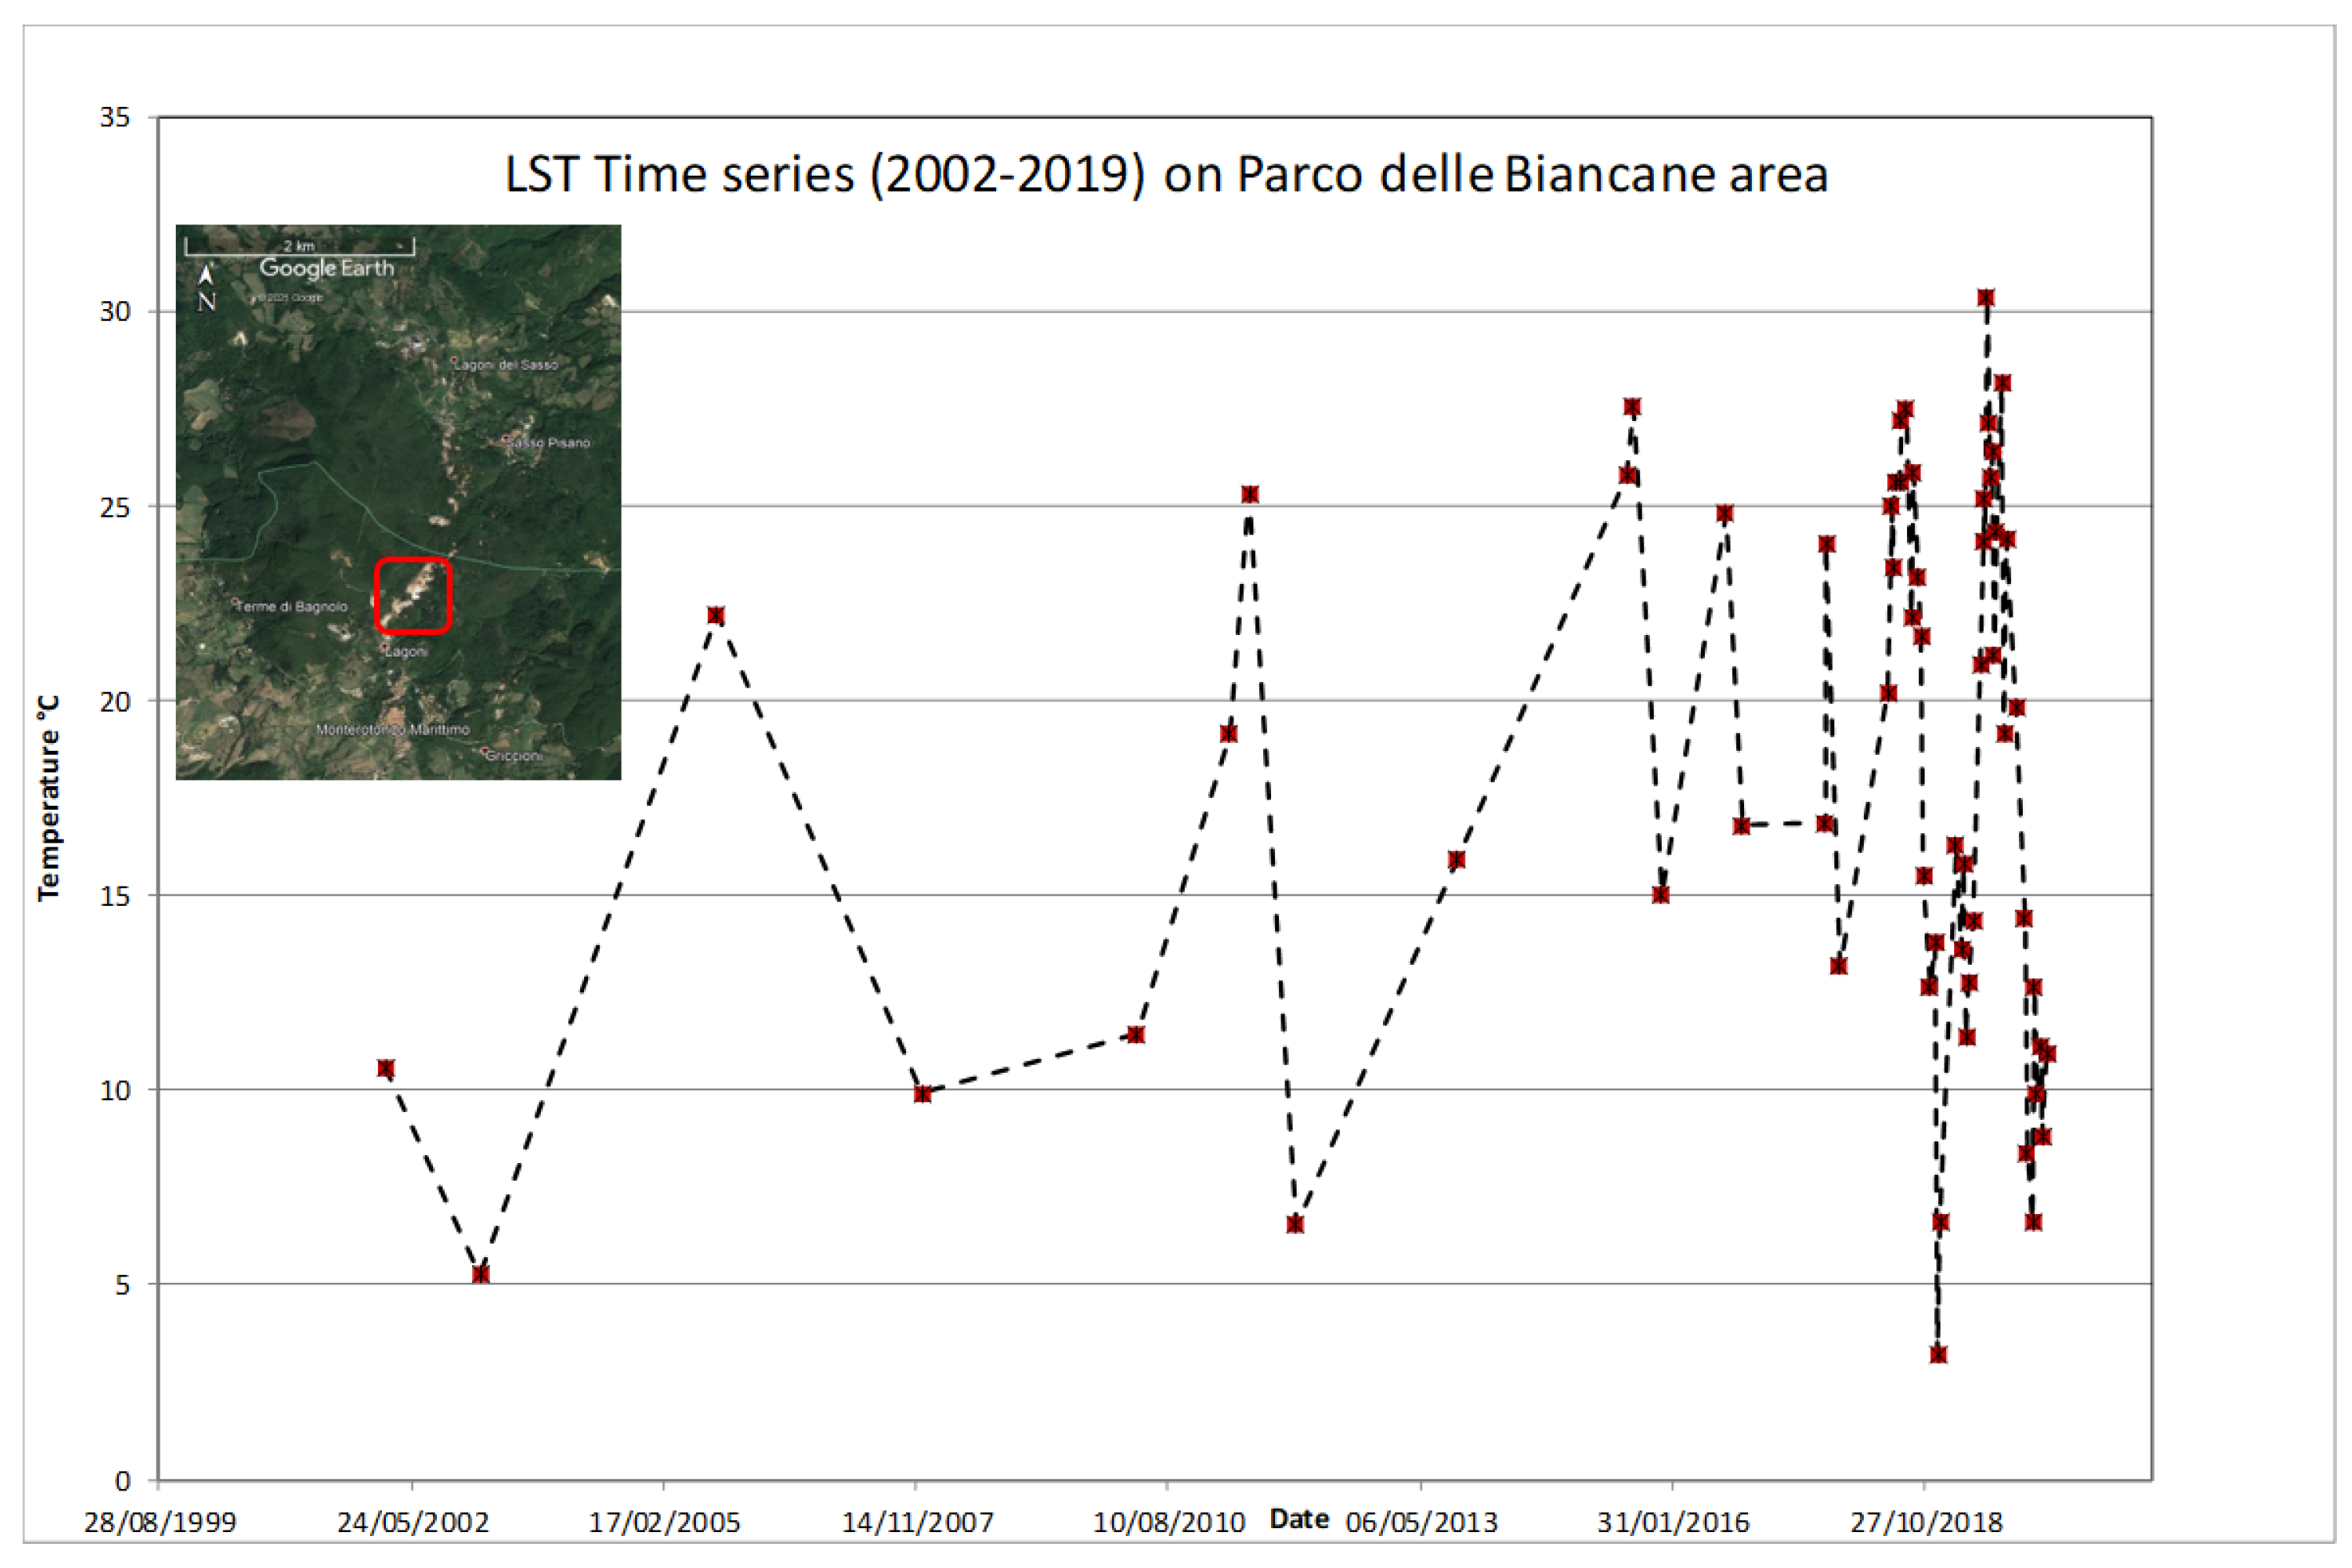
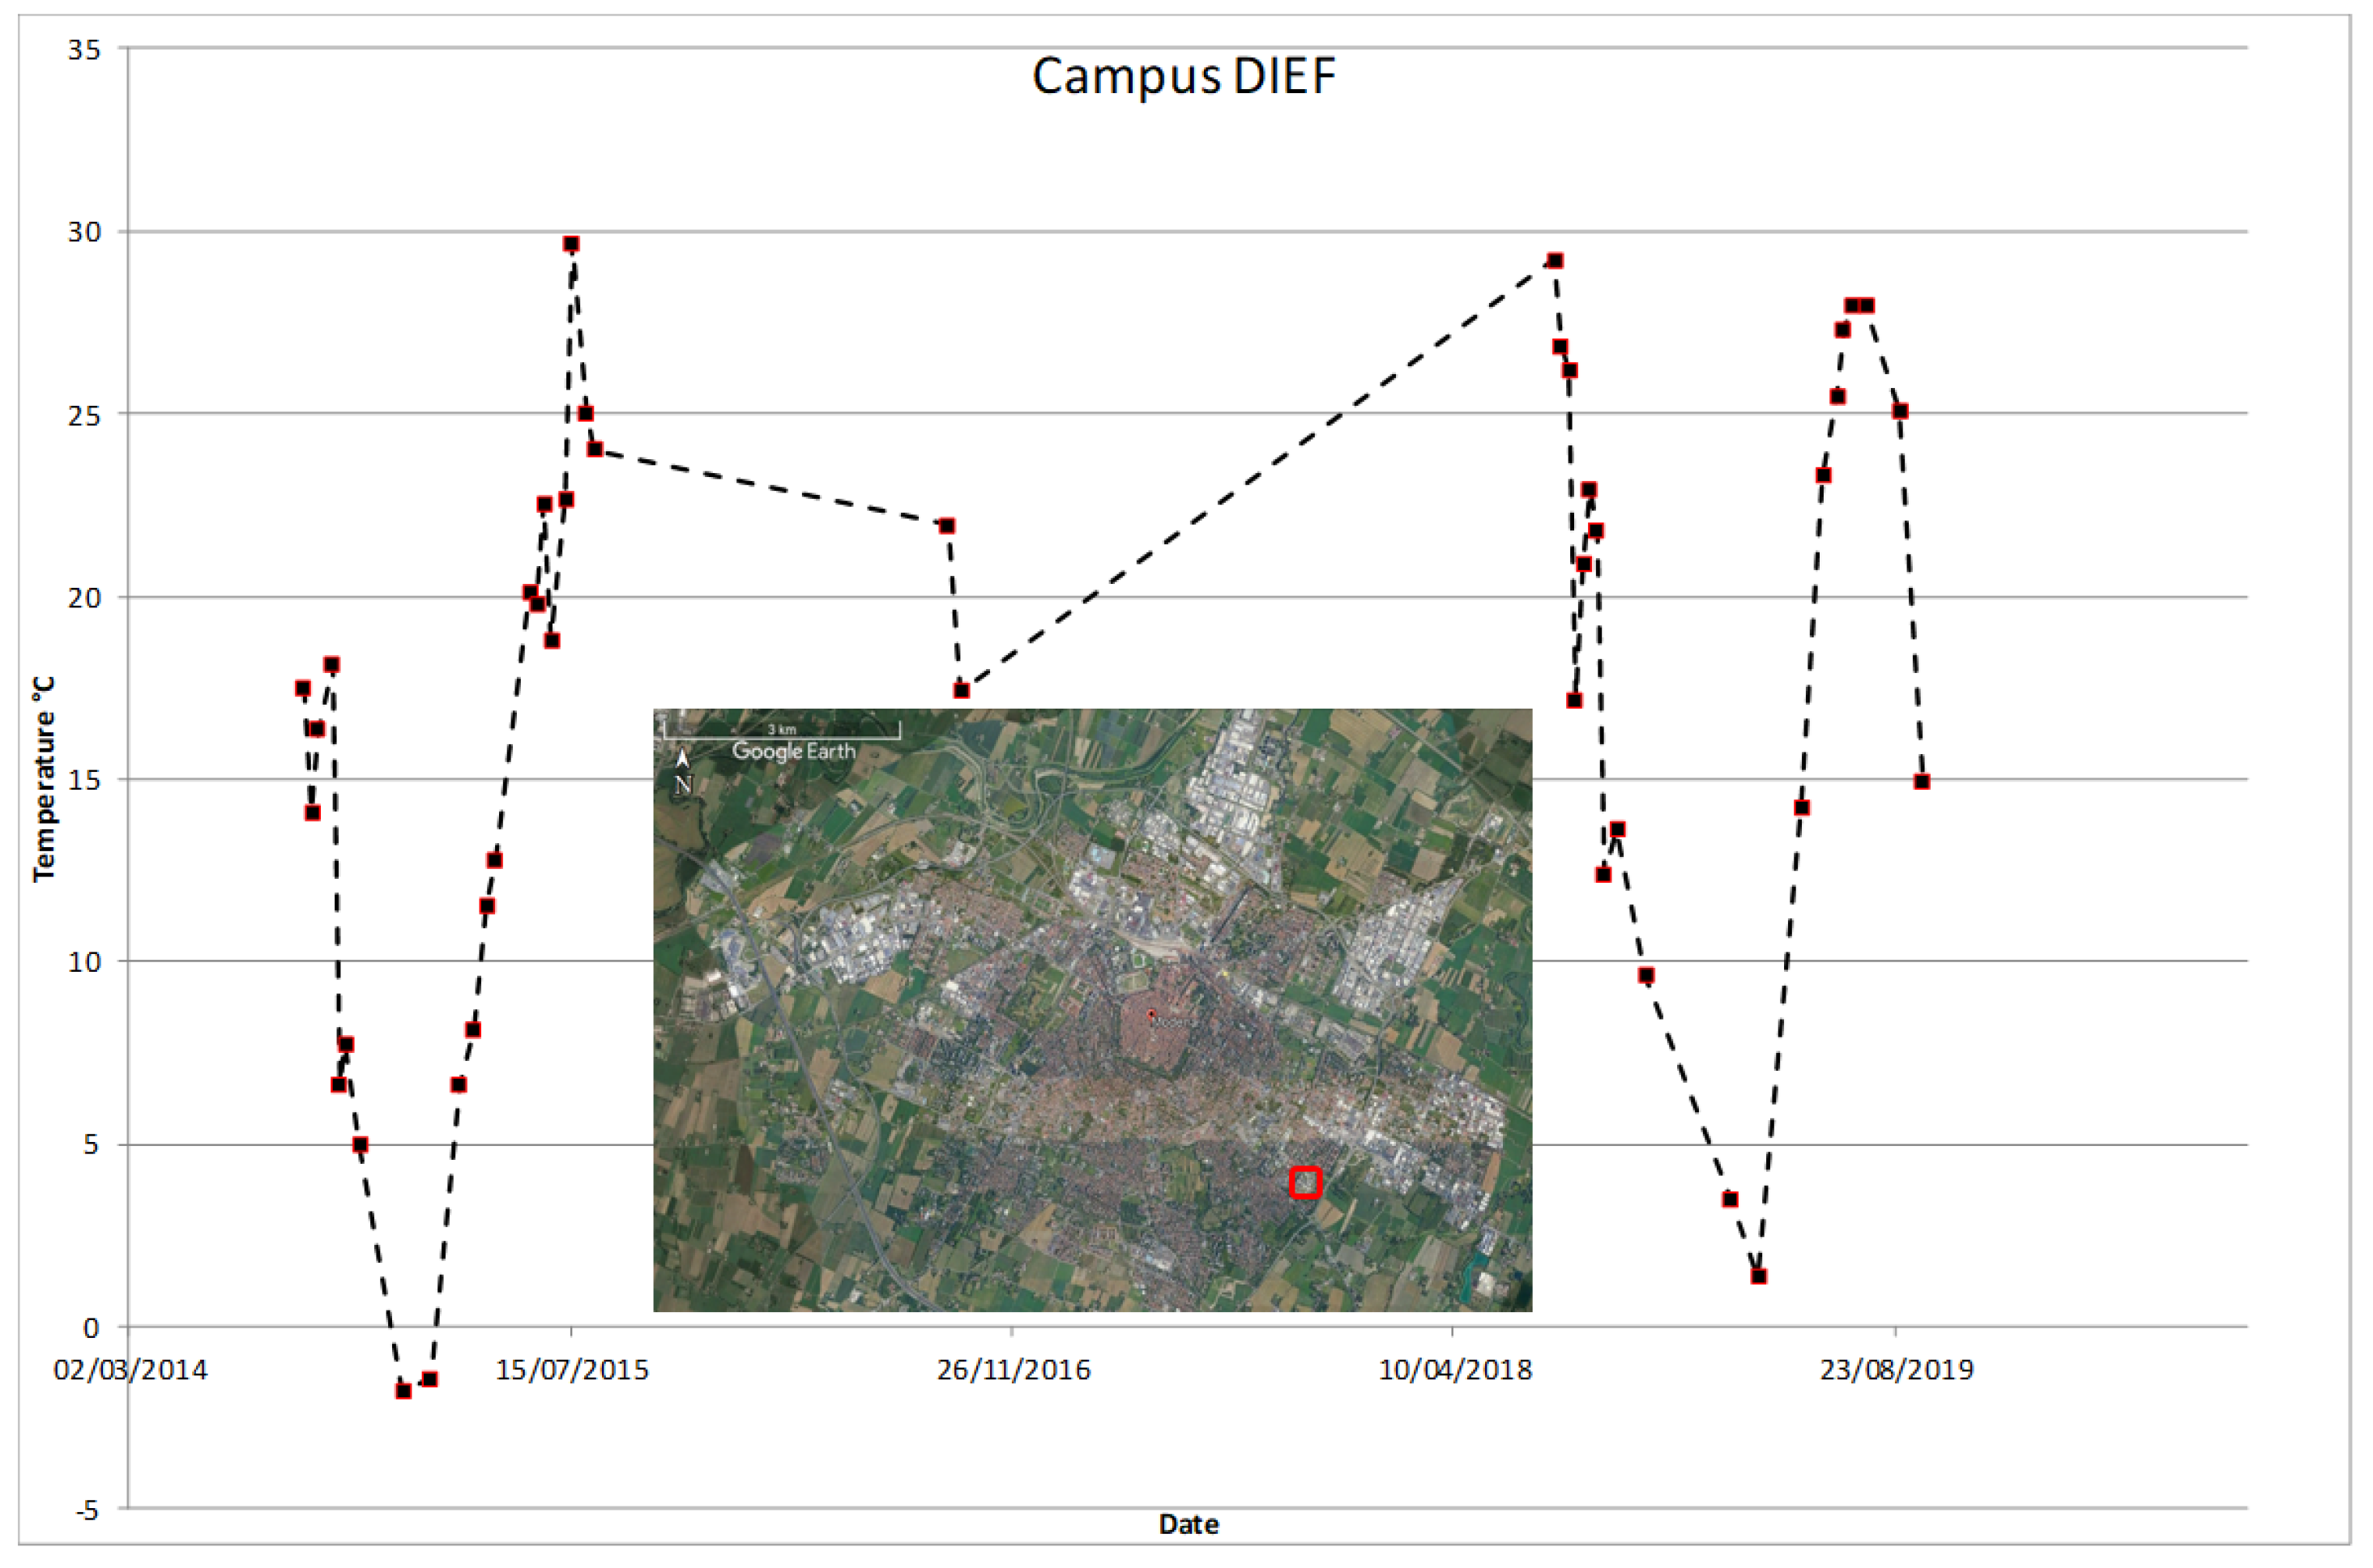
The availability of a substantial number of these satellite data for the three test sites (as reported in Table 1) offered the possibility of obtaining three LST time series over a long period (Figure 1, Figure 2 and Figure 3), thus allowing an accurate analysis of thermal anomalies.

Table 1.
LST processed for three test sites.
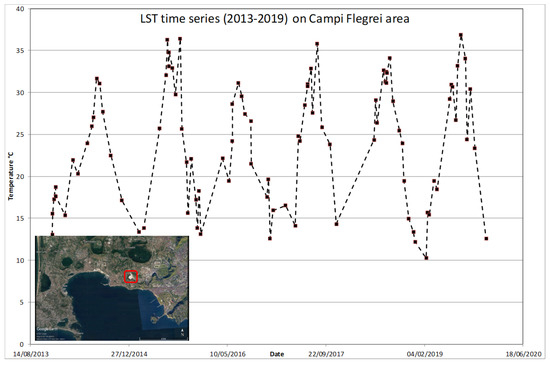
Figure 1.
LST Time series on Solfatara-Campi Flegrei test site. Plot referred to is the red box area.

Figure 2.
LST Time series on Parco delle Biancane test site. Plot referred to is the red box area.
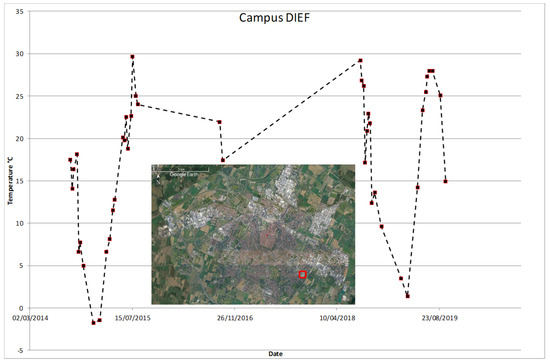
Figure 3.
LST Time series on Modena city (Campus-DIEF) test site. Plot referred to is the red box area.
The relative accuracy of the LST estimates can be assessed in comparison to the ground measures provided by the ground network that operates independently of the satellites. Alternatively, the accuracy can be estimated by a cross-validation between the products obtained with different LST retrieval algorithms and/or for different sensors, even if largely complicated by the spatial scale mismatch between the satellite sensors and/or the ground-based sensors. In fact, the areas observed by ground radiometers usually cover small areas, whereas satellite measurements in the thermal infrared typically cover between 1 and 100 km2. In this case, the following data have been used for the validation steps:
- for Solfatara-Campi Flegrei, the ground measurements collected by permanent thermal cameras installed in Solfatara volcano. The images have been reprojected to have the same point of view as the satellite;
- for Parco delle Biancane, the TIR images acquired using thermal cameras mounted on drones and collected during three separated field campaigns synchronized with satellite passages;
- for Modena, weather stations at the 4 stations around Modena city.
3. Results and Discussion
In both case studies (natural and urban areas), the thermal anomalies’ detection is inspected using the principal component analysis (PCA) on the LST time series obtained by processing the satellite data. In this work, analysis on the use of PCA has demonstrated the possibility of detecting thermal anomalies in studied sites, neglecting the seasonality effect present in long LST time series. The use of nighttime data has been considered to remove the “noise” due to the solar irradiation that is strong during the day.
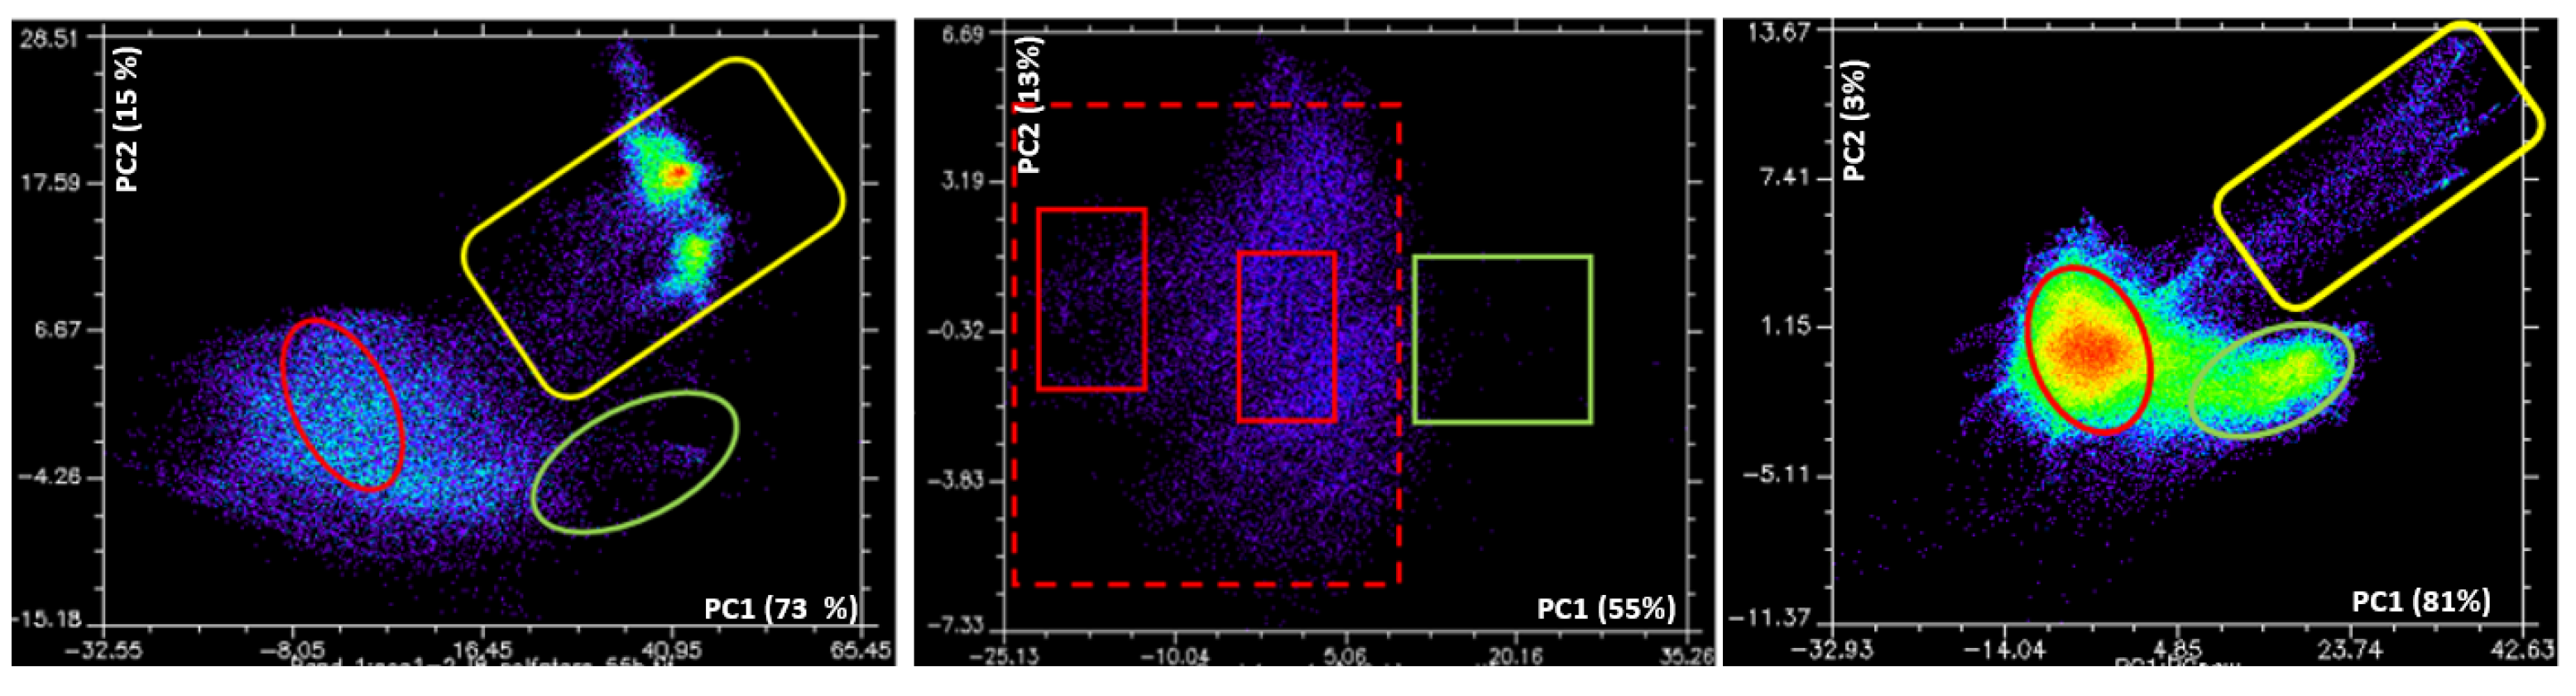
PCA allowed the extraction of the dominant patterns within the time series as the detection of thermal anomalies, offering a good and easy way to produce very detailed maps of thermal anomalies, both in geothermal areas and in urban areas (UHI). Thermal anomalies were detected by considering the first two PCs and selecting three sets of pixels from the clusters used as endmembers for the maximum likelihood classification. The position of the cluster, which has been selected considering the PC1 and PC2, is approximatively the same in the three scatter plots (Figure 4). The thermal anomaly points (geothermal or UHI), background points (rural areas for UHI) and water points (sea, lakes, rivers) are grouped in distinct sectors of the scatter plots. This leads to the conclusion that thermal anomalies can also be individuated using this combination of PC components of the time series of temperature images derived from satellite imagery.
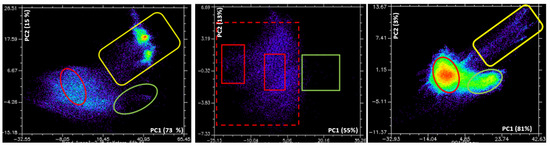
Figure 4.
PC1 vs. PC2 cluster: Campi Flegrei (left), Parco delle Biancane (middle), Modena City (right). Yellow line represents the water cluster, red line the background (land, rural areas) and green line represents the thermal anomaly or warm area due to UHI.
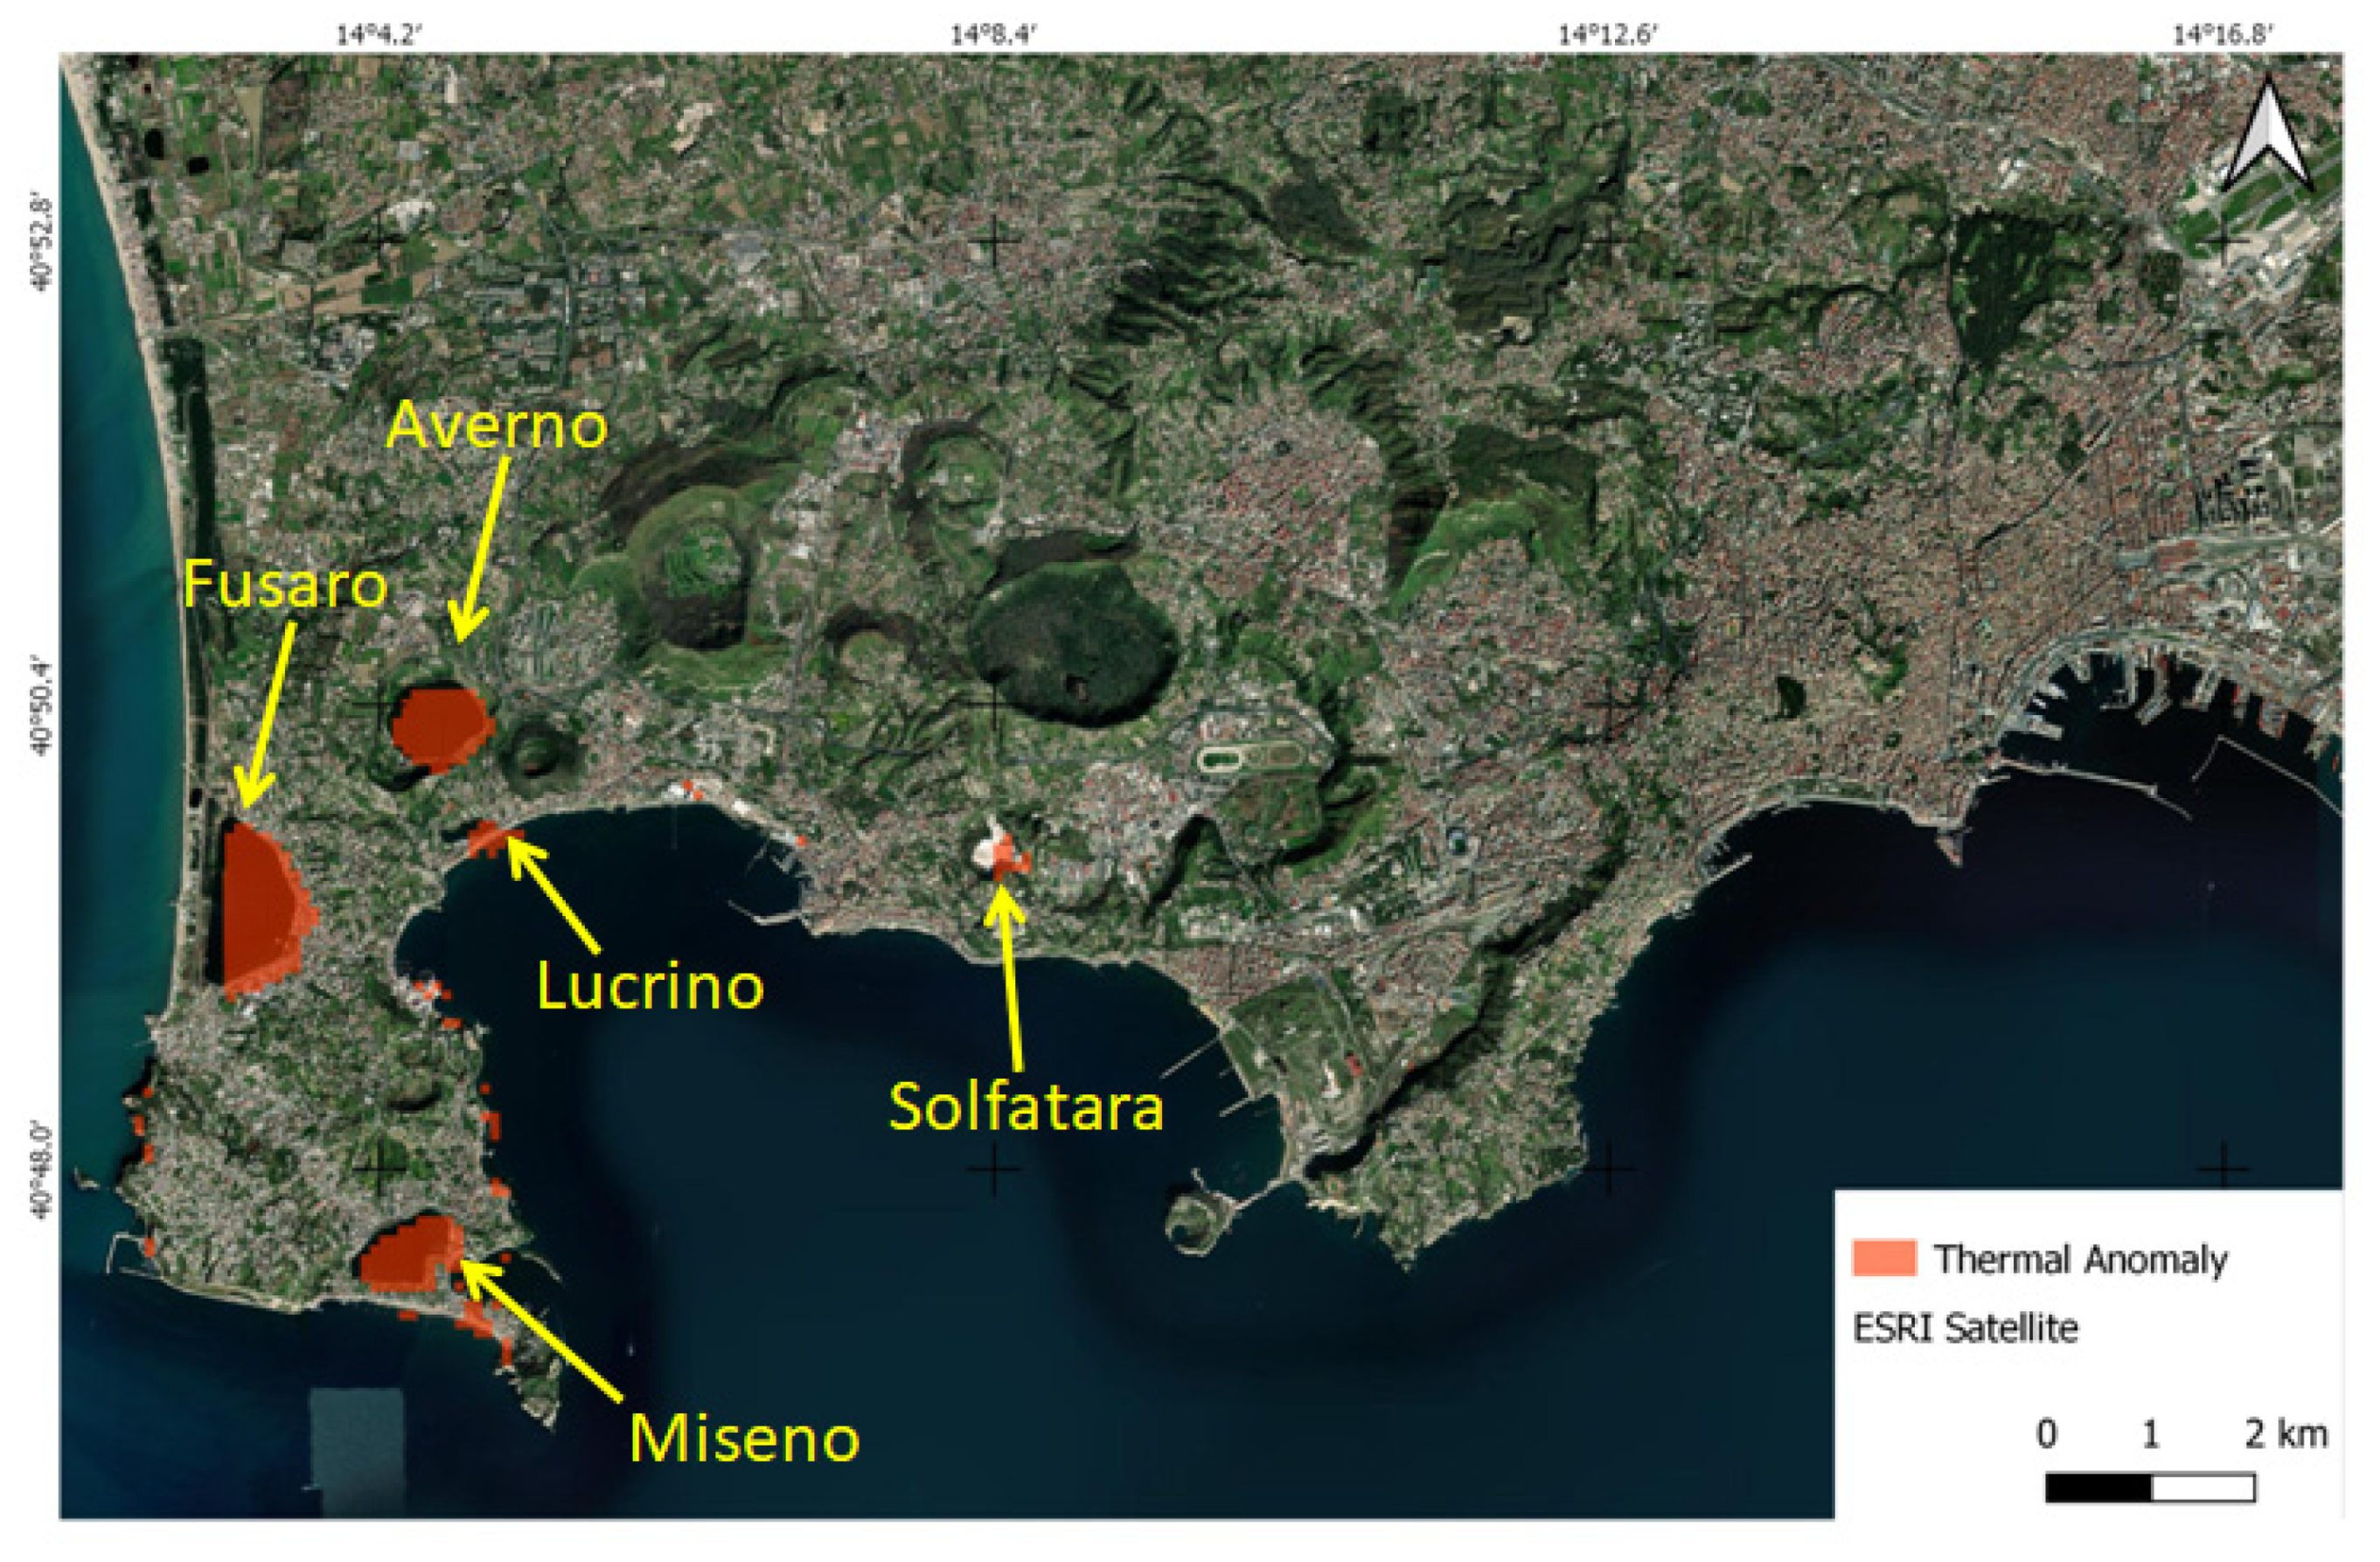
In Figure 5, the main warm areas are the Solfatara volcano and the lakes that have a temperature greater than the land during the night.

Figure 5.
The red areas represent the results obtained for Landsat 8 data in the Solfatara-Campi Flegrei area.
A comparison with a different methodology is also presented, confirming that satellite data can be a very powerful tool to study surface thermal anomalies quantitatively.
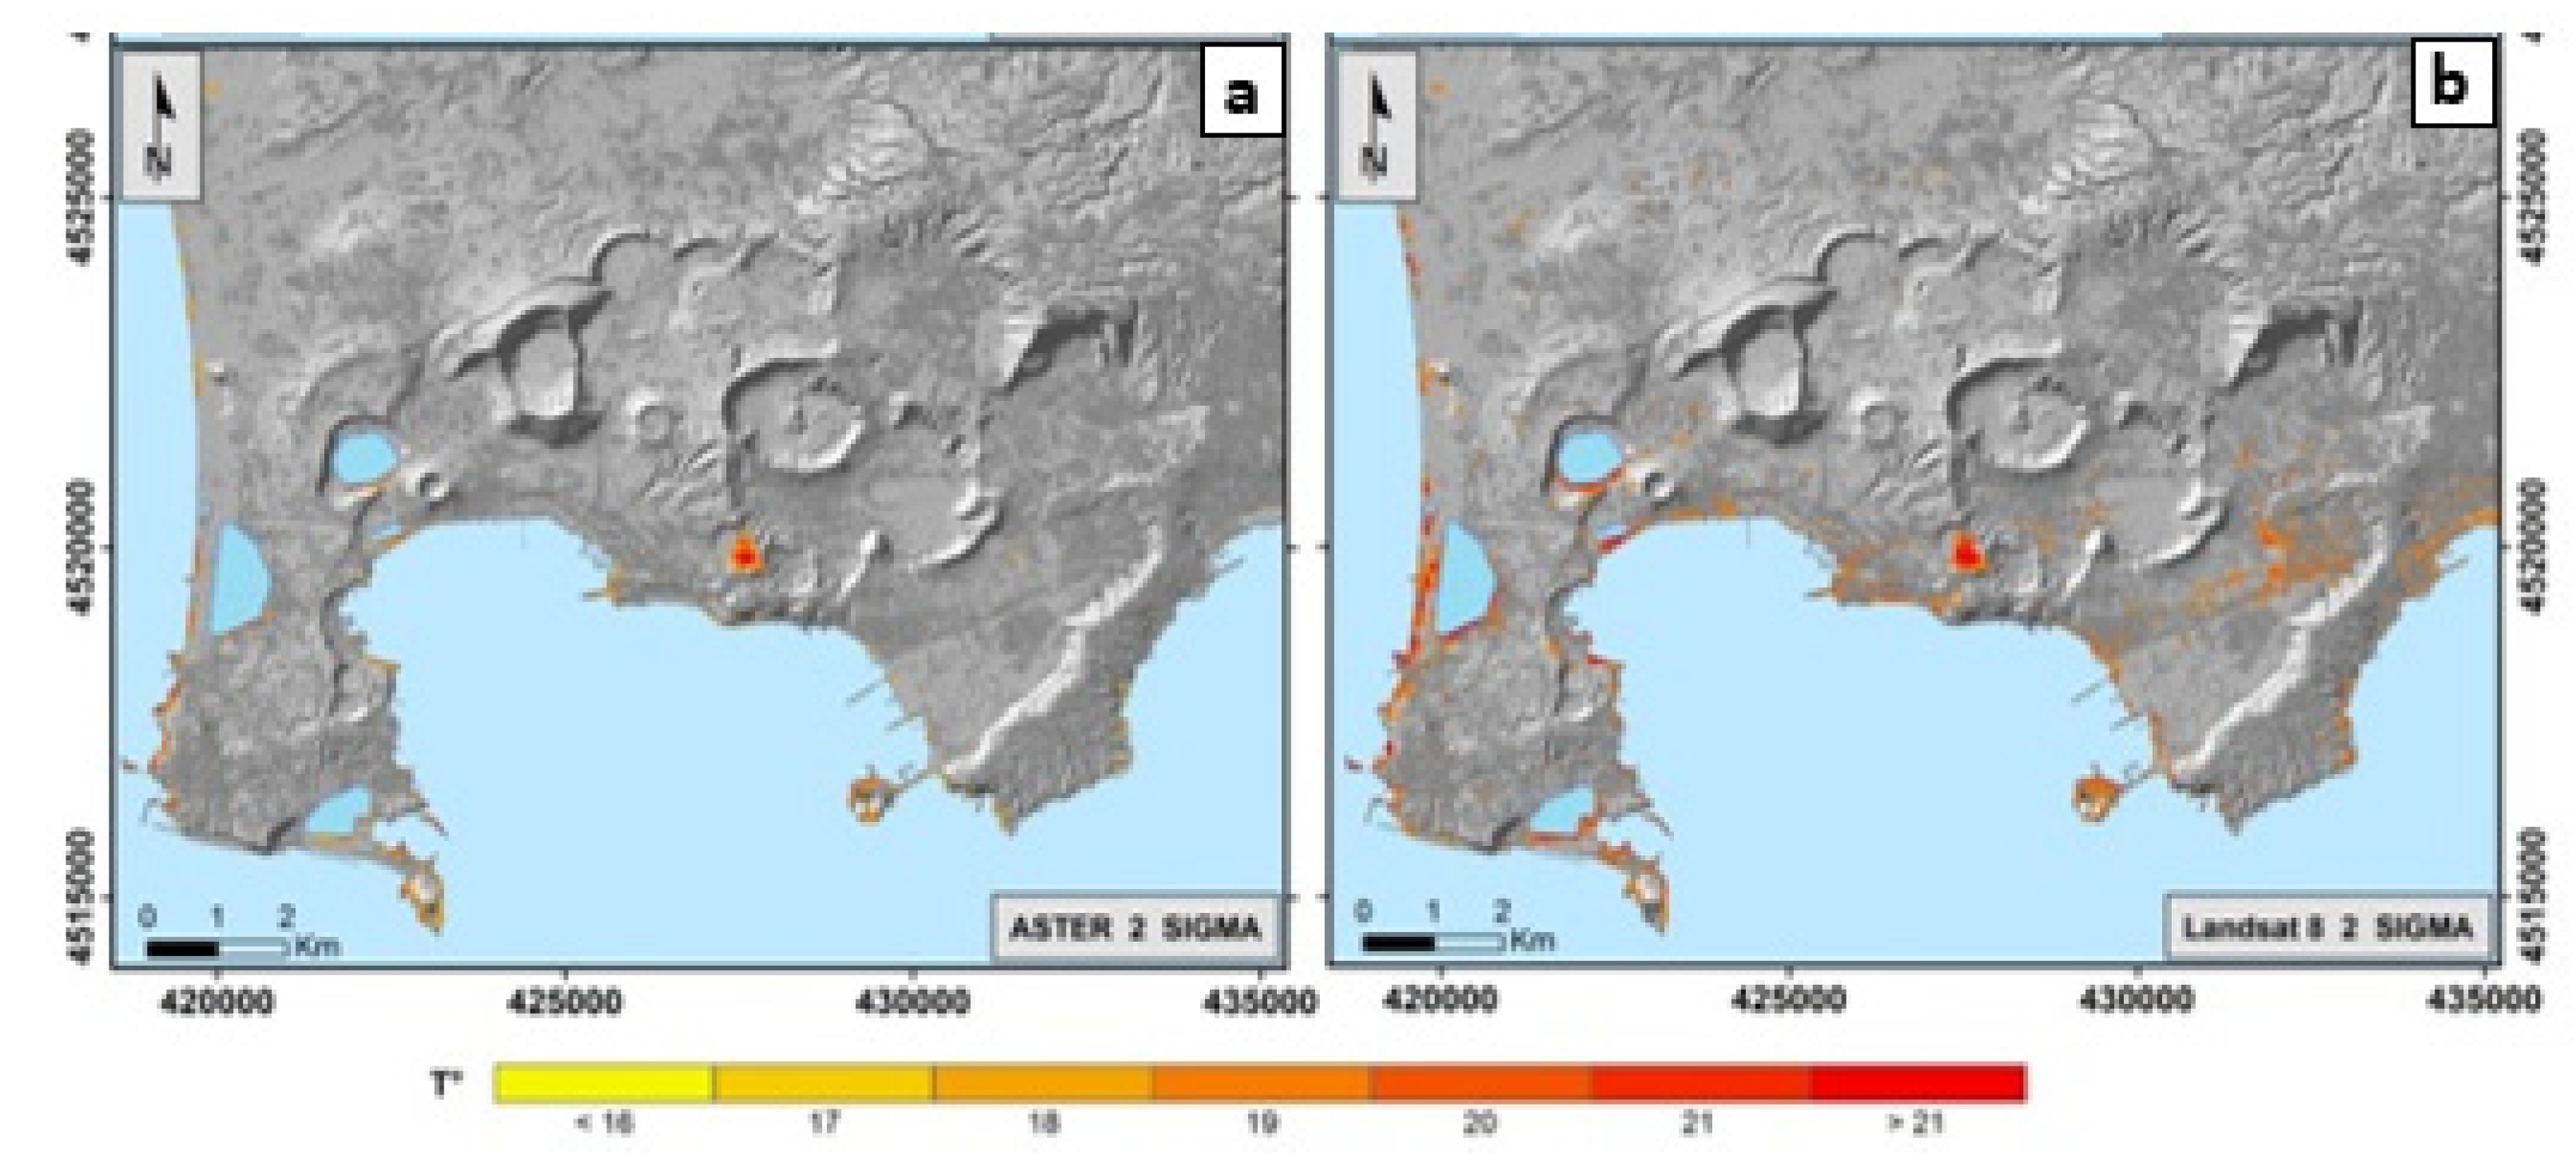
In fact, the result obtained by using PCA (Figure 5) is in agreement with the one obtained using a different methodology, as described in [11]. In particular, in [11], the process of removing the seasonal component of temperature time series is considered. The existence of a thermally anomalous area at the Campi Flegrei site is analyzed by considering the land surface Median Temperature values greater than a Threshold Value (MTTV) on a de-seasonalized time series. In [11], the threshold values of +1σ (16.36 °C for ASTER and 17.01 °C for Landsat 8), +1.5σ (17.19 °C for ASTER and 18.02 °C for Landsat 8) and +2σ (18.03 °C for ASTER and 19.04 °C for Landsat 8) allowed us to obtain the results showed in Figure 6. The use of PCA confirms that the process of removing seasonality, applied in MTTV (Figure 6), is not necessary. The spatial distribution of the thermal anomalies detected using PCA and MTTV is coincident, as shown in Figure 4 and Figure 6.
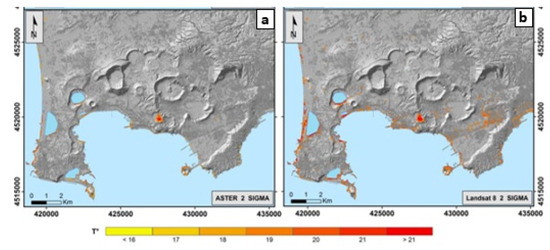
Figure 6.
Maps of MTTV of temperature satellite frame with temperature threshold at +2σ (a,b); modified after [11].
A similar approach to that taken in Solfatara-Campi Flegrei, using PCA as showed in Figure 4, has been adopted for the Parco delle Biancane area, where validation data are lacking. An example of the result obtained with Landsat 8 for Parco delle Biancane is shown in Figure 7. The red areas cover Parco delle Biancane’s geothermal areas that have a temperature greater than the land during the night. Moreover, the Valle Secolo and Nuova San Martino Enel Green Power central are also detected. Even though there are several geothermal centrals in the area analyzed, the two power plants detected as “thermal anomalies”, together with the Parco delle Biancane area, are, indeed, those with a high rated power.
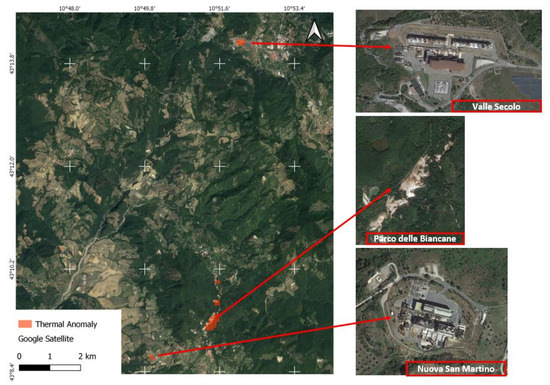
Figure 7.
Landsat 8—The red polygons represent the results in the Parco delle Biancane area.
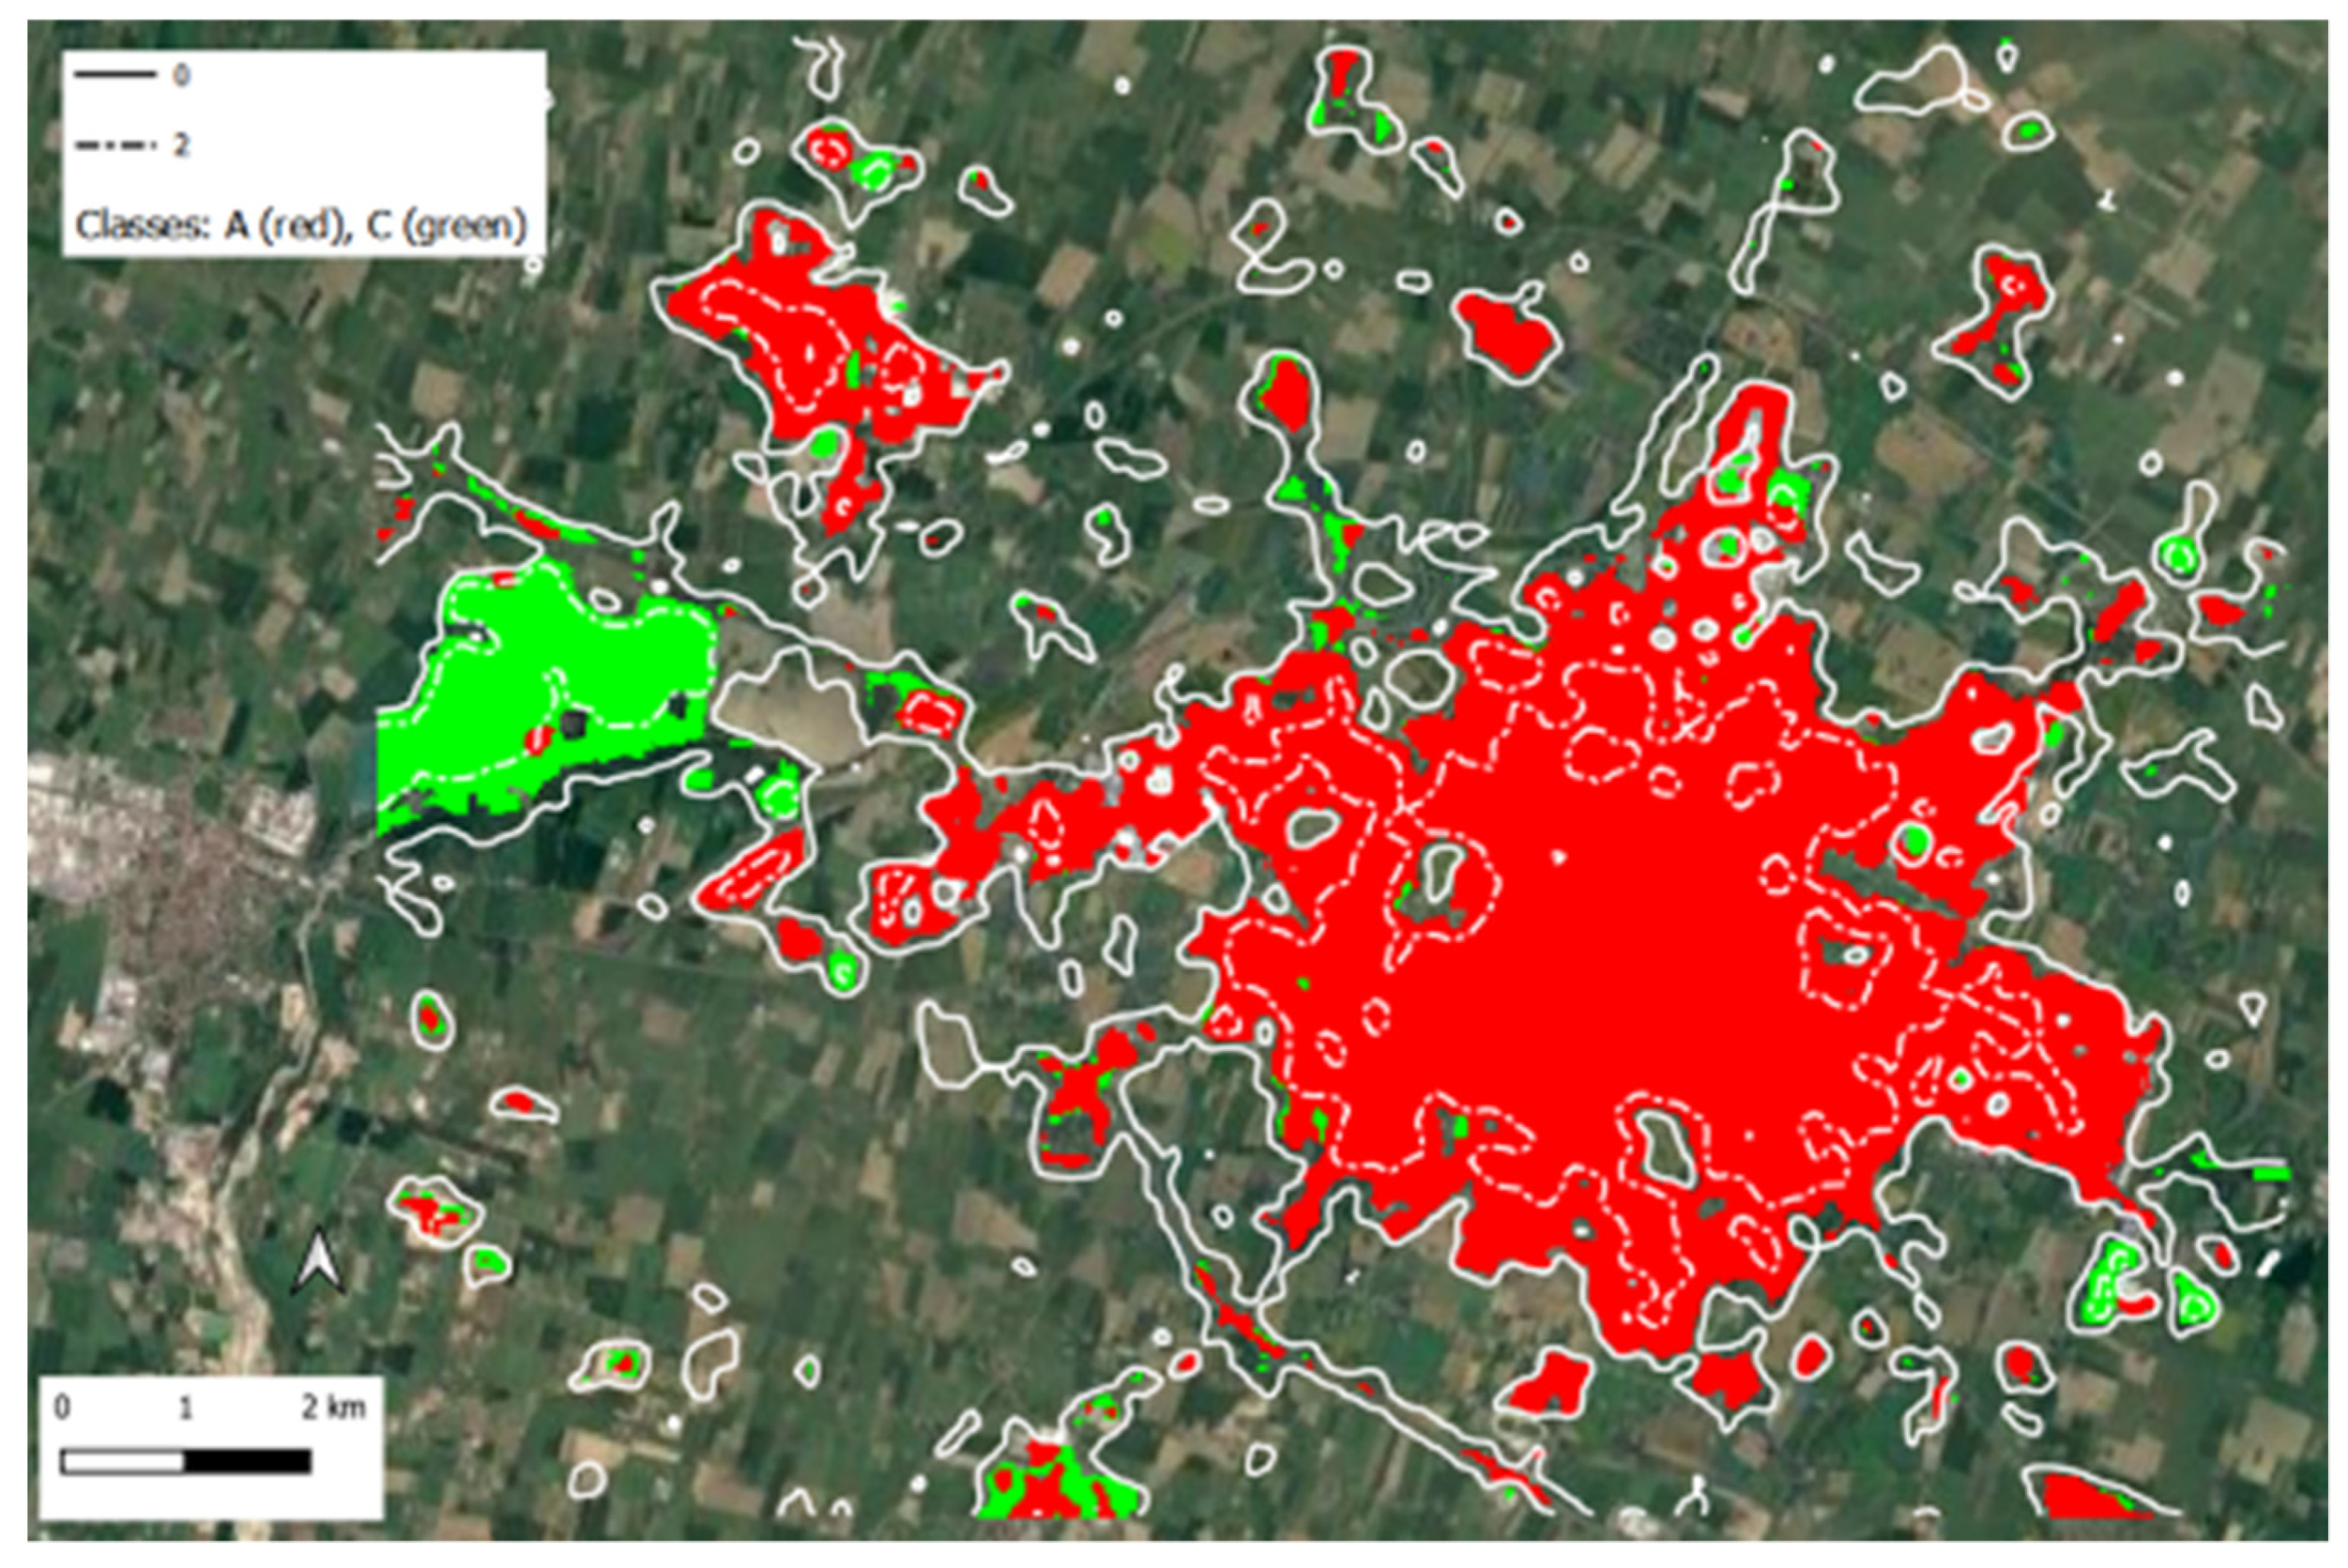
Moreover, concerning a UHI, PCA was able to separate the statistics for the rural environment, built areas and water surfaces without additional information on land cover (e.g., the classification obtained using VIS/NIR imagery or other land cover databases). In Figure 8, the results of the UHI phenomenon in Modena city are shown. In particular, in Figure 8, green represents water (warm) and red represents built (warm) pixels. The warm areas are included inside the “0” isoline that represents the line that separates warm and cold surfaces (15.4 °C has been assumed as the reference). Similarly, the isoline corresponding to +2 °C of difference (higher than the reference) has been added and marked as “2” (dashed line).

Figure 8.
Modena city test site: the classes representing warm areas are reported in green and red.
4. Conclusions
The results of these studies furnished some important considerations, as follows:
- the methodologies used to obtain LST also produce reliable temperature estimates in the very particular case of geothermal anomalies and are usable for near ground air temperature trends’ analysis;
- the PCA allows us to extract the dominant patterns within the time series to detect thermal anomalies, offering a good and easy way to produce very detailed maps of the thermal anomalies in both geothermal areas and in urban areas (UHI);
- the PCA allows for the differentiation of the surface cover without using other re-mote sensing images in VIS/NIR or auxiliary classification products. This differentiation improves the analysis of the thermal behavior of the surfaces.
The two studied cases represent two more demonstrations of the potential of satellite observations in TIR for environmental applications.
Author Contributions
Conceptualization, data processing, investigation and writing—original draft preparation, M.S.; data processing and GIS visualization, F.R.; supervision, S.T. and M.F.B.; visualization, M.M. All authors have read and agreed to the published version of the manuscript.
Funding
This research received no external funding.
Institutional Review Board Statement
Not applicable.
Informed Consent Statement
Not applicable.
Data Availability Statement
The data that support the findings of this study are available from the corresponding author (M.S.) upon reasonable request.
Acknowledgments
Thanks to Enrica Marotta, Gara Avvisati, Pasquale Belviso, Eliana Bellucci Sessa, Teresa Caputo and Vito Romaniello for their constructive comments and helping with the data analysis.
Conflicts of Interest
The authors declare no conflict of interest.
References
- Buongiorno, M.F.; Pieri, D.; Silvestri, M. Thermal analysis of volcanoes based on 10 years of ASTER data on Mt. Etna. In Thermal Infrared Remote Sensing; Springer: Dordrecht, The Netherlands, 2013; pp. 409–428. [Google Scholar]
- Pieri, D.; Abrams, M. ASTER watches the world’s volcanoes: A new paradigm for volcanological observations from orbit. J. Volcanol. Geotherm. Res. 2004, 135, 13–28. [Google Scholar] [CrossRef]
- Silvestri, M.; Romaniello, V.; Hook, S.; Musacchio, M.; Teggi, S.; Buongiorno, M.F. First Comparisons of Surface Temperature Estimations between ECOSTRESS, ASTER and Landsat 8 over Italian Volcanic and Geothermal Areas. Remote Sens. 2020, 12, 184. [Google Scholar] [CrossRef] [Green Version]
- Fridleifsson, I.B.; Bertani, R.; Huenges, E.; Lund, J.W.; Ragnarsson, A.M.; Rybach, L. The possible role and contribution of geothermal energy to the mitigation of climate change. In Proceedings of the IPCC Scoping Meeting on Renewable Energy Sources, Luebeck, Germany, 20 January 2008; Volume 20, pp. 59–80. [Google Scholar]
- Howari, F. Prospecting for geothermal energy through satellite based thermal data: Review and the way forward. Glob. J. Environ. Sci. Manag. 2015, 1, 265–274. [Google Scholar]
- Qin, Q.; Zhang, N.; Nan, P.; Chai, L. Geothermal area detection using Landsat ETM+ thermal infrared data and its mechanistic analysis-A case study in Tengchong, China. Int. J. Appl. Earth Obs. Geoinf. 2011, 13, 552–559. [Google Scholar] [CrossRef]
- Voogt, J.A.; Oke, T.R. Thermal remote sensing of urban climates. Remote Sens. Environ. 2003, 86, 370–384. [Google Scholar] [CrossRef]
- Sobrino, J.A.; Oltra-Carrió, R.; Sòria, G.; Bianchi, R.; Paganini, M. Impact of spatial resolution and satellite overpass time on evaluation of the surface urban heat island effects. Remote Sens. Environ. 2012, 117, 50–56. [Google Scholar] [CrossRef]
- Gillespie, A.; Rokugawa, S.; Matsunaga, T.; Cothern, J.S.; Hook, S.; Kahle, A.B. A temperature and emissivity separation algorithm for advanced spaceborne thermal emission and reflection radiometer (ASTER) images. IEEE Trans. Geosci. Remote Sens. 1998, 36, 1113–1126. [Google Scholar] [CrossRef]
- Silvestri, M.; Marotta, E.; Buongiorno, M.F.; Avvisati, G.; Belviso, P.; Bellucci Sessa, E.; Caputo, T.; Longo, V.; De Leo, V.; Teggi, S. Monitoring of Surface Temperature on Parco delle Biancane (Italian Geothermal Area) Using Optical Satellite Data, UAV and Field Campaigns. Remote Sens. 2020, 12, 2018. [Google Scholar] [CrossRef]
- Caputo, T.; Bellucci Sessa, E.; Silvestri, M.; Buongiorno, M.F.; Musacchio, M.; Sansivero, F.; Vilardo, G. Surface temperature multiscale monitoring by thermal infrared satellite and ground images at Campi Flegrei volcanic area (Italy). Remote Sens. 2019, 11, 1007. [Google Scholar] [CrossRef] [Green Version]

Publisher’s Note: MDPI stays neutral with regard to jurisdictional claims in published maps and institutional affiliations. |
© 2021 by the authors. Licensee MDPI, Basel, Switzerland. This article is an open access article distributed under the terms and conditions of the Creative Commons Attribution (CC BY) license (https://creativecommons.org/licenses/by/4.0/).