1. Introduction
In the present technological age, people usually underestimate the danger related to the natural volcanic activity and they tend to quickly forget the negative effects caused by a possible paroxysm. However, volcanic activity still influences the economy, from many points of view, since volcanoes are able to modify air and ground composition, and some eruptions may also pose a risk to people mobility and settlements, for example, in the case of unexpected changes or long-lasting sequences of paroxysms. In general, the temperature monitoring is of interest for the evaluation of geological risks associated with the force acting on active volcanic systems and the main questions addressing the scope of surveillance following the scientific approach, consists of confirming the deterministic models by quantitative interpretation of monitoring results, to forecast the evolution of observed dynamics. The geochemical approach to volcano monitoring has interested, since the eighties, the Island of Vulcano (Aeolian Archipelago, Italy) during its long quiescence. By observing and collecting gases and minerals at the surface, the researchers gathered information on the systems located at depth, which are producing the energy flows transferred by the most mobile components, in the form of fluid releases. By analyzing the gaseous mixtures emitted from fumaroles, steaming grounds, hot springs, and diffuse degassing, the scientific community has thus elaborated information about the composition of hydrothermal systems, recognizing variable influences caused by the neighboring magmatic system. The convective circulation of hot gases, inside hydrothermal systems, causes anomalous surface temperatures, as well. Therefore, at Vulcano—by developing continuous monitoring procedures for the acquisition of some selected parameters (such as surface temperatures or fluxes of gas)—we could show the time variation of the fumarole release, in order to define, the solphataric phenomenon, starting from a lot of systematic observations. I show the longest records of a single parameter, dating back to 1992: The highest temperature of fumaroles. In the Island of Vulcano, the flux of hot fluids expanding from a hot buried source is one of the effects of the quiescent volcanic activity that causes sensible thermal anomalies on the ground surface. On the Island of Vulcano (Aeolian Archipelago, Italy) the temperatures of fumaroles have been recorded continuously, by monitoring stations located at a few discrete sites on the summit area of La Fossa cone. The remote control of these monitoring stations minimizes the hazards associated with data collection and allows a high sampling frequency during long periods. The measured temperatures of fumarole emissions, have ranged from about 700 °C to the boiling point. Since the end of the last eruption (1890 A.D.), many periods of increased heating of hydrothermal systems, underlying the La Fossa area, have been identified, e.g., [
1,
2,
3]. However, an eruptive condition has not yet been reached. During the time period covered by this work, the main temporal variations of fumarole temperature have revealed many differences in the hydrothermal heat flow, that were originated at depth, as confirmed by other referenced geochemical and geophysical studies. The most likely cause of the main temporal variations in the fumarole temperature was some change in the gaseous input from the magmatic source, e.g., [
4,
5], but also the local seismic activity that caused episodic increases of hot steam advection from the hydrothermal reservoirs [
6].
2. Study Area
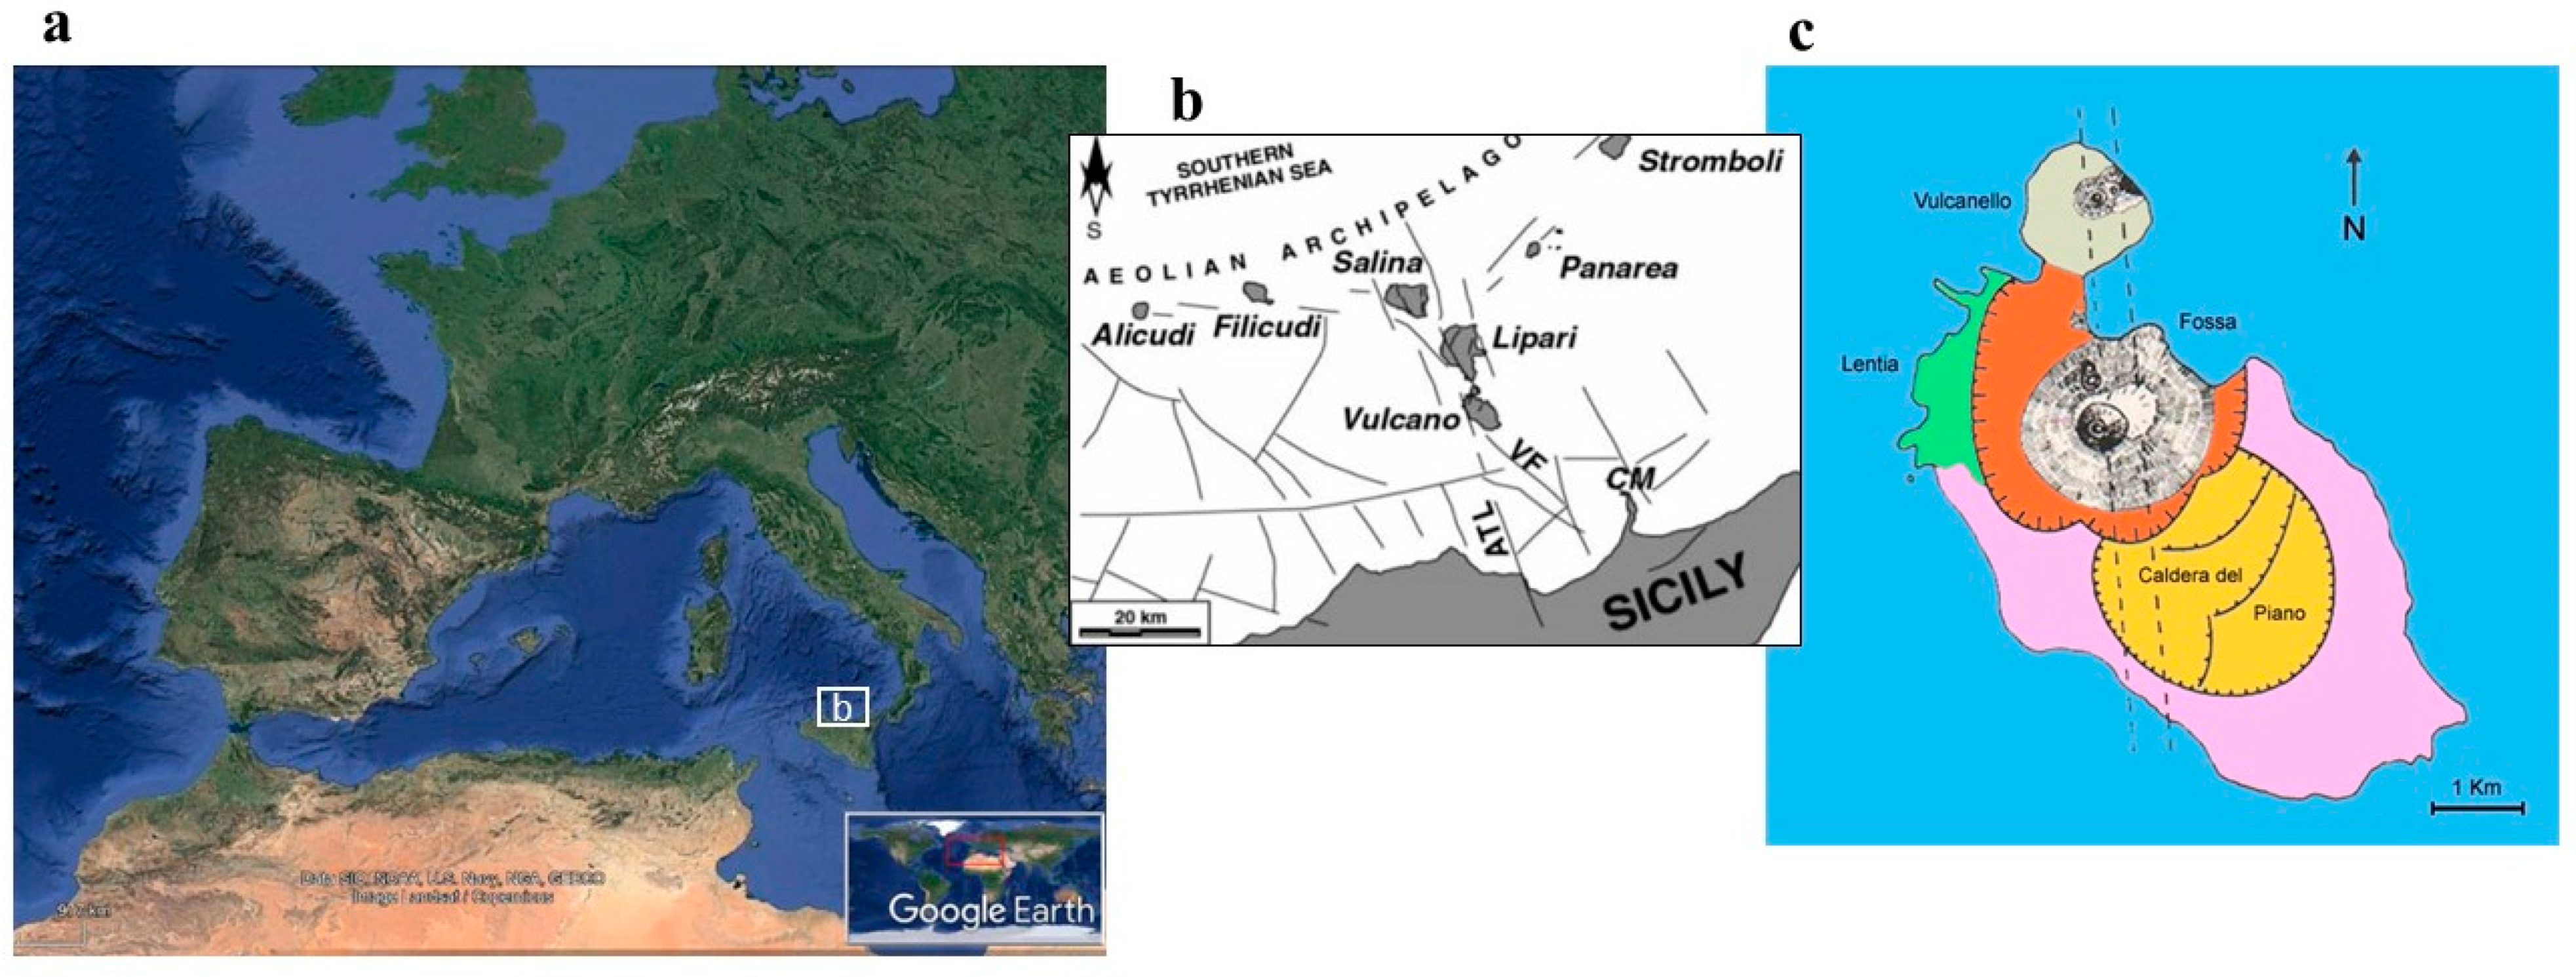
Vulcano Island is an active volcanic system located along the southern margin of the Tyrrhenian Sea (Italy,
Figure 1a–c) in the southernmost sector of the Aeolian archipelago. The Aeolian archipelago is an arc-shaped structure, formed by seven islands. The Island of Vulcano is located along the Tindari–Letojanni strike-slip tectonic system [
7,
8] (ATL in
Figure 1b), and it is the southernmost island of the NNW–SSE elongated volcanic belt (including also Salina and Lipari,
Figure 1b). The release of seismic energy in this area is higher than the regional background [
4,
7], and the active magmatism is driving the permanent volcanic activity in the island of Stromboli, and is causing the hydrothermal activity at Panarea, Lipari, and Vulcano. The long eruptive history of Vulcano, actually quiescent, has been summarized in eight episodes [
8], between 127 ka before the present and historical times (AD 1888–1890). The eruptive episodes are interspersed with variable periods of quiescence, and by volcano-tectonic collapse that gave origin to the calderas of
Il Piano and
La Fossa (
Figure 1c [
9]).
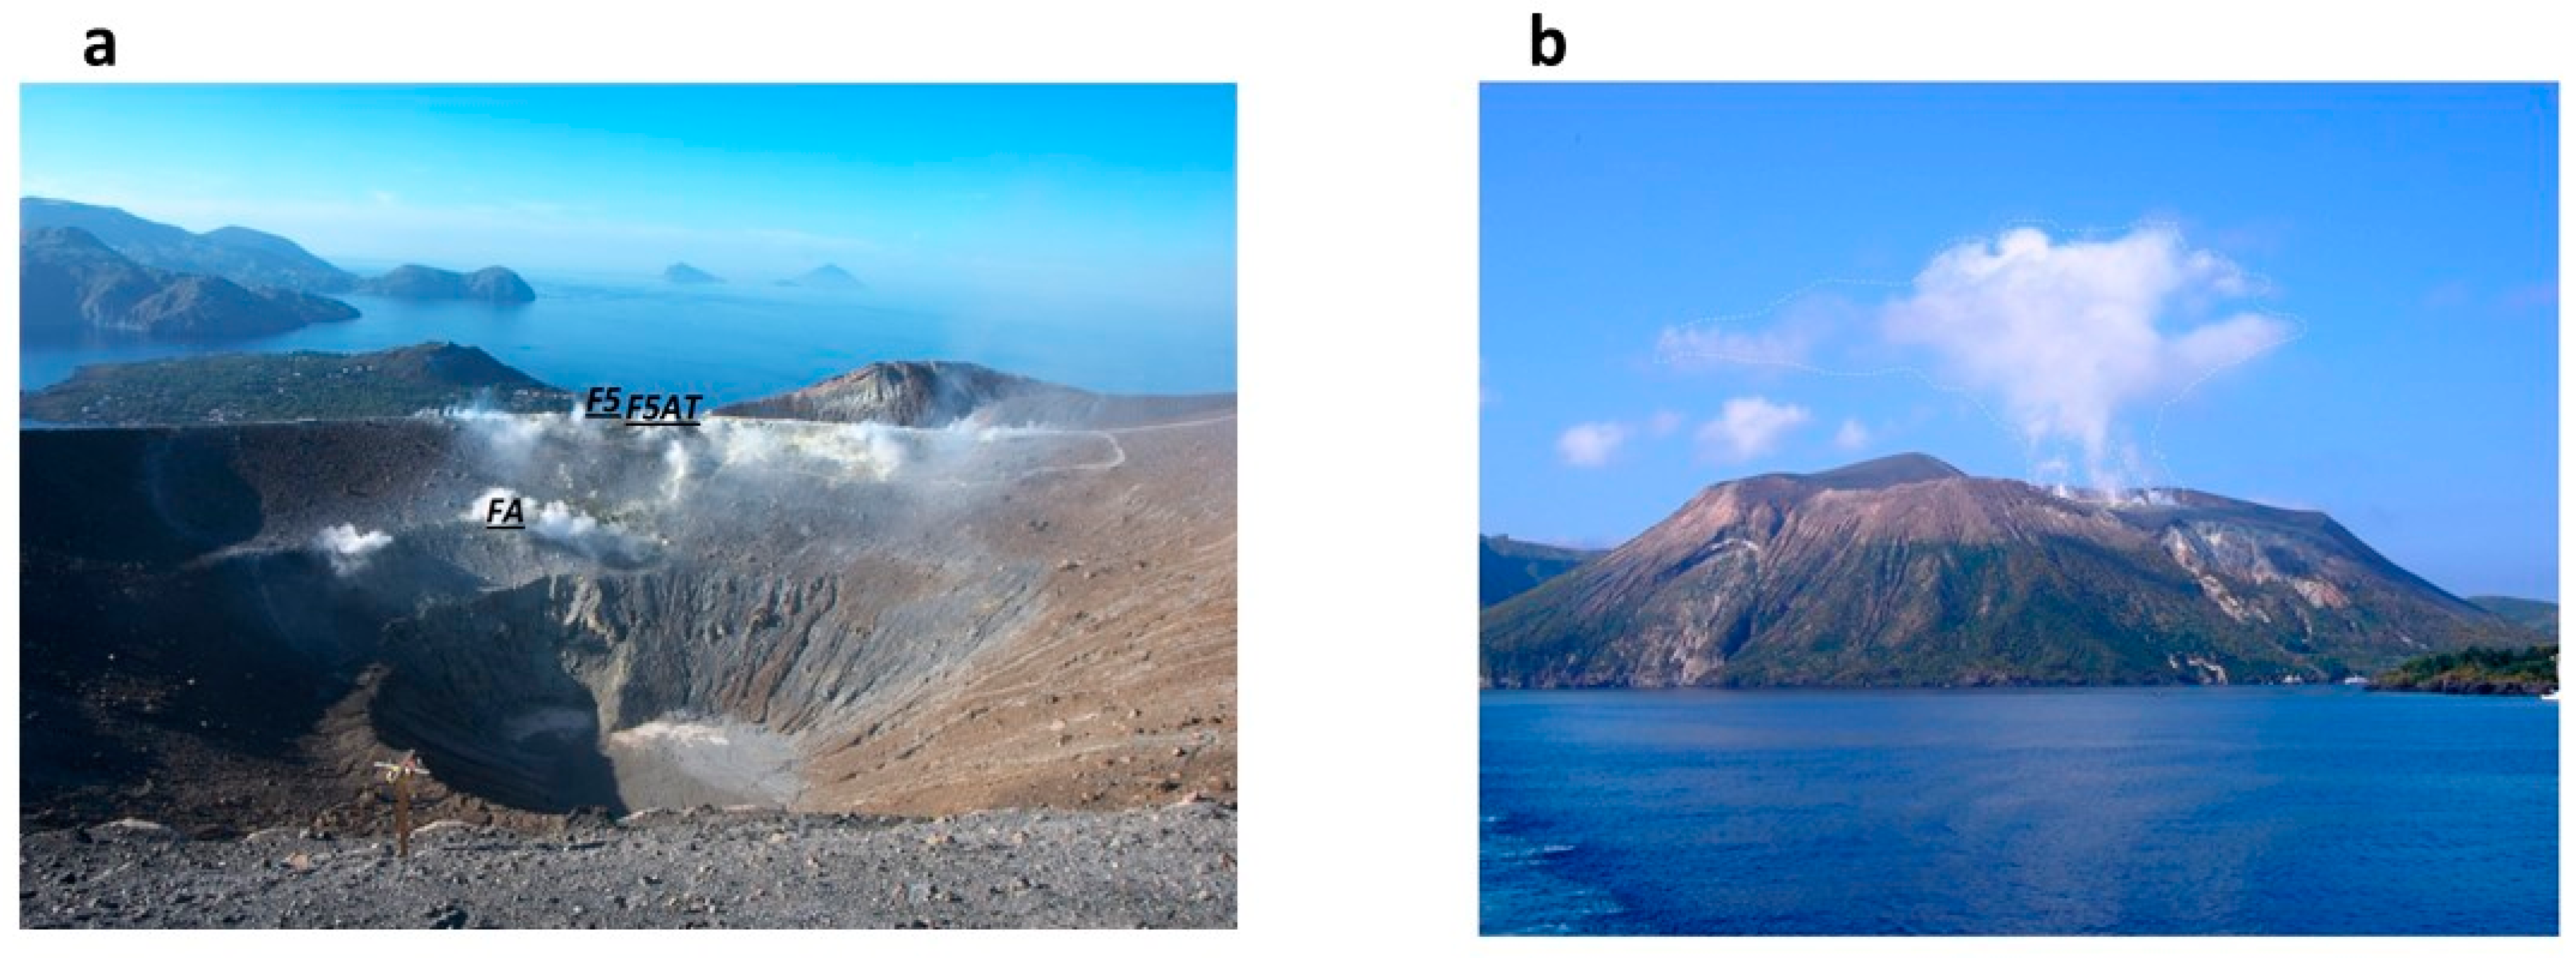
The volcanic activity from
La Fossa cone consisted of explosive phreatic and phreatomagmatic eruptions, alternated with highly viscous lava flows [
8]. The stratovolcano of La Fossa reaches the elevation of 391 m a.s.l. (
Figure 1c) and intense fumarolic degassing persists at its top. The main component escaping from the deep system to the surface is water vapor, resulting in the volcanic plume (or hydrothermal cloud) standing over the active cone (
Figure 2a,b). The geochemical composition of fumaroles fluids is interpreted as a result of a variable mixing process between magmatic and hydrothermal fluids e.g., [
10]. The temperature of fumaroles is one of the variables selected from the general geochemical approach to volcano monitoring. The increasing thermal output through the studied period has been positively correlated to the magmatic component [
1,
3,
11]. More recently, this positive correlation has been less evident. Other effects of the mass and energy flux released by the geothermal system are found in the thermo-mineral aquifers and the diffuse gas emissions, monitored inside the Vulcano Porto village, and in the steam heated ground, spreading on the slopes of the active cone [
12]. The thermodynamic evaluations of physic-chemical conditions of the thermal aquifer present at the base of La Fossa cone suggested episodic increases in the equilibrium temperatures and pressures revealing, in some cases, approaches to instability conditions, with increasing risk of phreatic explosions [
10]. During periods of enhanced volcanic activity (such as from 1988 to 1992), many water wells receive a larger amount of vapor and the mixture of dissolved gases result similar to the composition of the crater fumaroles [
12], and the complex steam heating process affecting the geothermal system has been modelled by Federico et al. [
13].
The northern and southern flanks of La Fossa cone edifice, are covered by hydrothermally altered rocks; here the hydrothermal fluids, which are continuously flowing upwards along the highest permeability zones, influence the hydrological and mechanical properties of the rocks [
14], increasing susceptibility to failure of slopes, as indicated by other authors [
15,
16,
17]. In particular, hydrothermal alteration can interfere with the permeability pattern changing the porosity, and mechanical rock properties. Several temperature anomalies and geochemical crises occurred at La Fossa during the actual quiescent period: 1916–1924, 1977–1993, 1996 2004, 2005, 2006, and 2007 [
2,
3,
18,
19,
20]. Many geochemical crises have been accompanied by increases in the number and amplitude of volcano-seismic events at shallow depth (<1–1.5 km) under La Fossa cone [
21]. Repeated cycles of thermal volumetric changes increase the probability of landslides and rock falls from slopes interested by the circulation of hot fluid. At La Fossa cone, the relationships of the major temperature increase with the thermal expansion of the active cone and with transient increases of the pore pressure have been already reported, e.g., [
6,
11,
22]. Bonaccorso et al. [
22] highlighted the delay between the variations of fumaroles temperature and the deformation rate of the northern slope of the active cone and interpreted the measured displacement as the effect of volumetric changes related to the long-term trending variation of fumaroles temperature that occurred from 1989 to 1999. Since then, other periodical increases of gas emission and seismic activity have occurred, without significant ground deformation [
14]. As phreatic explosion is one of the main volcanic risks at La Fossa caldera and it is possibly enhanced by self-sealing processes that occur on the permeable pathways due to the hydrothermal circulation, the temperature trends of fumaroles and thermal ground-waters are considered useful indicators to follow in real time the evolution of the energy and mass fluxes, affecting the equilibrium of this volcanic system.
3. Materials and Methods
Vulcano is constantly monitored by a network of monitoring stations for the temperature monitoring of the ground, tracking changes in the high temperature fumaroles. During a period of enhanced seismic release in the region, that begun in the eighties, the first multidisciplinary monitoring program was set up by the Italian
Gruppo Nazionale di Vulcanologia. The monitoring program included the automated measurements system, for continuous monitoring of volcanic activity at the Aeolian islands by geochemical parameters, including temperature measurements.
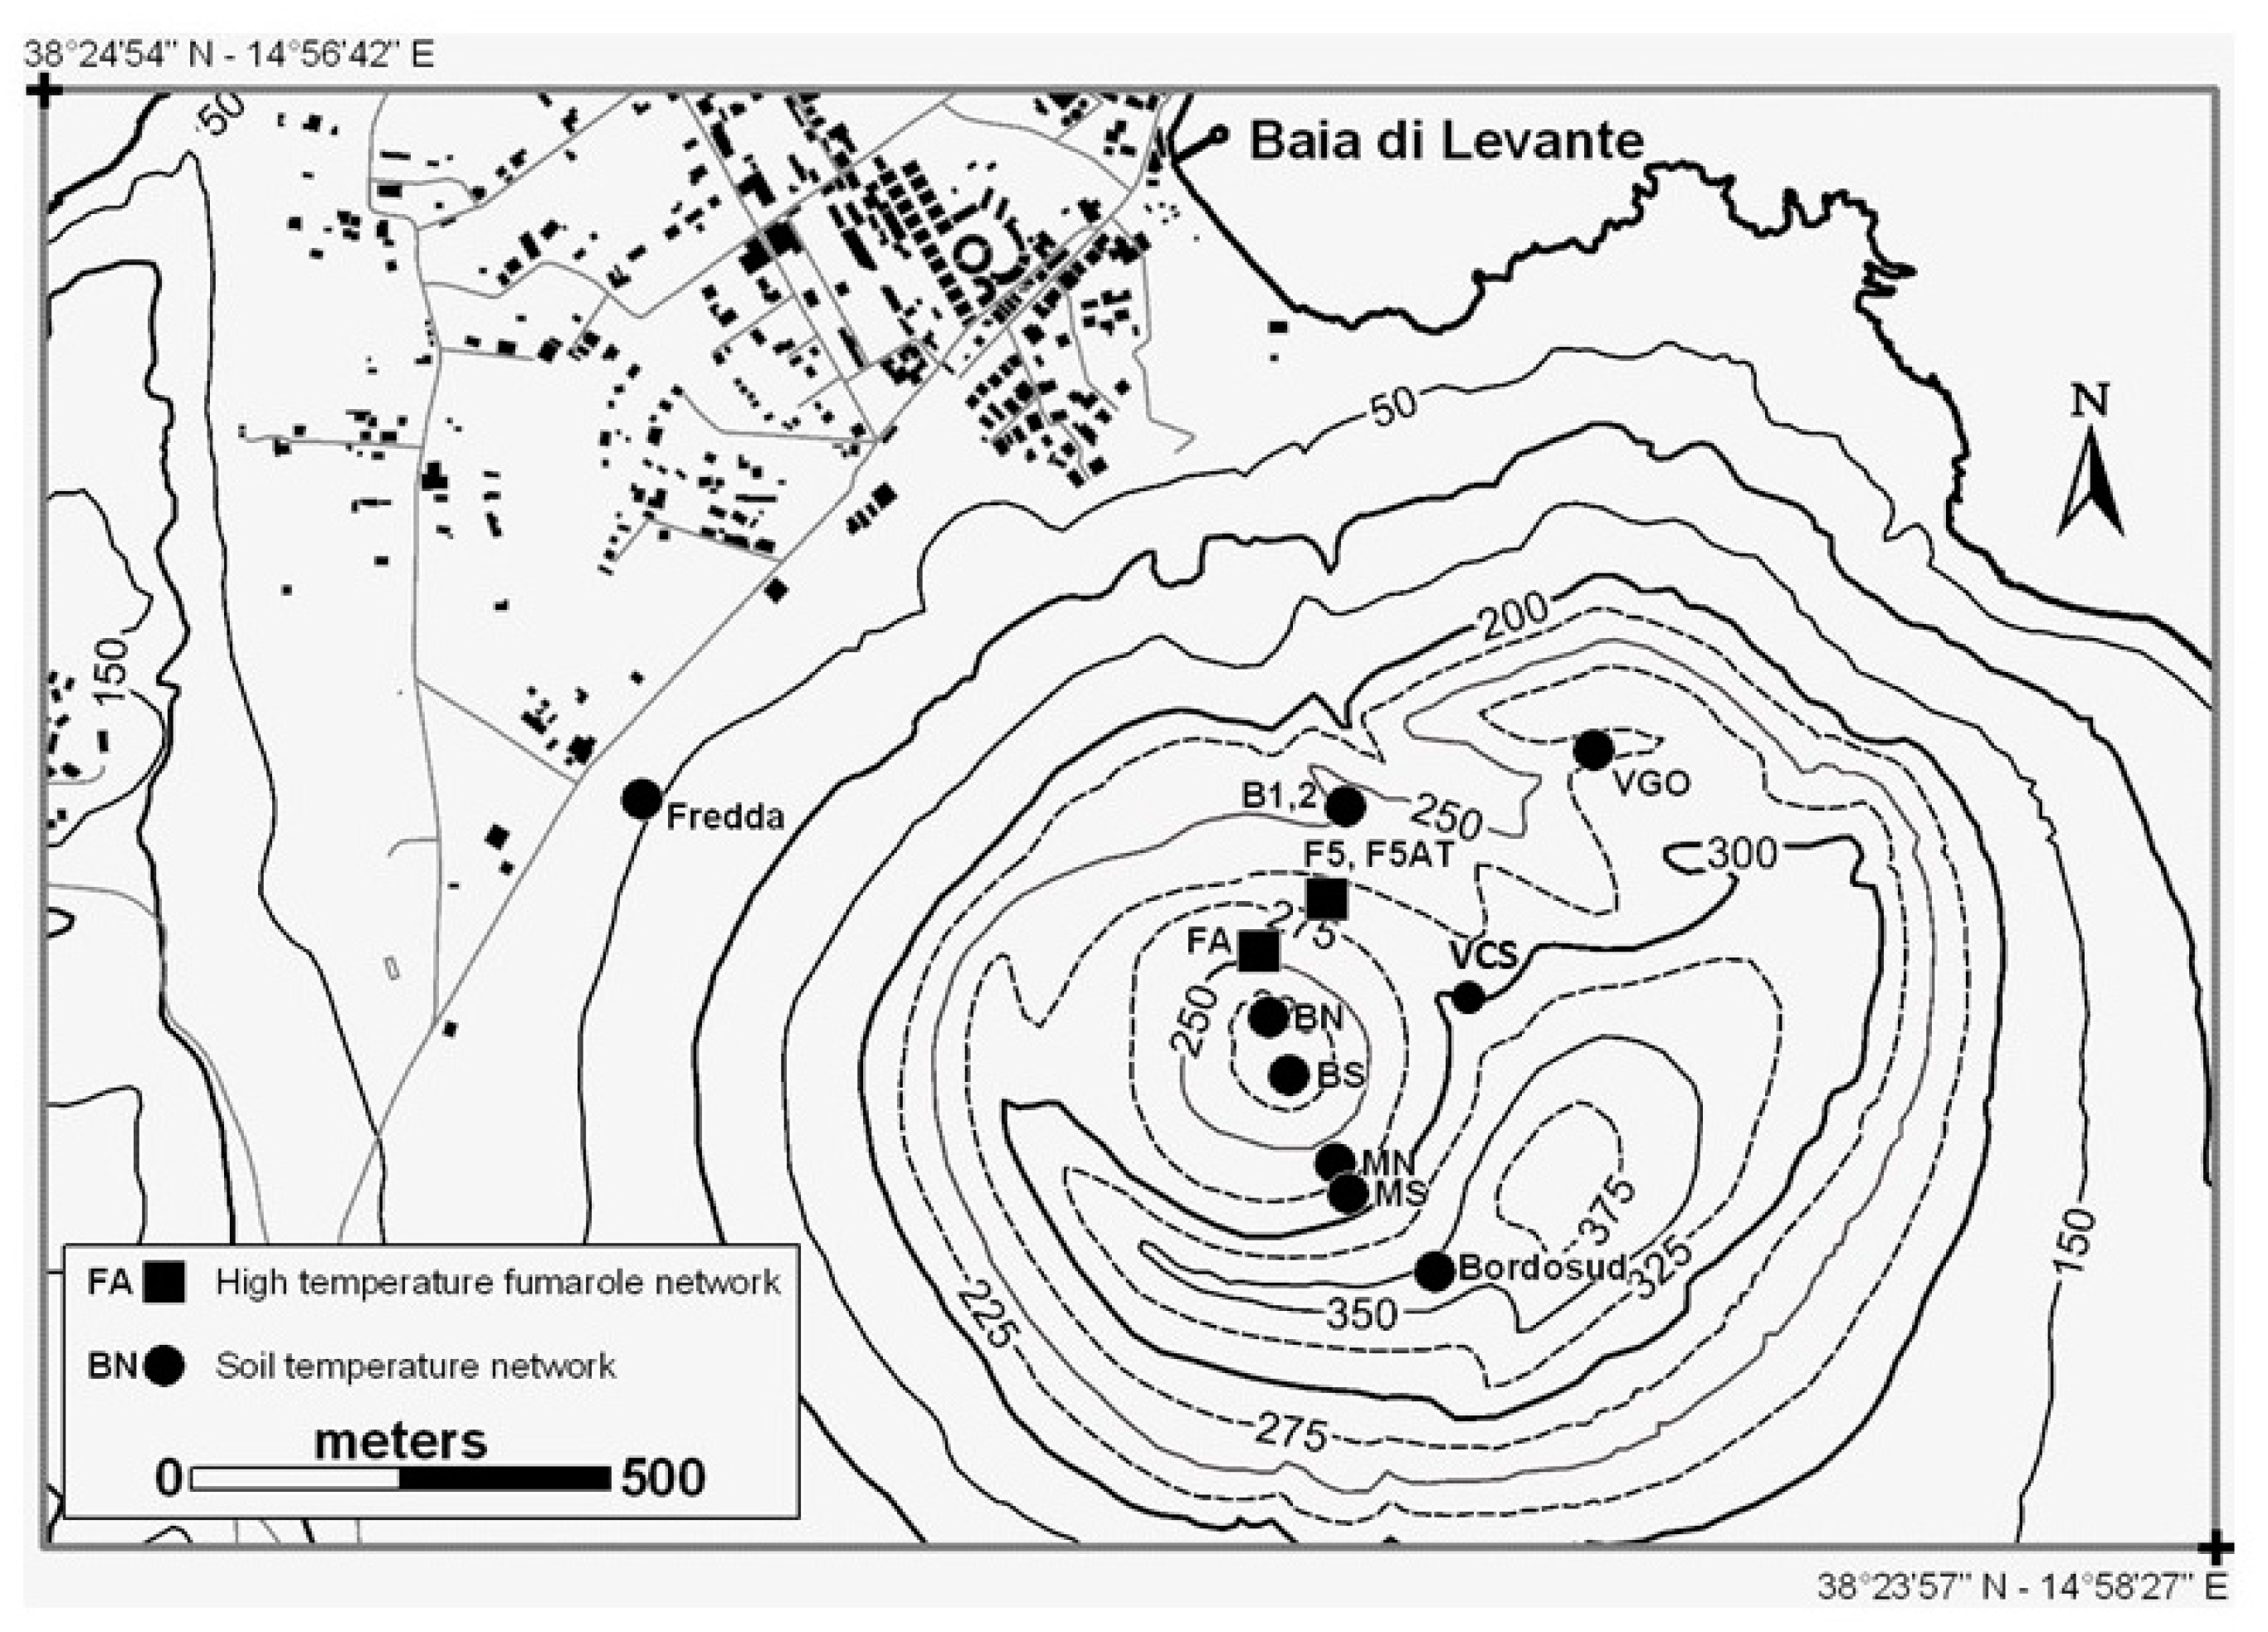
Figure 3 shows the location of temperature sensors in the high temperature fumarole network and on some other minor thermal anomalies.
The time relationships between the thermal signal recorded in the fumaroles vents and other geochemical and geophysical variations have been observed since the beginning of the geochemical monitoring [
23], dating back to June 1984 [
24]. The extreme environment conditions of La Fossa cone represented a hard challenge: Instrument and people are exposed to uninterrupted fluxes of acidic gases, highest moisture, and the highest temperature of the ground (the thermocouple inserted in the steaming vents measured temperatures higher than 670 °C); heavy rainy periods alternate to very dry seasons; no energy supply is available at the top of the active cone. The data are collected according to conventions aimed to the surveillance of volcanic activity, that have been periodically renewed between the
Dipartimento di Protezione Civile (DPC) and the
Istituto Nazionale di Geofisica e Vulcanologia (I.N.G.V.). The outlet temperatures are measured by chromel-alumel thermocouples (sensitivity of 41 μV/°C), inserted into the vent at a depth of 0.5 m. The measurement accuracy is maximized by applying the cold-junction compensation (CJC) technique. The CJC considers the voltage produced by temperature variations at the cold joint. “Cold” refers to the ambient temperature, in contrast to the “hot” temperature of the fumarole output. Disturbances in the measurement occur when the normally good thermal contact is lost, due to extreme weather conditions around the fumarole. Such uncertain values are removed from the time series data, until the necessary maintenance fieldwork is concluded, because these disturbances may mask the real temperature variation of the fumaroles. Specifically, the most frequent data gaps and technical failures have occurred, due to the frequent condensation of acidic fluids from the vapor release when the temperature output has decreased, reaching temperatures lower than 300 °C. During the technical maintenance of the system, episodic temperature measurements are carried out around the monitored locations with chromel-alumel thermocouples equipped with portable devices (percentage error <±1%). It has been hard to collect temperature data, with the sampling measurement window of 1 h for so many years in the extreme hostile environment created by the hot acidic fluids released in the fumarole field of La Fossa Vulcano. During these years, the monitoring sites were never moved from the former locations, to continue the longest record of data, the positive correlation found with ground deformation, seismic activity, and magmatic gas input has supported this long-term effort. In the last years (2020 and 2021), to observe the restriction imposed by the actual pandemia, we reduced the field work (calibration of the acquisition process and maintenance of the instruments), consequently we could not update all the time series of the monitoring network. From winter 2020 to spring 2021, only two monitoring sites in the high temperature fumaroles and one in the thermal soil have been working.
4. Results and Discussion
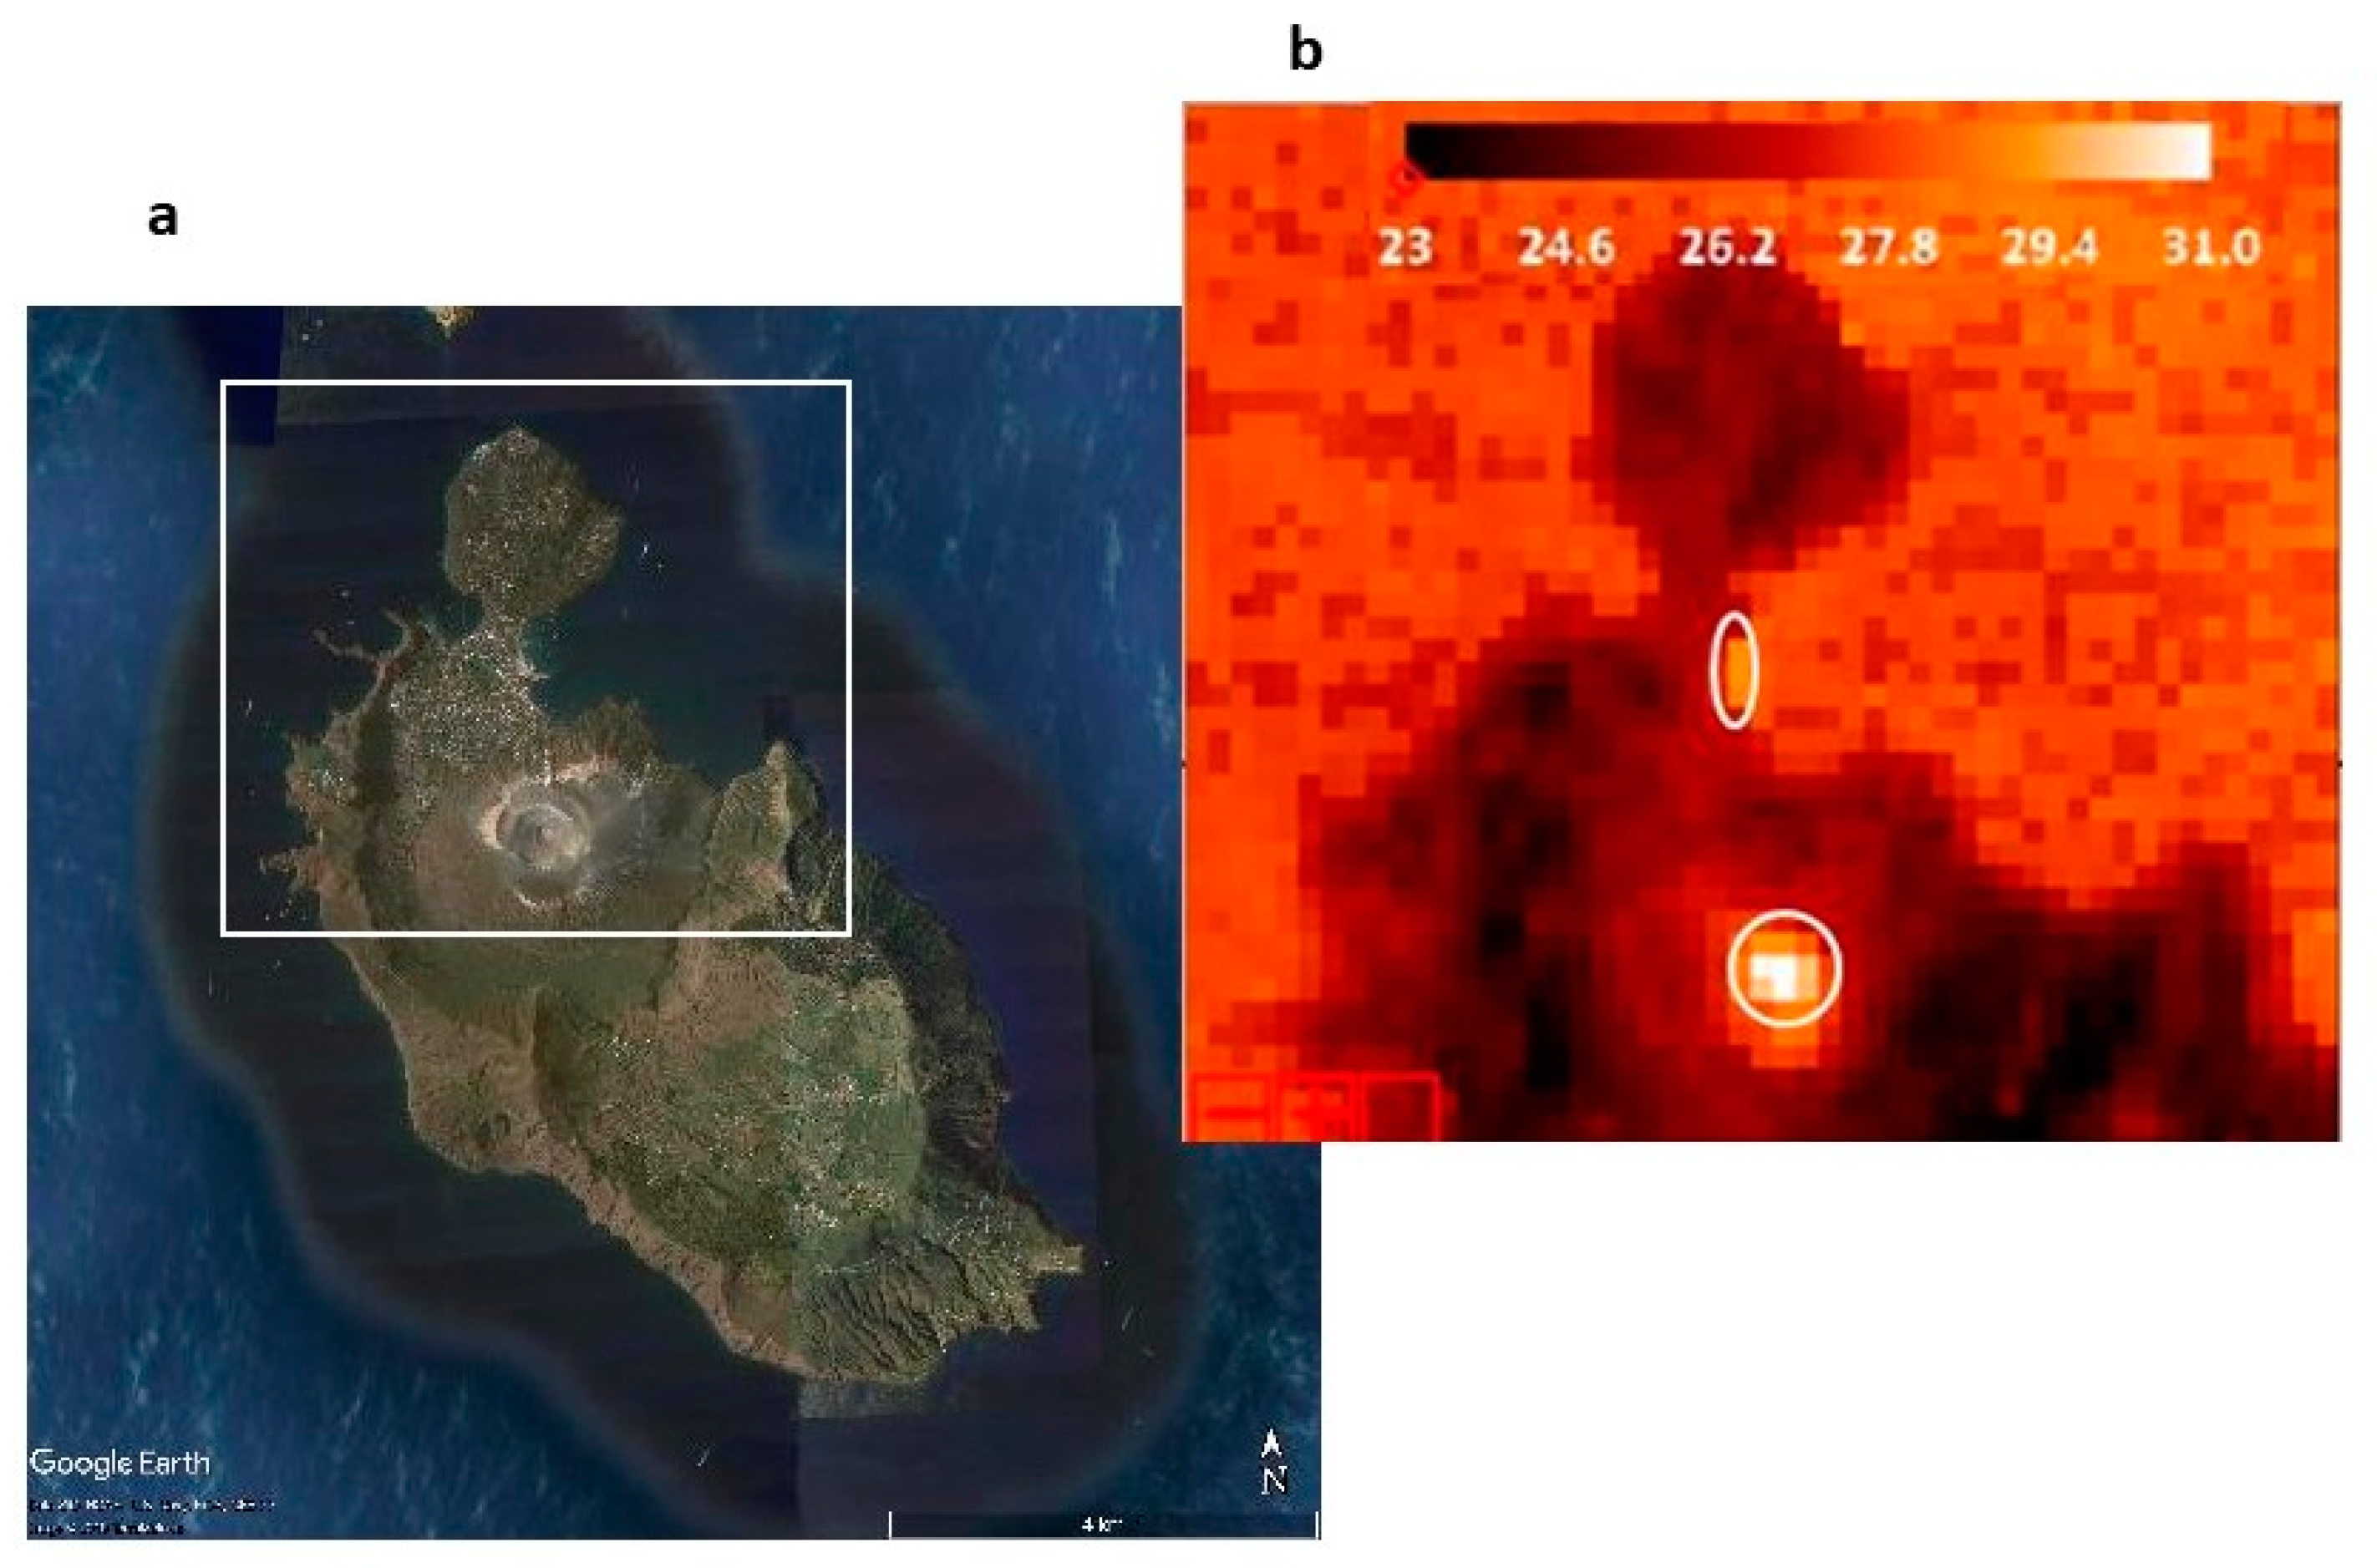
The summit area presents a surface thermal anomaly actually ranging from the boiling point to less than 260 °C, due to the presence of many fumarole vents that release high temperature fluids. Moreover, other minor thermal anomalies are present at various distance from the fumarole vents, and they occur where the subterranean steam condensate before reaching the ground surface. These thermal anomalies of minor intensity usually cause ground temperature below the boiling point and reveal high diffuse heat fluxes often associated to high CO
2 fluxes of magmatic origin [
12,
25]. The
Figure 4 show the main thermal zones inside the caldera of La Fossa, as they are remotely sensed by the satellite Landsat 8 [
26]. The thermal area in
Figure 4b, indicated by the white circle in the summit of the active cone “la Fossa”, includes the high temperature fumaroles and the continuous monitoring sites (see
Figure 2a and
Figure 3 for site locations), and other anomalous surfaces interested by diffuse gas emissions [
27]. The other zone indicated in
Figure 4b by the white ellipse has the local name of “Levante Bay”. The Levante Bay area includes some submarine fumaroles, some subaerial fumaroles, a part of the beach, the “Faraglione” and a “Mud pool” exploited as thermal bathing. The time variation of ground temperature in the Levante Bay is out of the scope of this paper, because the maximum temperature of fumaroles is about 100 °C and is buffered at the boiling point of water.
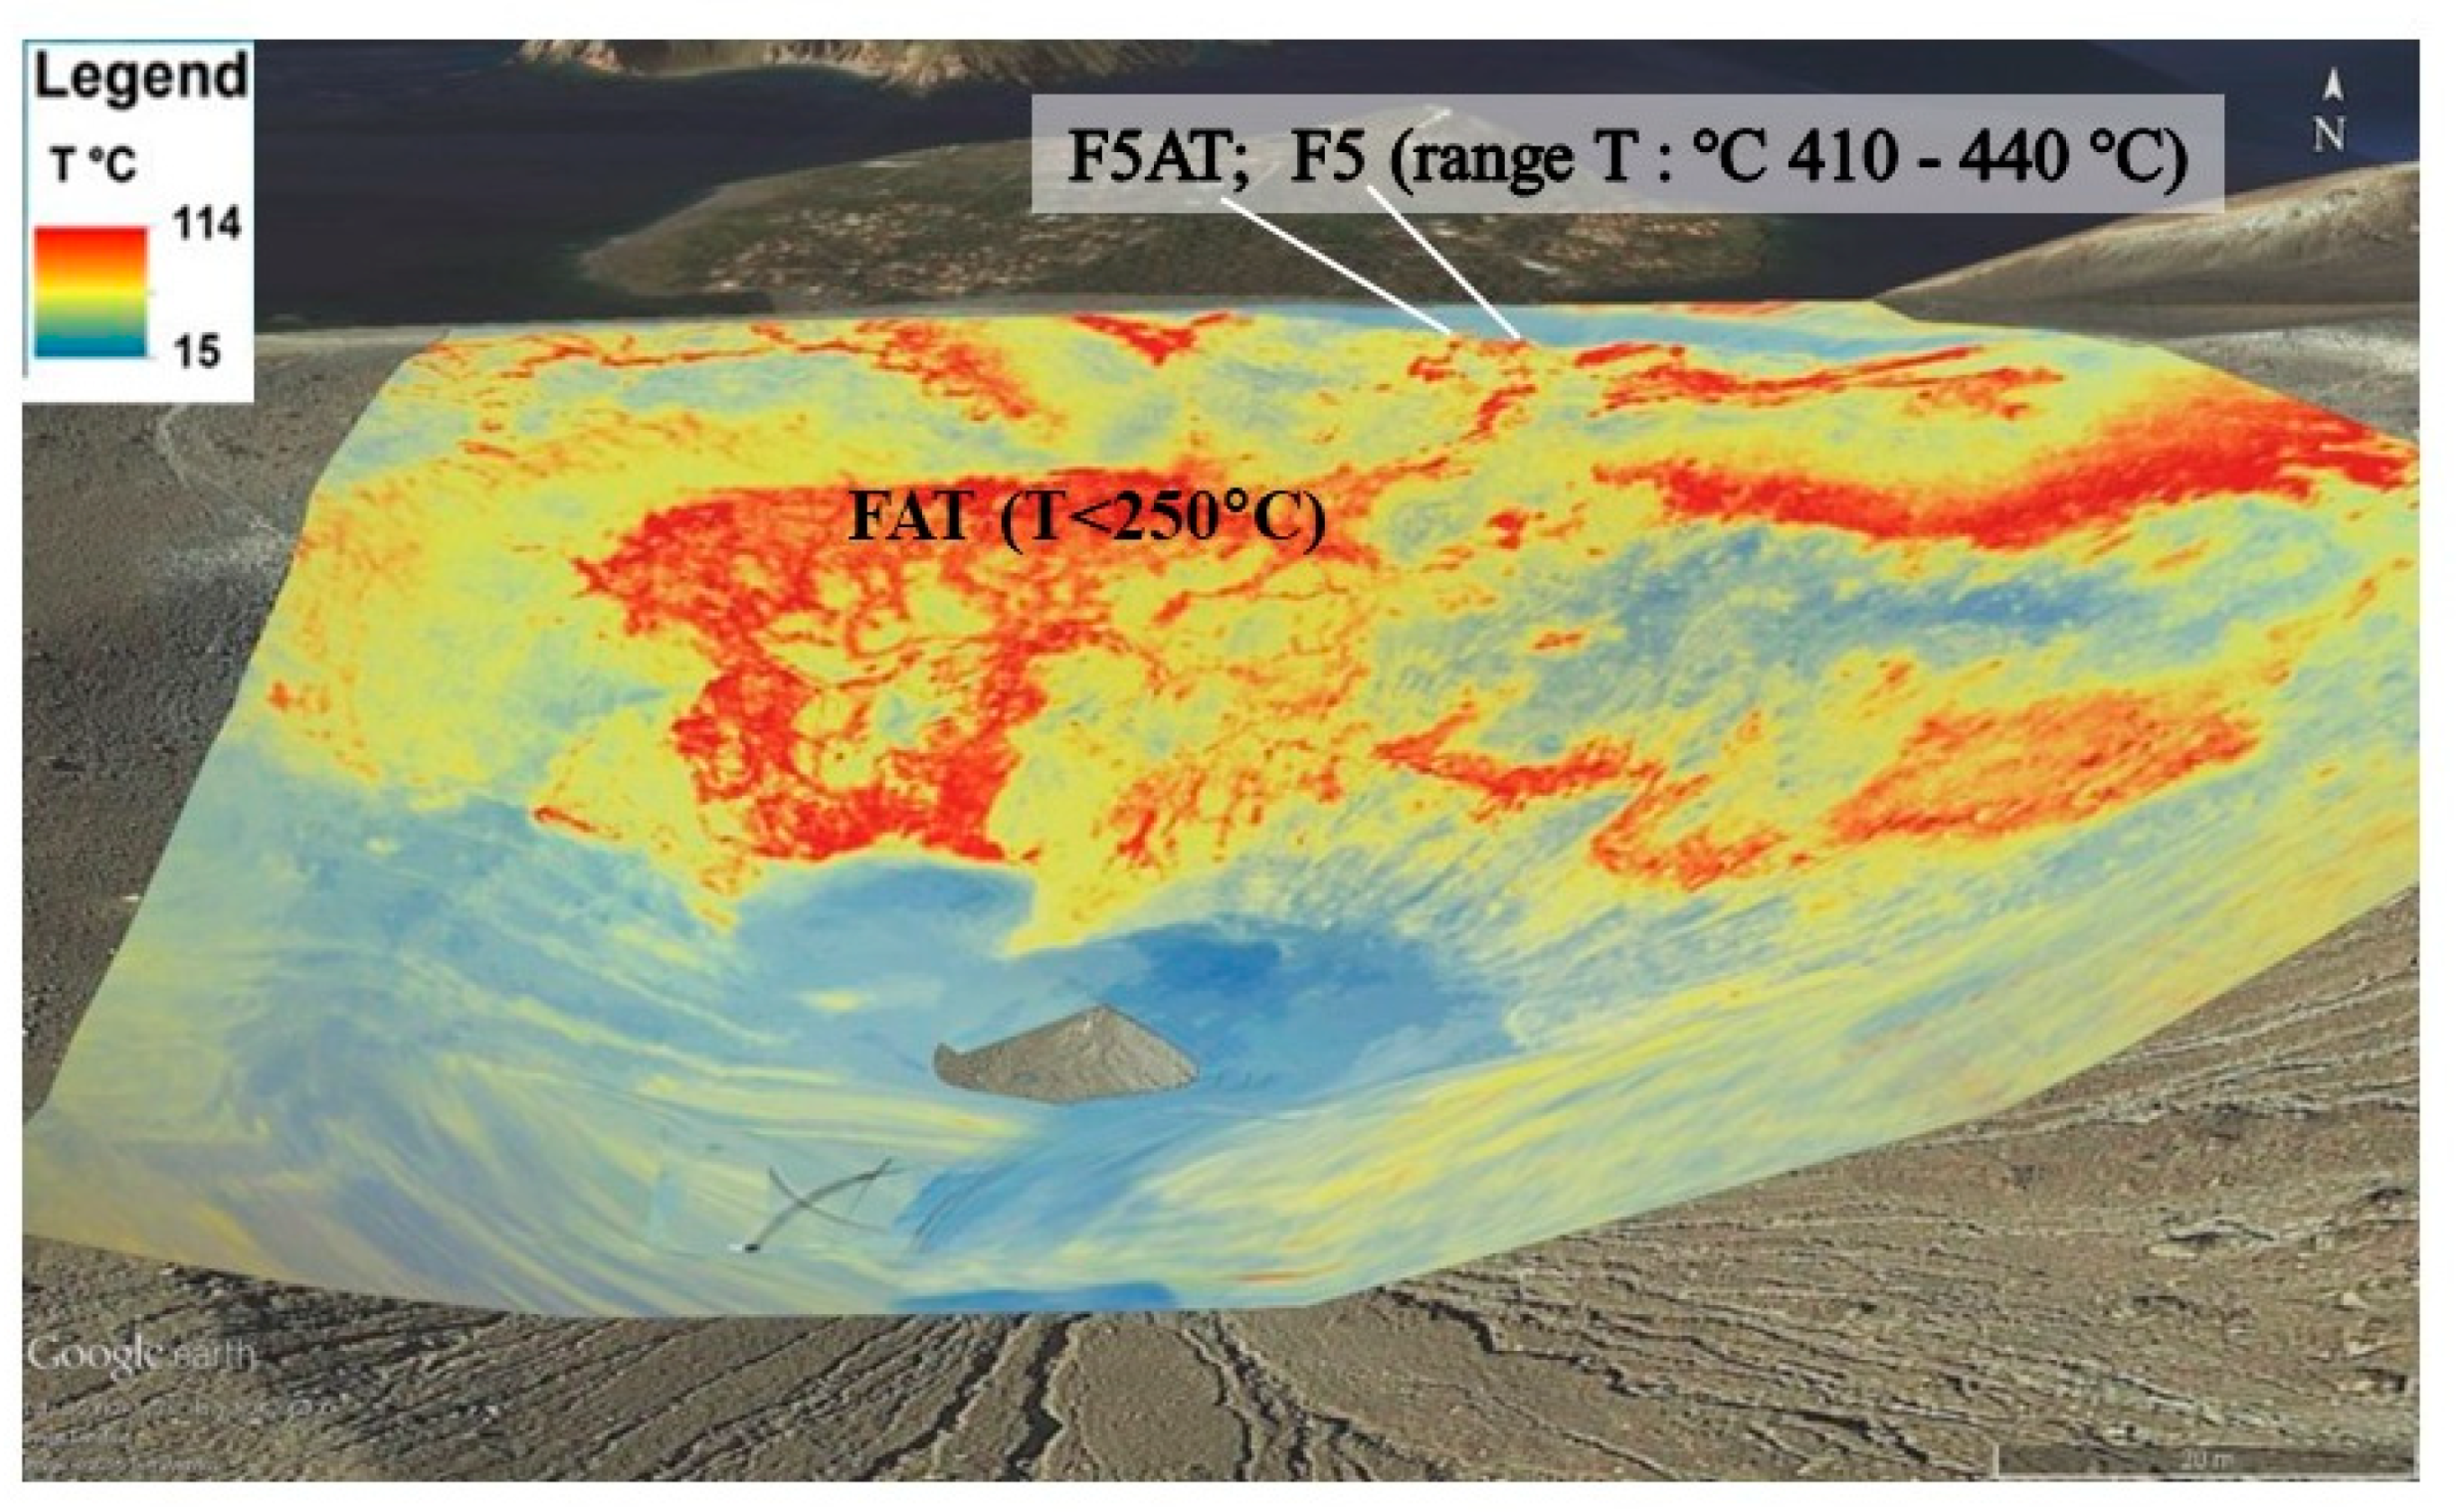
The
Figure 5 is the thermographic photo-mosaic (composed by F. Pisciotta) after a survey made in October 2014 by IR camera [
28]. The thermal map has been fitted to the google earth image of the inner flank of la fossa cone. This visualization gives an example of the extension of the thermal anomaly resulting by the combined advection of hot fluids of magmatic and hydrothermal origin in the summit area of the active cone La Fossa [
27]. In 1926 the temperature of fumaroles reached more than 600 °C [
29], and other intense pulsations have repeated afterwards [
3]. The first period of increasing temperature at La Fossa fumarole fields, processed in near real time, lasted from 1988 until 1993, and has been coupled to progressive enlargement of the emissive surface [
29] and sensible ground deformation [
23]. The dynamics of magmatic and hydrothermal systems has been modelled by interpreting the changes in composition and temperature of the gases released from fumaroles, and suggested some evident interaction between these two systems [
1,
12,
14,
30,
31]. The highest fumaroles temperature was measured in January 1993 on the inner flank of the La Fossa cone (FA fumarole, T = 670 °C [
3,
32]. Afterwards, the maximum temperature started to decrease, while the surface of active vents increased and many new vents opened on the active cone [
29,
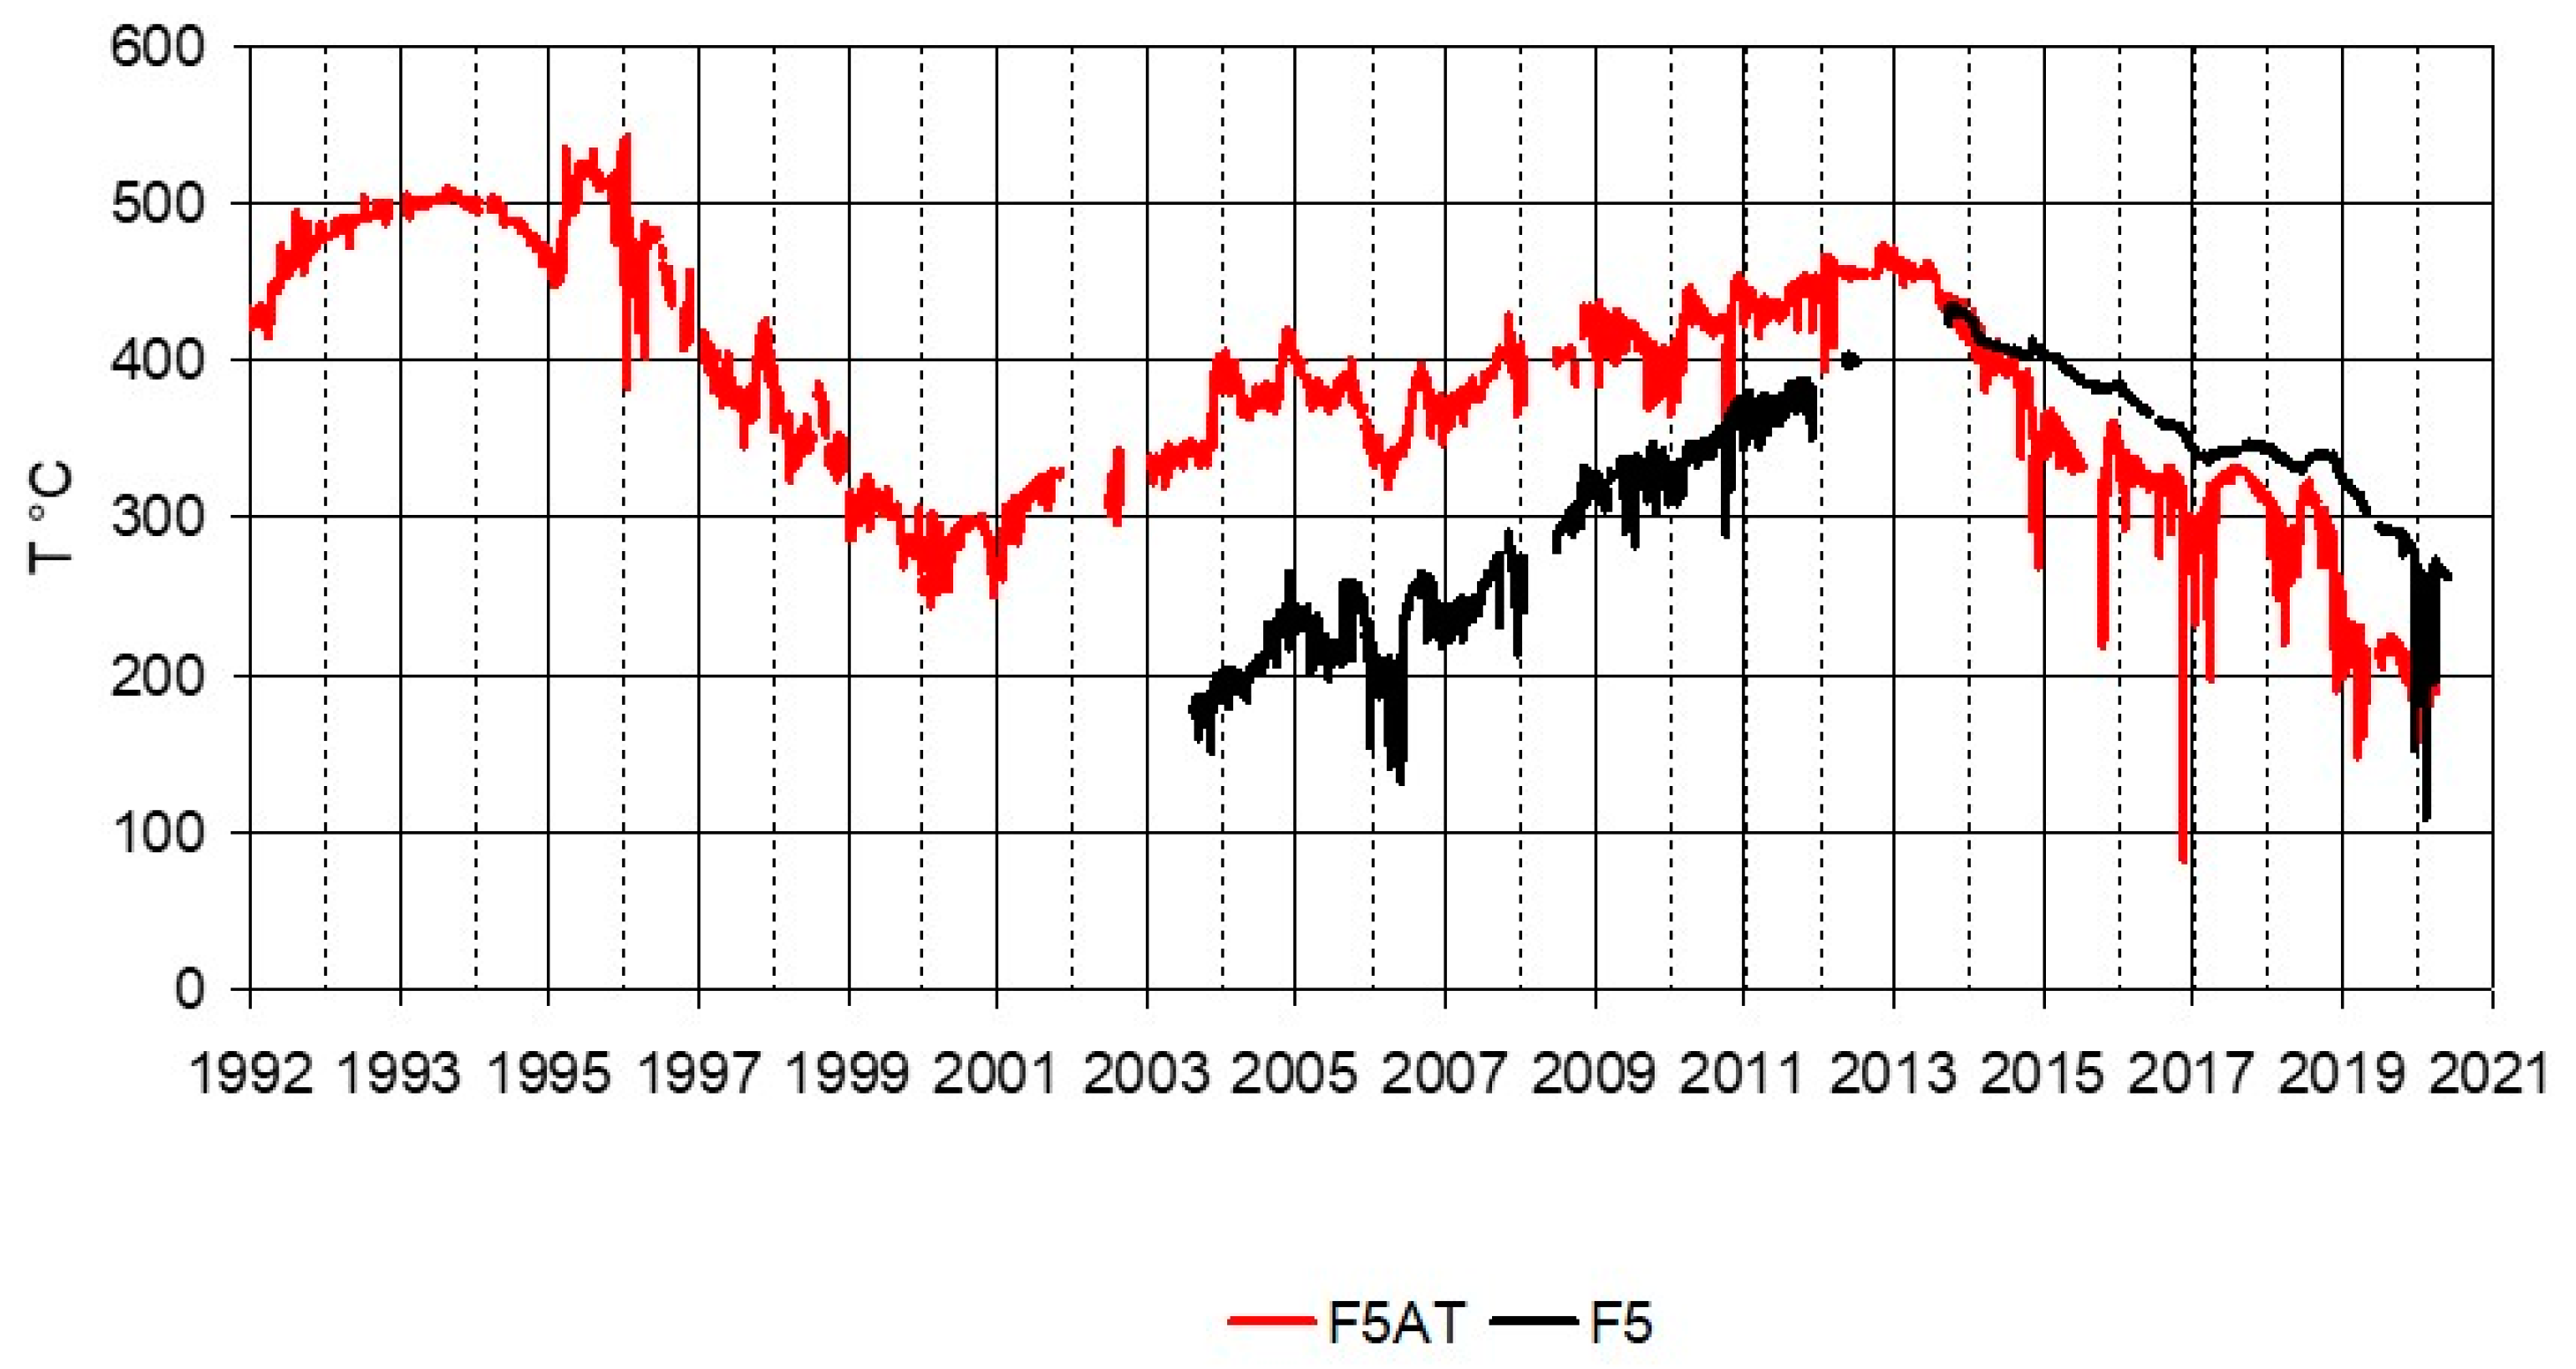
32]. The longest time series of continuous temperature data are plotted in
Figure 6 (
Figure 2a and
Figure 3 for site locations). The summary statistics of the continuous monitoring data recorded during the same interval of time is reported in
Table 1.
The F5AT and F5 fumaroles are both located on the rim of the northern slope of La Fossa crater and are periodically sampled to determine the geochemical and the isotopic composition of the mixture of hot gases directly released in air. The set of temperature data, supplied from January 1992 by the continuous monitoring network, shows that in F5AT the temperature has been higher than 500 °C, from November 1993, but it started decreasing in September 1994. From December 2000 to May 2001, the temperature of F5AT (
Figure 6) has showed the stable mean value of 275 °C, ranging between 244 and 306 °C. This first recorded period of minimum temperatures has been reached after a negative trending variation lasted 6 years and 3 months. Thereafter, on the upper rim the fumarole temperature progressively increased for more than 12 years, when it reached the second peak value of 473 °C (November 2013). Again in 2021 the maximum temperature probe has recorded the same behavior observed in 2001: A period of minimum temperatures with the stable mean value of 260 °C, ranging between 108 and 284 °C, from December 2020 to May 2021. Now, the F5AT vent ranges between 160 and 215 °C and the highest temperature is measured in the F5 vent (
Figure 5), located at a short distance (about 8 m) from the F5AT vent (
Figure 2a and
Figure 3). During the observation period the maximum temperature fumarole moved from the inner slope (fumarole FA,
Figure 2a and
Figure 3) to the upper rim (in 1996, fumarole F5AT) and more recently along the upper rim (in 2015 from F5AT to F5). The F5AT time series showed a general negative linear trend, a complete asymmetrical cycle (lasting about 19 years) and several medium-term (lasting from weeks to months) temporal variations (
Figure 6). The previous paper [
33] decomposed the time series of temperatures recorded between 1998 and June 2012, by the Fast Fourier transform method. The Fast Fourier transform method revealed that: (a) The F5AT temperature variations have been modulated by a mid-term cyclic variation, that repeated every 11 synodic periods (months); (b) the seasonal component (12 synodic periods, nearly corresponding to 356 days) is negligible in the time series of the high temperature fumaroles. The updated time series show that from 1996 to 2018 the medium-term peaks have repeated with comparable amplitudes.
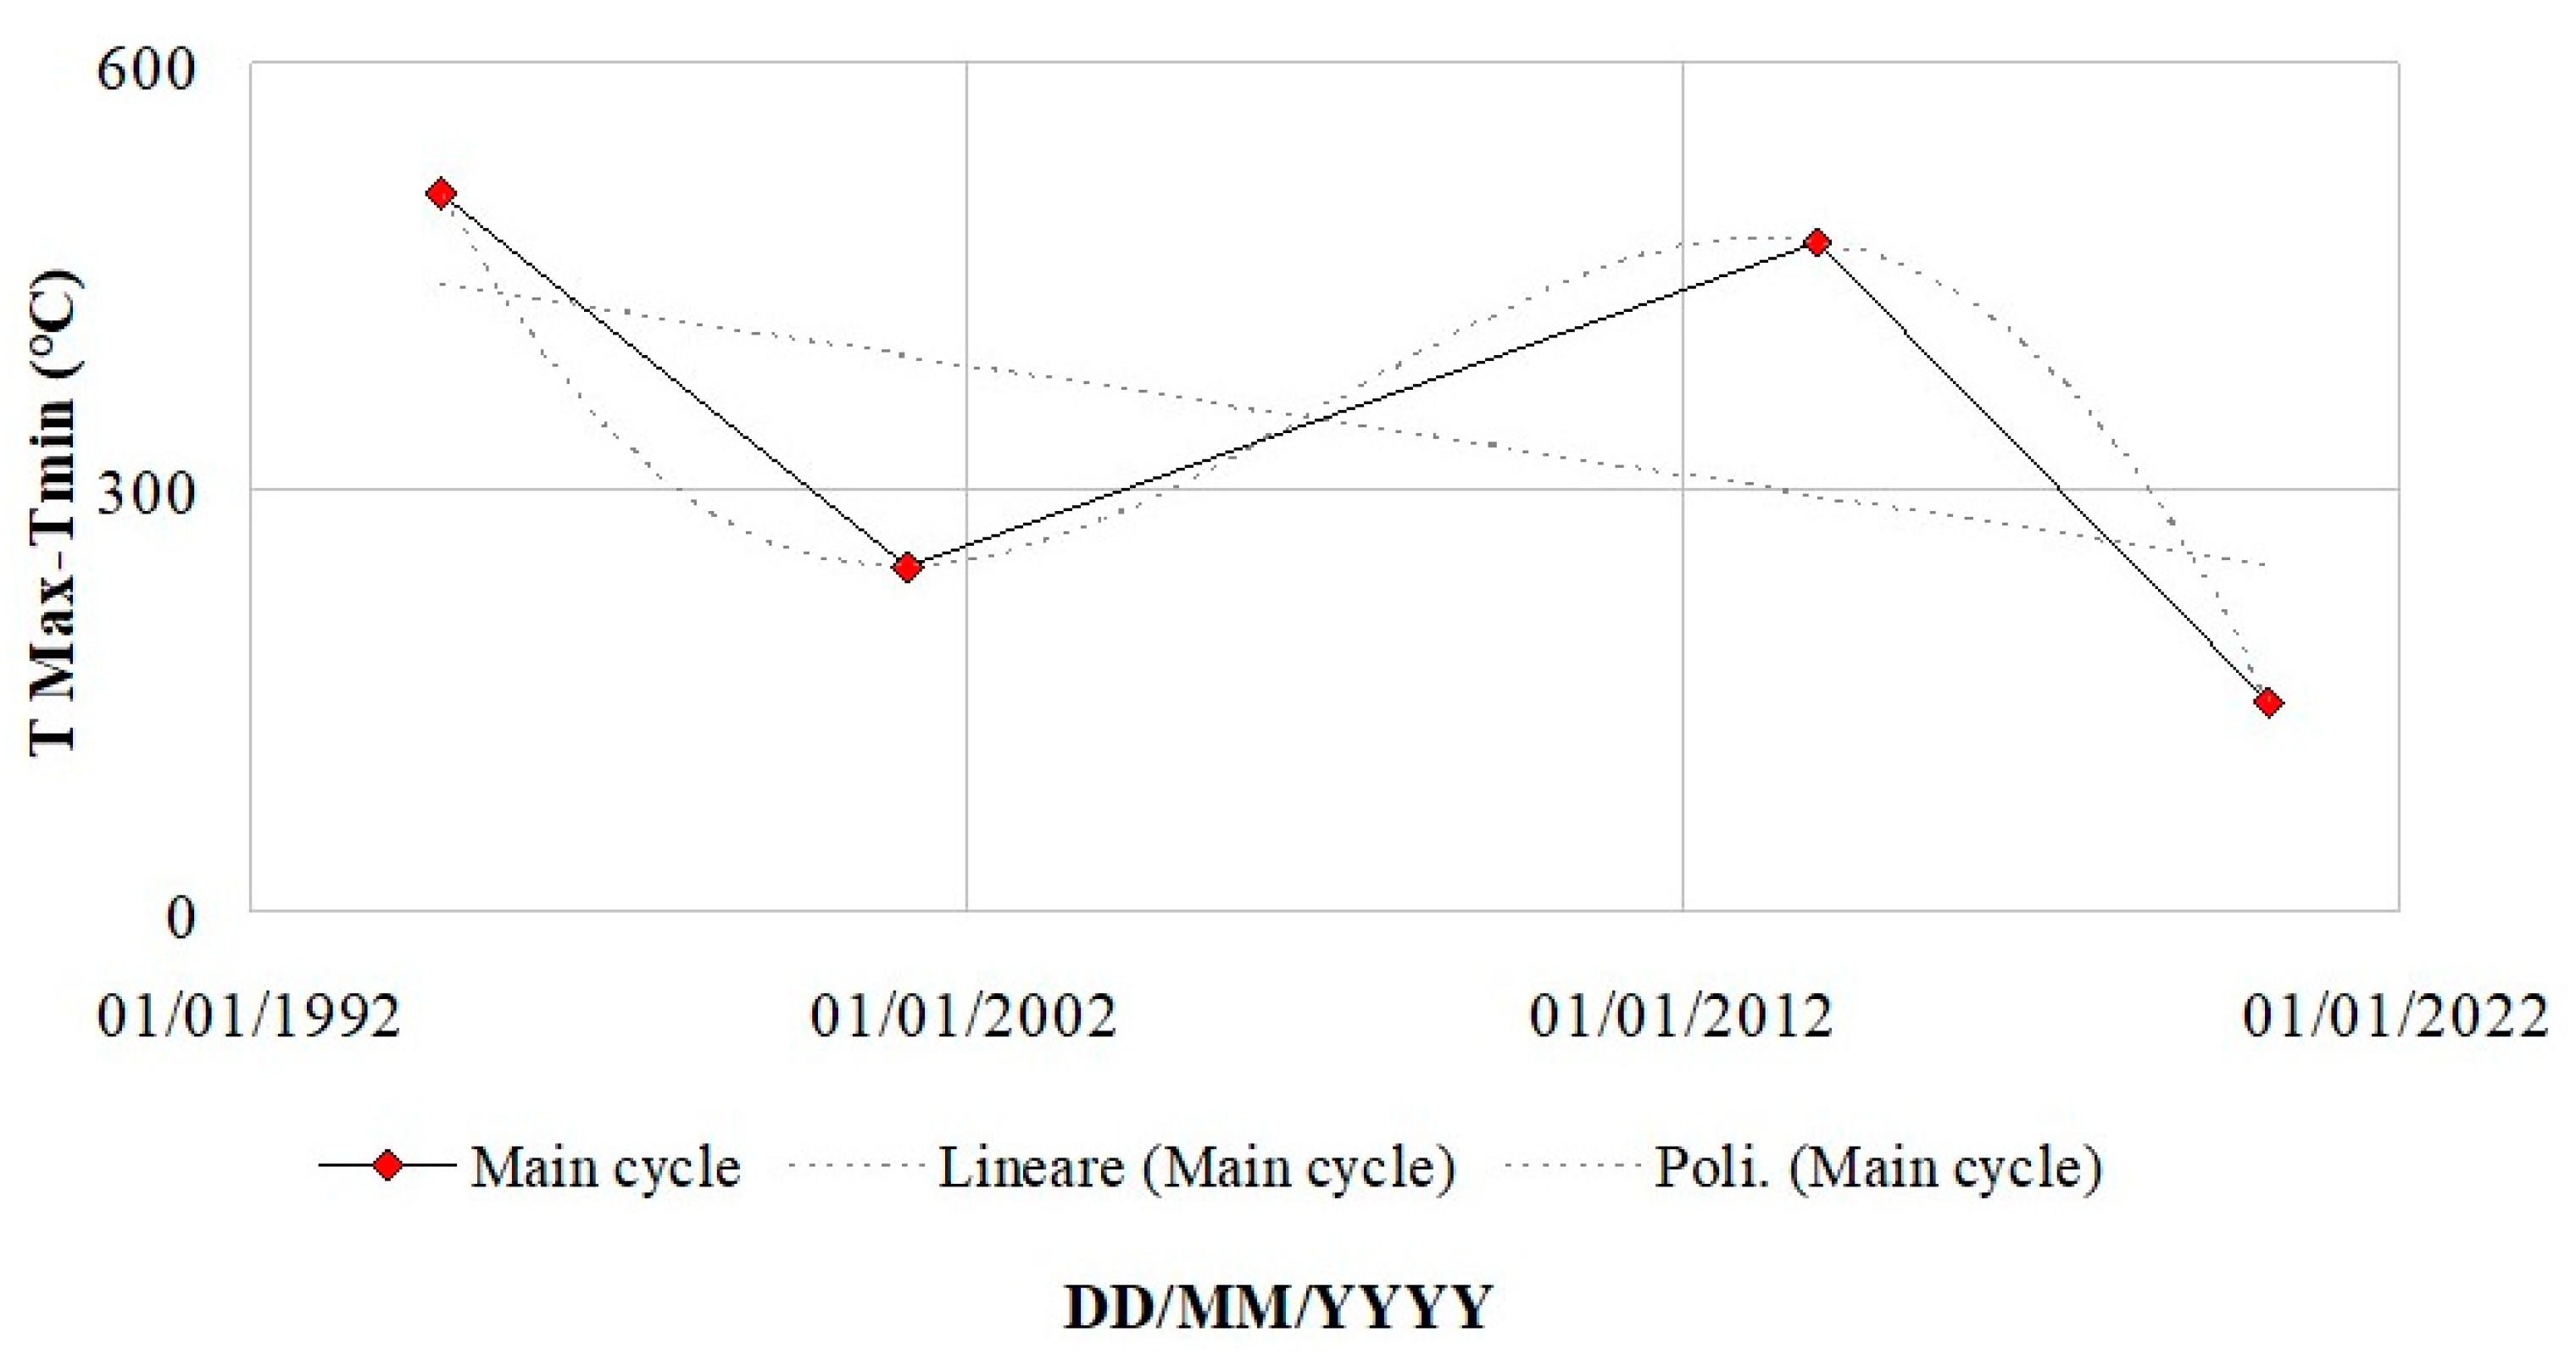
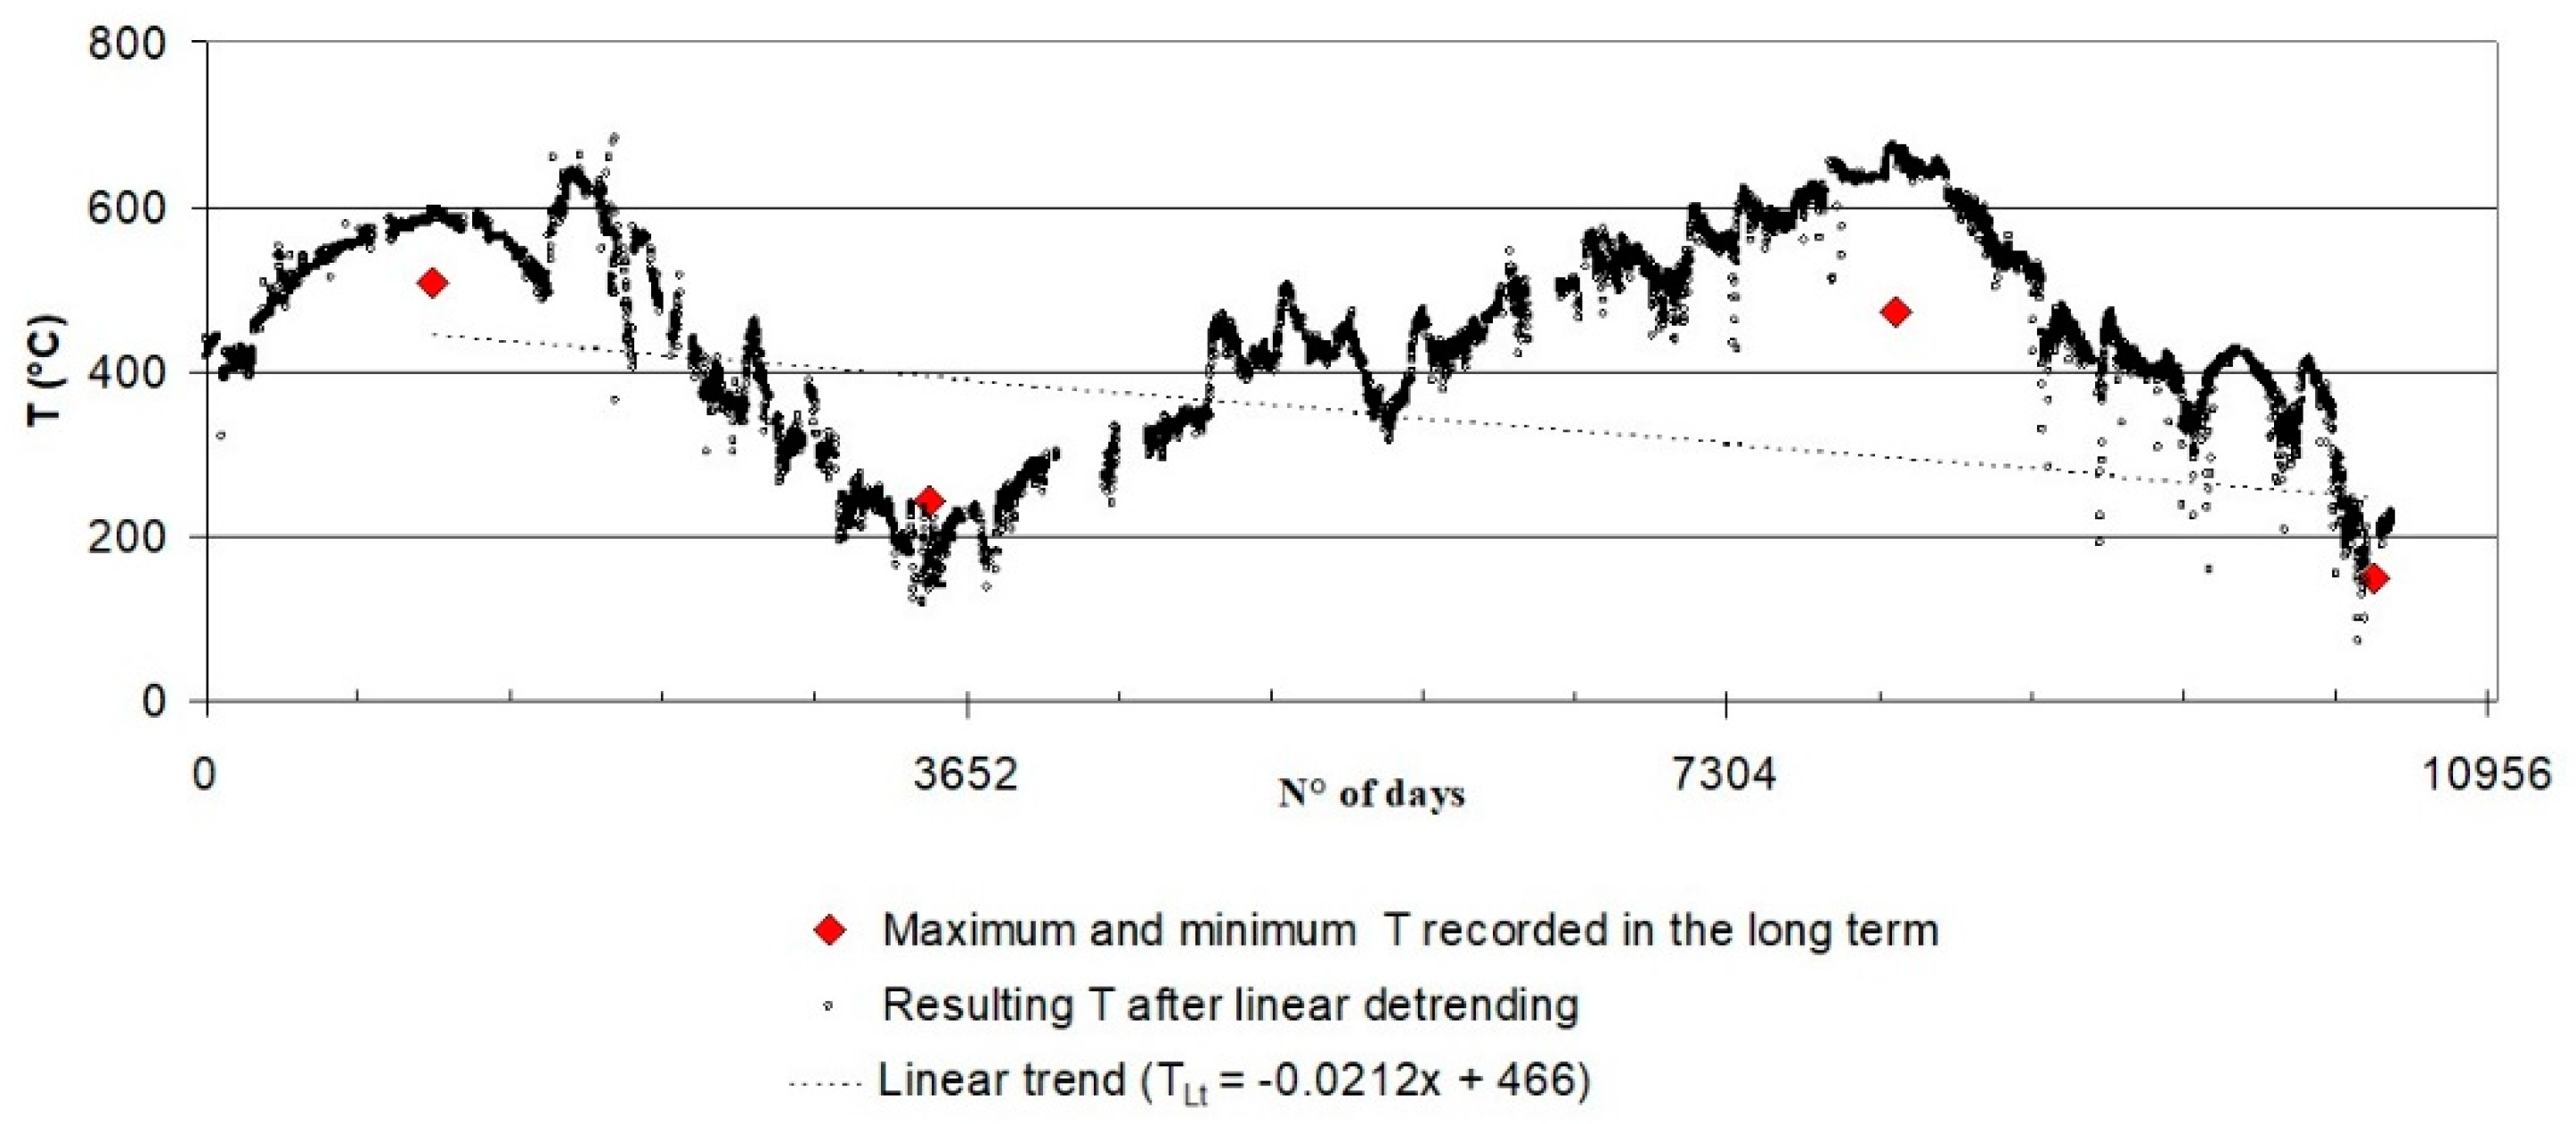
Figure 7 shows the linear and polynomial trends fitting the maximum and minimum values of temperature recorded in F5AT, while
Figure 8 shows the results of the linear de-trending applied to the original series of data.
The de-trended time series would show a greater intensity of the asymmetrical cycle, and suggests that the resulting peaks would overcome the temperature values of 600 °C in August 1996 and again in November 2013, reaching more than 670 °C (
Figure 7). This is the same temperature that was measured in the FA fumarole vent during the sampling survey performed in January 1993 [
3,
32], while on the upper rim the output temperature was still showing the real temperature of about 480 °C (
Figure 6). In 1996, during the medium term cyclic variation of temperatures, visible in
Figure 6 and
Figure 8, the geothermal system produced many other anomalous effects measured in the aquifer and in the diffuse gas emissions located at the base of the active cone, e.g., [
2,
3,
19]. Again in 2019, during the medium term cyclic variation of temperatures, visible in
Figure 6 and
Figure 8, the geochemical monitoring network registered the occurrence of multiple geochemical anomalies, at the base of La Fossa cone. The temperature network consists of a few fumaroles vents, that have been selected more than 30 years ago, when the thermal output was more intense than today, and the vent showing the highest temperature was located differently from today. The extension of the ground surface heated by the advection of high enthalpy fluid has greatly changed from the beginning of this monitoring activity, due to different combinations of many different processes, such as the unstable chemical composition of hydrothermal fluids, weathering processes, and fracturing events. Every monitoring site has shown its own range of temperatures and different local effects, but the overall trend of F5AT temperatures, roughly filtered by the local effect, suggest a major asymmetrical temperature cycle of the hydrothermal fluid expanding from the depth. In the de-trended series, the F5AT temperature pulsated from about 200 to 670 °C, and this maximum value has been already measured only once in the FA fumaroles, during the survey carried out in 1993. Recently, Silvestri et al. [
26] and Mannini et al. [
33] have tested the remote sensing techniques to follow the evolution of thermal anomalies appearing at the surface, over a larger extension of the ground. The direct measurements collected by the long-term time series presented here, could integrate the results obtained by the remote sensing methodology, to track-back the calibrated ground temperatures surrounding the monitored fumaroles vents and define the time variations of the thermal anomaly over the entire exposed surface. For example, the thermal area surrounding the FA fumaroles is actually extending about 2600 m
2, while the output temperature of this fumarole has been showing the buffered temperature of 120 °C. The intensity of the thermal anomalies, measured by direct monitoring, possibly integrated with the extension of the thermal effects, remotely sensed at the ground surface of active volcanoes could allow tracking of the thermal balance related to the steam advection.
5. Conclusions
In the last 30 years, the temperature of the ground measured in the steaming vents of La Fossa cone (Vulcano Island, Aeolian Archipelago, Italy) has pulsated between more than 650 and 250 °C. The location of the hottest emission has migrated twice, and the extension of the thermal anomalies surrounding the fumarole vents has changed, as well. The monitoring network of temperature tracked the surface heating effects related to the mixture of hot gases, continuously expanding from the shallow hydrothermal source and fed by a variable flux of magmatic gas from a deeper source. The dataset duration (more than 30 years) and temporal discretization (from 12 to 24 measures a day) of the actual records has shown the behaviour of the hidden source of thermal energy, which is useful to understand (hopefully forecast) the possible interaction between the magmatic/hydrothermal system of La Fossa Vulcano. Many different scientific papers have confirmed that this thermal monitoring has tracked the main advection process from the hydrothermal system to the surface during this last quiescent period. The time series methods for analysis (TSA) applied to the temperature data of fumaroles could help unravel the complexity of the hydrothermal system, which makes a deterministic description of the temperature variations difficult or ineffective. At the beginning of the modern volcanic surveillance programs, the deterministic approach has guided the selection of the variables to be monitored on the Island of Vulcano. For example, the thermodynamic approach to evaluate the equilibrium conditions in the geothermal system and the highest mobility of the fluid was based on some theorized behaviour but the quantitative models were lacking the amount of data necessary to confirm the hypothesis aiming to reveal the causative mechanisms of the volcanic processes in act. Therefore, strong approximations of field measurements and frequent data interpolations, were accepted to apply the theories on the fluid thermodynamic, originally based on laboratory experiments.
The frequency content of a volcanic system in a stationary state could be the combination of random variations and the modulation correlated to the external variables, but the surface temperature also reflects transient mass fluxes of hot fluids produced when the volcanic system is excited by the altered condition. This seems a recurrent event at La Fossa caldera where the monitoring evidences have been sometimes interpreted as the progressive accumulation of volatile at the top of an accumulation zone, followed by increased flux of volatiles affecting the hydrothermal fluid budget and the pressurization in the surrounding media, e.g., [
13,
14,
19,
20]. At the same time, the size of the thermal surface at the summit of La Fossa cone extended sensibly and also the magmatic gas output in the fumaroles mixture increased [
26,
31,
34].
For many decades, the temperature of the ground has been a variable easy to be interpreted as a proxy of the thermal release from the buried source, and the remote control of the temperature monitoring has resulted technically sustainable. The selection of monitoring sites was fundamental since the monitoring network is highly site sensitive, depending on the permeability distribution that influences—being in turn influenced by—the advection of high enthalpy fluids. Anyway, it is convenient to avoid biases, possibly resulting from a subjective view, to interpret the time series of the measured temperature data. The statistical approach to time series can be used to find the discriminant among the background variations (such as the thermal effects of external origin), the anomalous transients—related to variations of the geothermal flux- and the effects deriving from the natural evolution of hydrothermal alterations. Applied to the geochemical monitoring the TSA data could generally supply many practical benefits to the geological danger management. For example: Assessment of the relative contributions of periodic and aperiodic signal components; cross correlation among different series of data; simulation modelling, and evaluation of a model performance that is based on a sustainable set of reference variables to be monitored in the long-term. The time series analysis could suggest the way to link probability, uncertainty, and randomness with causal dynamics and to incorporate the deterministic controls with random components, which affect the advection processes [
35].
The specific result of TSA on this longest set of temperature data seem actually the unique opportunity to explore the thermal behaviour of ground surface on a closed conduit volcano, influenced by an active magmatic system. Moreover, the observed modulation could be interpreted in extensive terms to model the advection processes and to quantify the pulsating energy flowing from the deep system to the surface. Finally, the results and interpretations of this thermal behaviour could be exported in other, more remote, active volcanoes to interpret their thermal trends.


