
Airbnb Host Scaling, Seasonal Patterns, and Competition †


Abstract
:1. Introduction
2. Literature Review
2.1. Host Scaling Effect
2.2. Milan Seasonal Patterns
2.3. Hypotheses Development
3. Methodology
3.1. The Sample
3.2. The Host Segmentation
3.3. The Method
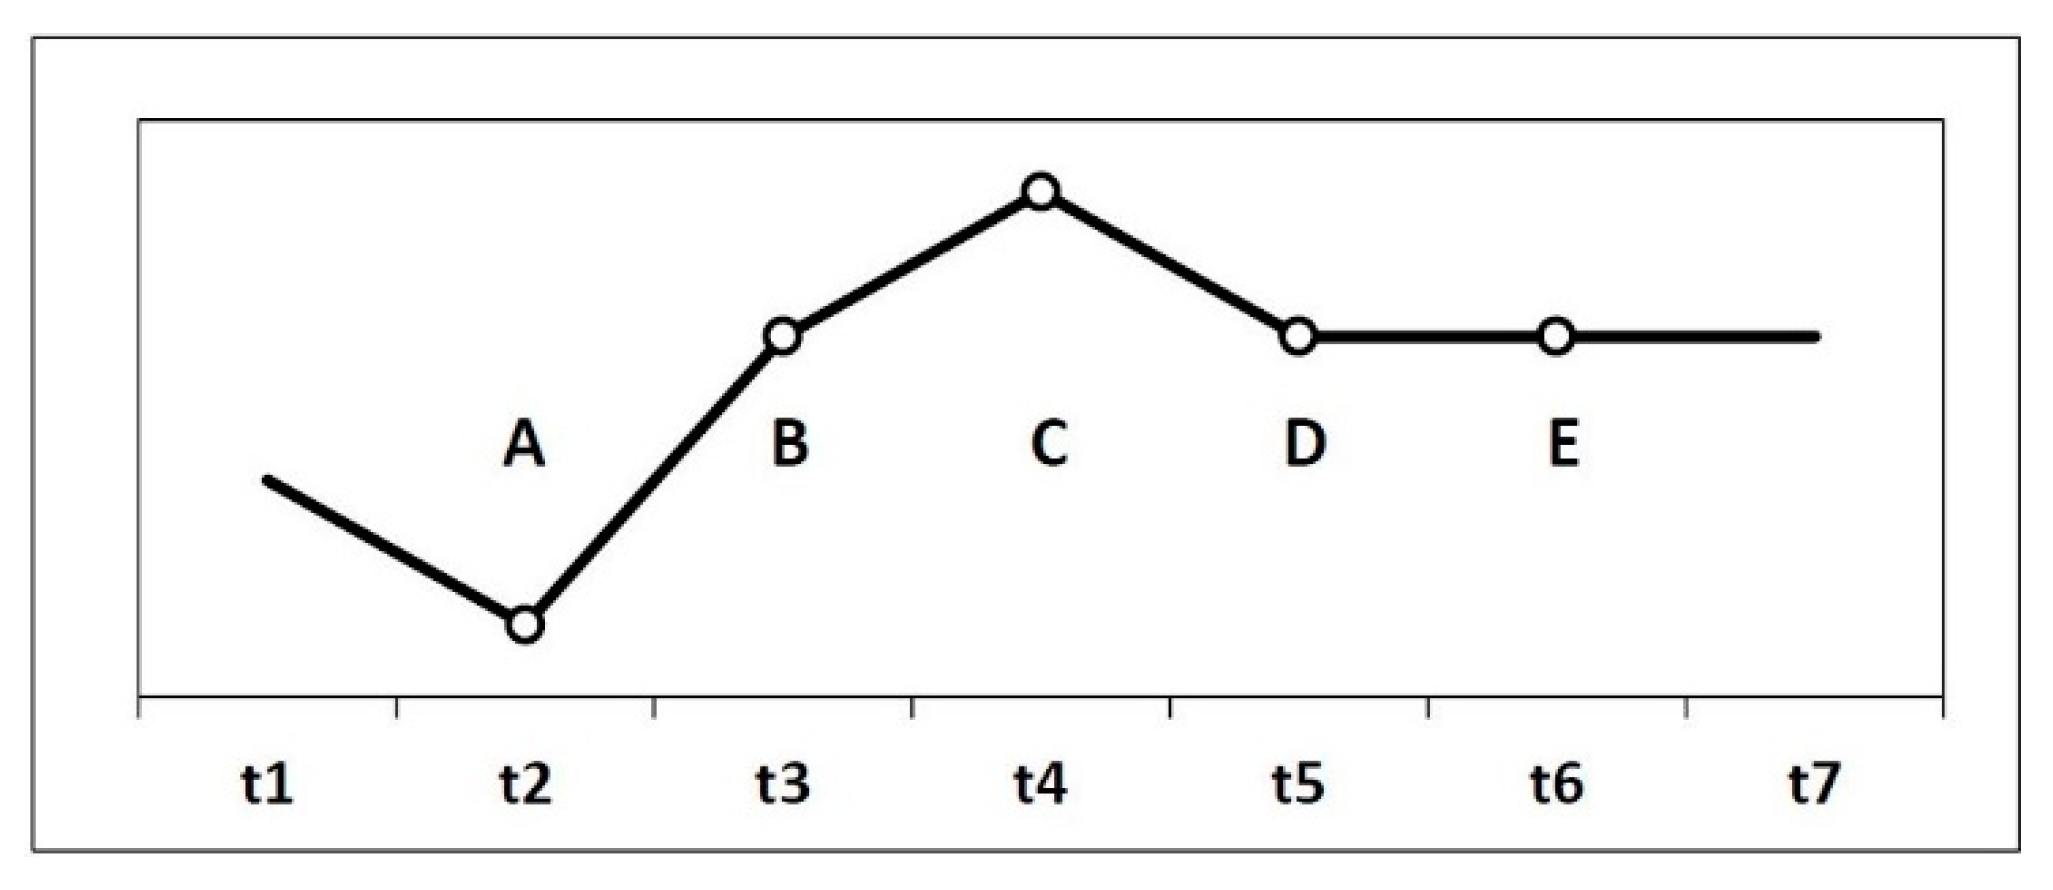
- (i)
- through: x(t + 1) < x(t) x(t + 2) or x(t + 1) < x(t + 2) x(t);
- (ii)
- peak: x(t) < x(t + 2) x(t + 1) or x(t + 2) < x(t) x(t + 1) or x(t + 2) x(t) < x(t + 1);
- (iii)
- increase: x(t) x(t + 1) < x(t + 2);
- (iv)
- decrease: x(t + 2) x(t + 1) < x(t);
- (v)
- stability: x(t) = x(t + 1) = x(t + 2).
4. Findings
4.1. Scaling Effect
4.2. Seasonal Patterns
5. Discussion
6. Conclusions
6.1. Theoretical Implications
6.2. Practical Implications
6.3. Research Avenues
6.4. Limitations
Author Contributions
Funding
Institutional Review Board Statement
Informed Consent Statement
Data Availability Statement
Conflicts of Interest
References
- Sainaghi, R.; Köseoglu, M.A.; d’Angella, F.; Mehraliyev, F. Sharing economy: A co-citation analysis. Curr. Issues Tour. 2019. [Google Scholar] [CrossRef]
- Altinay, L.; Taheri, B. Emerging themes and theories in the sharing economy: A critical note for hospitality and tourism. Int. J. Contemp. Hosp. Manag. 2019, 31, 180–193. [Google Scholar] [CrossRef]
- Sainaghi, R. Determinants of price and revenue for peer-to-peer hosts. The state of the art. Int. J. Contemp. Hosp. Manag. 2020. [Google Scholar] [CrossRef]
- Garau-Vadell, J.B.; Gutiérrez-Taño, D.; Díaz-Armas, R. Residents’ Support for P2P Accommodation in Mass Tourism Destinations. J. Travel Res. 2019, 58, 549–565. [Google Scholar] [CrossRef]
- Koh, Y.; Belarmino, A.; Kim, M.G. Good fences make good revenue: An examination of revenue management practices at peer-to-peer accommodations. Tour. Econ. 2019. [Google Scholar] [CrossRef]
- Xie, K.L.; Kwok, L.; Heo, C.Y. Are Neighbors Friends or Foes? Assessing Airbnb Listings’ Agglomeration Effect in New York City. Cornell Hosp. Q. 2019. [Google Scholar] [CrossRef]
- Kim, J.; Tang, L.R.; Wang, X. The uniqueness of entrepreneurship in the sharing accommodation sector: Developing a scale of entrepreneurial capital. Int. J. Hosp. Manag. 2020, 84, 102321. [Google Scholar] [CrossRef]
- Bocken, N.M.; Fil, A.; Prabhu, J. Scaling up social businesses in developing markets. J. Clean. Prod. 2016, 139, 295–308. [Google Scholar] [CrossRef] [Green Version]
- Butler, R.W. Seasonality in tourism: Issues and problems. In Tourism: The State of the Art; Wiley: Hoboken, NJ, USA, 1994; pp. 332–340. [Google Scholar]
- Sainaghi, R.; Mauri, A.; d’Angella, F. Decomposing seasonality in an urban destination: The case of Milan. Curr. Issues Tour. 2018. [Google Scholar] [CrossRef]
- Guttentag, D. Airbnb: Disruptive innovation and the rise of an informal tourism accommodation sector. Curr. Issues Tour. 2018, 12, 1192–1217. [Google Scholar] [CrossRef]
- Dolnicar, S. A review of research into paid online peer-to-peer accommodation: Launching the Annals of Tourism Research curated collection on peer-to-peer accommodation. Ann. Tour. Res. 2019, 75, 248–264. [Google Scholar] [CrossRef]
- Sainaghi, R.; Baggio, R. Clusters of topics and research designs in peer-to-peer accommodation platforms. Int. J. Hosp. Manag. 2020, 88, 102393. [Google Scholar] [CrossRef]
- Prayag, G.; Ozanne, L.K. A systematic review of peer-to-peer (P2P) accommodation sharing research from 2010 to 2016: Progress and prospects from the multi-level perspective. J. Hosp. Mark. Manag. 2018, 27, 649–678. [Google Scholar] [CrossRef]
- Gant, A.C. Holiday rentals: The new gentrification battlefront. Sociol. Res. Online 2016, 21, 1–9. [Google Scholar] [CrossRef]
- Fang, B.; Ye, Q.; Law, R. Effect of sharing economy on tourism industry employment. Ann. Tour. Res. 2016, 57, 264–267. [Google Scholar] [CrossRef]
- Vinogradov, E.; Leick, B.; Kivedal, B.K. An agent-based modelling approach to housing market regulations and Airbnb-induced tourism. Tour. Manag. 2020, 77, 104004. [Google Scholar] [CrossRef]
- Akbar, Y.H.; Tracogna, A. The sharing economy and the future of the hotel industry: Transaction cost theory and platform economics. Int. J. Hosp. Manag. 2018, 71, 91–101. [Google Scholar] [CrossRef]
- Ključnikov, A.; Krajčík, V.; Vincúrová, Z. International Sharing Economy: The Case of AirBnB in the Czech Republic. Econ. Sociol. 2018, 11, 126–137. [Google Scholar] [CrossRef]
- Sainaghi, R.; Abrate, G.; Mauri, A. Price and RevPAR determinants of airbnb listings: Convergent and divergent evidence. Int. J. Hosp. Manag. 2021, 92, 102709. [Google Scholar] [CrossRef]
- Sainaghi, R. The current state of academic research into peer-to-peer accommodation platforms. Int. J. Hosp. Manag. 2020, 89, 102555. [Google Scholar] [CrossRef]
- Liang, S.; Schuckert, M.; Law, R.; Chen, C.C. Be a “Superhost”: The importance of badge systems for peer-to-peer rental accommodations. Tour. Manag. 2017, 60, 454–465. [Google Scholar] [CrossRef]
- Gunter, U.; Önder, I. Determinants of Airbnb demand in Vienna and their implications for the traditional accommodation industry. Tour. Econ. 2018, 24, 270–293. [Google Scholar] [CrossRef]
- Xie, K.; Mao, Z. The impacts of quality and quantity attributes of Airbnb hosts on listing performance. Int. J. Contemp. Hosp. Manag. 2017, 29, 2240–2260. [Google Scholar] [CrossRef]
- Gunter, U. What makes an Airbnb host a superhost? Empirical evidence from San Francisco and the Bay Area. Tour. Manag. 2018, 66, 26–37. [Google Scholar] [CrossRef]
- Li, J.; Moreno, A.; Zhang, D.J. Agent behavior in the sharing economy: Evidence from Airbnb. Ross Sch. Bus. Work. Pap. Ser. 2015, 1298, 1–33. [Google Scholar] [CrossRef]
- Gibbs, C.; Guttentag, D.; Gretzel, U.; Morton, J.; Goodwill, A. Pricing in the sharing economy: A hedonic pricing model applied to Airbnb listings. J. Travel Tour. Mark. 2018, 35, 46–56. [Google Scholar] [CrossRef]
- Oskam, J.; van der Rest, J.P.; Telkam, B. What’s mine is yours—But at what price? Dynamic pricing behavior as an indicator of Airbnb host professionalization. J. Revenue Pricing Manag. 2018, 17, 311–328. [Google Scholar] [CrossRef]
- Chen, Y.; Zhang, R.; Liu, B. Fixed, flexible, and dynamics pricing decisions of Airbnb mode with social learning. Tour. Econ. 2020. [Google Scholar] [CrossRef]
- Gibbs, C.; Guttentag, D.; Gretzel, U.; Yao, L.; Morton, J. Use of dynamic pricing strategies by Airbnb hosts. Int. J. Contemp. Hosp. Manag. 2018, 30, 2–20. [Google Scholar] [CrossRef]
- Kwok, L.; Xie, K.L. Pricing strategies on Airbnb: Are multi-unit hosts revenue pros? Int. J. Hosp. Manag. 2019, 82, 252–259. [Google Scholar] [CrossRef]
- Campopiano, G.; Minola, T.; Sainaghi, R. Students Climbing the Entrepreneurial Ladder: Family Social Capital and Environment-related Motives in Hospitality and Tourism. Int. J. Contemp. Hosp. Manag. 2016, 28, 1115–1136. [Google Scholar] [CrossRef]
- Magno, F.; Cassia, F.; Ugolini, M.M. Accommodation prices on Airbnb: Effects of host experience and market demand. TQM J. 2018, 30, 608–620. [Google Scholar] [CrossRef]
- Falk, M.; Larpin, B.; Scaglione, M. The role of specific attributes in determining prices of Airbnb listings in rural and urban locations. Int. J. Hosp. Manag. 2019, 83, 132–140. [Google Scholar] [CrossRef]
- Deboosere, R.; Kerrigan, D.J.; Wachsmuth, D.; El-Geneidy, A. Location, location and professionalization: A multilevel hedonic analysis of Airbnb listing prices and revenue. Reg. Stud. Reg. Sci. 2019, 6, 143–156. [Google Scholar] [CrossRef] [Green Version]
- Tong, B.; Gunter, U. Hedonic pricing and the sharing economy: How profile characteristics affect Airbnb accommodation prices in Barcelona, Madrid, and Seville. Curr. Issues Tour. 2020. [Google Scholar] [CrossRef]
- Cai, Y.; Zhou, Y.; Scott, N. Price determinants of Airbnb listings: Evidence from Hong Kong. Tour. Anal. 2019, 24, 227–242. [Google Scholar] [CrossRef]
- Proserpio, D.; Xu, W.; Zervas, G. You get what you give: Theory and evidence of reciprocity in the sharing economy. Quant. Mark. Econ. 2018, 16, 371–407. [Google Scholar] [CrossRef]
- Chen, Y.; Xie, K. Consumer valuation of Airbnb listings: A hedonic pricing approach. Int. J. Contemp. Hosp. Manag. 2017, 29, 2405–2424. [Google Scholar] [CrossRef]
- Izquierdo, L.M.; Egorova, G.; Rovira, A.P.; Ferrando, A.M. Exploring the use of artificial intelligence in price maximisation in the tourism sector: Its application in the case of Airbnb in the Valencian Community. J. Reg. Res. 2018, 42, 113–128. [Google Scholar]
- Chattopadhyay, M.; Mitra, S.K. Do airbnb host listing attributes influence room pricing homogenously? Int. J. Hosp. Manag. 2019, 81, 54–64. [Google Scholar] [CrossRef]
- Baggio, R.; Sainaghi, R. Mapping time series into networks as a tool to assess the complex dynamics of tourism systems. Tour. Manag. 2016, 54, 23–33. [Google Scholar] [CrossRef]
- d’Angella, F.; de Carlo, M.; Sainaghi, R. Archetypes of destination governance: A comparison of international destinations. Tour. Rev. 2010, 65, 61–73. [Google Scholar] [CrossRef]
- Sainaghi, R.; Mauri, A. The Milan World Expo 2015: Hospitality operating performance and seasonality effects. Int. J. Hosp. Manag. 2018, 72, 32–46. [Google Scholar] [CrossRef]
- Baggio, R.; Sainaghi, R. Complex and chaotic tourism systems: Towards a quantitative approach. Int. J. Contemp. Hosp. Manag. 2011, 23, 840–861. [Google Scholar] [CrossRef]
- Sainaghi, R.; Baggio, R. The effects generated by events on destination dynamics and topology. Curr. Issues Tour. 2019. [Google Scholar] [CrossRef]
- Sainaghi, R.; Canali, S. Commercial mix, seasonality and daily hotel performance: The case of Milan. In Strategic Management Engineering: Enterprise, Environment and Crisis; Sichuan University Press: Chengdu, China, 2009. [Google Scholar]
- Sainaghi, R.; Mauri, A.; Ivanov, S.; D’Angella, F. Mega events and seasonality: The case of the Milan World Expo 2015. Int. J. Contemp. Hosp. Manag. 2019, 31, 61–86. [Google Scholar] [CrossRef]
- Sainaghi, R.; Canali, S. Exploring the effects of destination’s positioning on hotels’ performance: The Milan case. Tour. Int. Multidiscip. J. Tour. 2011, 6, 121–138. [Google Scholar]
- Cazelles, B. Symbolic dynamics for identifying similarity between rhythms of ecological time series. Ecol. Lett. 2004, 7, 755–763. [Google Scholar] [CrossRef]
- Sainaghi, R.; Baggio, R. Substitution threat between Airbnb and hotels: Myth or reality? Ann. Tour. Res. 2020, 83, 102959. [Google Scholar] [CrossRef]
- Nofre, J.; Giordano, E.; Eldridge, A.; Martins, J.C.; Sequera, J. Tourism, nightlife and planning: Challenges and opportunities for community liveability in La Barceloneta. Tour. Geogr. 2018, 20, 377–396. [Google Scholar] [CrossRef]
- Oxoli, D.; Prestifilippo, G.; Bertocchi, D. Enabling spatial autocorrelation mapping in QGIS: The hotspot analysis Plugin. Geoing. Ambient. Min. 2017, 151, 45–50. [Google Scholar]
- Garcia-Ayllon, S. Urban Transformations as an Indicator of Unsustainability in the P2P Mass Tourism Phenomenon: The Airbnb Case in Spain through Three Case Studies. Sustainability 2018, 10, 2933. [Google Scholar] [CrossRef] [Green Version]
- Heo, C.Y.; Blal, I.; Choi, M. What is happening in Paris? Airbnb, hotels, and the Parisian market: A case study. Tour. Manag. 2019, 70, 78–88. [Google Scholar] [CrossRef]
- Ferreri, M.; Sanyal, R. Platform economies and urban planning: Airbnb and regulated deregulation in London. Urban Stud. 2018, 55, 3353–3368. [Google Scholar] [CrossRef]
- Schäfer, P.; Braun, N. Misuse through short-term rentals on the Berlin housing market. Int. J. Hous. Mark. Anal. 2016, 9, 287–311. [Google Scholar] [CrossRef]
- Sainaghi, R.; Baggio, R. Complexity traits and dynamics of tourism destinations. Tour. Manag. 2017, 63, 368–382. [Google Scholar] [CrossRef]
- Sainaghi, R.; Baggio, R. Destination Events, Stability, and Turning Points of Development. J. Travel Res. 2019. [Google Scholar] [CrossRef]
- Freeman, J.; Baggio, J.A.; Robinson, E.; Byers, D.A.; Gayo, E.; Finley, J.B.; Meyer, J.A.; Kelly, R.L.; Anderies, J.M. Synchronization of energy consumption by human societies throughout the Holocene. Proc. Natl. Acad. Sci. USA 2018, 115, 9962–9967. [Google Scholar] [CrossRef] [Green Version]
- Latham, P.E.; Roudi, Y. Mutual information. Scholarpedia 2009, 4, 1658. [Google Scholar] [CrossRef]
- Zervas, G.; Proserpio, D.; Byers, J.W. The rise of the sharing economy: Estimating the impact of Airbnb on the hotel industry. J. Mark. Res. 2017, 54, 687–705. [Google Scholar] [CrossRef] [Green Version]


| 2015–2018 | |||||||||||
|---|---|---|---|---|---|---|---|---|---|---|---|
| Clusters | Absolute Measures | Clusters’ Weight | Unitary Values | ||||||||
| Host | Listings (list) | Available Days (Av_D) (/000) | Book Days (Bo_D) (/000) | Revenue (Rev) (mil.) | Rev % | List % | Host % | List per host | Av_D per list | Bo_D per list | |
| P1 | 24,535 | 24,535 | 9702 | 1950 | 194 | 35% | 48% | 78% | 1 | 395 | 79 |
| P2 | 4215 | 8430 | 3476 | 746 | 72 | 13% | 17% | 13% | 2 | 412 | 89 |
| P3 | 1289 | 3867 | 1666 | 383 | 48 | 7% | 8% | 4% | 3 | 431 | 99 |
| P10 | 1238 | 6539 | 2812 | 709 | 87 | 15% | 13% | 4% | 5.3 | 430 | 109 |
| P > 10 | 242 | 7536 | 2737 | 878 | 125 | 29% | 15% | 1% | 31.1 | 363 | 117 |
| PAll | 31,519 | 50,907 | 20,393 | 4666 | 526 | 100% | 100% | 100% | 1.6 | 401 | 92 |
| Clusters | Performance | Performance Scaling | |||||||||
| Rev | ADR | Occ. (*) | RevPAN | Var. ADR | Var. occ. | Var. RevPAN | |||||
| per list | |||||||||||
| P1 | 7922 | 100 | 20.10% | 20 | |||||||
| P2 | 8520 | 96 | 21.50% | 21 | −3.50% | 6.80% | 3.10% | ||||
| P3 | 12,352 | 125 | 23.00% | 29 | 29.80% | 7.00% | 38.80% | ||||
| P10 | 13,342 | 123 | 25.20% | 31 | −1.50% | 9.90% | 8.20% | ||||
| P > 10 | 16,530 | 142 | 32.10% | 46 | 15.40% | 27.20% | 46.70% | ||||
| PAll | 10,328 | 113 | 22.90% | 26 | |||||||
| Legend: (*) occupancy here is calculated as the ratio between book days over available days. | |||||||||||
| Clusters | P1 | P2 | P3 | P10 | P > 10 | PAll | Mean |
|---|---|---|---|---|---|---|---|
| P1 | 1 | ||||||
| P2 | 0.498 | 1 | 0.498 | ||||
| P3 | 0.429 | 0.377 | 1 | 0.403 | |||
| P10 | 0.363 | 0.367 | 0.337 | 1 | 0.356 | ||
| P > 10 | 0.334 | 0.308 | 0.276 | 0.343 | 1 | 0.315 | |
| PAll | 0.665 | 0.560 | 0.499 | 0.454 | 0.395 | 1 | 0.515 |
| P1 | P2 | P3 | P10 | P > 10 | |
|---|---|---|---|---|---|
| PAll | |||||
| Hypothesis 3A | |||||
| Holiday | 0.649 | 0.533 | 0.521 | 0.434 | 0.403 |
| Working | 0.643 | 0.505 | 0.438 | 0.412 | 0.331 |
| Hypothesis 3B | |||||
| Weekend | 0.721 | 0.573 | 0.533 | 0.472 | 0.415 |
| Midweek | 0.596 | 0.477 | 0.413 | 0.396 | 0.330 |
| Hypothesis 3C | |||||
| Trade-fair | 0.860 | 0.801 | 0.676 | 0.508 | 0.513 |
| Non-trade-fair | 0.654 | 0.549 | 0.490 | 0.465 | 0.396 |
| Holiday (4.A) | P1 | P2 | P3 | P10 | P > 10 | Weekend (4.C) | P1 | P2 | P3 | P10 | P > 10 | |
| P1 | 1 | P1 | 1 | |||||||||
| P2 | 0.47 | 1 | P2 | 0.48 | 1 | |||||||
| P3 | 0.42 | 0.34 | 1 | P3 | 0.49 | 0.39 | 1 | |||||
| P10 | 0.35 | 0.36 | 0.34 | 1 | P10 | 0.4 | 0.44 | 0.38 | 1 | |||
| P > 10 | 0.35 | 0.28 | 0.27 | 0.29 | 1 | P > 10 | 0.36 | 0.33 | 0.3 | 0.31 | 1 | |
| Trade fair (4.E) | P1 | P2 | P3 | P10 | P > 10 | Non trade fair (4.F) | P1 | P2 | P3 | P10 | P > 10 | |
| P1 | 1 | P1 | 1 | |||||||||
| P2 | 0.75 | 1 | P2 | 0.48 | 1 | |||||||
| P3 | 0.58 | 0.68 | 1 | P3 | 0.42 | 0.36 | 1 | |||||
| P10 | 0.43 | 0.51 | 0.55 | 1 | P10 | 0.37 | 0.37 | 0.34 | 1 | |||
| P > 10 | 0.44 | 0.47 | 0.54 | 0.6 | 1 | P > 10 | 0.34 | 0.31 | 0.27 | 0.33 | 1 | |
| Working (4.B) | P1 | P2 | P3 | P10 | P > 10 | Midweek (4.D) | P1 | P2 | P3 | P10 | P > 10 | |
| P1 | 1 | P1 | 1 | |||||||||
| P2 | 0.45 | 1 | P2 | 0.41 | 1 | |||||||
| P3 | 0.37 | 0.36 | 1 | P3 | 0.34 | 0.3 | 1 | |||||
| P10 | 0.32 | 0.29 | 0.27 | 1 | P10 | 0.3 | 0.27 | 0.26 | 1 | |||
| P > 10 | 0.26 | 0.24 | 0.2 | 0.28 | 1 | P > 10 | 0.25 | 0.23 | 0.19 | 0.26 | 1 | |
| Legend: squared bold values = increase | ||||||||||||
Publisher’s Note: MDPI stays neutral with regard to jurisdictional claims in published maps and institutional affiliations. |
© 2021 by the authors. Licensee MDPI, Basel, Switzerland. This article is an open access article distributed under the terms and conditions of the Creative Commons Attribution (CC BY) license (https://creativecommons.org/licenses/by/4.0/).
Share and Cite
Sainaghi, R.; Baggio, R. Airbnb Host Scaling, Seasonal Patterns, and Competition. Eng. Proc. 2021, 5, 4. https://doi.org/10.3390/engproc2021005004
Sainaghi R, Baggio R. Airbnb Host Scaling, Seasonal Patterns, and Competition. Engineering Proceedings. 2021; 5(1):4. https://doi.org/10.3390/engproc2021005004
Chicago/Turabian StyleSainaghi, Ruggero, and Rodolfo Baggio. 2021. "Airbnb Host Scaling, Seasonal Patterns, and Competition" Engineering Proceedings 5, no. 1: 4. https://doi.org/10.3390/engproc2021005004
APA StyleSainaghi, R., & Baggio, R. (2021). Airbnb Host Scaling, Seasonal Patterns, and Competition. Engineering Proceedings, 5(1), 4. https://doi.org/10.3390/engproc2021005004