1. Introduction
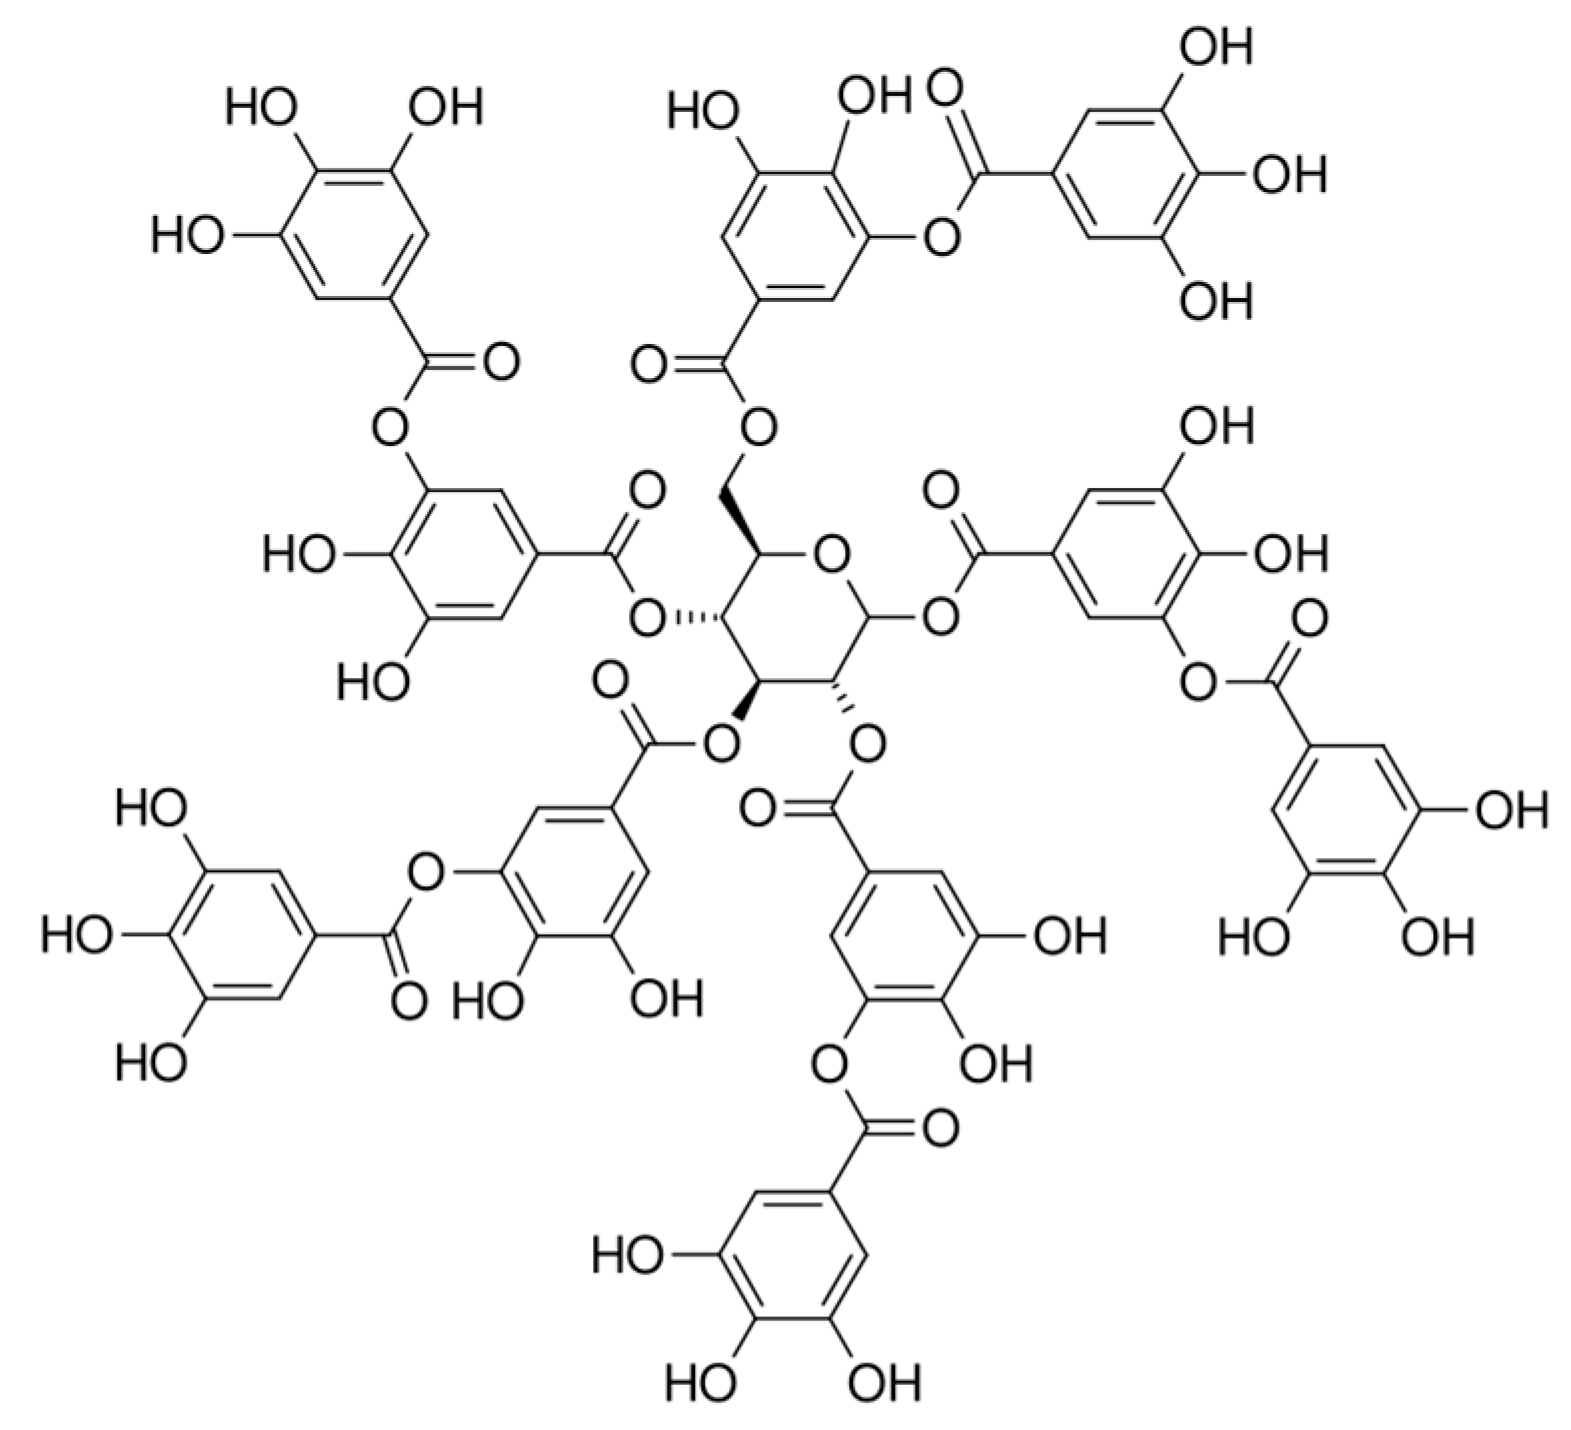
Tannins are a class of natural phenolic antioxidants represented by oligomers and polymers. Tannic acid or gallotannin (TA) (
Figure 1) is one of the most typical compounds widely distributed in plants [
1]. It has a wide application area in food technology [
2,
3] and as a part of traditional herbal medicine in the treatment of various diseases [
4,
5,
6]. TA is one of the standards used in medicinal plant quality control for plants rich in tannins. Therefore, the development of sensitive and simple methods for TA quantification is of practical interest.
The presence of phenolic moieties in the TA structure makes it electroactive and able to be measured using voltammetry. Nevertheless, a lack of electrochemical methods has been reported for TA determination compared to other natural phenolics. Traditional carbon-based [
7,
8] and platinum [
9] electrodes show low sensitivity and selectivity of TA response, which are the main limitations of their practical application. Various chemically modified electrodes have been developed to date to solve this problem. Carbon nanomaterials [
10,
11,
12,
13], porous nanomaterials [
14,
15,
16], metal nanoparticles [
17,
18], electrodeposited nickel(II) hexacyanoferrate [
19], polymeric coverages [
20,
21], and 1-benzoyl-3-(pyrrolidine) thiourea film [
22] have been shown to be effective electrode surface modifiers for TA quantification. In most cases, adsorptive preconcentration for 2.5–5 min is used to improve the analytical characteristics of TA. This step increases the measurement duration and can lead to the co-adsorption of other components from the real samples. Furthermore, the analytical characteristics of the existing methods are not impressive (the linear ranges cover mainly µM concentrations with the detection limits of
n × 10
–7 M).
The current work is focused on the development of a fast and sensitive voltammetric approach for TA determination using glassy carbon electrode modified with multi-walled carbon nanotubes (GCE/MWCNTs) and its application in medicinal plant analysis.
2. Materials and Methods
TA (ACS reagent grade) from Sigma-Aldrich (Saint Louis, MO, USA), 99% gallic and 99% ascorbic acids, 98% quercetin dihydrate from Sigma (Steinheim, Germany), and 97% rutin trihydrate from Alfa Aesar (Heysham, UK) were used. Their standard 10 mM (1.0 mM for rutin) solutions were prepared in ethanol (rectificate). Exact dilution was used for the preparation of less concentrated solutions.
MWCNTs (o.d. 40–60 nm, i.d. 5–10 nm, and l = 0.5–500 μm) from Sigma-Aldrich (Steinheim, Germany) were applied as the electrode surface modifier. Sodium lauryl sulfate (97.2% purity) from Panreac (Barcelona, Spain) was used as the dispersive agent for MWCNTs. A homogeneous suspension of MWCNTs in 1% sodium lauryl sulfate (0.5 mg mL−1) was prepared through sonication for 30 min in an ultrasonic bath (WiseClean WUC-A03H) (DAIHAN Scientific Co., Ltd., Wonju-si, Republic of Korea).
Commercial medicinal plant materials (
Quercus sp. cortex,
Bergenia crassifolia (L.) Fritsch rhizomata,
Potentilla erecta (L.) Raeusch. rhizomata,
Alnus incana (L.) Moench and
Alnus glutinosa (L.) Gaertn. fructus,
Sanguisorba officinalis L. rhizomata et radices) were studied. Infusions and decoctions were prepared using a standard pharmacopoeia procedure [
23].
Other reagents were c.p. grade and used as received. Distilled water was used for the supporting electrolyte preparation. The laboratory temperature was 25 ± 2 °C.
Electrochemical measurements were conducted on the potentiostats/galvanostats µAutolab Type III (Eco Chemie B.V., Utrecht, The Netherlands) with Nova 1.7.8 software and Autolab PGSTAT 302N with the FRA 32M module (Metrohm Autolab B.V., Utrecht, The Netherlands) and NOVA 1.10.1.9 software. A glassy electrochemical cell of 10 mL with a three-electrode system (working GCE of ø = 3 mm (CH Instruments, Inc., Bee Cave, TX, USA) or an MWCNT-modified GCE, an Ag/AgCl reference electrode, and a platinum wire as the auxiliary electrode) was used.
An “Expert-001” pH meter (Econix-Expert Ltd., Moscow, Russia) with a glassy electrode was used for the pH measurements.
The ferric reducing power of the decoctions and infusions was measured through coulometric titration with electrogenerated ferricyanide ions [
24] using a coulometric analyzer “Exper-006” (Econix-Expert, Moscow, Russia) with four platinum electrodes (two of them as working and auxiliary electrodes in the generating circuit and another two polarized needle electrodes in the indicator circuit).
3. Results and Discussion
3.1. Electrooxidation of TA
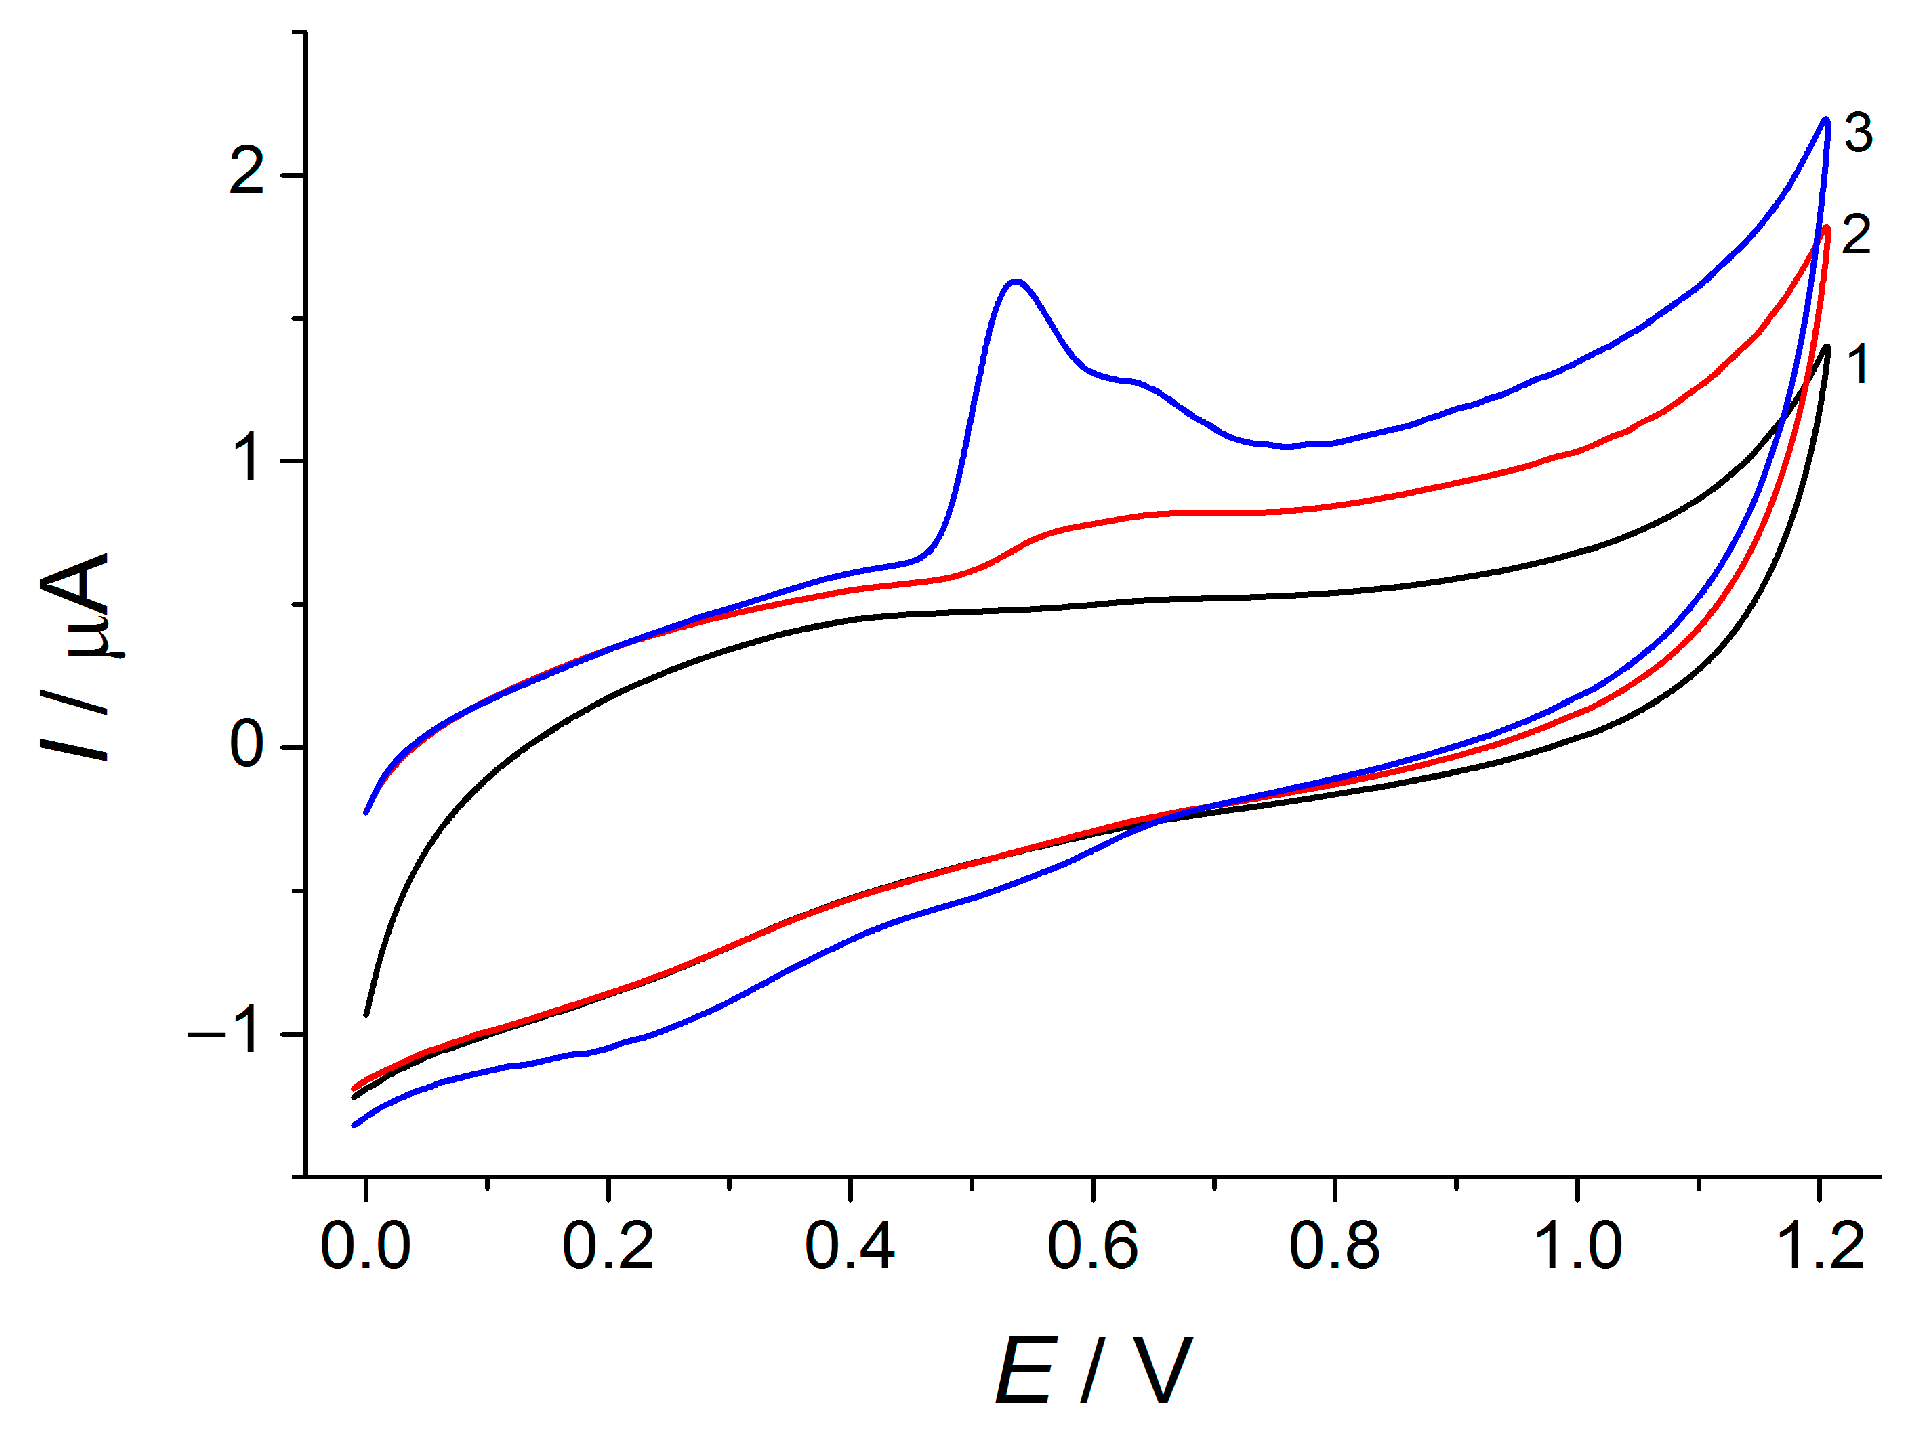
The voltammetric characteristics of TA at the bare GCEs and GCE/MWCNTs have been studied using cyclic voltammetry in Britton–Robinson buffer pH 2.0 (
Figure 2). Electrode surface modification provides a significant improvement in the voltammogram shape due to the 20.3-fold increase in the oxidation currents. Such an effect can be explained by the increase in the electroactive surface area of GCE/MWCNTs (75 ± 2 vs. 8.9 ± 0.3 mm
2 for bare GCE on the basis of electrochemical data for 1.0 mM ferrocyanide ions oxidation) as well as the preconcentration of TA on the electrode surface. The last assumption has been confirmed using cyclic voltammetry data for a study of the potential scan rate effect.
A 30 mV cathodic shift in the TA oxidation potential has been observed at the GCE/MWCNTs, which is caused by the electrocatalytic effect of the MWCNTs leading to the higher electron transfer rate at the modified electrode (5.23 × 10⁻⁵ and 3.11 × 10⁻⁴ cm s–1/c for bare and modified GCEs, respectively, as the electrochemical impedance spectroscopy data show).
TA electrooxidation is accompanied by proton transfer since the oxidation potentials in both steps are shifted to a lower value with the pH increase from 2.0 to 7.0. An equal number of electrons and protons participate in the electrode reaction. The voltammetric response of TA is decreased with the increase in the pH value and fully disappears in basic medium due to the oxidation with air oxygen. Therefore, Britton–Robinson buffer pH 2.0 has been used in further study.
The linear plot
Ip vs. potential scan rate and slope of 1.08 for ln
Ip vs. lnυ indicate a surface-controlled electrode reaction. The number of electrons has been calculated using the Laviron equation to be two. Thus, TA electrooxidation is an irreversible two-electron and two-proton process, which is in good agreement with results reported previously [
16,
17].
3.2. TA Quantification
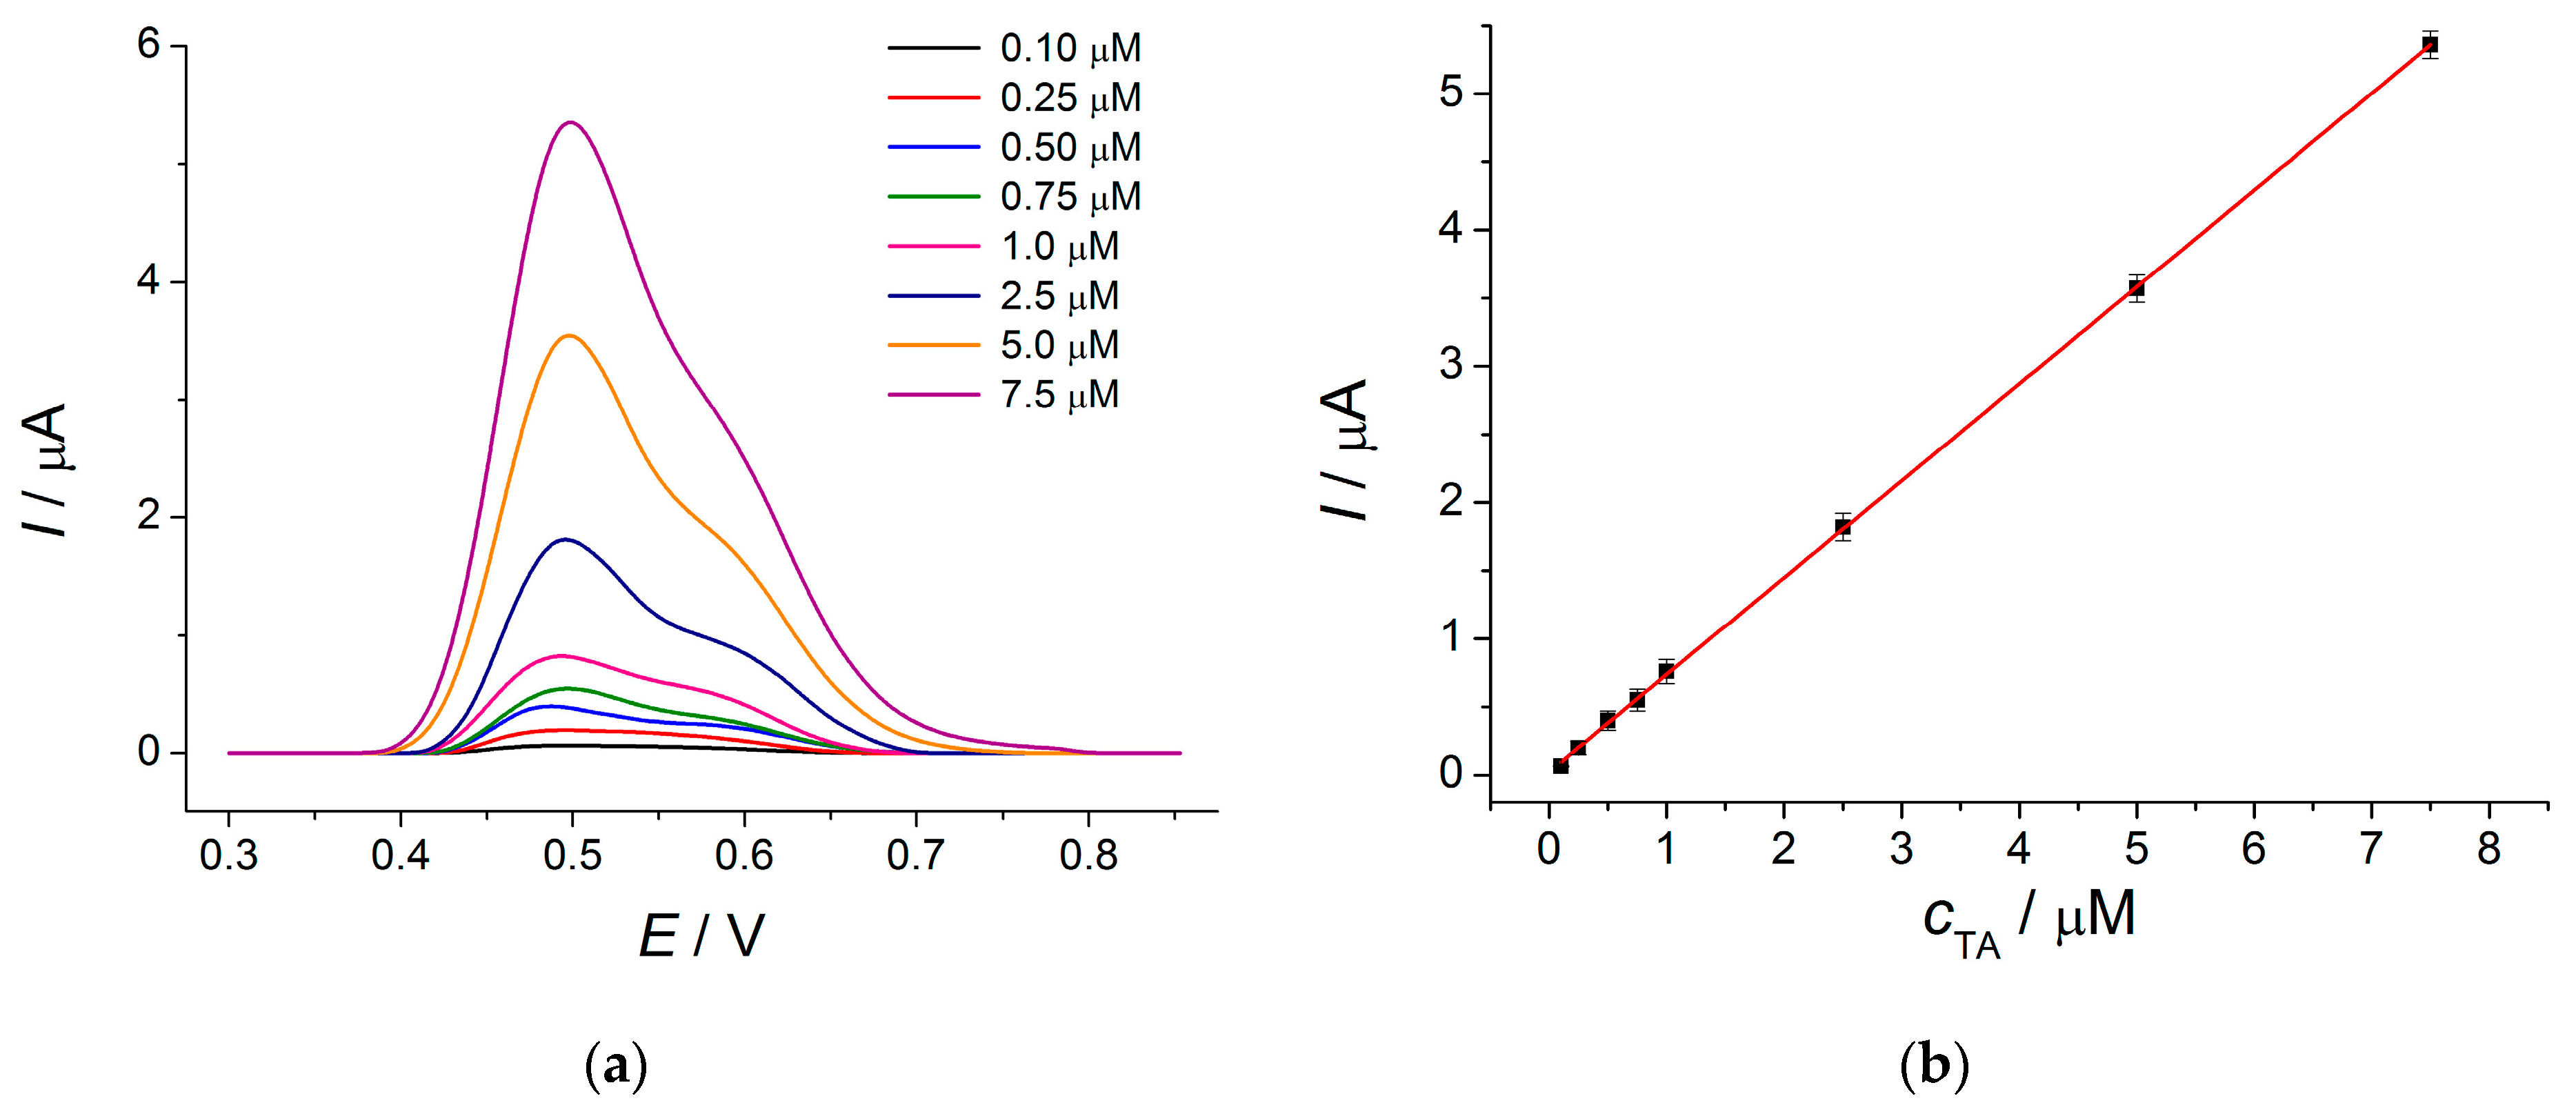
TA determination has been performed in differential pulse mode using a modulation amplitude of 75 mV and modulation time of 50 ms, providing the highest oxidation currents of the analyte. The oxidation peak at 0.49 V and a shoulder at 0.58–0.60 V are clearly pronounced on the differential pulse voltammograms of TA (
Figure 3a).
TA oxidation currents are linearly increased with the concentration in the range of 0.10–7.5 µM (
Figure 3b). The detection limit of 0.038 μM has been obtained. These analytical characteristics are improved compared to those reported for the electrodes also modified with MWCNTs in [
10,
12,
13]. Moreover, the absence of a preconcentration step in the current work makes the procedure faster and more accurate as far as the co-adsorption of coexisting components is excluded.
The method developed shows a high accuracy of TA determination (recovery for model systems is 98.5–100%) and reproducibility (RSD for five measurements each on the new electrode is less than 2.0%).
3.3. Real Samples Analysis
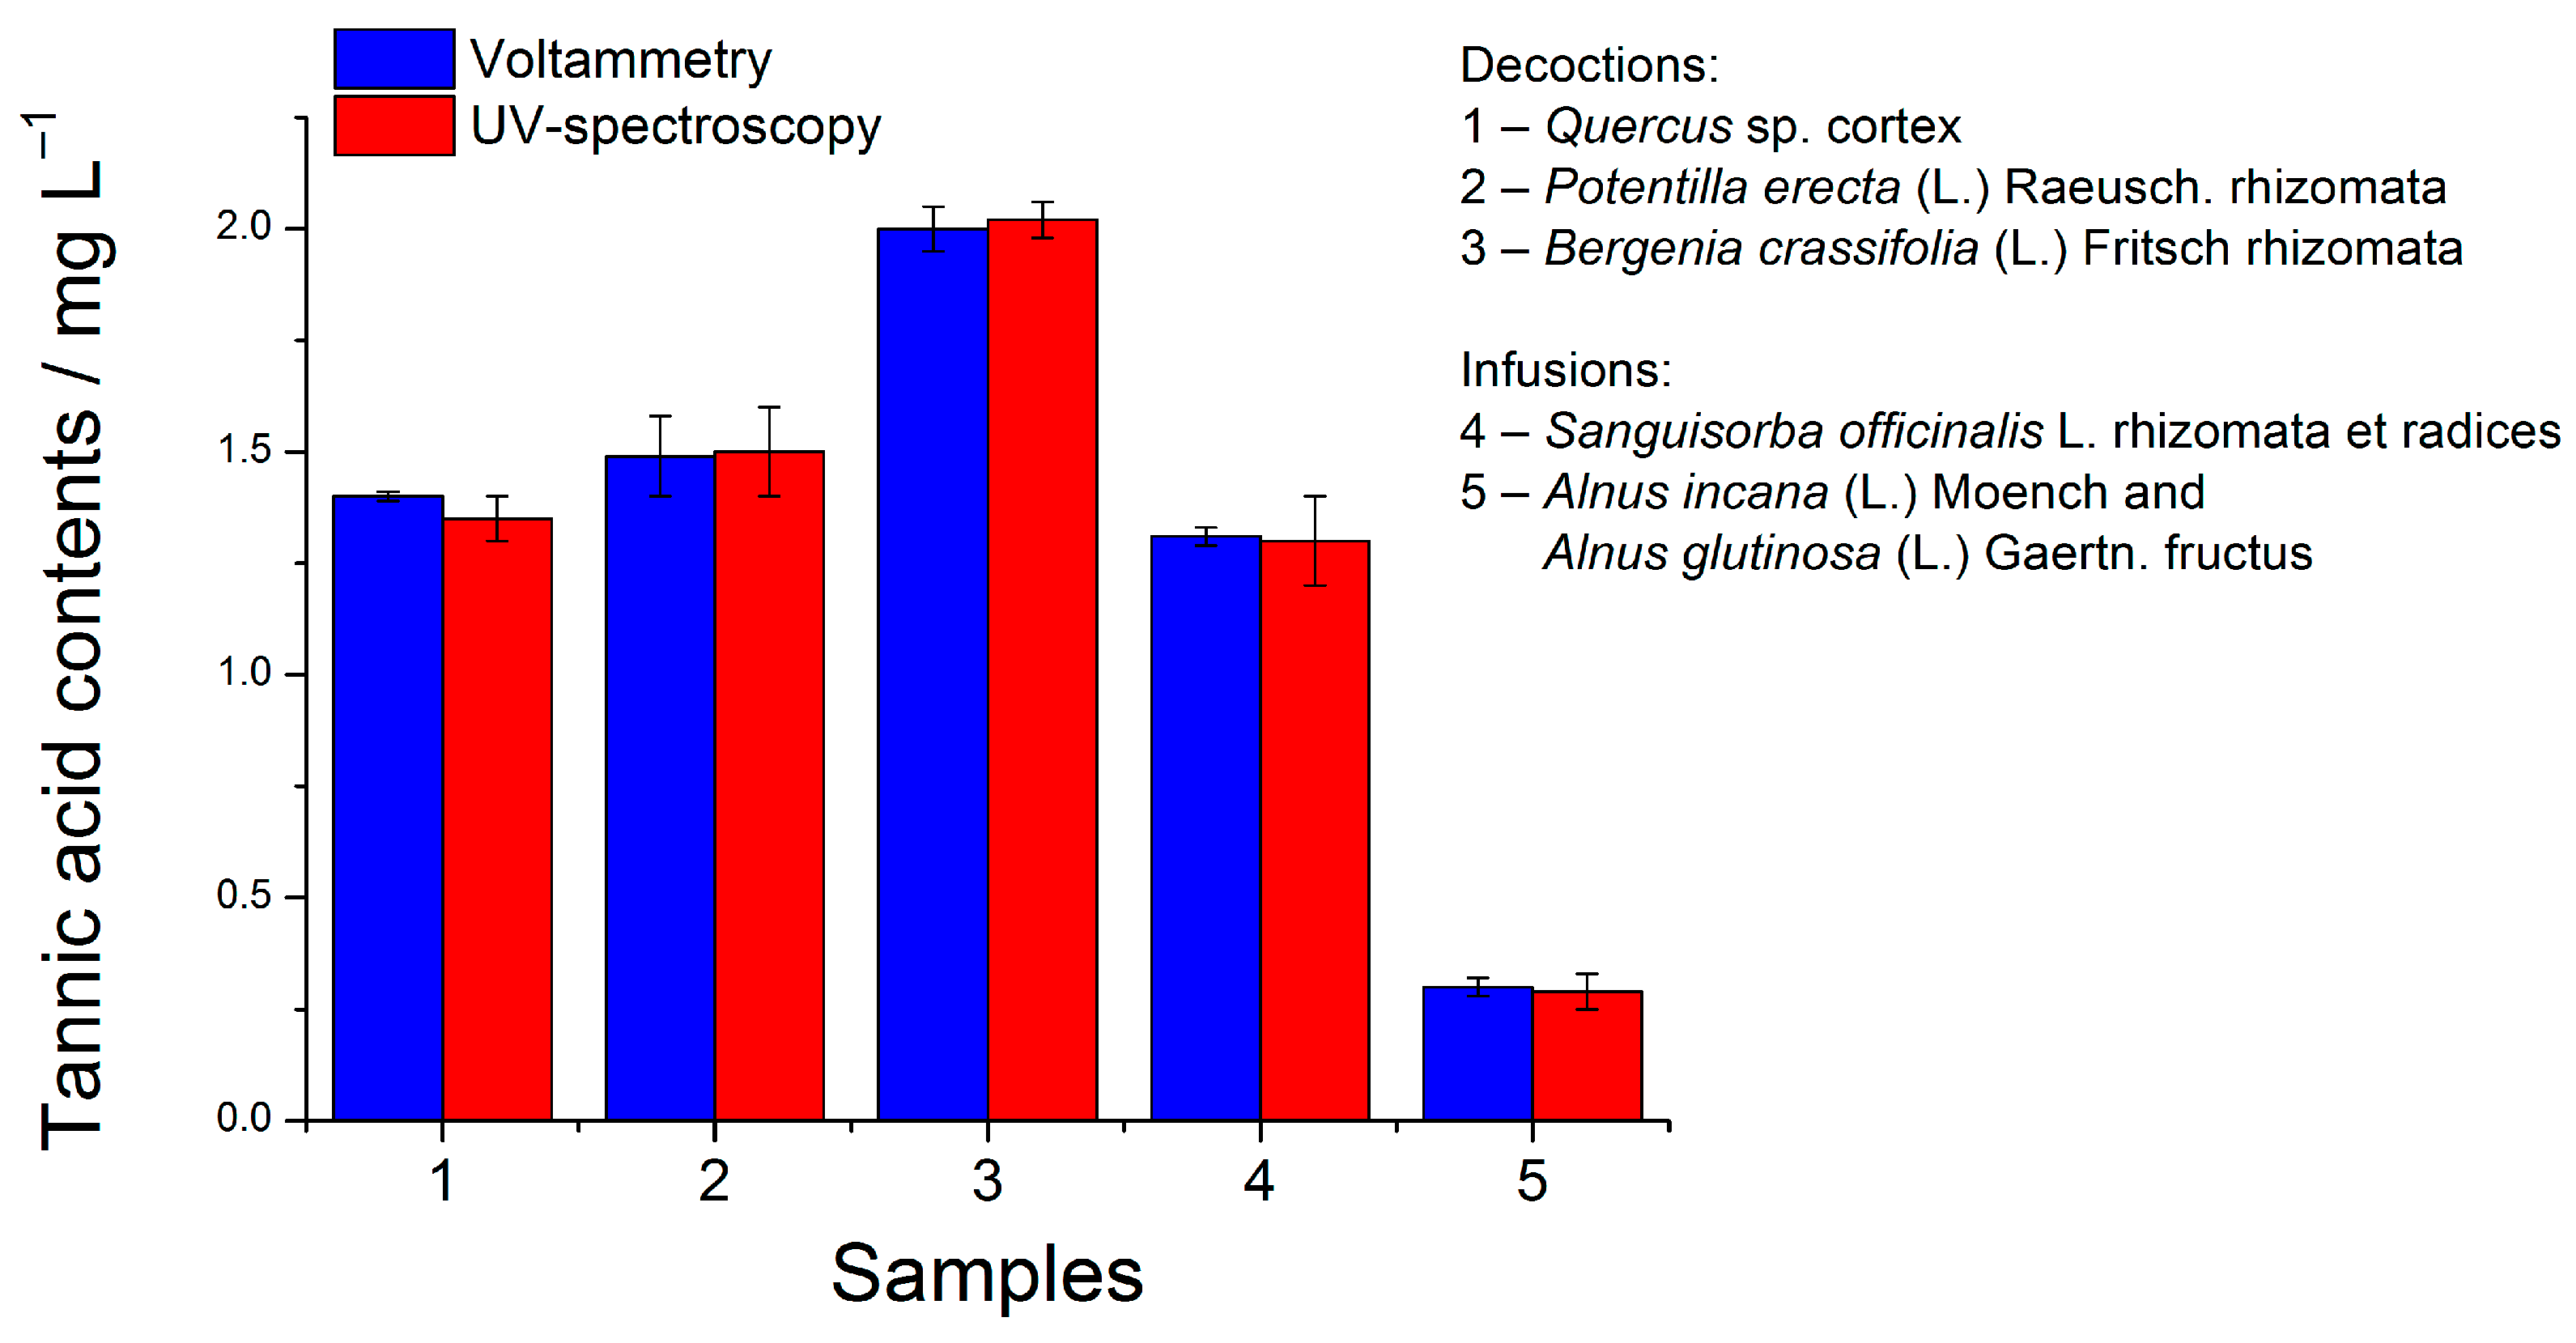
The approach has been successfully applied in the analysis of infusions and decoctions of tannin-containing medicinal plant materials (Quercus sp. cortex, Bergenia crassifolia (L.) Fritsch rhizomata, Potentilla erecta (L.) Raeusch. rhizomata, Alnus incana (L.) Moench and Alnus glutinosa (L.) Gaertn. fructus, Sanguisorba officinalis L. rhizomata et radices). A well-defined oxidation step at 0.48–0.49 V and a shoulder at 0.58–0.60 V have been observed for all samples. The signal corresponds to TA, as a standard addition method indicates. The absence of matrix effects is confirmed by the recovery of 96.1–101%.
The results for the TA contents in medicinal plant infusions and decoctions are presented in
Figure 4. The voltammetric method has been validated with UV-spectroscopy [
25] and a good agreement of the results has been obtained.
A positive correlation (r = 0.8098) of TA contents in medicinal plant infusions and decoctions with ferric reducing power has been observed. Ferric reducing power reflects the total content of phenolic compounds in the sample.
4. Conclusions
Thus, a novel voltammetric approach has been developed for direct TA quantification using GCE/MWCNTs. The procedure is simple and fast, needs a low sample volume (5 µL), and excludes additional reagent consumption. The method developed can be applied for the analysis and standardization of tannin-containing medicinal plants.
Author Contributions
Conceptualization, G.Z.; methodology, G.Z.; validation, G.Z. and M.I.; investigation, M.I.; writing—original draft preparation, G.Z.; writing—review and editing, G.Z.; visualization, G.Z. and M.I.; supervision, G.Z. All authors have read and agreed to the published version of the manuscript.
Funding
This research received no external funding.
Institutional Review Board Statement
Not applicable.
Informed Consent Statement
Not applicable.
Data Availability Statement
The data presented in this study are available upon request from the corresponding author.
Conflicts of Interest
The authors declare no conflict of interest.
References
- Ziyatdinova, G.; Budnikov, H. Natural phenolic antioxidants in bioanalytical chemistry: State of the art and prospects of development. Russ. Chem. Rev. 2015, 84, 194–224. [Google Scholar] [CrossRef]
- Joint FAO/WHO Expert Committee on Food Additives. Tannic acid. In Compendium of Food Additive Specifications: Addendum 1; FAO: Rome, Italy, 1992; pp. 117–122. [Google Scholar]
- Alasalvar, C.; Pelvan, E.; Özdemir, A.S.; Kocadagili, T.; Mogol, B.A.; Pasli, A.A.; Özcan, N.; Özçelik, B.; Gökman, B. Compositional, nutritional, and functional characteristics of instant teas produced from low- and high-quality black teas. J. Agric. Food Chem. 2013, 61, 7529–7536. [Google Scholar] [CrossRef] [PubMed]
- Chokotho, L.; van Hasselt, E. The use of tannins in the local treatment of burn wounds—A pilot study. Malawi Med. J. 2005, 17, 19–20. [Google Scholar] [CrossRef] [PubMed]
- Ren, A.; Zhang, W.; Thomas, H.G.; Barish, A.; Berry, S.; Kiel, J.S.; Naren, A.P. A tannic acid-based medical food, Cesinex®, exhibits broad-spectrum antidiarrheal properties: A mechanistic and clinical study. Dig. Dis. Sci. 2012, 57, 99–108. [Google Scholar] [CrossRef]
- Souza, S.M.C.; Aquino, L.C.M.; Milach, A.C., Jr.; Bandeira, M.A.M.; Nobre, M.E.P.; Viana, G.S.B. Antiinflammatory and antiulcer properties of tannins from Myracrodruon urundeuva Allemão (Anacardiaceae) in rodents. Phytother. Res. 2007, 21, 220–225. [Google Scholar] [CrossRef]
- Vu, D.L.; Ertek, B.; Dilgin, Y.; Červenka, L. Voltammetric determination of tannic acid in beverages using pencil graphite electrode. Czech J. Food Sci. 2015, 33, 72–76. [Google Scholar] [CrossRef]
- Palisoc, S.T.; Cansino, E.J.F.; Dy, I.M.O.; Razal, C.F.A.; Reyes, K.C.N.; Racines, L.R.; Natividad, M.T. Electrochemical determination of tannic acid using graphite electrodes sourced from waste zinc-carbon batteries. Sens. Bio-Sens. Res. 2020, 28, 100326. [Google Scholar] [CrossRef]
- Hung, Y.-T.; Chen, P.-C.; Chen, R.L.C.; Cheng, T.-J. Determining the levels of tannin in tea by amperometry of ferricyanide pre-reaction with a sample in a flow-injection system. Sens. Actuators B Chem. 2008, 130, 125–140. [Google Scholar] [CrossRef]
- Ziyatdinova, G.K.; Nizamova, A.M.; Aytuganova, I.I.; Budnikov, H.C. Voltammetric evaluation of the antioxidant capacity of tea on electrodes modified with multi-walled carbon nanotubes. J. Anal. Chem. 2013, 68, 132–139. [Google Scholar] [CrossRef]
- Wan, H.; Zou, Q.; Yan, R.; Zhao, F.; Zeng, B. Electrochemistry and voltammetric determination of tannic acid on a single-wall carbon nanotube-coated glassy carbon electrode. Microchim. Acta 2007, 159, 109–115. [Google Scholar] [CrossRef]
- Ghoreishi, S.M.; Behpour, M.; Khayatkashani, M.; Motaghedifard, M.H. New applied method for simultaneous determination of ellagic and tannic acid by multi-wall carbon nanotube paste electrode: Application in quantification Punica granatum and Quercus infectoria. Dig. J. Nanomater. Biostruct. 2011, 6, 625–635. [Google Scholar]
- Lü, S. Electrochemical determination of tannins using multiwall carbon nanotubes modified glassy carbon electrode. Russ. J. Electrochem. 2004, 40, 750–754. [Google Scholar] [CrossRef]
- Xu, L.; He, N.; Du, J.; Deng, Y.; Li, Z.; Wang, T. A detailed investigation for determination of tannic acid by anodic stripping voltammetry using porous electrochemical sensor. Anal. Chim. Acta 2009, 634, 49–53. [Google Scholar] [CrossRef]
- Xu, L.; He, N.; Du, J.; Deng, Y. Determination of tannic acid by adsorptive anodic stripping voltammetry at porous pseudo-carbon paste electrode. Electrochem. Commun. 2008, 10, 1657–1660. [Google Scholar] [CrossRef]
- Sinha, A.; Huang, Y.; Dhanjai; Ma, K.; Zhao, H. Electrochemical oxidation of tannic acid at ZIF-8 induced nitrogen doped porous carbon nanoframework modified electrode. J. Electrochem. Soc. 2018, 165, H1004–H1011. [Google Scholar] [CrossRef]
- Ademe, M.; Kitte, S.A.; Sisay, G.; Diro, A. Bismuth film modified glassy carbon electrode for determination of tannic acid. Anal. Bioanal. Chem. Res. 2020, 7, 497–508. [Google Scholar]
- Raj, M.A.; Revin, S.B.; John, S.A. Synthesis, characterization and modification of functionalized pyrimidine stabilized gold nanoparticles on ITO electrode for the determination of tannic acid. Bioelectrochemistry 2013, 89, 1–10. [Google Scholar] [CrossRef]
- Tsai, T.-H.; Yeh, P.-C.; Chen, S.-M.; Ali, M.A.; Al-Hemaid, F.M.A. Effect of electrostatic interaction on electrodeposition of nickel hexacyanoferrate with functional MWCNTs and their application for the determination of persulfate and tannic acid. Electroanalysis 2014, 26, 971–979. [Google Scholar]
- Piovesan, J.V.; Santana, E.R.; Spinelli, A. A carbon paste electrode improved with poly(ethylene glycol) for tannic acid surveillance in beer samples. Food Chem. 2020, 326, 127055. [Google Scholar] [CrossRef]
- Moulick, M.; Das, D.; Nag, S.; Tudu, B.; Bandyopadhyay, R.; Roy, R.B. Molecularly imprinted polymer-based electrode for tannic acid detection in black tea. IEEE Sens. J. 2023, 23, 5535–5542. [Google Scholar] [CrossRef]
- Yılmaz, Ü.T.; Çalık, E.; Uzun, D.; Karipcin, F.; Yılmaz, H. Selective and sensitive determination of tannic acid using a 1-benzoyl-3-(pyrrolidine) thiourea film modified glassy carbon electrode. J. Electroanal. Chem. 2016, 776, 1–8. [Google Scholar] [CrossRef]
- Pharmaceutical and Medical Device Regulatory Science Society of Japan. Japanese Pharmacopoeia XVI; Pharmaceutical and Medical Device Regulatory Science Society of Japan: Tokyo, Japan, 2011; 2026p. [Google Scholar]
- Ziyatdinova, G.; Budnikov, H. Analytical capabilities of coulometric sensor systems in the antioxidants analysis. Chemosensors 2021, 9, 91. [Google Scholar] [CrossRef]
- Directorate of the Council of Europe. Tannins in herbal drugs. In European Pharmacopoeia 11.0; EDQM, Directorate of the Council of Europe: Strasbourg, France, 2023; p. 326. [Google Scholar]
| Disclaimer/Publisher’s Note: The statements, opinions and data contained in all publications are solely those of the individual author(s) and contributor(s) and not of MDPI and/or the editor(s). MDPI and/or the editor(s) disclaim responsibility for any injury to people or property resulting from any ideas, methods, instructions or products referred to in the content. |
© 2023 by the authors. Licensee MDPI, Basel, Switzerland. This article is an open access article distributed under the terms and conditions of the Creative Commons Attribution (CC BY) license (https://creativecommons.org/licenses/by/4.0/).


