Proceeding Paper

The Photometric Determination of Iron(III) with 2-Napthylcarboxymethylene Citrate †

by
Ruzimurod Sattorovich Jurayev
1,*,
Azimjon Uralovich Choriev
2 and
Navruz Toyirovich Qaxxorov
1
1
Department of “Chemical Engineering and Quality Management”, Shakhrisabz Branch of Tashkent Institute of Chemical Technology, 20, Shahrisabz Str., Shakhrisabz 181306, Uzbekistan
2
Department of “Organic chemistry”, Karshi State University, 17, Kuchabog Str., Karshi 180103, Uzbekistan
*
Author to whom correspondence should be addressed.
Presented at the 2nd International Electronic Conference on Chemical Sensors and Analytical Chemistry, 16–30 September 2023; Available online: https://csac2023.sciforum.net/.
Eng. Proc. 2023, 48(1), 49; https://doi.org/10.3390/CSAC2023-14878
Published: 18 September 2023

Abstract

:
The most prevalent element in nature is iron, which is also one of the essential, active macroelements. Today, photometric techniques are frequently employed to identify harmful and extremely poisonous heavy metals. Due to its sensitivity, simplicity, and short analysis time, this approach is extremely important. The technique of photometrically determining Fe(III) was devised, and the ideal conditions for the formation of a complex of Fe(III) with 2-napthylcarboxymethylne citrate reagent were explored. The following steps were taken during the photometric determination of Fe (III) using 2-napthylcarboxymethylcitrate: the selection of a light filter, the dependence of complex formation on environmental acidity, dependence on the composition of the buffer solution, dependence on the composition of the reagent, the field of obedience to Ber’s law, the ratio of the component moles of the complex, the Sendal sensitivity, the lowest detection limit of Fe(III), the molar extinction coefficient, and the technique of photometrically determining Fe(III).

1. Introduction

A literature review shows that many organic reagents have been proposed for the determination of iron and other metals, but only a few are highly sensitive and selective. Essentially, the sensitive ones have low selectivity, and the selective ones have low sensitivity. Therefore, the development of new detection methods for iron detection with high sensitivity and selectivity is an urgent problem and the main goal of our scientific research [1,2].
Currently, photometric and spectrophotometric methods are widely used to determine the amount of a substance. In this work, the works of the photometric and spectrophotometric determination of iron(III) are considered.
Photometric methods are widely used in the determination of iron, as well as small amounts of various metals. The advantage of this method is that it is very simple and fast.
This method is widely used to determine the reaction of iron ions in organic reagents. Usually, for the reaction, colored compounds of cationic and anionic ions of iron in solution enter into salt-forming and complex-forming reactions.
Not all organic reagents used for the photometric determination of iron have selectivity. Therefore, it is very important to create reagents with high selectivity and analytical ability [1].
Complex compounds of metals with hydroxy acids are of considerable interest for various fields of chemistry and chemical technology. Various hydroxy acids are able to form such complex compounds with more than 60 elements of the periodic system. At present, the study of the properties of this group of compounds is still far from complete. Nevertheless, there is already enough experimental material for some generalizations about the regularities of the complex formation process. In this article, only the complex compounds of the hydroxy acids of the fatty series are considered. The most typical and widespread representative of such hydroxy acids is tartaric acid; therefore, the main attention is paid to metal tartrate complexes. In some cases, in order to elucidate the influence of the structure of hydroxy acids on the chemical properties of complex compounds, the literature data on the complexes of citric, trihydroxyglutaric, and some other hydroxy acids are also used.
Even in the last century, it was noticed that the cations of many heavy metals in the presence of tartaric acid lost the ability to precipitate with an alkali in the form of insoluble hydroxides and changed other characteristic analytical properties. Qualitative studies have shown the connection of these phenomena with the hydroxy groups of tartaric acid.
It turned out, in addition, that other organic substances containing hydroxy groups also exhibited a similar masking effect; however, the replacement of hydroxy groups with basic or acidic residues, such as HS~, CN~, -NH2, Cl~, etc., led to a significant loss of complexing ability. Thus, the special role of hydroxy groups in the process of complex formation was elucidated.
Photometric and spectrophotometric methods, mainly the formation of colored compounds that absorb light in the visible region of the spectrum, are not very specific to fatty hydroxy acids. Photometric measurements were used to study copper, vanadium, chromium, uranium, iron, cobalt, nickel tartrate, and nitrate complexes. These works in some cases made it possible not only to determine the composition of complex compounds in solutions, but also to determine the corresponding values of instability constants [3].
Typically, the optical density of a series of solutions with a constant concentration of the central ion and a variable concentration of the hydroxy acid is measured to determine the composition of the compound. The isomolar series method was also used. Both of these options were mainly suitable for determining the composition of complexes under conditions where the acidity of the solution was sufficient to prevent the hydrolysis of the metal salt. An auxiliary complexing agent is sometimes added to the solution to prevent hydrolysis at a high pH. As a last resort, for example, sodium salicylate solution was used in the study of tartrate and citrate complexes of iron using the method of isomolar series.
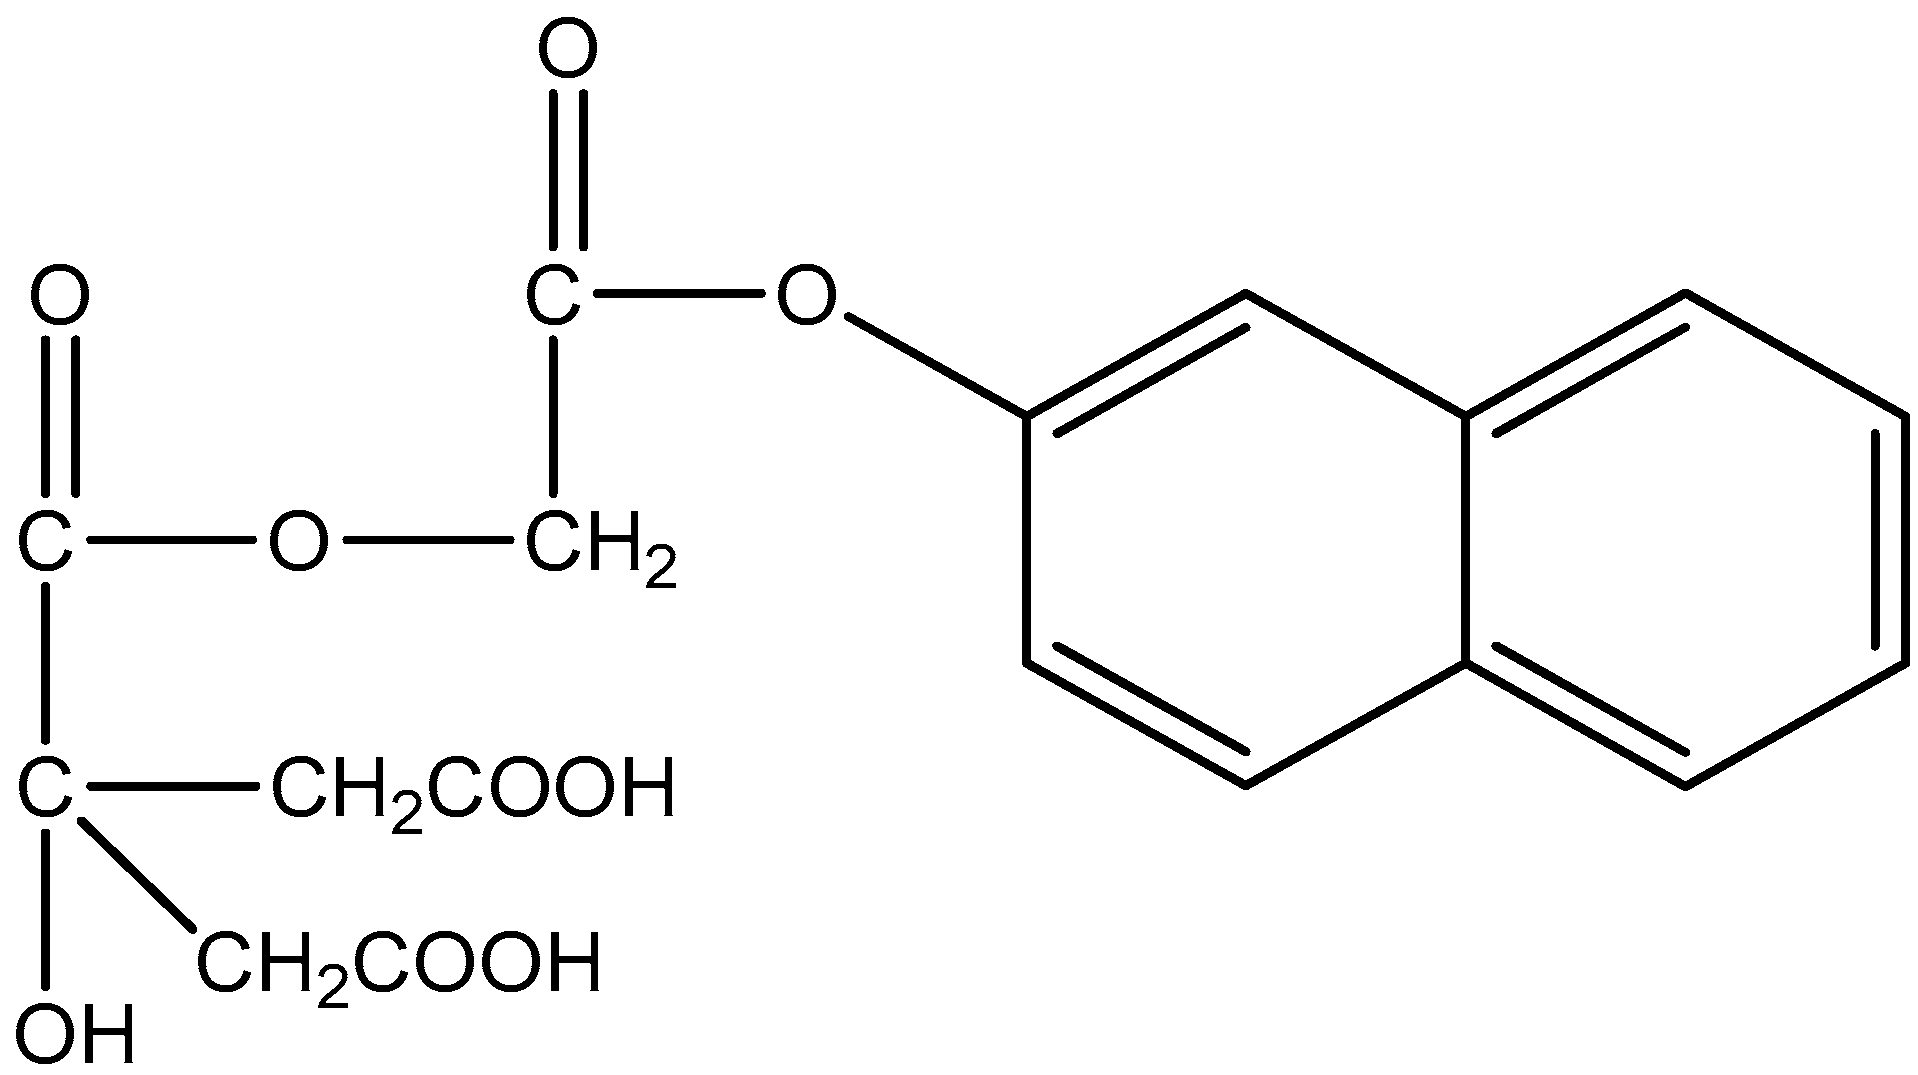
As a result of a review of the literature materials, it became known that compounds containing oxycarbonic acid and aromatic rings have high analytical ability. Taking this into account, in this work, naphthalene-2yl 2-chloroacetate was formed as a result of the reaction of naphthol-2 with chloroacetyl chloride. The resulting naphthalene-2yl 2-chloroacetate was subjected to a nucleophilic exchange reaction with the monopotassium salt of citric acid. As a result of the above processes, the reagent 2-naphthylcarboxymethylene citrate (according to systematic nomenclature it is named as follows: 3-hydroxy-3-((2-naphthalen-2-yloxy)-2-oxoethoxy) pentanedioic acid (ChemOffice12)) was formed, and the analytical capabilities of this substance were used for the purpose of the photometric determination of Fe(III) [4,5].

2. Experiment

2.1. Materials and Measurements

It is known that organic reagents used in analytical chemistry contain electron-donating groups (-CH3; -C2H5; -OH; -OCH3, etc.), and such reagents are very. If they contain electron-accepting groups (-SO3; -NO2; -COOH; CN-; CHO-, etc.), then the description of selective influence is improved. If both electron-donor (ED) and electron-acceptor (EA) groups are introduced into the analytical reagent molecule at the same time, the color of the reagent is clearly visible and the analytical and metrological characteristics of the complex are improved [6,7]. Such reagents increase in sensitivity and selectivity. In this scientific work, when preparing a new 0.1% solution of 2-napthylcarboxymethylene citrate sensitive (Figure 1), 0.1 g was taken from it, put into a 100 mL measuring flask and prepared by dissolving it in distilled water up to the mark.
Initially, a standard solution of iron(III) was prepared as a working solution. For this, Fe2(SO4)3∙6H2O k.t.-branded salt was used. A total of 4.5478 g of the calculated amount of salt was weighed on an analytical balance and put into a 1000 mL measuring flask. A 1 mg/mL (1000 μg/mL) solution was prepared by dissolving it in distilled water. Working solutions were prepared by diluting an aliquot of 1 mg/mL standard solution before each work [8,9].

2.2. Selection of Optimal Conditions for Iron(III) Complexation with 2-Naphthylcarboxymethylene Citrate Reagent

Spectrophotometric determinations are performed under optimal conditions that ensure the complete formation of the analytical form in the solution and no or minimal deviation from the Bouguer–Lambert–Behr law. The most important of them are the optimal value of pH, the sufficient amount of the reagent, the selectivity of the analytical (photometric) reaction, and the most favorable conditions for light absorption.
In order to choose the optimal value of pH, the effect of pH on the intensity of the color of the solution at a certain wavelength was studied when the concentrations of the tested substance and reagent were unchanged. In this case, when the reagent is colorless, the area where the absorbance is the largest is considered. In colored solutions, the most favorable conditions correspond to the largest difference between the absorbances of the analytical form and the starting reagents. Under optimal conditions, small changes in pH have virtually no effect on the absorbance of the solution when the absorbance is at its maximum. Photometrically, the pH of the solution being analyzed is kept constant by using appropriate buffer solutions or sufficient amounts of acid or alkali.
The amount of analytical reagent to be added should be sufficient to convert all of the analyte within a given concentration range into analytical form. Adding more reagent does not increase the yield of the reaction product and does not increase the light absorption of the solution.
In spectrophotometric analysis, the solution must remain completely soluble in the entire range of detectable concentrations. If this condition is not met, it is necessary to use lower concentrations or to use protective substances that prevent the formation of a solid phase. Sometimes it is necessary to change the entire spectrophotometric detection scheme.

2.3. Selection of an Optimal Light Filter for Fe(III) Complexation with 2-Naphthylcarboxymethylene Citrate Reagent

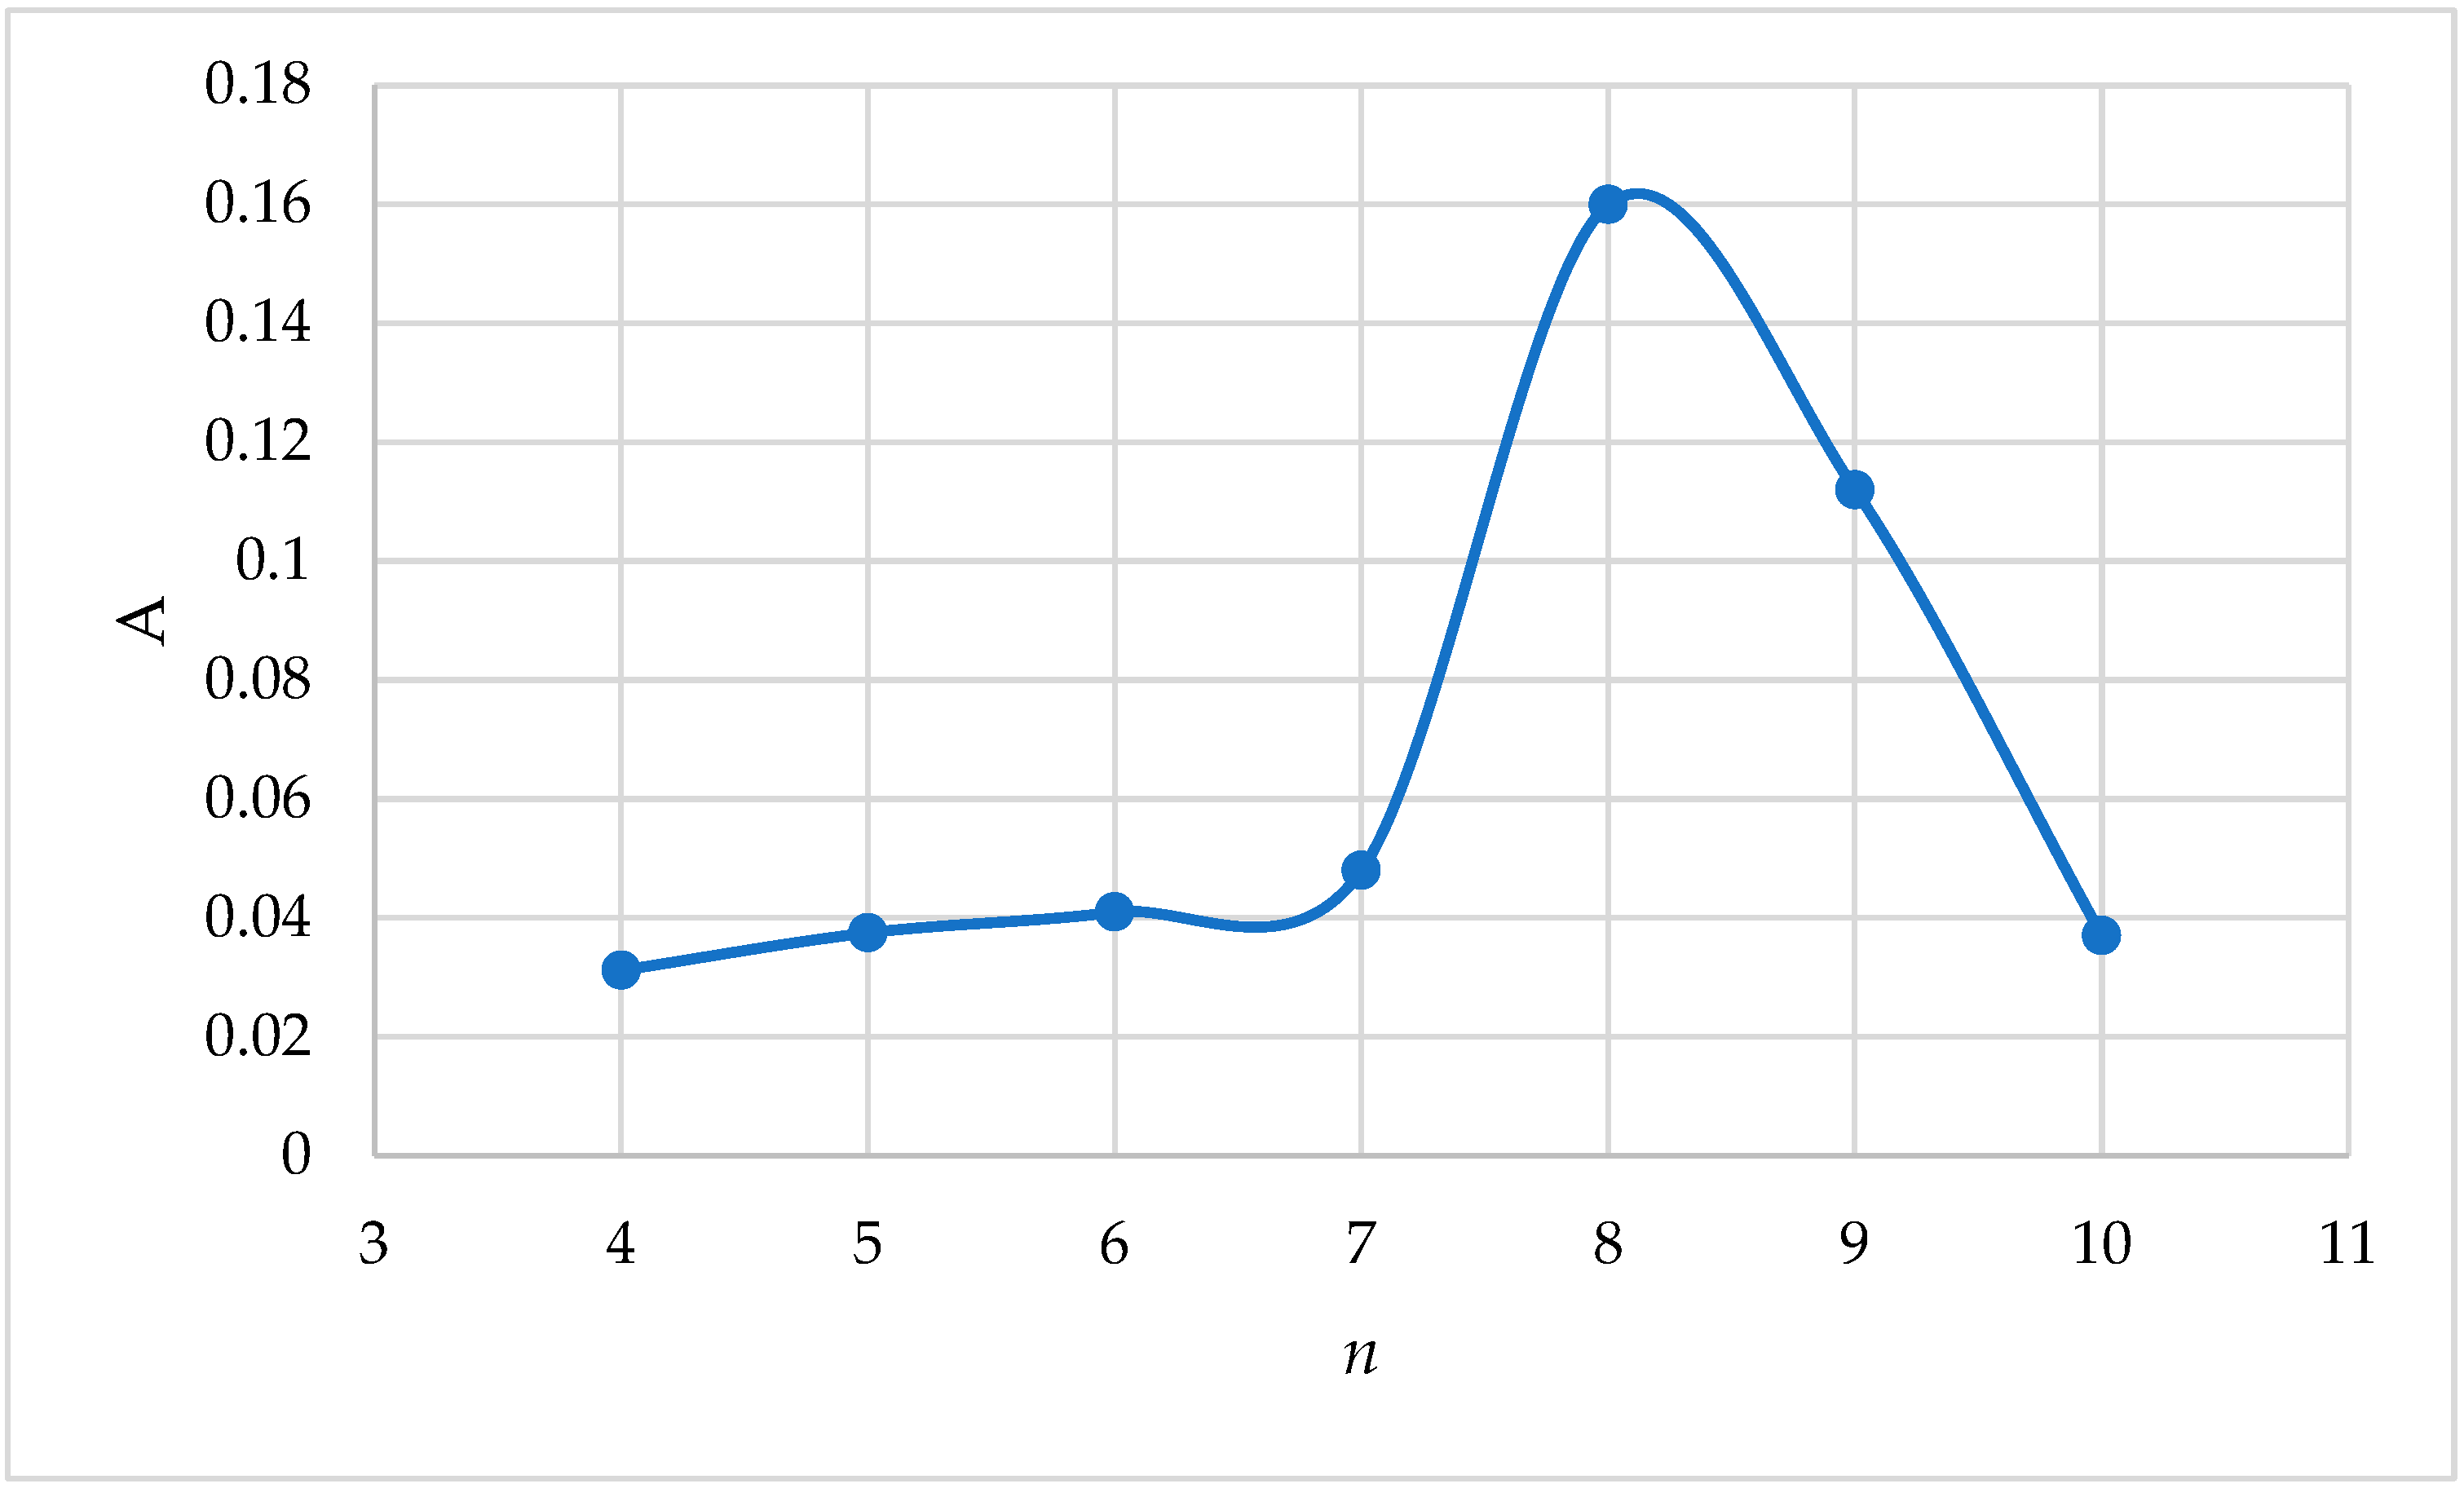
It is known that each substance by its nature absorbs light of a certain wavelength, taking into account that the highest absorption area of the complex of iron(III) with 2-naphthylcarboxymethylene citrate was determined as follows: 5.0 mL of buffer solution, 1.0 mL of 0.1% 2-naphthylcarboxymethylene citrate solution, and 1.0 mL of 20 μg/mL Fe(III) solution were added to a 25 mL volumetric flask and filled with distilled water up to the mark of the flask. The optical density of the resulting complex was measured in a concentration photoelectrocolorimeter CPhC-3 in different light filters with a light absorption thickness of = 3.0 cm. A solution containing all components except iron(III) was used as a reference solution. The measurement results are presented in Table 1, Figure 2.
As can be seen from the obtained results, the complex compound 8-light filter showed high optical density at   λ m a x = 670   n m . Further work was carried out at λ m a x = 670   n m .

2.4. Dependence of the Optical Density Value of the Fe(III) Complex with 2-Naphthylcarboxymethylene Citrate Reagent on Solution Medium (pH)

Taking into account that one of the important conditions for the reaction is its environment, universal buffer solutions with different pH values were prepared for choosing optimal conditions for the complex combination of iron(III) with 2-naphthylcarboxymethylene citrate [10,11,12].
To perform this, add 5.0 mL of a universal buffer solution with a pH of 2.0 to 11.10, 1.0 mL of a 0.1% 2-naphthylcarboxymethylene citrate reagent solution and 20 μg/mL of Fe(III) to a 25 mL volumetric flask. The solution was added to 1.0 mL and the flask was filled with distilled water up to the mark. The optical densities of complex compound solutions were measured in CPhC-3 cuvette at λ m a x = 670   n m and absorption thickness l = 3.0   c m . Table 2 shows the obtained results.
As can be seen from Table 2, the highest optical density of the complex compound was observed in the range of pH = 10.55–12.0, and pH = 11.80 was chosen as the optimal environment because the optical density at this pH has the maximum analytical signal. A buffer solution with a pH of 11.80 was used in further research.

2.5. Dependence of the Optical Density of the Complex Compound on the Composition of the Buffer Solution

Universal and sodium citrate buffer solutions with pH=11.80 were prepared to study the dependence of buffer solution composition on the components of the main reaction (Fe3++2-napthylcarboxymethylene citrate).
For the preparation of photometric solutions, add 5.0 mL of various buffer solutions with pH = 11.80, 1.0 mL of 0.1% aqueous solution of 2-naphthylcarboxymethylene citrate and 1.0 mL of 20 μg/mL Fe(III) solution and fill the flask up to the mark with distilled water. Optical densities were measured against the reference solution in CPhC-3, l = 3.0   c m cuvette. The obtained results are presented in Table 3.
As can be seen from the obtained experimental results, when the universal buffer solution was used, the complex compound solution had the maximum optical density. A universal buffer solution with pH = 11.80 was used in further research.

2.6. Study of the Stability of the Fe(III) Complex with 2-Naphthylcarboxymethylene Citrate Reagent over Time

To determine the stability of the complex, the stability of the optical density of the solution with respect to time was studied.
Add 5.0 mL of universal buffer solution (pH = 11.80), 1.0 mL of 0.1% 2-naphthylcarboxymethylene citrate reagent and 1.0 mL of 20 μg/mL Fe(III) solution to a 25 mL volumetric flask. The flask was filled to the mark with distilled water. The optical density of the resulting complex was measured against a reference solution at certain time intervals. The obtained results are presented in Table 4.
The experimental results (Table 4) show that the optical density value of the complex compound did not change much for 2 h, and then a slight decrease was observed. It can be concluded that this time interval is sufficient to perform the analysis.

2.7. Study of the Pouring Order of the Structural Components of the Complex Compound (FeR)

Taking into account that the yield of the reaction also depends on the order of pouring the components, the solutions were prepared using the above-mentioned method, and several experiments were carried out by changing the pouring order of the components. The measurement results are presented in Table 5.
It can be concluded from the obtained results that the pouring order of components is quite important. In further research work, the 9th casting order was chosen. Carrying out the reaction in this order ensured that the complex exhibited maximum optical density.

2.8. Dependence of the Optical Density of the Complex Compound on the Amount of Added Reagent

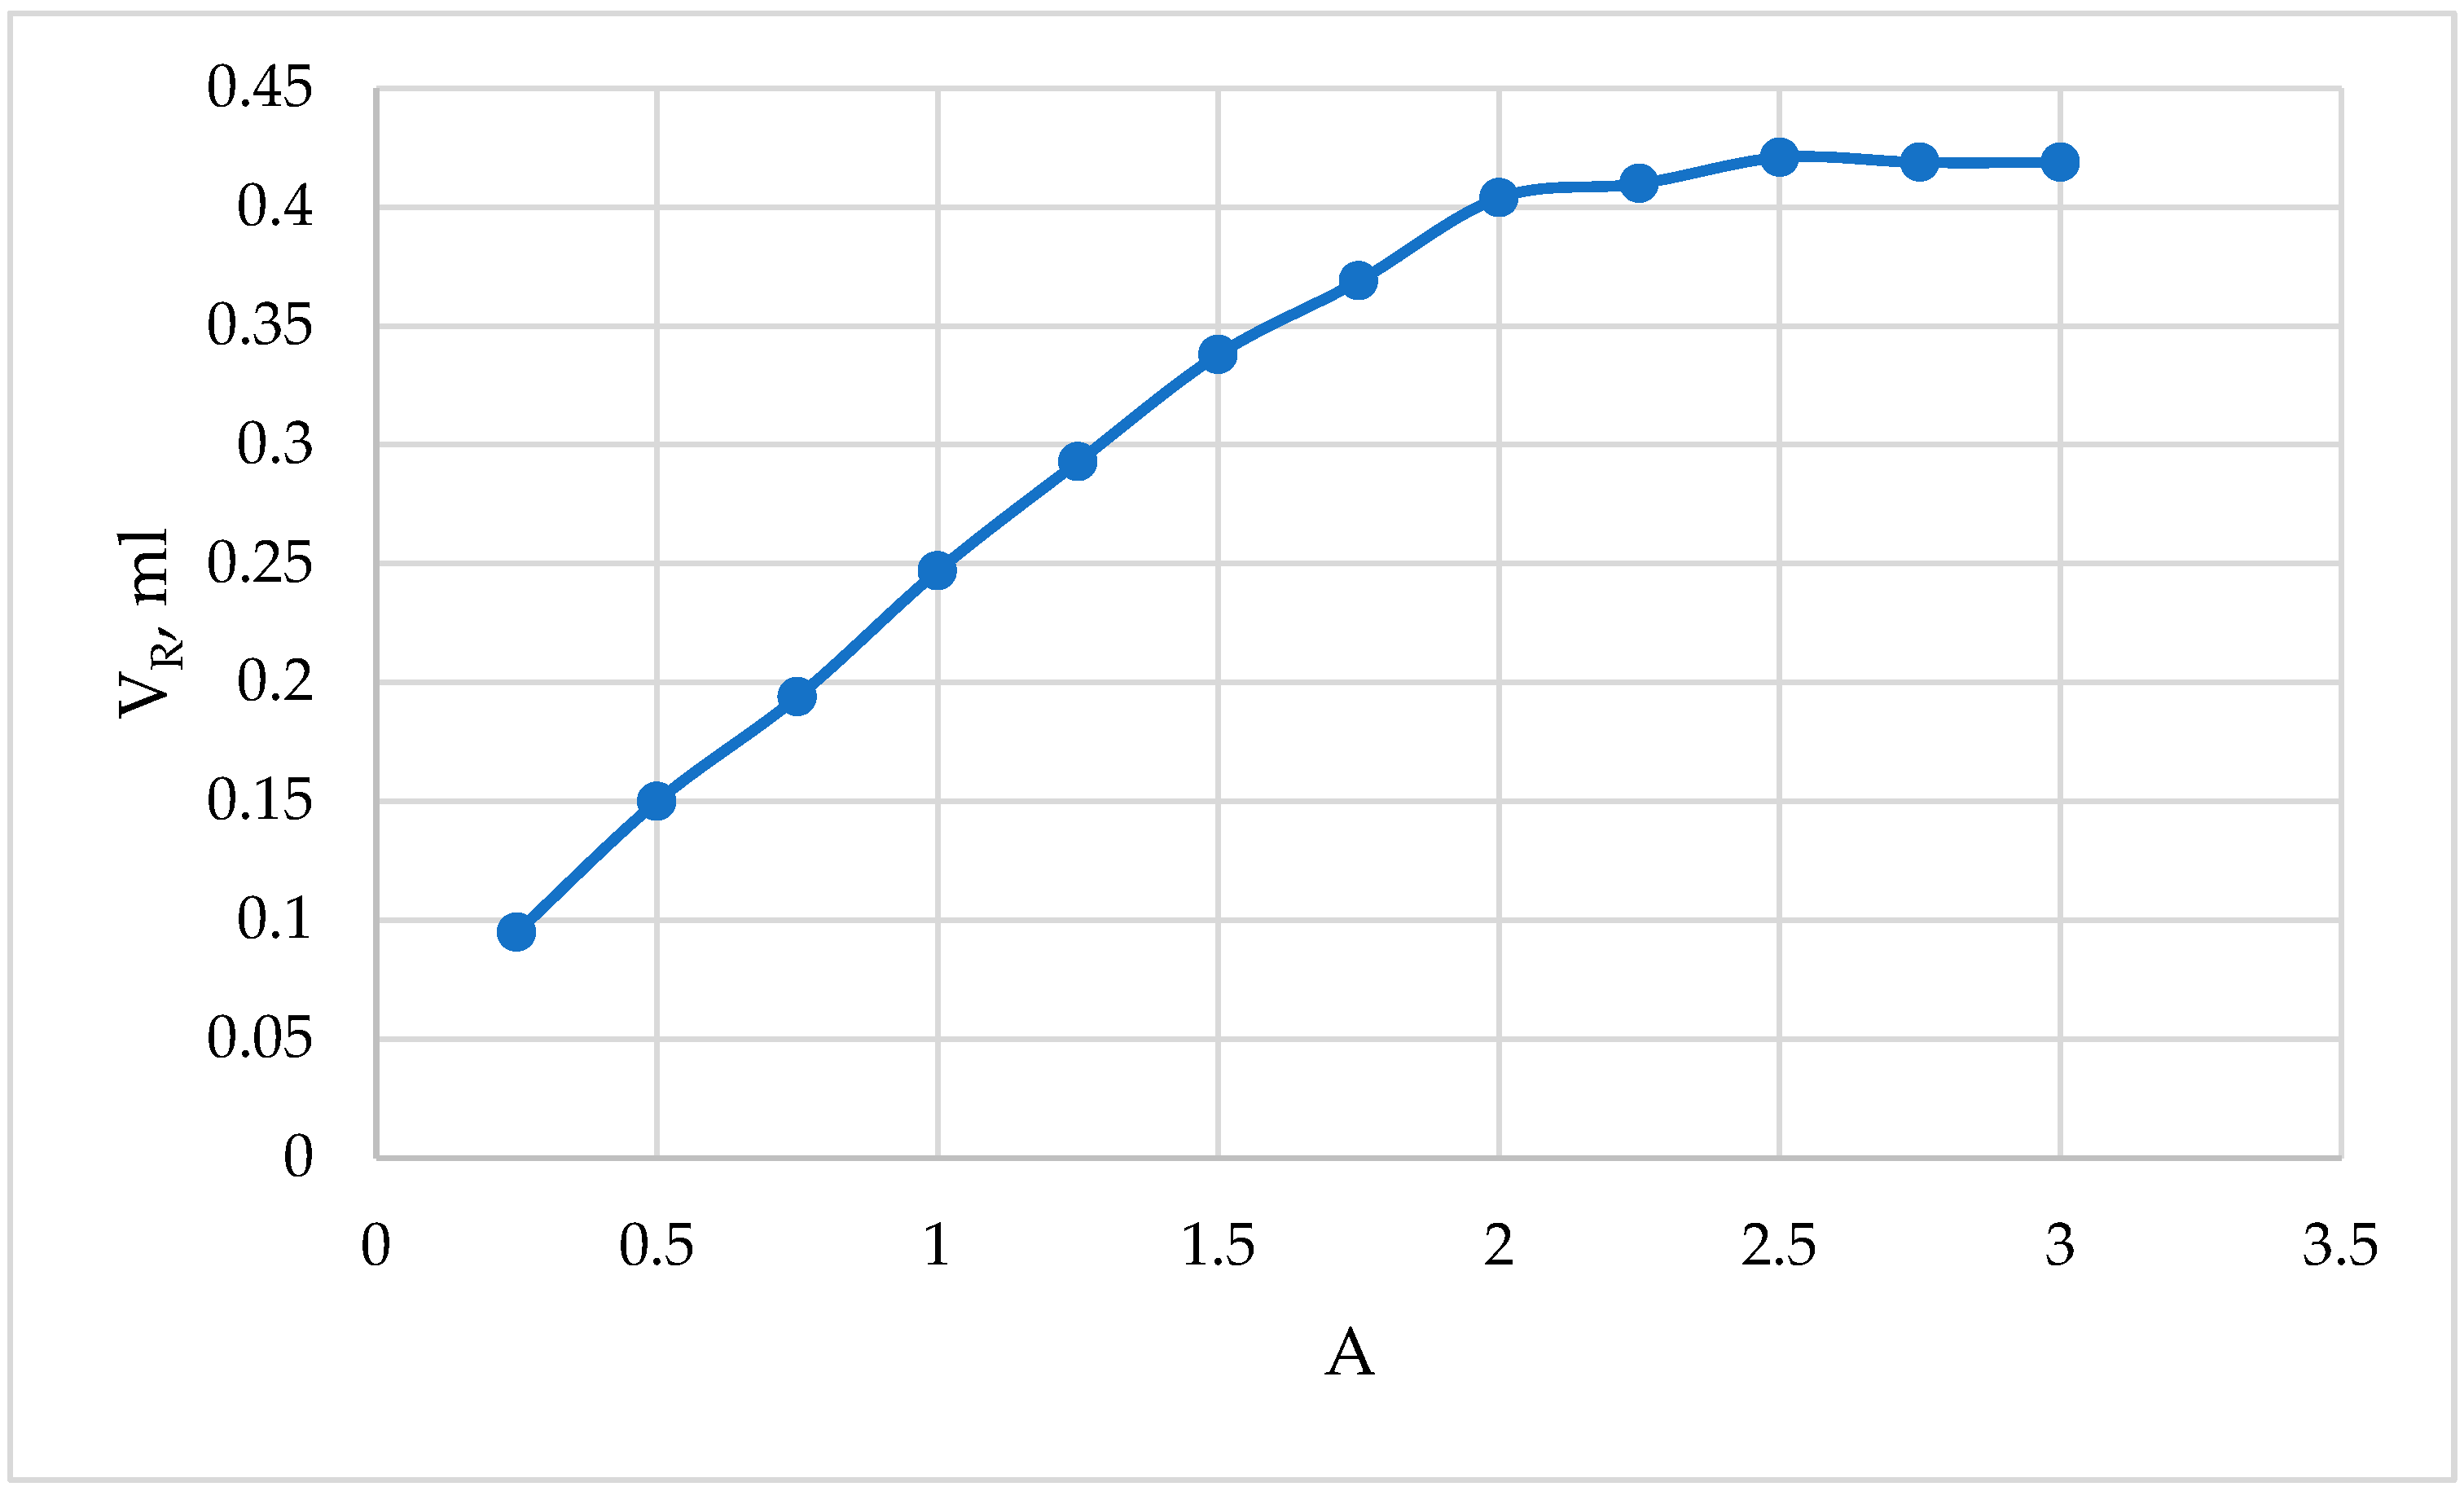
In practical studies, an excess of reagent is usually taken to fully bind the metal to the complex. For this purpose, to study the dependence of the optical density of the complex compound on the amount of added reagent, photometric solutions were prepared in 25 mL measuring flasks.
In total, 1.0 mL of a 20 µg/mL Fe(III) solution was put into 25 mL volumetric flasks with variable amounts from 0.20 to 4.00 mL of 0.1% aqueous solution of 2-naphthylcarboxymethylene citrate, 5.0 mL (pH = 11.80), and mixed with distilled water up to the mark of the flask. The optical density of the complex compound was measured in CPhC-3, Nf №4, l = 3.0   c m against the reference solution. The obtained results are presented in Table 6 and Figure 3.
The obtained results show that 2.5 mL of 0.1% reagent, i.e., 2.5 mL of aqueous solution of 2-napthylcarboxymethylene citrate, is sufficient for the complete binding of 20 μg/mL of iron(III) to the complex. In subsequent work, a 0.1% solution of the reagent was prepared and used in a volume of 2.5 mL.

2.9. Dependence of the Complex of Iron(III) with 2-Naphthylcarboxymethylene Citrate on the Amount of Elements (Subordination to the Bouguer–Lambert–Behr Law)

The behavior of the solution of the complex solution of iron(III) with 2-naphthylcarboxymethylene citrate was studied under selected optimal conditions.
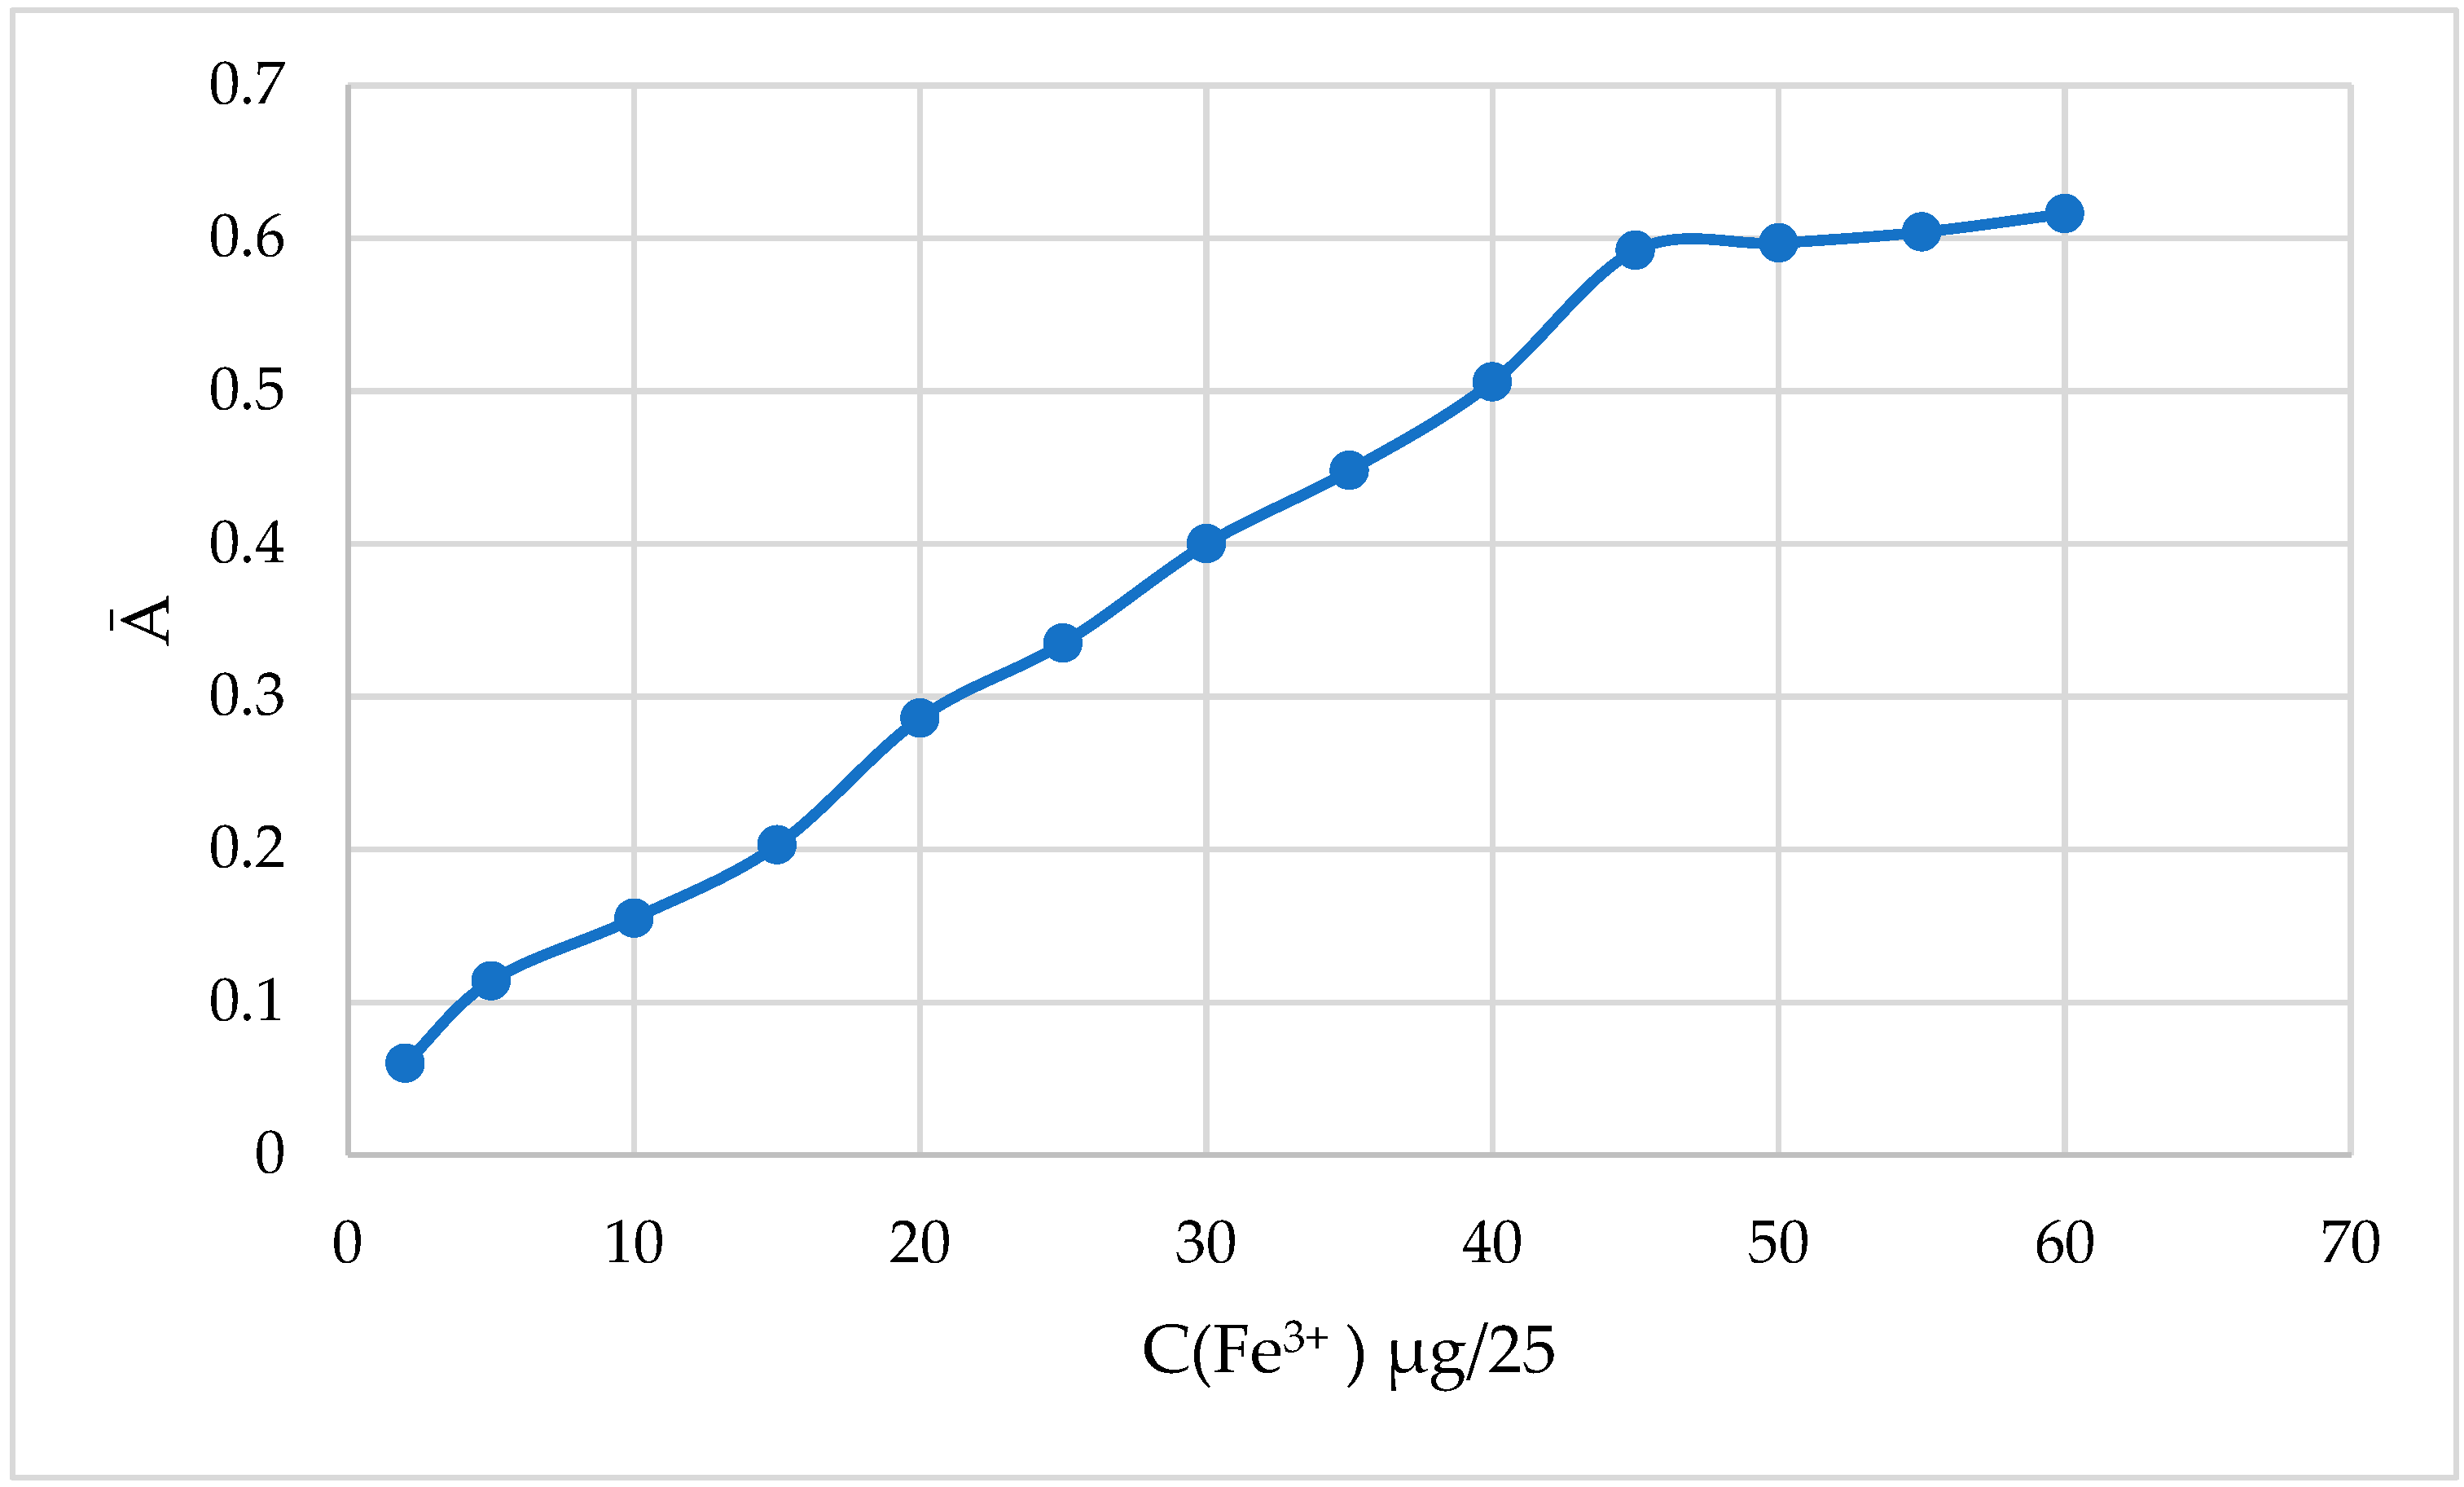
We filled 25 mL volumetric flasks was with varying amounts of a 20 μg/mL solution of Fe(III), 2.5 mL of a 0.1% 2-naphthylcarboxymethylene citrate solution, and 5.0 mL of a universal buffer solution of rN=4.52 up to the mark of the flask and diluted it with distilled water. By mixing the solutions, their optical density (max = 670 nm, = 3.0 cm) was measured against the reference solution. The obtained results are presented in Table 7 and Figure 4.
As can be seen from the obtained results, the field of obedience to Bouguer–Lambert–Behr law was observed in the range of 2–45 μg/25 mL in 25 mL solution. At higher concentrations, there was a deviation from the linear relationship, that is, the range from 2 μg to 45 μg/25 mL allows for the quantitative determination of Fe(III).
3. Results and Discussion

3.1. Spectral Description of the Iron(III) Complex with 2-Naphthylcarboxymethylene Citrate Reagent

The absorption spectra of the complex formed with 2-naphthylcarboxymethylene citrate reagent and iron(III) were obtained under selected optimal conditions.
  • Detection method:
In total, 1.0 mL of 45.0 µg/mL Fe(III) solution, 2.5 mL of 0.1% aqueous solution of 2-naphthylcarboxymethylene citrate reagent and 5.0 mL of pH 4.52 buffer were added to a 25 mL volumetric flask containing the solution, which was diluted with distilled water up to the mark of the flask and mixed. The absorption spectrum of the produced complex compound was measured in the spectrophotometer “SF-46” in a quartz cuvette with an absorption thickness of l = 1.0   c m compared to the reference solution. The absorption spectrum of the reagent was obtained against distilled water. The results are presented in Figure 5. According to the absorption spectrum presented in Figure 5, the maximum light absorption area of the complex of 2-napthylcarboxymethylene citrate reagent with iron(III) is located at λcomp = 675 nm; the maximum light absorption area of the 2-napthylcarboxymethylene citrate reagent was observed in the field of shorter spectral waves, i.e., at λreagent= 380 nm.
Using the value of the maximum optical density of the complex compound (in the area of λ = 675 nm), the apparent molar extinction coefficient ( ε ) was determined using the following formula:
ε = A / C l
Here, ε—is the molar extinction coefficient of light; C—is the iron(III) concentration (mol/l); —is the thickness of the absorbent layer (cm); and A—is the optical density of a complex compound measured relative to a reference solution.
The spectral characterization of the complex and reagent is depicted in Table 8 and Figure 6.
The Cendel sensitivity of the method is calculated with the formula:
C . S . = Q · l · 0.001 A · 25 = 45.0 · 1.0 · 0.001 0.345 · 25.0 = 0.0052   µ g / c m 2
The Cendel sensitivity was found to be 0.0052 µg/cm2.
The obtained results show that the reaction has a high contrast ( λ = 295   n m ) and sensitivity (C.S. = 5.2 × 10⁻³).

3.2. Determination of the Ratio of Component Moles of the Complex Formed by Iron(III) with 2-Naphthylcarboxymethylene Citrate Reagent

In the complex formed by iron(III) with 2-naphthylcarboxymethylene citrate reagent, the molar ratios of the components were determined via the method of isomolar series and Asmus’ straight line method.

3.2.1. Determination of the Composition of the Complex Using the Method of Isomolar Series

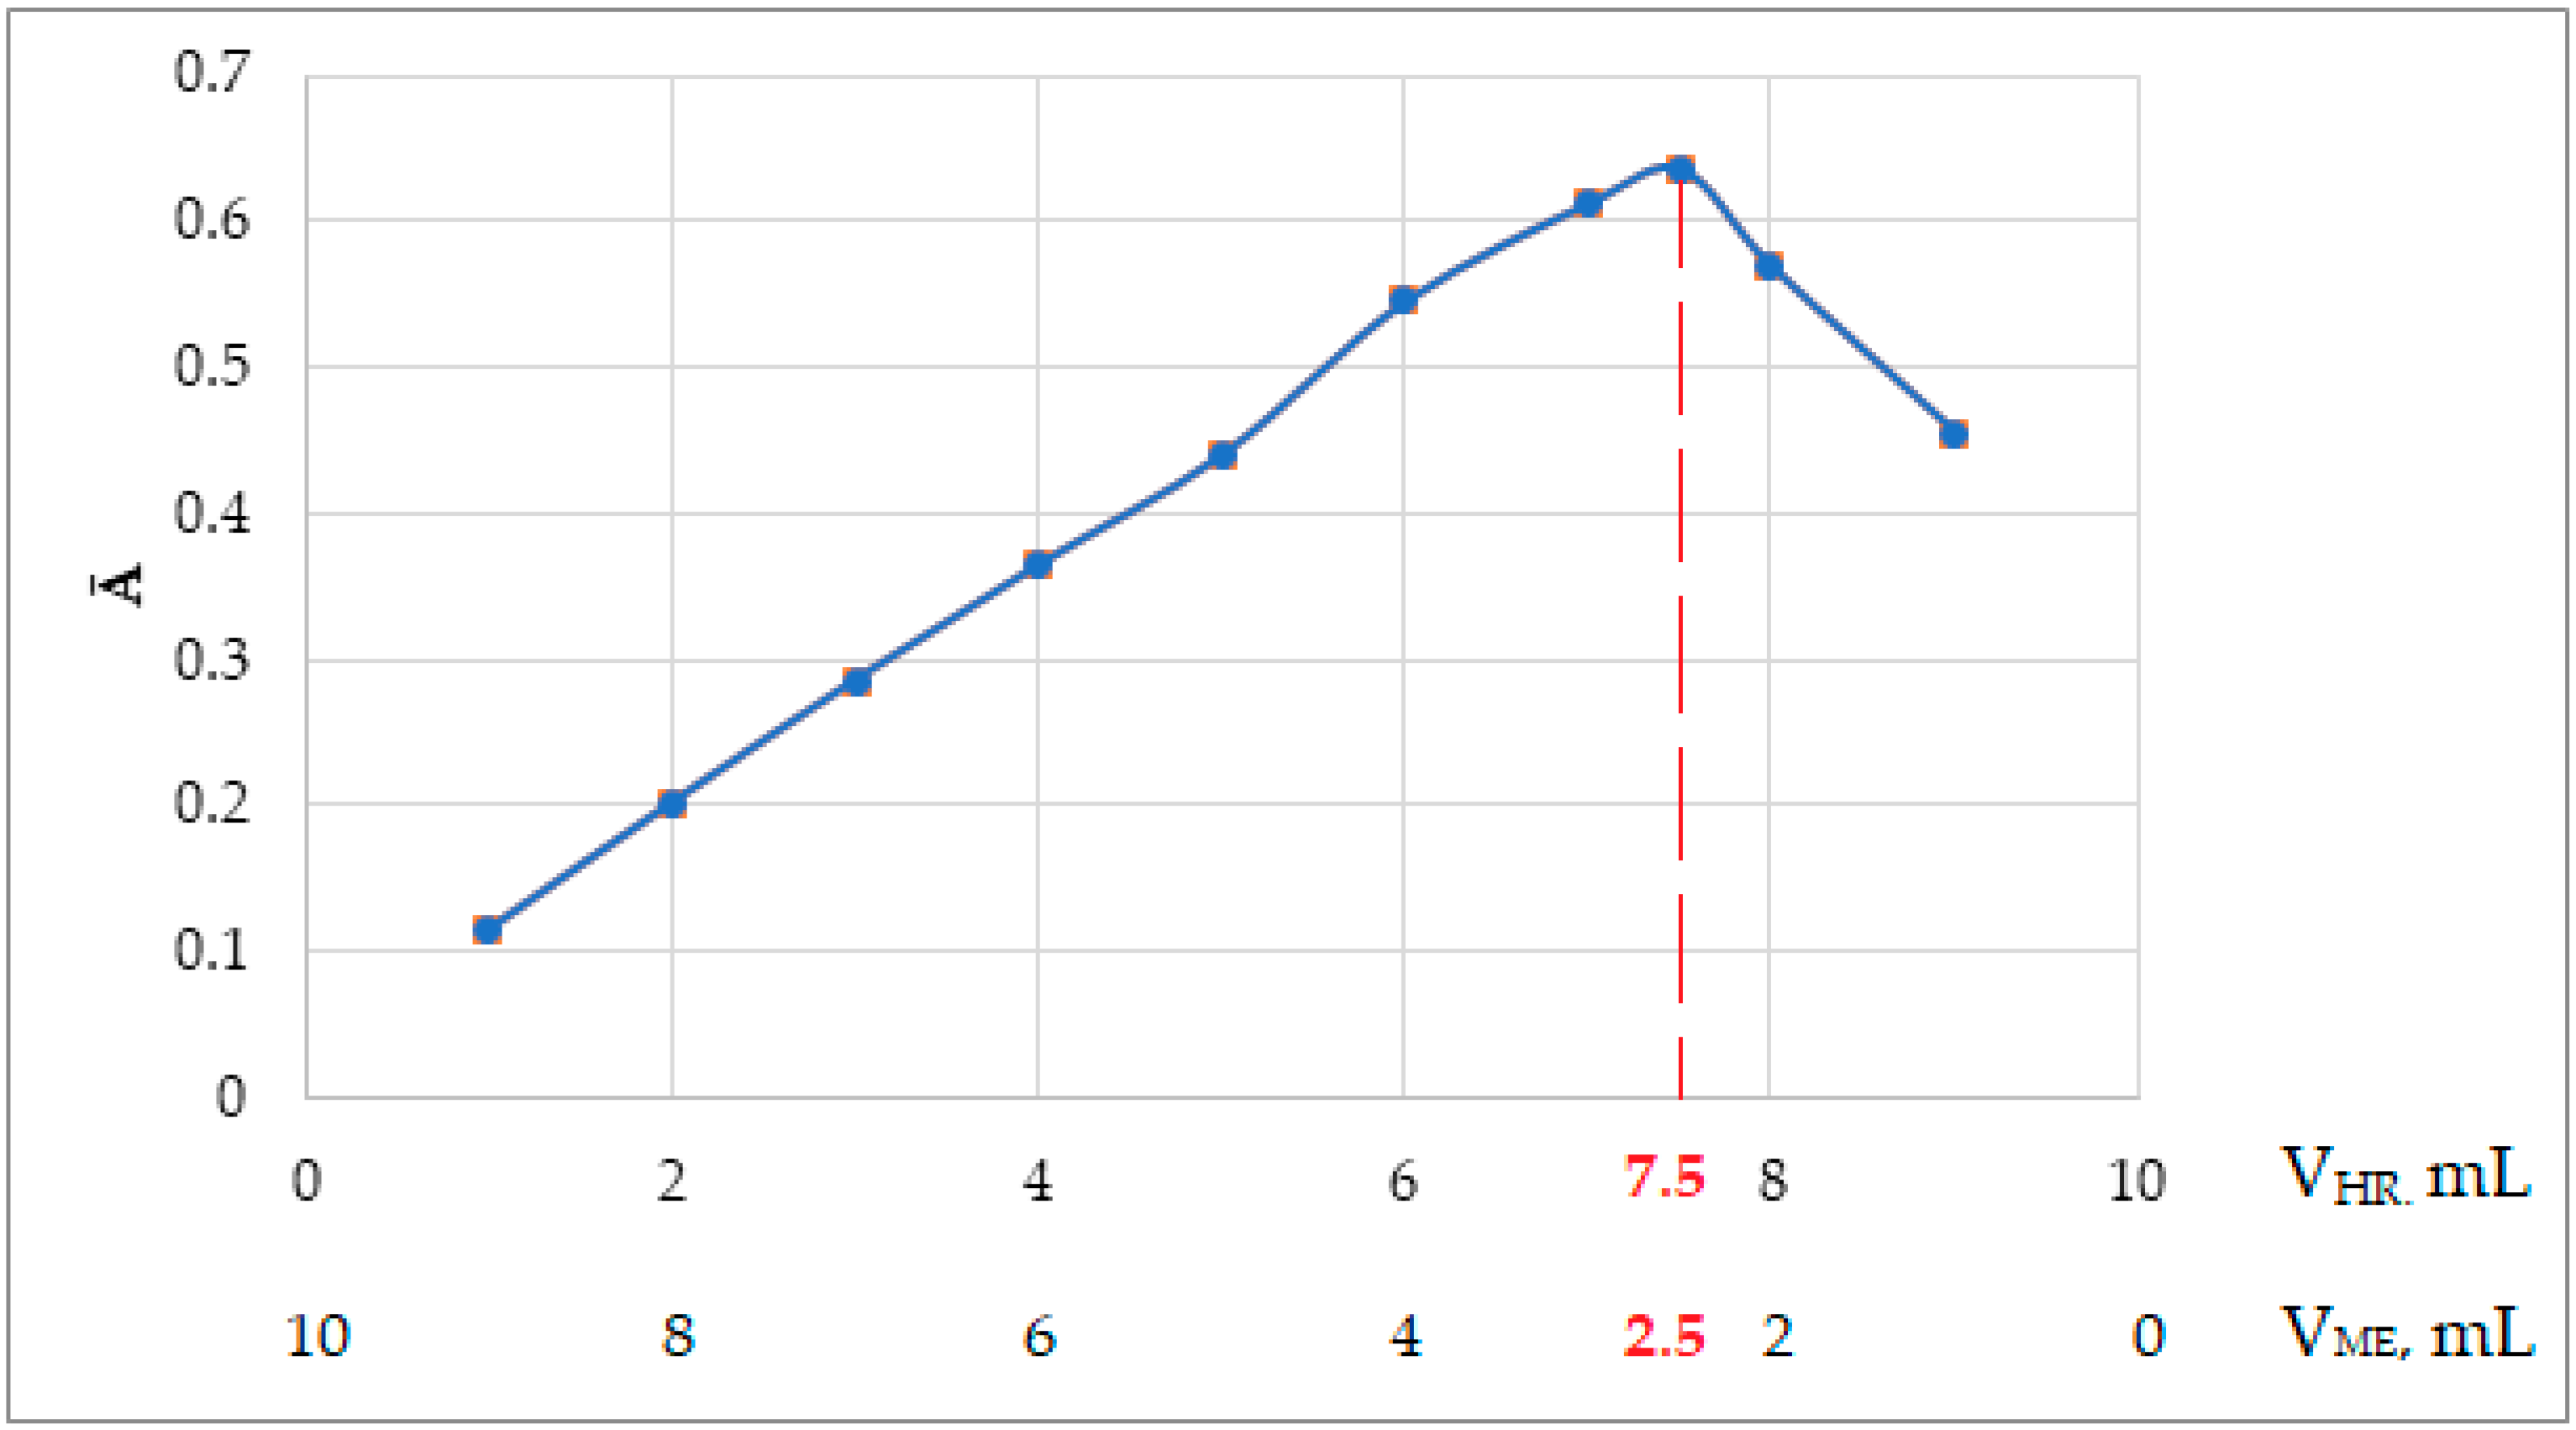
Equal concentration solutions of iron(III) and 2-naphthylcarboxymethylene citrate reagent were used to determine the molar ratio of iron(III) in the complex formed with 2-naphthylcarboxymethylene citrate reagent using the isomolar series method:
CFe3+ = CHR = 3.22 × 10⁻⁵ mol/L
A series of solutions was prepared in 25 mL volumetric flasks. To achieve this, add variable amounts of iron(III) solutions (from 9.0 to 1.0 mL) to each of them, then add variable amounts of 2-naphthylcarboxymethylene citrate reagent solution (from 1.0 mL to 9.0 mL) and pH. Add 5.0 mL of 11.80 universal buffer solution to each, dilute to the mark with distilled water, and mix. The optical density of the prepared solutions was measured in CPhC-3 in Nf № 8 in cuvettes with an absorption thickness of l = 3.0   cm compared to a reference solution. The obtained results are presented in Table 9 and Figure 6.
As can be seen from this graph, the composition of the complex formed by iron(III) and 2-naphthylcarboxymethylene citrate reagent corresponded to Fe:R = 1:3 molar ratio.

3.2.2. Determining the Composition of the Complex Using the Linear Asmus Method

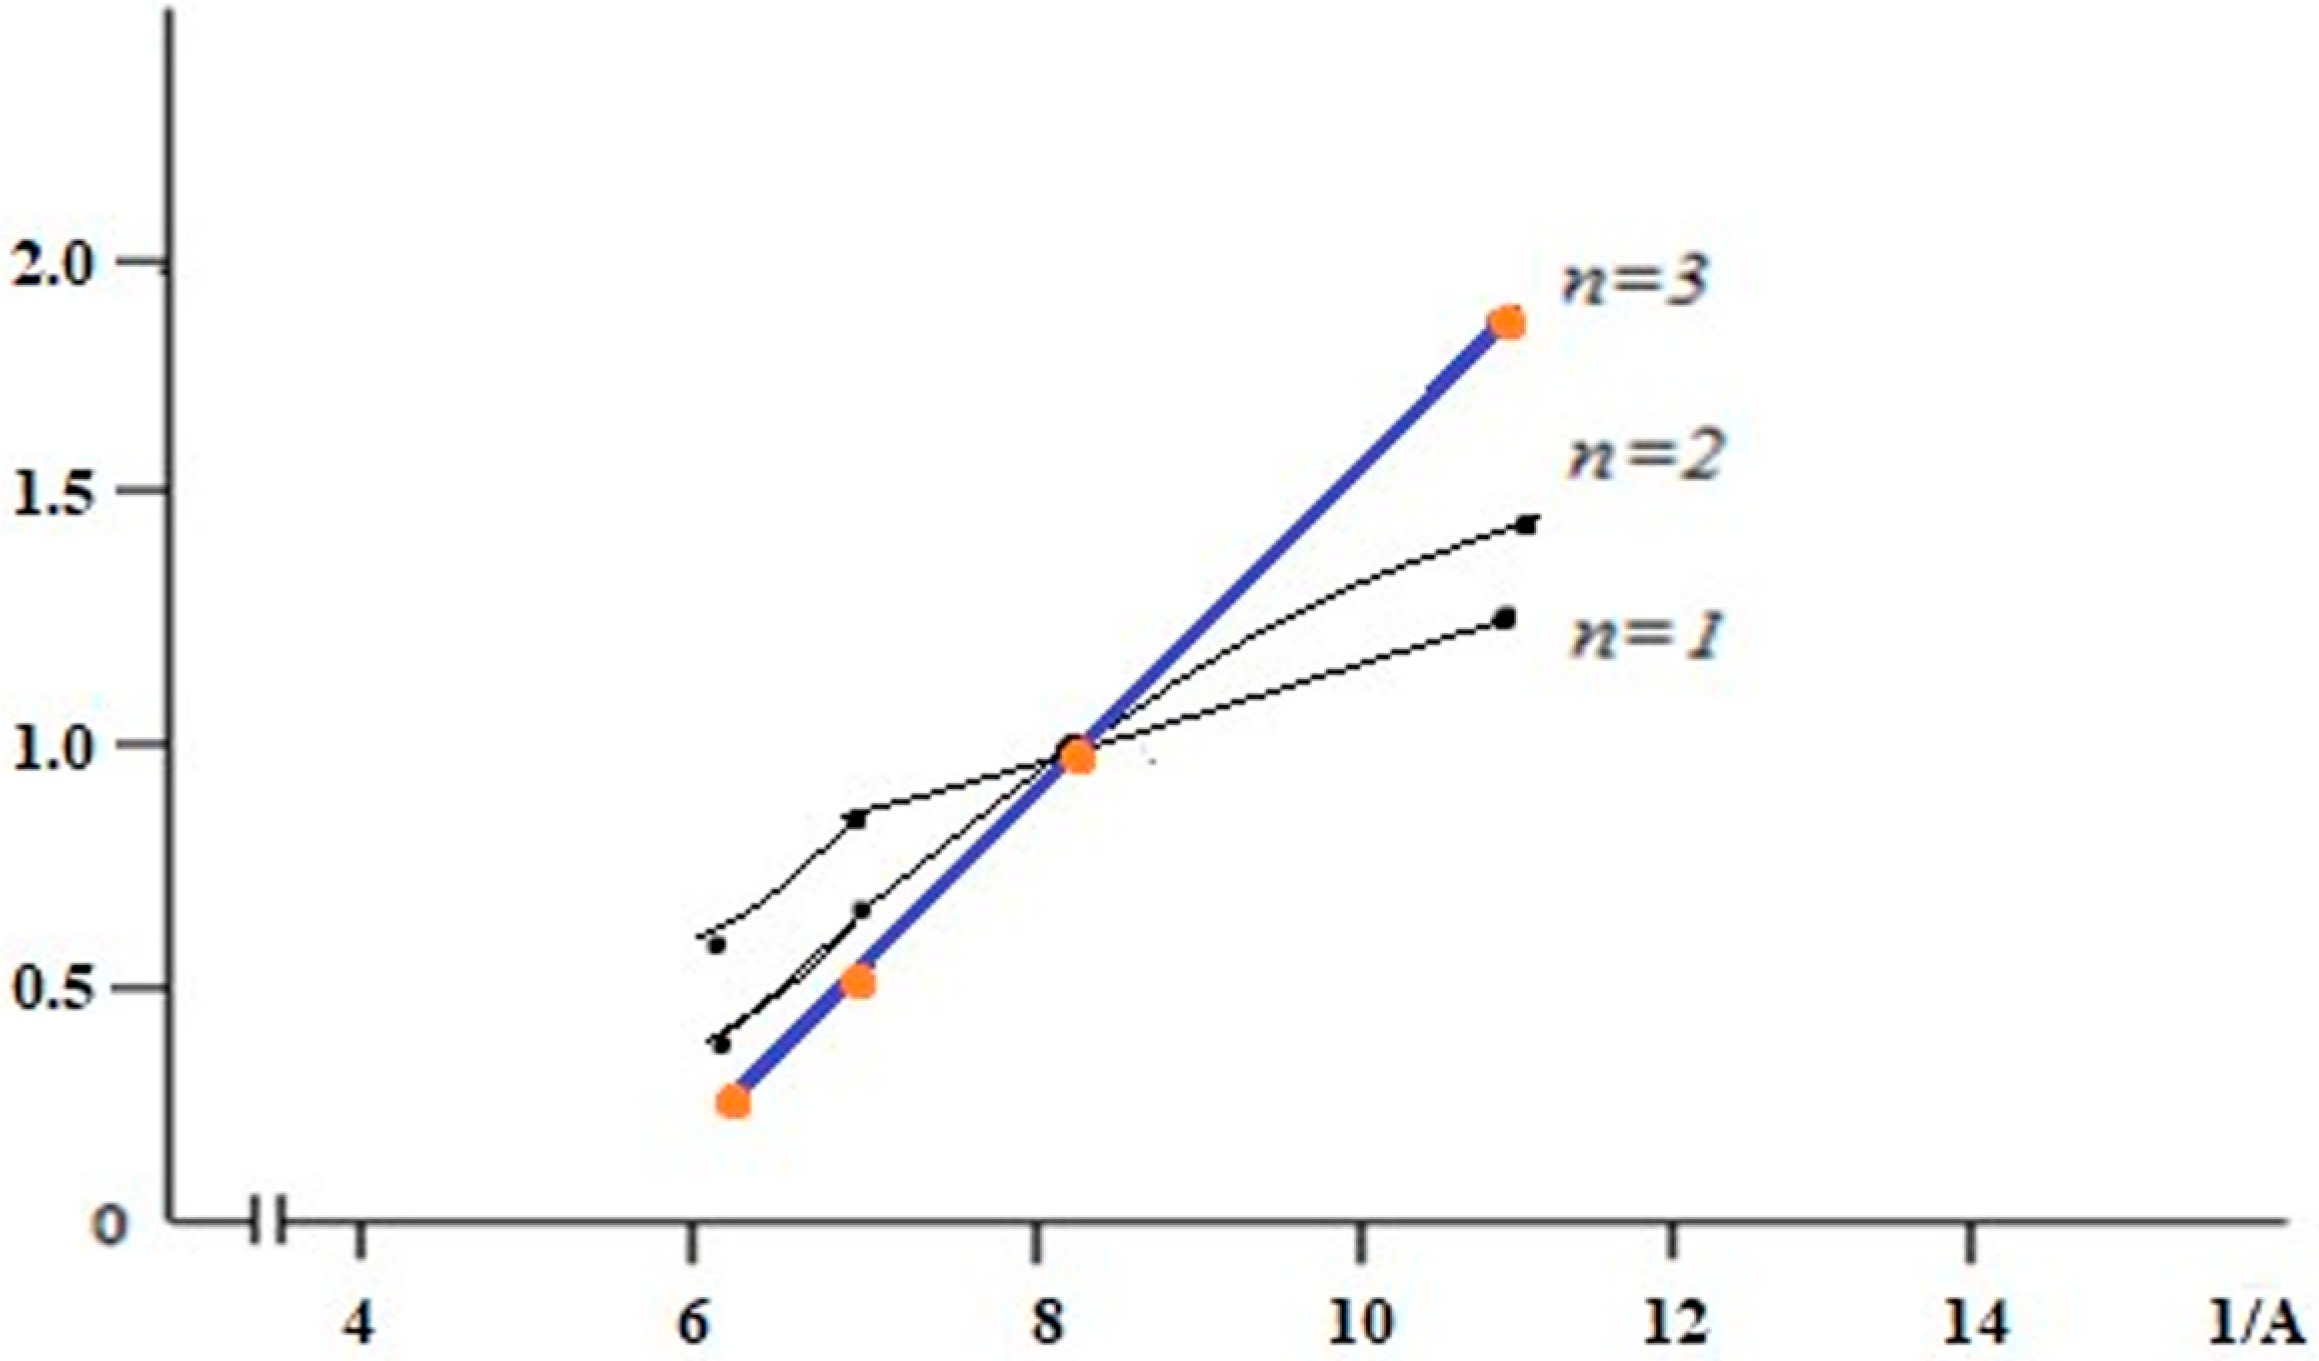
In order to graphically determine the stoichiometric ratios of the interacting components, a ( 1 / V ) n = l / A dependence graph was created. This relationship only represents a straight line for the true value of n.
Add 1.0 mL of an equal concentration of iron(III) solution to 25 mL volumetric flasks, add variable amounts of an aqueous solution of 2-naphthylcarboxymethylene citrate reagent and 5.0 mL each of a universal buffer with pH = 4.52, and add distilled water to the mark of the flask was diluted and mixed with. To obtain the optical densities of the prepared photometric solutions in CPhC-3 N.f. in №8, light absorption was measured against a reference solution in cuvettes with a thickness of l = 3.0 cm. The obtained results are presented in Table 10 and Figure 7.
The obtained results show that the straight line corresponded to the ratio of 1:3 moles. Therefore, both methods confirmed each other and showed that the composition was Fe:HR = 1:3.
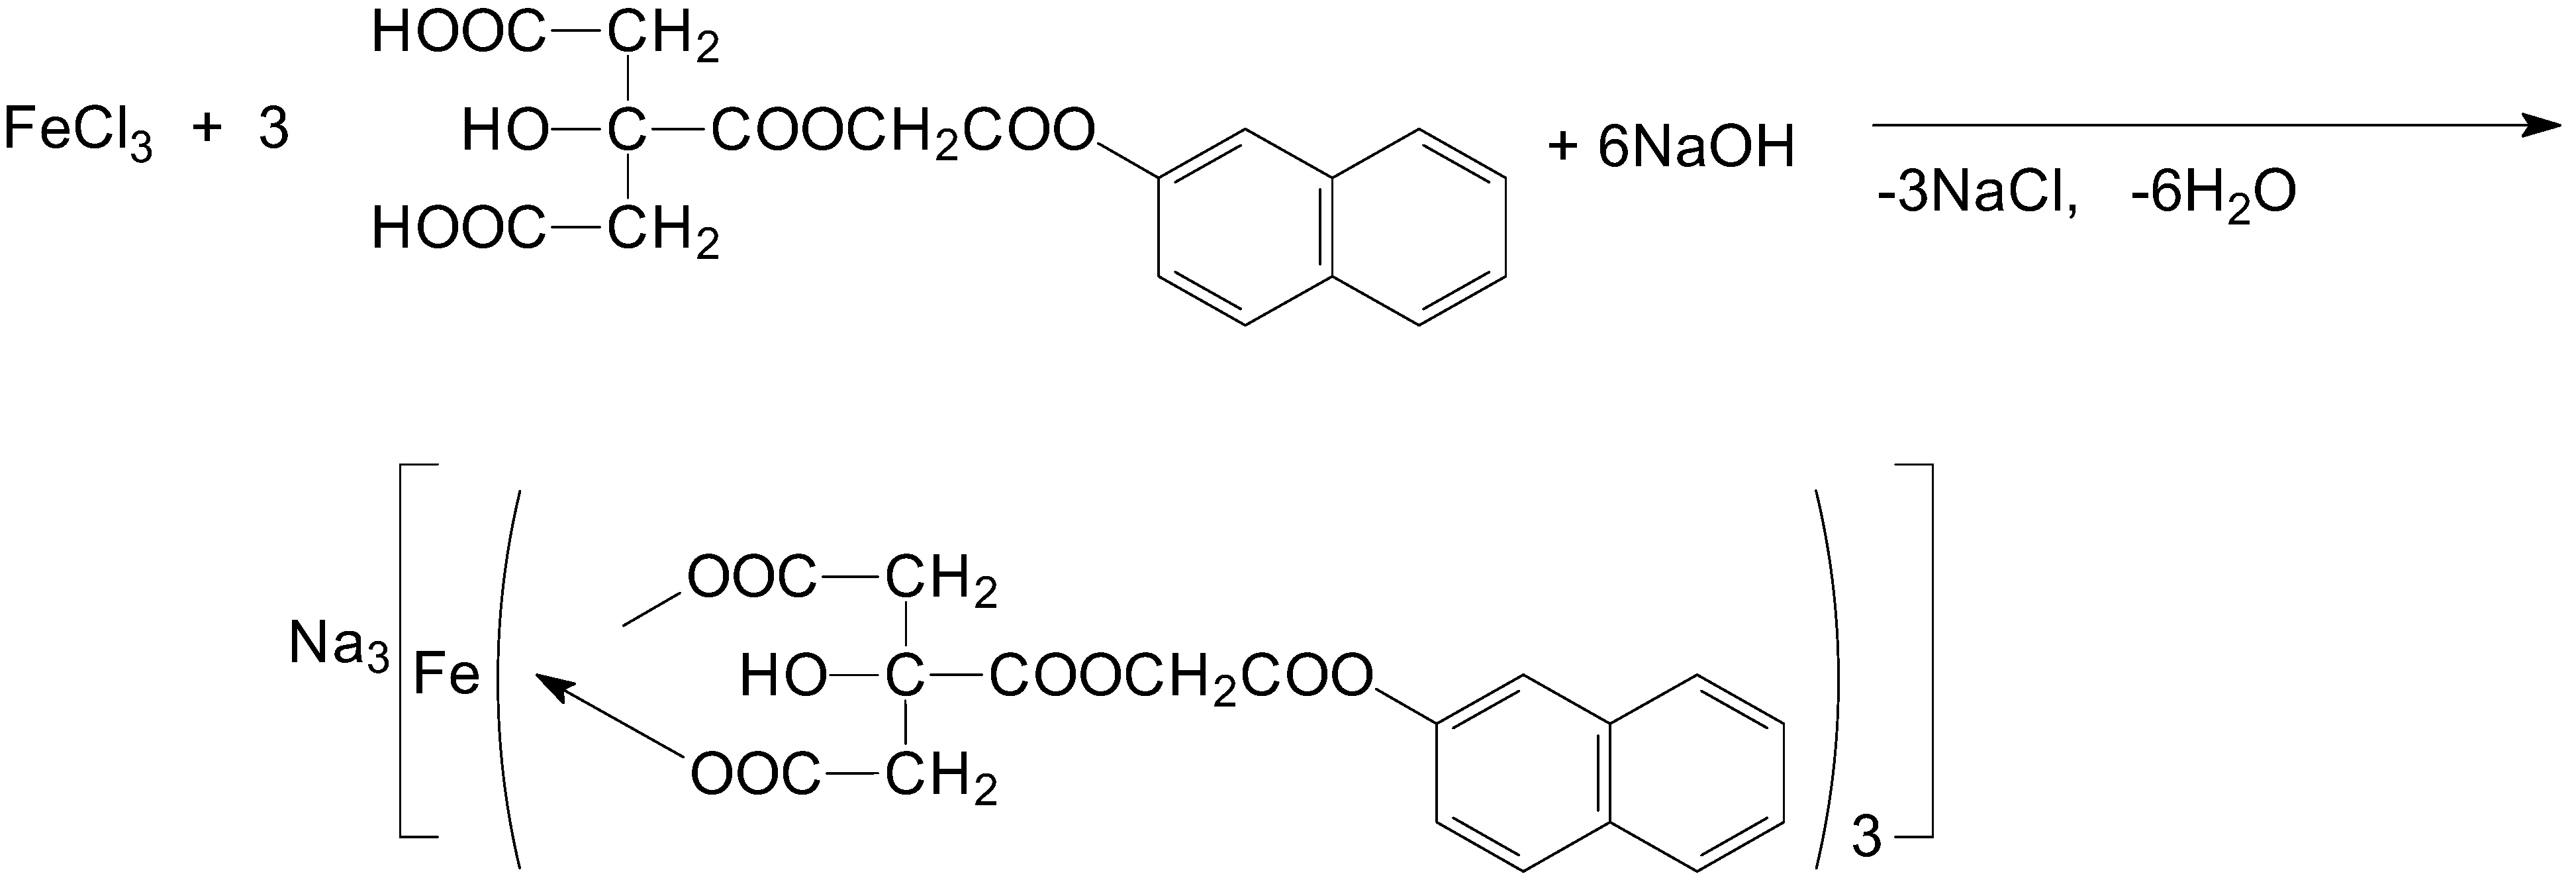
Based on the conclusions obtained from the above methods, the complex formation reaction occurs based on the reaction equation shown in Figure 8 [10,11,12].

4. Conclusions

This article proves that organic chemistry and analytical chemistry are inextricably linked. Studies on the photometric determination of a very small amount of Fe(III) ions with one of the new organic synthesis products A were carried out. It was proved that A can be used in the determination of Fe(III) ions. We are continuing our research to identify other d-metal ions similar to the Fe(III) ion using this method.

Author Contributions

Conceptualization, R.S.J. and A.U.C.; writing—original draft preparation, R.S.J. and N.T.Q.; visualization, R.S.J.; writing—review and editing, R.S.J. and A.U.C.; supervision, R.S.J. contributed to this paper. All authors have read and agreed to the published version of the manuscript.

Funding

This work was funded by the Agency of innovative development under the Ministry of higher education, science and innovation of the Republic of Uzbekistan (Contract No. 65).

Institutional Review Board Statement

Not applicable.

Informed Consent Statement

Not applicable.

Data Availability Statement

The data presented in this study are available on request from the corresponding author.

Acknowledgments

The authors wish to acknowledge Karshi State University, Karshi, Uzbekistan, Ministry of higher education, science and innovation of the Republic of Uzbekistan.

Conflicts of Interest

The authors declare no conflict of interest.

References

  1. Segoviano-Garfias, J.J.N.; Zanor, G.A.; Ávila-Ramos, F.; Bivián-Castro, E.Y.; Rubio-Jiménez, C.A. Spectrophotometric Determination of Formation Constants of Iron(III) Complexes with Several Ligands. Chemistry 2022, 4, 701–716. [Google Scholar] [CrossRef]
  2. Ueno, T.; Miyano, K.; Hamada, D.; Ono, H.; Fujinami, T.; Matsumoto, N.; Sunatsuki, Y. Abrupt Spin Transition and Chiral Hydrogen-Bonded One-Dimensional Structure of Iron(III) Complex [FeIII(Him)2(hapen)]SbF6 (Him = imidazole, H2hapen = N,N′-bis(2-hydroxyacetophenylidene)ethylenediamine). Magnetochemistry 2015, 1, 72–82. [Google Scholar] [CrossRef]
  3. Dobbin, L. Manganous Tartrate and Potassium Manganous Tartrate. J. Am. Chem. Soc. 1919, 41, 934–940. [Google Scholar] [CrossRef]
  4. Sadikova, S.B.; Abdushukurov, A.K.; Choriyev, A.U. Chloroacetylation of hydroquinone and its Esters with Lewis acids. Uni-vers. Chem. Biol. 2019, 5, 52–56. [Google Scholar]
  5. Choriev, A.U.; Jurayev, R.S.; Abdushukurov, A.K.; Abdullayev, M.G. Synthesis of 2-Izopropyl-5-methylphenylcarboxymethylen Tartrate. Eng. Proc. 2023, 37, 57. [Google Scholar] [CrossRef]
  6. Kass, M.; Ivaska, A. Spectrophotometric determination of iron (III) and total iron by sequential injection analysis technique. Talanta 2002, 58, 1131–1137. [Google Scholar] [CrossRef]
  7. Miranda, J.C.; Kamogawa, M.Y.; Reis, B.F. Development of a portable setup and a multicommuted flow analysis procedure for the photometric determination of Fe(III) and Fe(II) in fresh water. Sens. Actuators B Chem. 2015, 207, 811–818. [Google Scholar] [CrossRef]
  8. Karthikeyan, S.; Hashigaya, S.; Kajiya, T.; Hirata, S. Determination of trace amounts of phosphate by flow-injection photome-try. Anal. Bioanal. Chem. 2004, 378, 1842–1846. [Google Scholar] [CrossRef] [PubMed]
  9. Hanrahan, G.; Gledhill, M.; Fletcher, P.J.; Worsfold, P.J. High temporal resolution field monitoring of phosphate in the River Frome using flow injection with diode array detection. Anal. Chim. Acta 2001, 440, 55–62. [Google Scholar] [CrossRef]
  10. Mendham, J.; Denney, R.C.; Barnes, J.D.; Thomas, M. Statistics: Introduction to Chemometrics. In Vogel’s Textbook of Quantita-Tive Chemical Analysis, 6th ed.; Pearson Education: Singapore, 2002; p. 137. [Google Scholar]
  11. Christian, G.D. Analytical Chemistry, 4th ed.; Wiley: Chichester, UK, 1986. [Google Scholar]
  12. Harris, D.C. Quantitative Chemical Analysis; Freeman: San Fransisco, CA, USA, 1982. [Google Scholar]
Figure 1. Chemical formula of 2-naphthylcarboxymethylene citrate (3-hydroxy-3-((2-naphthalen-2-yloxy)-2-oxoethoxy) pentanedioic acid).
Engproc 48 00049 g001
Figure 2. Dependence of the optical density of the FeR complex on the light filter.
Engproc 48 00049 g002
Figure 3. Graph of dependence of the optical density of the complex compound (FeR) on the amount of added reagent. VR—Volume of reaction, ml; A—Optical density.
Engproc 48 00049 g003
Figure 4. The graph of optical density depending on the amount of added iron(III).
Engproc 48 00049 g004
Figure 5. Absorption spectrum of iron(III) complex with 2-naphthylcarboxymethylene citrate reagent.
Engproc 48 00049 g005
Figure 6. The curve for determining the composition of the complex compound (FeR) using the isomolar series method.
Engproc 48 00049 g006
Figure 7. Graph of determination of the composition of the complex of iron(III) with 2-naphthylcarboxymethylene citrate using Asmus’ straight line method. (n = 1 line is the graph of 1 V 1 = f ( 1 / A ) ; n = 2 line is the graph of 1 V 2 = f ( 1 / A ) ; n = 3 line is the graph of 1 V 3 = f ( 1 / A ) ).
Engproc 48 00049 g007
Figure 8. Fe:HR=1:3 ratio complex formation reaction equation.
Engproc 48 00049 g008
Table 1. Dependence of the optical density of the iron(III) complex with 2-naphthylcarboxymethylene citrate on the light filter (n = 3).

Nur Filtri
Colorλ, nmĀ
1Purple3150.000
2Blue3640.000
3Green–Blue4000.000
4Blue–Green4400.028
5Green4900.033
6Yellow–Green5400.037
7Yellow5900.042
8Red6700.153
9Dark Red7500.115
10Infrared8700.035
11Infrared980-
Table 2. Dependence of the optical density of the complex compound (FeR) on the solution medium pH (TFe3+ = 20 µg/mL, n = 3).
pH2.182.803.464.024.525.486.547.218.019.0410.5511.2711.8012.49
Ā000.0120.0130.0150.0170.0320.0350.0730.0880.110.1750.1830.163
Table 3. Choose the optimal buffer solution (n = 3).
The Name of the Buffer SolutionThe Composition of the Buffer SolutionpHĀtotal
Universal(H3PO4 + CH3COOH + H3BO3 + NaOH)11.800.183
Na- citrate(HCl+NaH2C6H5O7)11.800.046
Table 4. Stability of optical density of complex (FeR) compound with respect to time (λmax = 670 nm, = 3.0 cm, n = 3).
tmin15101520304050
Āaverage0.2750.2750.2740.2740.2730.2730.2730.272
tmin607090100120140160180
Āaverage0.2720.2710.2710.2700.2700.2700.2690.269
Table 5. The results of studying the pouring order of components (n = 3).
Casting OrderĀtotal
1buffer—reagent—iron—dist. water0.455
2buffer—reagent—dist. water—iron0.421
3buffer—iron—dist. water—reagent0.406
4buffer—iron—reagent—dist. water0.482
5reagent—iron—buffer—dist. water0.517
6reagent—buffer—iron—dist. water0.468
7reagent—dist. water—buffer—iron0.479
8iron—buffer—reagent—dist. water0.561
9iron—reagent—buffer—dist. water0.572
10iron—dist. water—buffer—reagent0.559
11iron—reagent—dist. water—buffer0.545
Table 6. Dependence of the optical density of the color complex of iron(III) with 2-naphthylcarboxymethylene citrate reagent on the amount of added reagent (n = 3).
VR, mL0.250.50.751.001.251.501.752.002.252.502.753.00
A0.0950.1500.1840.2470.2930.3380.3690.4040.4100.4210.4190.419
Table 7. Dependence of the optical density of the complex compound (FeR) on the amount of added iron(III) (obedience to the law of Ber). (CFe3+ = 20.0 µg/mL, = 3.0 cm, n = 3).
VFe3+ mLThe Amount of Iron(III). µgĀ
10.102.00.060
20.255.00.114
30.5010.00.155
40.7515.00.203
51.0020.00.286
61.2525.00.335
71.5030.00.400
81.7535.00.448
92.0040.00.506
102.2545.00.592
112.5050.00.597
122.7555.00.604
133.0060.00.616
Table 8. Spectral description of the complex of iron(III) with 2-naphthylcarboxymethylene citrate reagent and the reagent ( l = 3.0 cm, C(Fe3+) = 45 µg/mL).
Complex ColorpHλMeR, nmλHR, nmΔλC(Fe3+), μgCFe3+, mol/LĀSensitivity according to Cendel is μg/cm2
Green4.5267538029545.03.22 × 10−50.3450.0052
Table 9. The results of the study of the composition of the complex compound (FeR) using the isomolar series method. (CFe3+ = CHR = 3.22·10−5 M, = 3.0 cm, n = 3).
Obtained Fe(III), mLObtained VHR, mLBuffer Solution, mLĀ
19.001.005.000.115
28.002.005.000.202
37.003.005.000.286
46.004.005.000.365
55.005.005.000.440
64.006.005.000.545
73.007.005.000.612
82.507.505.000.635
92.008.005.000.568
101.009.005.000.455
Table 10. Determination of the composition of iron(III) complex formed with 2-naphthylcarboxymethylene citrate reagent using Asmus’ straight line method. (CFe3+=CHR=3.22 × 10⁻⁵ M, = 3.0 cm, n = 3).
VHR, mLĀ 1 A 1 V 1 V 2 1 V 3
10.20.06050.005.025.0125.0
20.40.12124.792.56.2515.63
30.60.19015.801.672.784.53
40.80.27410.951.251.561.95
51.00.3698.131.001.001.00
61.20.4007.500.830.690.57
71.40.4107.320.710.510.36
81.60.4946.070.630.390.25
91.80.5355.600.560.310.17
102.00.5705.260.50.250.125
Disclaimer/Publisher’s Note: The statements, opinions and data contained in all publications are solely those of the individual author(s) and contributor(s) and not of MDPI and/or the editor(s). MDPI and/or the editor(s) disclaim responsibility for any injury to people or property resulting from any ideas, methods, instructions or products referred to in the content.